 Sandhya Tyagi1
 Shailendra Kumar Jha2*
 Anuj Kumar3
 Gautam Saripalli4
 Ramesh Bhurta2Deepak T. Hurali2
 Lekshmy Sathee1
 Niharika Mallick2
 Reyazul Rouf Mir5
 Viswanathan Chinnusamy1
 Vinod2*
- 1Division of Plant Physiology, ICAR-Indian Agricultural Research Institute, New Delhi, India
- 2Division of Genetics, ICAR-Indian Agricultural Research Institute, New Delhi, India
- 3Centre for Agricultural Bioinformatics (CABin), Indian Agricultural Statistics Research Institute, New Delhi, India
- 4Department of Plant Science and Landscape Architecture, University of Maryland, College Park, MD, United States
- 5Division of Genetics and Plant Breeding, Faculty of Agriculture (FoA), Wadura Campus, Srinagar, India
Cyclophilins (CYPs) are a group of highly conserved proteins involved in host-pathogen interactions in diverse plant species. However, the role of CYPs during disease resistance in wheat remains largely elusive. In the present study, the systematic genome-wide survey revealed a set of 81 TaCYP genes from three subfamilies (GI, GII, and GIII) distributed on all 21 wheat chromosomes. The gene structures of TaCYP members were found to be highly variable, with 1–14 exons/introns and 15 conserved motifs. A network of miRNA targets with TaCYPs demonstrated that TaCYPs were targeted by multiple miRNAs and vice versa. Expression profiling was done in leaf rust susceptible Chinese spring (CS) and the CS-Ae. Umbellulata derived resistant IL “Transfer (TR). Three homoeologous TaCYP genes (TaCYP24, TaCYP31, and TaCYP36) showed high expression and three homoeologous TaCYP genes (TaCYP44, TaCYP49, and TaCYP54) showed low expression in TR relative to Chinese Spring. Most of the other TaCYPs showed comparable expression changes (down- or upregulation) in both contrasting TR and CS. Expression of 16 TaCYPs showed significant association (p < 0.05) with superoxide radical and hydrogen peroxide abundance, suggesting the role of TaCYPs in downstream signaling processes during wheat-leaf rust interaction. The differentially expressing TaCYPs may be potential targets for future validation using transgenic (overexpression, RNAi or CRISPR-CAS) approaches and for the development of leaf rust-resistant wheat genotypes.
1 Introduction
Bread wheat (Triticum aestivum L.) is considered as one of the most important cereal crops in the world. Various biotic and abiotic stresses severely hamper the production and productivity of the wheat crop. Among the biotic stresses, rusts constitute the most critical biotic stress. Out of three rusts affecting the wheat crop, leaf rust caused by Puccinia triticina L. is the most prevalent in almost all wheat-growing regions. Approximately 50% yield reduction has been reported when conditions are favourable for leaf rust infection (Huerta-Espino et al., 2011). The loss caused by leaf rust can be prevented by deploying resistant wheat cultivars possessing leaf rust resistance genes (Qiu et al., 2020). To date, ∼82 genes have been designated for leaf rust resistance in wheat (Mcintosh et al., 2014, 2017; Qiu et al., 2020; Kirti et al., 2020; Bariana et al., 2022), of which seven Lr genes have also been cloned, including seedling resistance (SR) genes such as Lr1 (Cloutier et al., 2007), Lr10 (Feuillet et al., 2003), Lr21 (Huang et al., 2003), Lr22a (Thind et al., 2017) and Lr42 (Lin et al., 2022) and adult plant resistance genes (APRs) such as Lr34 (Krattinger et al., 2019) and Lr67 (Moore et al., 2015). Cyclophilins (CYPs) are a group of highly conserved proteins crucial in pathogenesis (A. Singh et al., 2017). The CYPs, along with FKBPs (FK506-binding proteins) (Harding et al., 1989) and the parvulins family (Gething, 1997) proteins, are members of the immunophilins group that have peptidylprolyl cis-trans activity (PPIase). In plants, the differential gene expression of CYPs has been observed in response to biotic stresses such as viral and fungal infection (Pandian et al., 2020; Olejnik et al., 2021) and abiotic stresses like drought, salinity, and temperature (Sharma and Taganna, 2020; Godoy et al., 2000; Marivet et al., 1992; Romano et al., 2004). Additionally, hormones such as salicylic acid (Marivet et al., 1992), jasmonic acid, methyl jasmonate (Wasternack and Strnad, 2016; Yan et al., 2016), abscisic acid (Godoy et al., 2000), and auxin (Bari & Jones, 2009), which are also known to be involved in signaling pathways during plant–pathogen interactions, have been reported to be involved in the regulation of CYP genes. For instance, in soybean, the expression of the CYP gene CYP82A3 was found to be regulated by MeJA, which was also induced by different fungal infections (Yan et al., 2016).
Furthermore, the role of CYP gene family is well known in signaling pathways during plant–pathogen interactions, including M. oryzae (Wilson and Talbot, 2009), Phytophthora (Gan et al., 2009), and Leptosphaeria maculans (K. Singh et al., 2014), and during the Arabidopsis-P. syringeae interaction (Coaker et al., 2005). In Arabidopsis, the CYP gene was activates the bacterial effector AvrRpt2, leading to RPS2-mediated disease resistance against Pseudomonas syringae (Coaker et al., 2005).
The availability of complete genome sequencing data in public databases has paved the way for systematically identifying and annotating ∼16,000 CYP gene sequences in plant species (Gan et al., 2009; Pemberton & Kay, 2005; H. Singh et al., 2019; K. Singh et al., 2014). The CYP gene family has been characterized in Arabidopsis thaliana, Oryza sativa, Glycine max, Zea mays, Solanum lycopersicum, and Gossypium hirsutum (Gasser et al., 1990; Romano et al., 2004; Ahn et al., 2010; Mainali et al., 2014; Chen et al., 2019; Wang et al., 2020). In addition, several CYP genes involved in resistance against different biotic stresses have been reported in plants, including 1) Nicotiana benthamiana: overexpression of GmCYP82A3 provides resistance to the black shank (Phytophthora parasite) and gray mold (Botrytis cinerea), 2) Capsicum annum: CaCYP1 showed involvement in the hypersensitive response (HR) once plants were infected with Xanthomonas axonoposis, and 3) Arabidopsis: AtCYP76C2 associated with hypersensitive cell death during infection with Pseudomonas syringae. Additionally, in wheat, a CYP member encoding for CYP709C3v2 was found to be upregulated in the resistant genotype during Fusarium head blight infection caused by Fusarium graminearum, thereby indicating the role of CYP gene members during biotic stress tolerance in wheat.
The present work was planned to identify and characterize the CYP gene family in wheat during wheat-leaf rust interactions. Detailed in silico analysis was also conducted at the protein level, and essential motifs were identified that might be involved during resistance against leaf rust in wheat. The correlation of qRT-PCR expression data with reactive oxygen species (ROS) abundance, suggests a prominent role of TaCYPs in downstream signaling processes during wheat-leaf rust interaction.
2 Materials and methods
2.1 Genome-wide scanning of CYP genes in wheat
To identify the potential candidate CYP genes in the wheat genome, the protein sequences of CYP candidate genes from Arabidopsis, rice, and soybean were retrieved from TAIR (https://www.arabidopsis.org/index.jsp), The Rice Annotation Project database rap-db (https://rapdb.dna.affrc.go.jp), and PlantGDB database (http://www.plantgdb.org/) for Glycine max, respectively, were used as queries to find the homologs in wheat. Amino acid sequences of the previously reported A. thaliana cyclophilin-like peptidylprolyl cis-trans isomerase genes AtCYP18-3 (Coaker et al., 2005) and AtCYP19-1 (Pogorelko et al., 2014) were used as queries in a BLASTp algorithm to identify all the potential wheat CYP genes (TaCYPs) containing single or multiple domains. The BLASTp search was performed against the T. aestivum IWGSC (https://www.wheatgenome.org/) (protein) data, available on EnsemblPlants release 47 (https://plants.ensembl.org/index.html). All the protein sequences with an E-value below 1.0 and showing >85% similarity were retrieved. For the sequences with more than one transcripts, the primary transcript with the longest length was preferred as the emissary of genes (Hurali et al., 2021; Bhurta et al., 2022). The two databases, InterPro (Finn et al., 2017) and PROSITE (Sigrist et al., 2012), were used to identify the specific domains in all three recognized TaCYP proteins. The genomic sequences, DNA sequences, and coding domain sequences (CDSs) of all the identified TaCYP genes were downloaded from the EnsemblPlants release 47 (https://plants.ensembl.org/index.html) data set using the assigned Ensemble transcripts Ids.
2.2 Physical mapping of TaCYP genes on wheat chromosomes
All the identified TaCYP genes were physically mapped onto seven homoeologous chromosome groups using information available in public repositories, including IWGSC-URGI (https://wheat-urgi.versailles.inra.fr/) and EnsemblPlants release 47 (https://plants.ensembl.org/index.html).
2.3 Gene structure boundary prediction and conserved motif distribution
DNA sequences and coding domain sequences (CDSs) of all the identified TaCYP genes were used for gene structure analysis. A tool, Gene Structure Display Server (Hu et al., 2015), was used to predict the gene structure and exon–intron boundaries. Full-length protein sequences of predicted TaCYP genes were analyzed by MEME version 5.0.2 software (Bailey et al., 2009, 2015) to determine conserved motifs at the following parameters: 15 as the maximum number of motifs, with a restricted motif width of a minimum of 6 aa and maximum of 50 aa, while the other settings were default (Bhurta et al., 2022).
2.4 Phylogenetic analysis
Phylogenetic analysis was conducted to study the evolutionary relationship among the identified TaCYPs and the earlier CYPs reported in other plants. For this purpose, the CYP protein sequences of Arabidopsis (25 CYPs), rice (16 CYPs), and soybean (28 CYPs) were downloaded from TAIR (https://www.arabidopsis.org/), rap-db (https://rapdb.dna.affrc.go.jp/) and EnsemblPlants (https://plants.ensembl.org/index.html), respectively. Multiple sequence alignment (MSA) of amino acid sequences was performed using the ClustalW tool (http://ebi.ac.uk/Tools/msa/clustalW2). Evolutionary distances were measured using Molecular Evolutionary Genetics Analysis (MEGA 6.0). A phylogenetic tree was constructed using the neighbor-joining (NJ) algorithm with the substitution model, uniform rates, and pairwise deletion (Saitou and Nei, 1987), with bootstrap values for 1,000 iterations calculated and expressed as percentages (Felsenstein, 1985).
2.5 Identification of miRNAs and network analysis of miRNAs and TaCYP genes
The full-length genomic sequences of all the identified TaCYPs were mined as an input on the homology search-based psRNATarget server (Dai and Zhao, 2011) to determine the miRNAs targeting the TaCYPs with a selection of updated wheat miRNA libraries in the background. The potential miRNAs targeting the TaCYPs were identified with the following parameters embedded: maximum expectation: 2.0, length for complementarity scoring (HSP size): 19, penalty G:U pairs: 0.5, seed region: 2–13 nt, and extra weight in seed region: 1.5 (Kumar et al., 2019; Hurali et al., 2021; Bhurta et al., 2022). A desktop app of Cytoscape 3.5.1 (Shannon et al., 2003) was used to render the interaction network of miRNAs targeting TaCYP genes.
2.6 Physiochemical properties and subcellular localization of TaCYP genes
The amino acid sequences of all the selected TaCYP genes were screened for their physiochemical properties and subcellular localization. An automated ProtParam server available on the Expasy website (https://web.expasy.org/protparam/) (Gasteiger et al., 2005) was used to calculate the different physiochemical properties, including average residue weight (g/mol), charge, isoelectric point (IP), molecular weight (Mw), theoretical prediction of PI, instability index (II), aliphatic index (AI), grand average of hydropathicity (GRAVY) and stability. The subcellular localization of the identified TaCYP proteins was predicted by BUSCA (http://busca.biocomp.unibo.it) (Savojardo et al., 2018).
2.7 In silico tissue-specific expression analysis
Transcriptome expression data from expVIP (http://www.wheat-expression.com/) for two biotic stress treatments (stripe rust and powdery mildew) were used to compare the relative expression of the TaCYPs. A heatmap was generated using a wheat expression browser powered by expVIP (http://www.wheat-expression.com).
2.8 Plant materials
2.8.1 Wheat genotypes
The leaf rust-susceptible wheat genotype “Chinese spring (CS)” and the CS-Ae. Umbellulata derived resistant IL “Transfer (Sears, 1956)” were used for differential gene expression analysis using qRT–PCR. TR wheat has a dominant seedling leaf rust resistance gene “Lr9.”
2.9 Pathogen
A single spore-derived inoculum of one of the most prevalent and virulent pathotypes, 77–5 (syn. 121R63–1) of P. triticina Eriks. was procured from Regional Station, Indian Institute of Wheat and Barley Research, Flowerdale, Shimla, India. The pathotype is avirulent against the seedling leaf rust resistance gene Lr9 carried by TR and was used for inoculating the seedlings of the two wheat genetic stocks.
2.10 Inoculation at the seedling stage and collection of leaf samples
Wheat seedlings of CS (susceptible line) and TR (resistant line) were sown and raised in growth chambers under standardized, controlled conditions at the National Phytotron Facility, Indian Agricultural Research Institute (IARI), New Delhi (Prabhu et al., 2012). Seedlings were inoculated using the method described by (Dhariwal et al., 2011) and incubated for 48 h in a humid chamber (23 ± 2°C temperature). Standard conditions were restored for the seedlings after incubation. Random leaf samples were collected from seedlings of the CS and TR wheat lines 1) before inoculation, i.e., at 0 HBI (Hours Before Inoculation, uninoculated control), and 2) after seedling inoculation (HAI), i.e., at 24 HAI and 72 HAI with leaf rust pathotype 77–5.
The leaves of the two genotypes (CS and TR) were sampled at 24 HAI and 72 HAI to quantify superoxide radicals (SOR) and hydrogen peroxide (H2O2) localisation following the methodology described earlier (Qiao et al., 2015; and Bhurta et al., 2022). The spectrophotometric assay method described by (Chaitanya and Naithani 1994) was used to quantify SOR in fresh leaf tissue. The amount of NBT (nitroblue tetrazolium chloride) that was reduced by SOR was measured. Leaf samples (1 g) were ground in 0.2 M phosphate buffer (precooled, pH 7.2) and centrifuged at 10,000 g for 30 min at 4°C. The supernatant was collected, and an assay mixture was prepared (0.1 mM EDTA, 0.075 mM NBT, 13.33 mM L-methionine, 25 mM Na2CO3, 250 µl of supernatant in a final volume of 3 ml). The absorbance at 540 nm was measured using the assay mixture.
Leaf samples (1 g) were crushed in liquid nitrogen and homogenized in a 10 ml cooled acetone solution for H2O2 estimation. The homogenized solution was filtered using Whatman no. 1 filter paper, and the filtrate was mixed with a 5:4 ratio of ammonium solution (5 ml) and titanium reagent (5 ml). After centrifugation at 10,000 g for 10 min, the precipitated titanium-hydro peroxide complex was dissolved in 10 ml of 2 M H2SO4 and re-centrifuged. The supernatant was collected, and the spectroscopic absorbance was measured at 415 nm (Rao et al., 1997).
2.11 RNA isolation and cDNA preparation
Leaf tissue (50–100 mg) was collected from wheat CS (susceptible line) and TR (resistant line) seedlings for RNA isolation. Sigma’s TRI reagent kit was used to isolate RNA. RNase-free DNase I was used to treat total isolated RNA (Qiagen). According to the manufacturer’s instructions, a total of 2.0 μg isolated, purified RNA was used for cDNA synthesis (reverse transcription) using the Promega M-MuLV Reverse Transcriptase kit.
2.12 Primer design, quantitative real-time (qRT–PCR) and correlation of ROS with gene expression
The software Primer Express version 3.0 (Applied Biosystems, https://primer-express.software.informer.com/3.0/) was used to design primers for RT–PCR. The 81 TaCYP genes were grouped on the basis of their localisation on homoeologous chromosomes, length of amino acids, and the number of exon intron. A set of 25 primers were designed using the Primer Express program version 3.0 (Applied Biosystems) (length; 18–25 bases, GC content; 40%–60%, and Tm = 60 ± 1°C, product size; 70 and 150 bp) and used for qRT–PCR. The CFX96™ Real-time PCR Detection System (BioRad) performed qRT–PCR with Applied Biosystems SYBR Green PCR Master Mix. Each qRT–PCR was run (containing two biological replicates and three technical replicates each) with a total 20 μl reaction mixture, including 10 μl SYBR Premix Ex Taq, 2 μl cDNA, 0.8 μl forward primer, 0.8 μl reverse primer, and 6.4 μldd H2O in a 96-well optical plate, and was amplified according to the following thermal cycling conditions: 95°C for 10 s, followed by 40 cycles of 5 s at 95°C and 30 s at 60°C. The PCR product was heated from 65 to 95°C (0.5°C/5 s) to draw the melting curve, and the raw Ct values were obtained. The endogenous control gene of wheat (TaAct2), expressed constitutively, was used to normalize the data. Fold change values (2−ΔΔCt) for gene expression were calculated for both stress conditions vs. the control as explained by Thomas D Schmittgen (2008), as follows:
The transcript abundance for each gene was normalized to the internal control. Significance in the differential expression due to leaf rust infection (24 HAI and 72 HAI) was estimated through a paired t test using SPSS ver 16.0. Correlation of gene expression with ROS was estimated, and correlation values were depicted in the form of corrplot using the corrplot package (Friendly, 2002) available in R software.
2.13 Homology modeling and structure evaluation
Homology, also known as comparative modeling, is a powerful tool for predicting protein structure and function (Kumar et al., 2016). The 3D structure of TaCYP proteins was predicted using a homology modeling-based method, with solved structures of homologous proteins available in the Protein Data Bank (PDB) (https://www.rcsb.org/). Position-Specific Iterated BLAST (PSI-BLAST) (Altschul et al., 1997) was used against the PDB to identify suitable homologous template structures with a high score and lower e-value. Other criteria were previously described in (Gautam et al., 2019; Kumar et al., 2019; Mathpal, 2021). The TaCYP protein 3D structure was simulated using the Swiss-Model server (Arnold et al., 2006; Biasini et al., 2014). UCSF CHIMERA 1.10, a protein structure visualizer package (Pettersen et al., 2004), was used to render the predicted 3D structures in various 3D coordinates. To assess the expected structure models, a Ramachandran plot was calculated for each protein model by analyzing phi (Φ) and psi (Ψ) torsion angles and covalent bond quality using consensus algorithms from the PSVS (http://psvs-1.5-dev.nesg.org/) and SAVES servers (http://nihserver.mbi.ucla.edu/SAVES/).
3 Results
3.1 Identification of TaCYP gene members in wheat genome
Using the BLASTp search against the T. aestivum IWGSC (protein) data available on EnsemblPlants release 47 (https://plants.ensembl.org/index.html), a total of 81 TaCYP genes distributed on 21 bread wheat chromosomes were identified. According to their chromosomal positions, the 81 TaCYP genes were named TaCYP1 to TaCYP81. All 81 identified sequences were further verified for their conserved domain using secondary databases, including InterPro and PROSITE (Table 1). Table 1 contains all 81 TaCYPs identified, including transcript ID, length of coding sequences (CDS) and amino acids (aa), chromosome location, coordinates, splice variants, and subcellular location. The size of the CDS of all 81 TaCYPs ranged from 465 bp (TaCYP75) to 2,550 bp (TaCYP50, and TaCYP55), and the corresponding aa length ranged from 154 aa (TaCYP75) to 849 aa (TaCYP50, and TaCYP55) (Table 1).
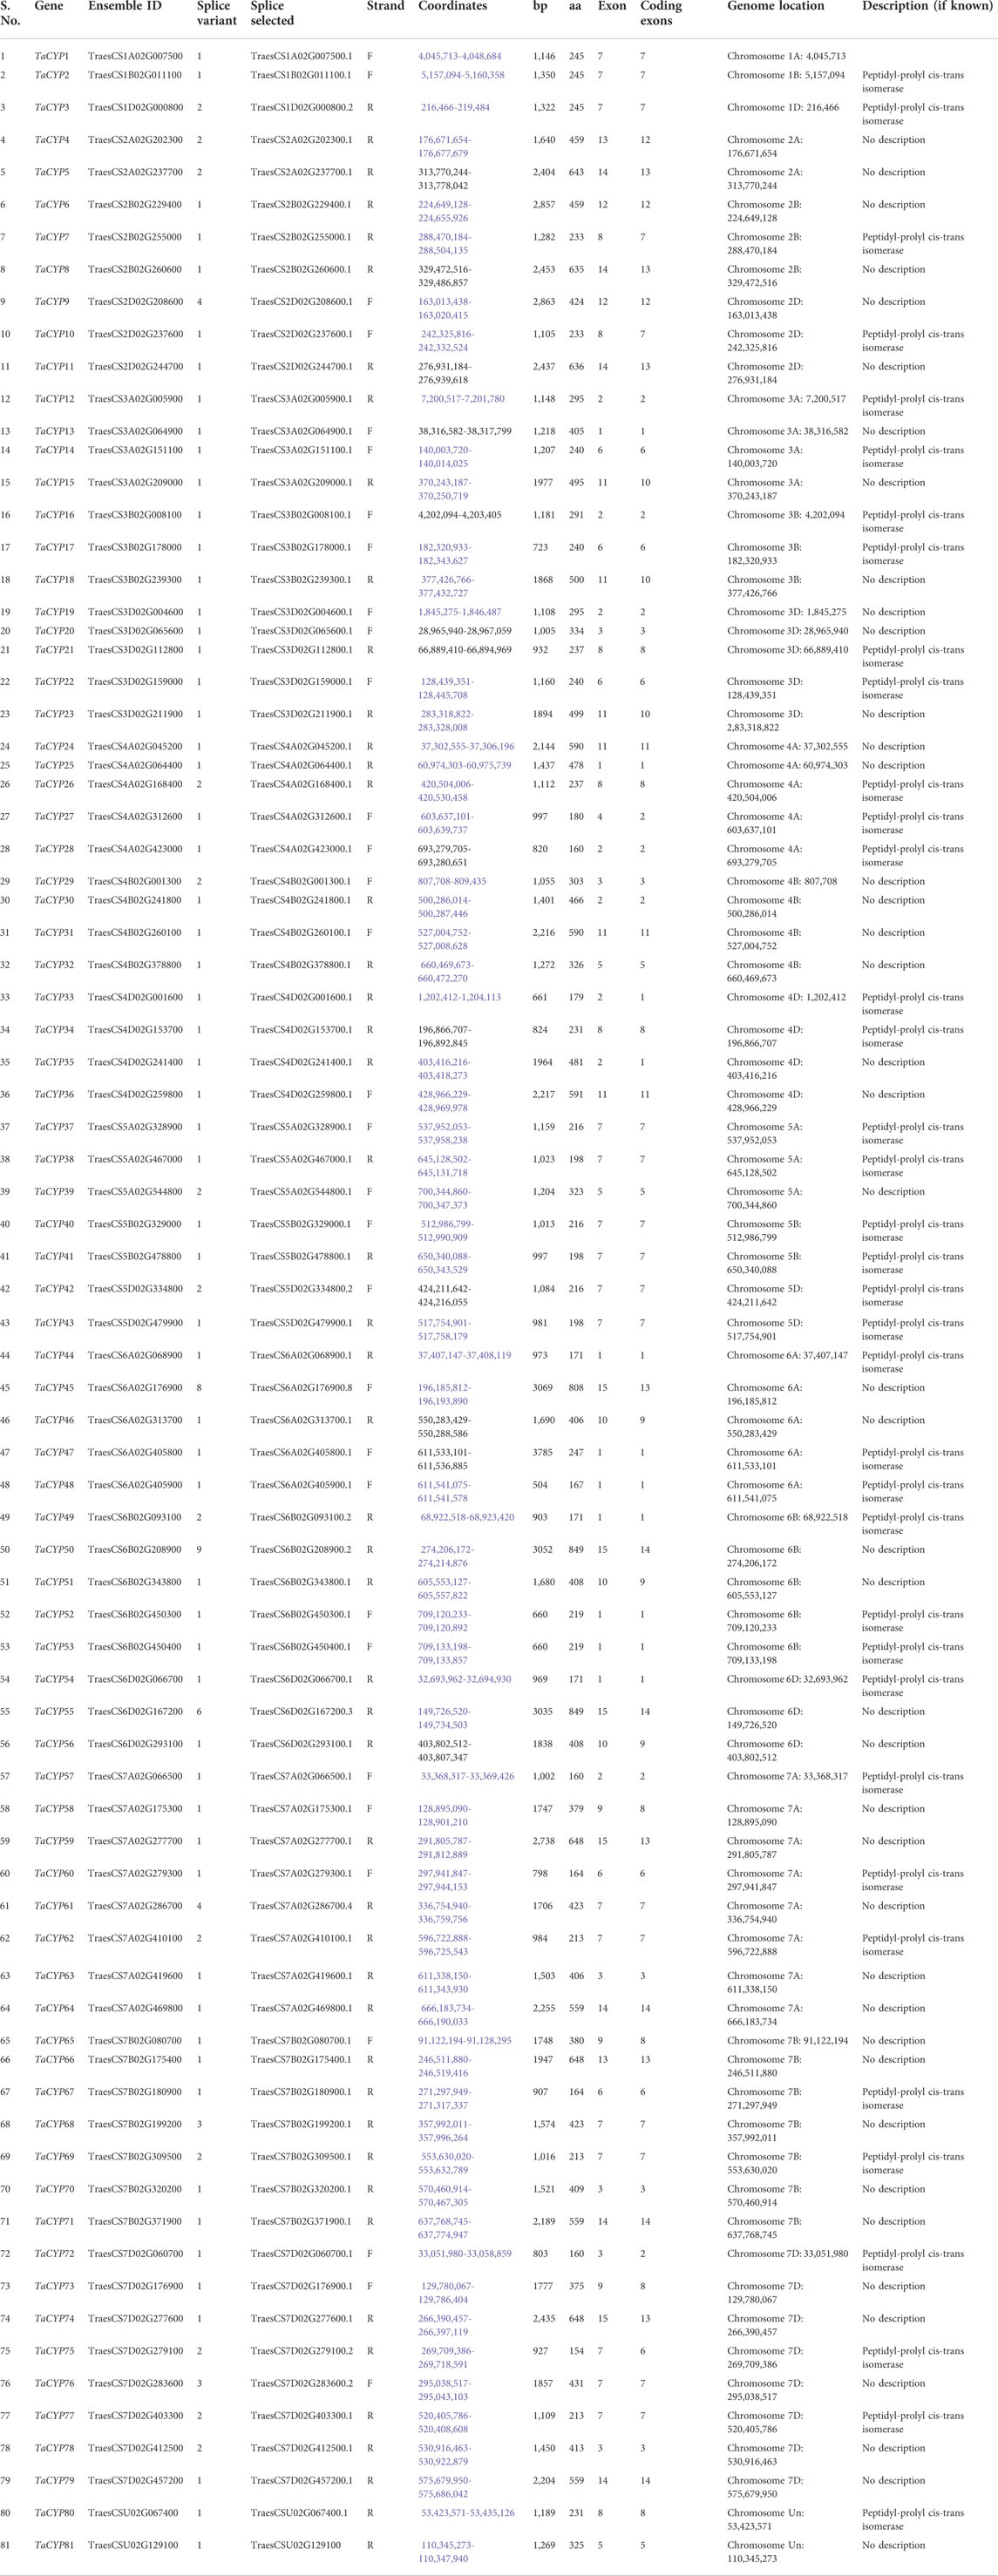
TABLE 1. Details of 81 TaCYP genes with their gene ID, length, chromosome location, coordinates, splice variants, and subcellular location.
3.2 Physical mapping of TaCYP genes
Information on the physical mapping of all 81 identified TaCYP genes to all 21 wheat chromosomes is depicted in Figure 1. The minimum number of TaCYP genes was mapped on homoeologous group 1, and the maximum was located on homoeologous group 7. The range of identity between the three homeologues of each TaCYP gene was 70.95%–99.57% for coding sequence, 70.95%–99.57% for amino acid sequence, and 70.95%–99.57% for gene sequence. On the other hand, two TaCYP genes (TaCYP8 and TaCYP11) mapped on chromosomes 2B and 2D did not have any homoeologous loci on chromosome 2A (Figure 1 and Table 1).
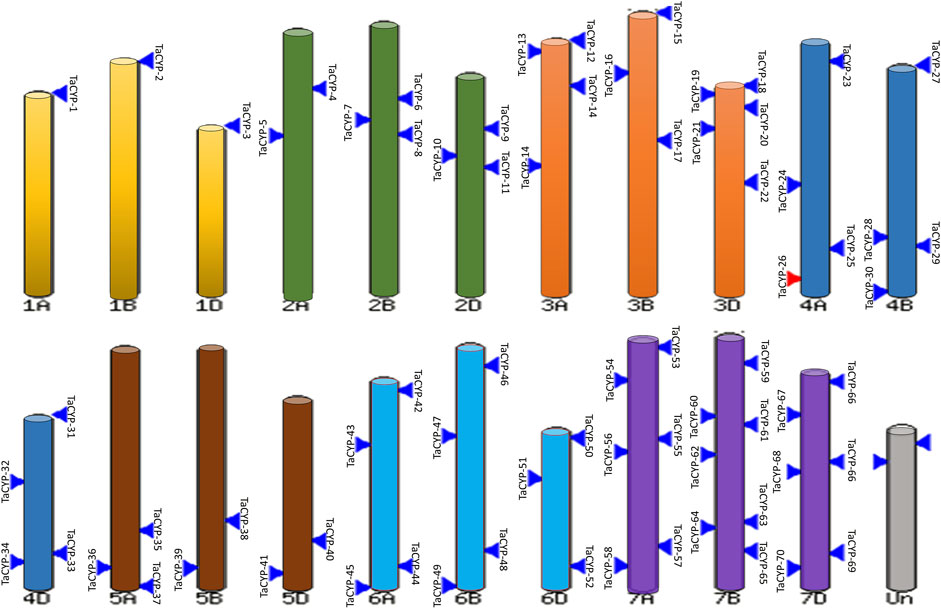
FIGURE 1. Physical mapping of 81 identified wheat TaCYPs based on the image obtained from EnsemblePlants release 47 after BlastN analysis.
3.3 Gene structure of TaCYPs with the distribution of conserved motifs
Gene structure predicted using CDS and gDNA sequences of wheat TaCYP genes showed diversification between all 81 TaCYP genes. The number of exons/introns was highly variable, exon number varied from 1 (TaCYP13-3A, TaCYP25-4A, TaCYP33-4D, TaCYP35-4D, TaCYP44-6A, TaCYP47-6A, TaCYP48-6A, TaCYP49-6B, TaCYP52-6B, TaCYP53-6B, and TaCYP54-6D) to 14 (TaCYP50-6B, TaCYP55-6D, TaCYP64-7A, TaCYP71-7B and TaCYP79-7D) (Figure 2). As shown in Figure 2, most TaCYP members of a cluster exhibited the same exon/intron boundary patterns, including intron phase, intron number, and exon length.
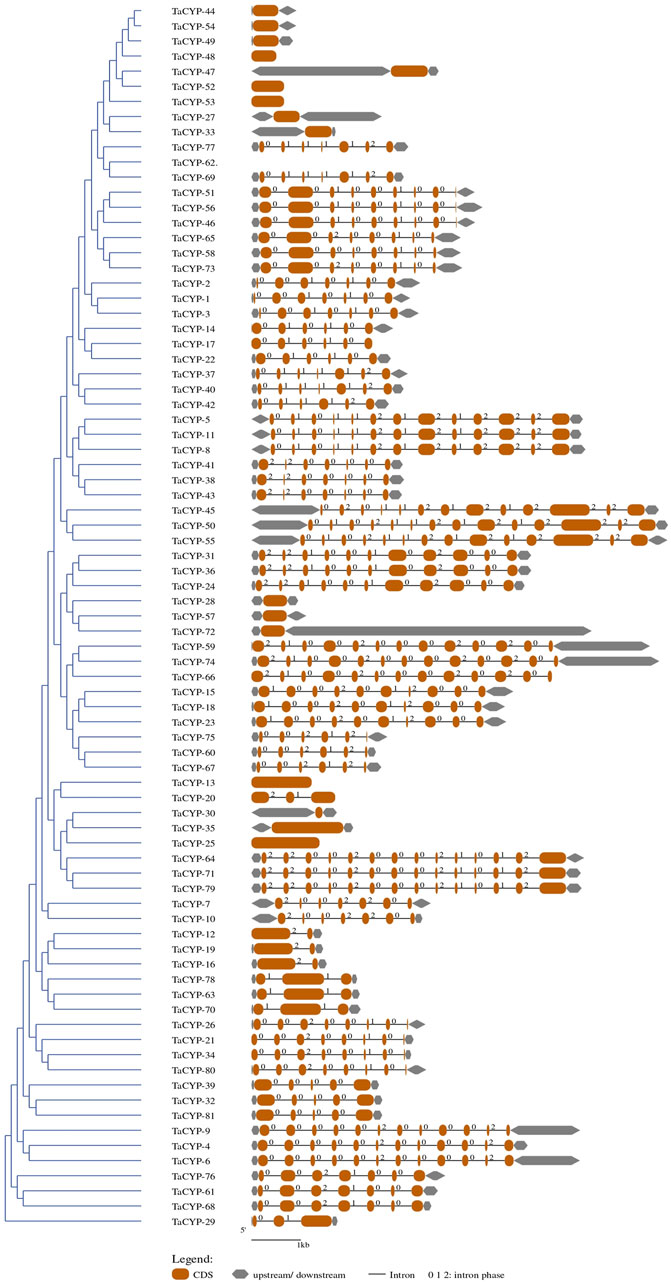
FIGURE 2. A representative figure depicting the grouping of the predicted gene structure of all 81 TaCYP genes identified.
The MEME analyses of the protein sequences of a set of 81 TaCYP genes led to the discovery of 15 distinct conserved motifs (1–15) with a width of 15–41 (Supplementary Figure S1). The location of predicted motifs showed that CYP domains carried a minimum 2 (TaCYP32, 39, and 81) to a maximum of 12 (TaCYP35, 30, 25, 64, 71, and 79) conserved predicted motifs. Motif 4 was conserved in 77 of 81 identified TaCYPs. Out of 81 TaCYPs, 27 TaCYPs showed a conserved distribution pattern for 8 predicted motifs: motif 11 followed by motifs 3, 1, 5, 6, 2, 4, and 10. Group III members contained maximum number (6–12) of motifs, followed by Group II (7–11 motifs), and group I members (2–7 motifs). Seven motifs (motifs 3, 1, 5, 6, 2, 4, and 10) existed in all members of group II (except TaCYP45, which lacked motifs 3 and 1) (Supplementary Figure S1) and Group II (except TaCYP21, 26, 34, and 80, those lacked motif 5). The log-likelihood ratio, information content, and relative entropy ranges of the 15 identified motifs ranged from 646-3550, 32-152.8, and 30.2-155.2, respectively (Table 2). The distribution patterns of the 15 identified conserved motifs among the TaCYPs are presented in Supplementary Figure S1.
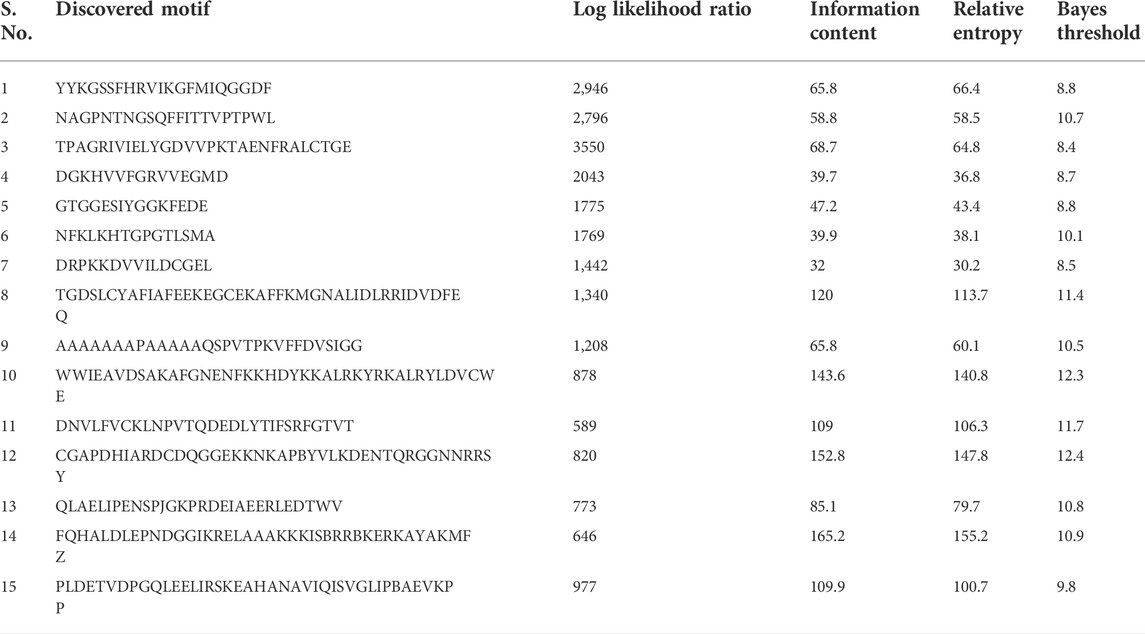
TABLE 2. Details of the discovered motif (MEME).
3.4 Phylogenetic analysis
Phylogenetic analysis using an unrooted maximum likelihood algorithm revealed the clustering of 81 TaCYP proteins into three different groups based on their conserved domains. All TaCYP proteins carry a highly conserved CLD (cyclophilin-like domain) domain with three variants; namely, TLP-40, ABH, and Ring U-Box (Figure 3). For instance, 17 TaCYP proteins (out of 81) that contained the TLP-40 domain were clustered into group I; 37 TaCYP proteins with the ABH domain were clustered into group II, and the remaining 27 TaCYP proteins, which included the ring U box domain, were clustered into group III. Group II was the largest group, with the maximum number of TaCYP members (45.67%). The phylogenetic relationship among the identified TaCYP proteins is given in Figure 3. The phylogenetic relationship between the identified TaCYP proteins and the earlier CYPs reported in other plants is shown in Supplementary Figure S2. Domain analysis of wheat TaCYP proteins and CYP proteins from other crops revealed that all the clustered CYP proteins in the phylogenetic tree carried a conserved domain CSA_PPIASE_2.
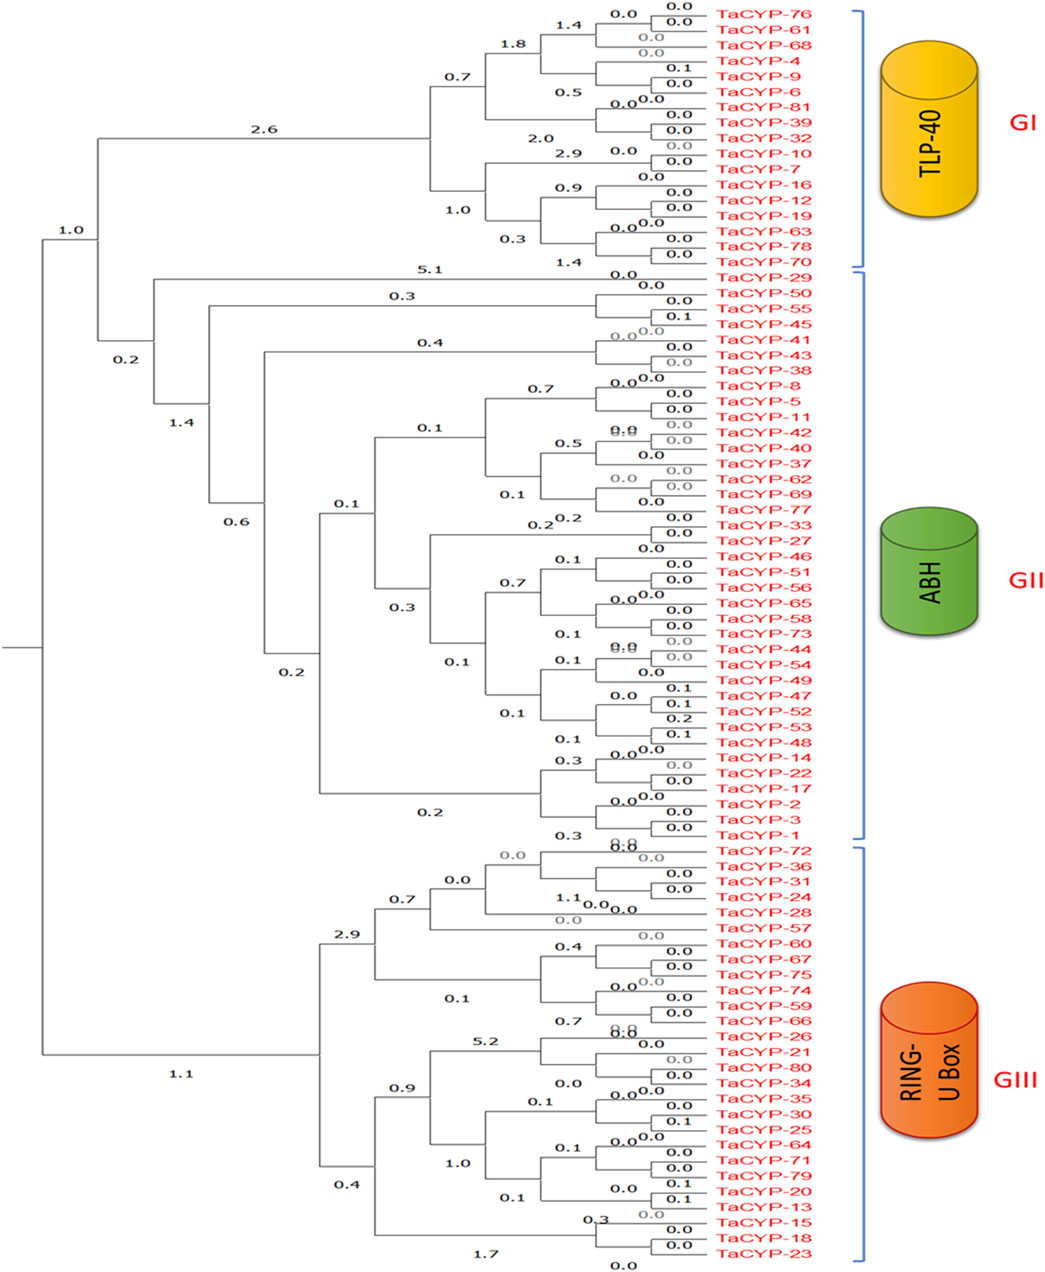
FIGURE 3. Phylogenetic classification and grouping of all 81 TaCYP proteins with conserved protein domains into three groups: GI, GII, and GIII. GI contains all the members with the TLP-40 domain, GII clusters all members containing the ABH domain, and GIII contains all TaCYPs with the Ring U Box domain.
3.5 Network of miRNAs targeting TaCYPs
Network analysis revealed the multiplicity behavior of miRNAs, i.e., one miRNA can target more than one member of the TaCYP gene family (Supplementary Figure S3). For instance, tae-miR1127a targets four TaCYP genes (TaCYP36, TaCYP41, TaCYP67, and TaCYP70), tae-miR1137a targets two TaCYP genes (TaCYP24 and TaCYP64), and tae-miR1130a targets five TaCYP genes (TaCYP61, TaCYP62, TaCYP43, TaCYP76, and TaCYP81). Similarly, one member of TaCYP gene is a target for more than one miRNA, such as TaCYP24, targeted by three miRNAs: tae-miR1128, tae-miR1137a, and tae-miR1137b-5p (Supplementary Table S1).
3.6 In silico expression analysis under biotic stress
In silico expression analysis of 81 TaCYP genes revealed significant expression changes due to infection with powdery mildew. Out of 81 TaCYP genes, only three homoeologous transcripts (TaCYP44, located on 6A; TaCYP49, located on 6B; and TaCYP54, located on 6D) showed high expression (8.65–10.37 tpm) against foliar disease infection with powdery mildew at three spans of inoculation (24 and 72 HAI). (Figure 4). The relative expression of each TaCYP gene is presented as a heatmap generated from the relative abundance of transcripts (per 10 million reads) for each gene.
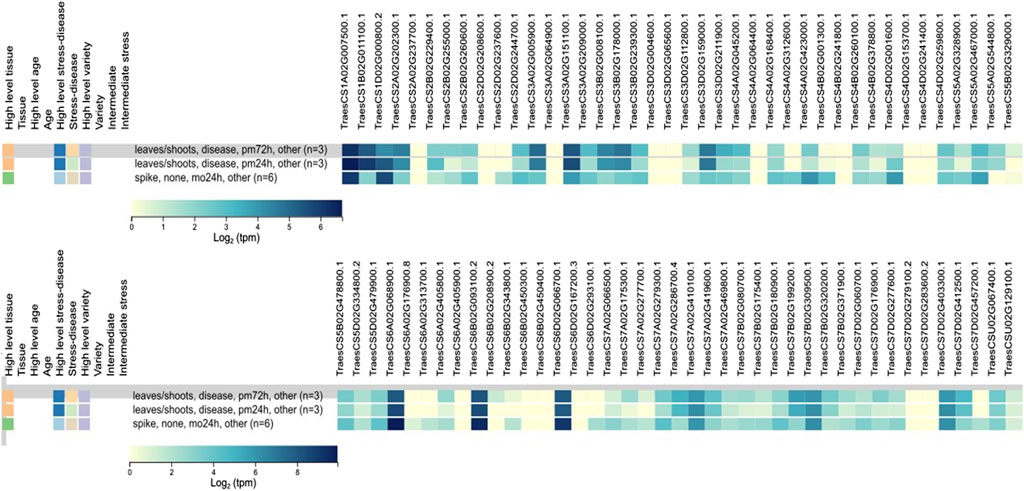
FIGURE 4. Expression analysis of 81 TaCYP genes under abiotic/biotic stress conditions retrieved from the expVIP database using RNA-Seq data.
3.7 Gene expression using qRT–PCR analysis
A total of 25 primers associated with 81 TaCYP genes were selected for qRT–PCR analysis based on the grouping of the 81 TaCYP genes into 8 groups (seven groups for chromosome 1 to chromosome 7 and one group for sequences with unknown genomic locations). Twenty-three (23) out of the 25 genes belonged to the 7 homeologous groups, whereas 2 genes belonged to unknown chromosomes (for details, see Supplementary Table S2). Eighteen (18) out of the above 25 TaCYPs primers [TaCYP-1 (associated with TaCYP1/2/3), 2 (associated with TaCYP4/6/9, 4 (associated with TaCYP7/10), 5 (associated with TaCYP12/16/19), 6 (associated with TaCYP14/17/22), 9 (associated with TaCYP25/30/35), 10 (associated with TaCYP26/34), 11 (associated with TaCYP37/40/42), 12 (associated with TaCYP38/41/43), 13 (associated with TaCYP44/49/54), 14 (associated with TaCYP45/50/55), 15 (associated with TaCYP46/51/56), 16 (associated with TaCYP57/72), 17 (associated with TaCYP58/65/73), 19 (associated with TaCYP 60/67/75), 21 (associated with TaCYP62/69/77), 24 (associated with TaCYP80), and 25 (associated with TaCYP81) were downregulated in both the contrasting genotypes, whereas three TaCYP primers associated with genes TaCYP15/18/23, TaCYP24/31/36, and TaCYP59/66/74 were upregulated in both genotypes under the disease conditions. However, four TaCYP primers associated with genes TaCYP5/8/11, TaCYP61/68/76, TaCYP63/70/78, and TaCYP64/71/79 showed significant upregulation in resistant lines. Furthermore, TaCYP24/31/36 showed maximum upregulation (∼100 FC) in the resistant line compared to the control (Figures 5A,B).
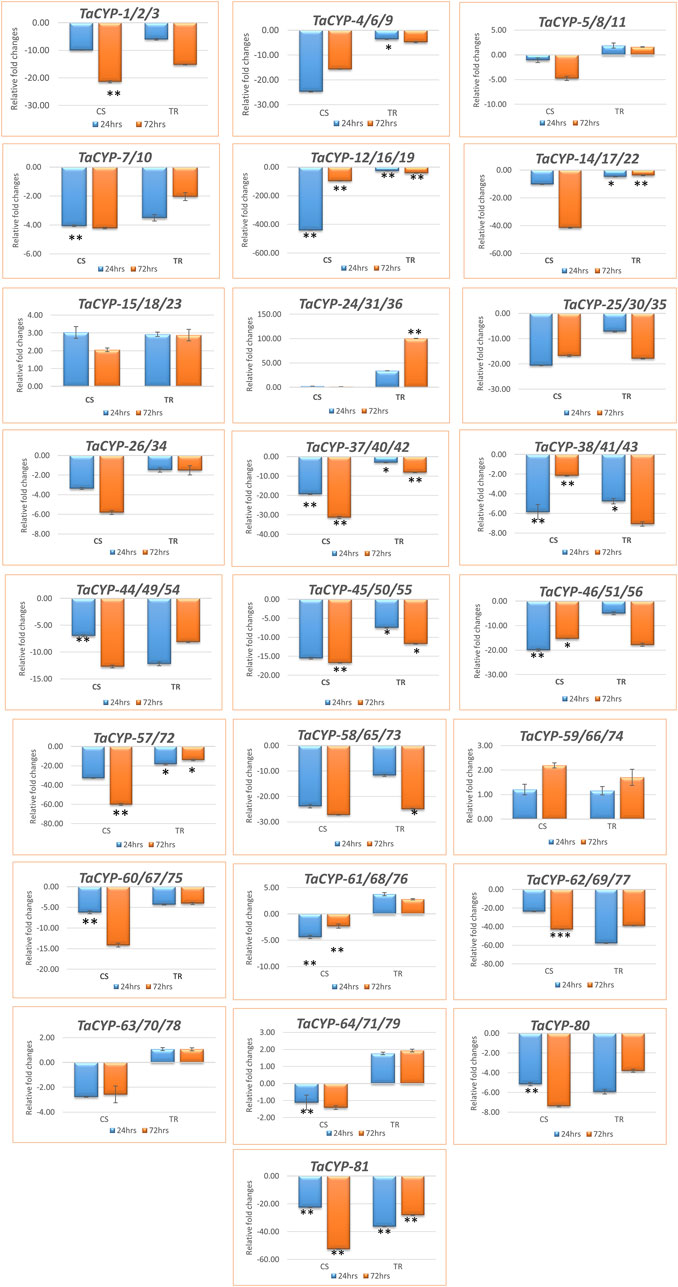
FIGURE 5. Expression profiling of 81 TaCYP genes in leaf rust-resistant genotype transfer (TR) and susceptible genotype Chinese spring (CS) after inoculation with leaf rust pathogens (race 77-5). The mean value of six replicates, with error bars indicating standard error (SE), is presented. SE. Significant changes (based on paired t test) in gene expression are indicated by * (p > 0.05), **(p > 0.01) or & ***(p > 0.001).
3.8 Physiochemical properties
Details of the estimated values of different physiological parameters are given in Table 3. All the selected TaCYPs varied for the calculated values, such as the isoelectric points (pIs) from 4.5089 (TaCYP13) to 107.231 (TaCYP77), the molecular weights (Mws) from 102.434 (TaCYP19) to 115.157 g/mol (TaCYP71), the theoretical pI from 4.73 (TaCYP13) to 12.05 (TaCYP29), the instability index (II) from 14 (TaCYP57) to 106.61 (TaCYP45), the aliphatic index from 40.28 (TaCYP45) to 100.04 (TaCYP7), and the predicted GRAVY score from −1.44 (TaCYP45) to 0.197 (TaCYP12). Out of 81 TaCYP proteins, 46 proteins (58%) had a stable nature, while the remaining 35 proteins (42%) were unstable at the sequence level.
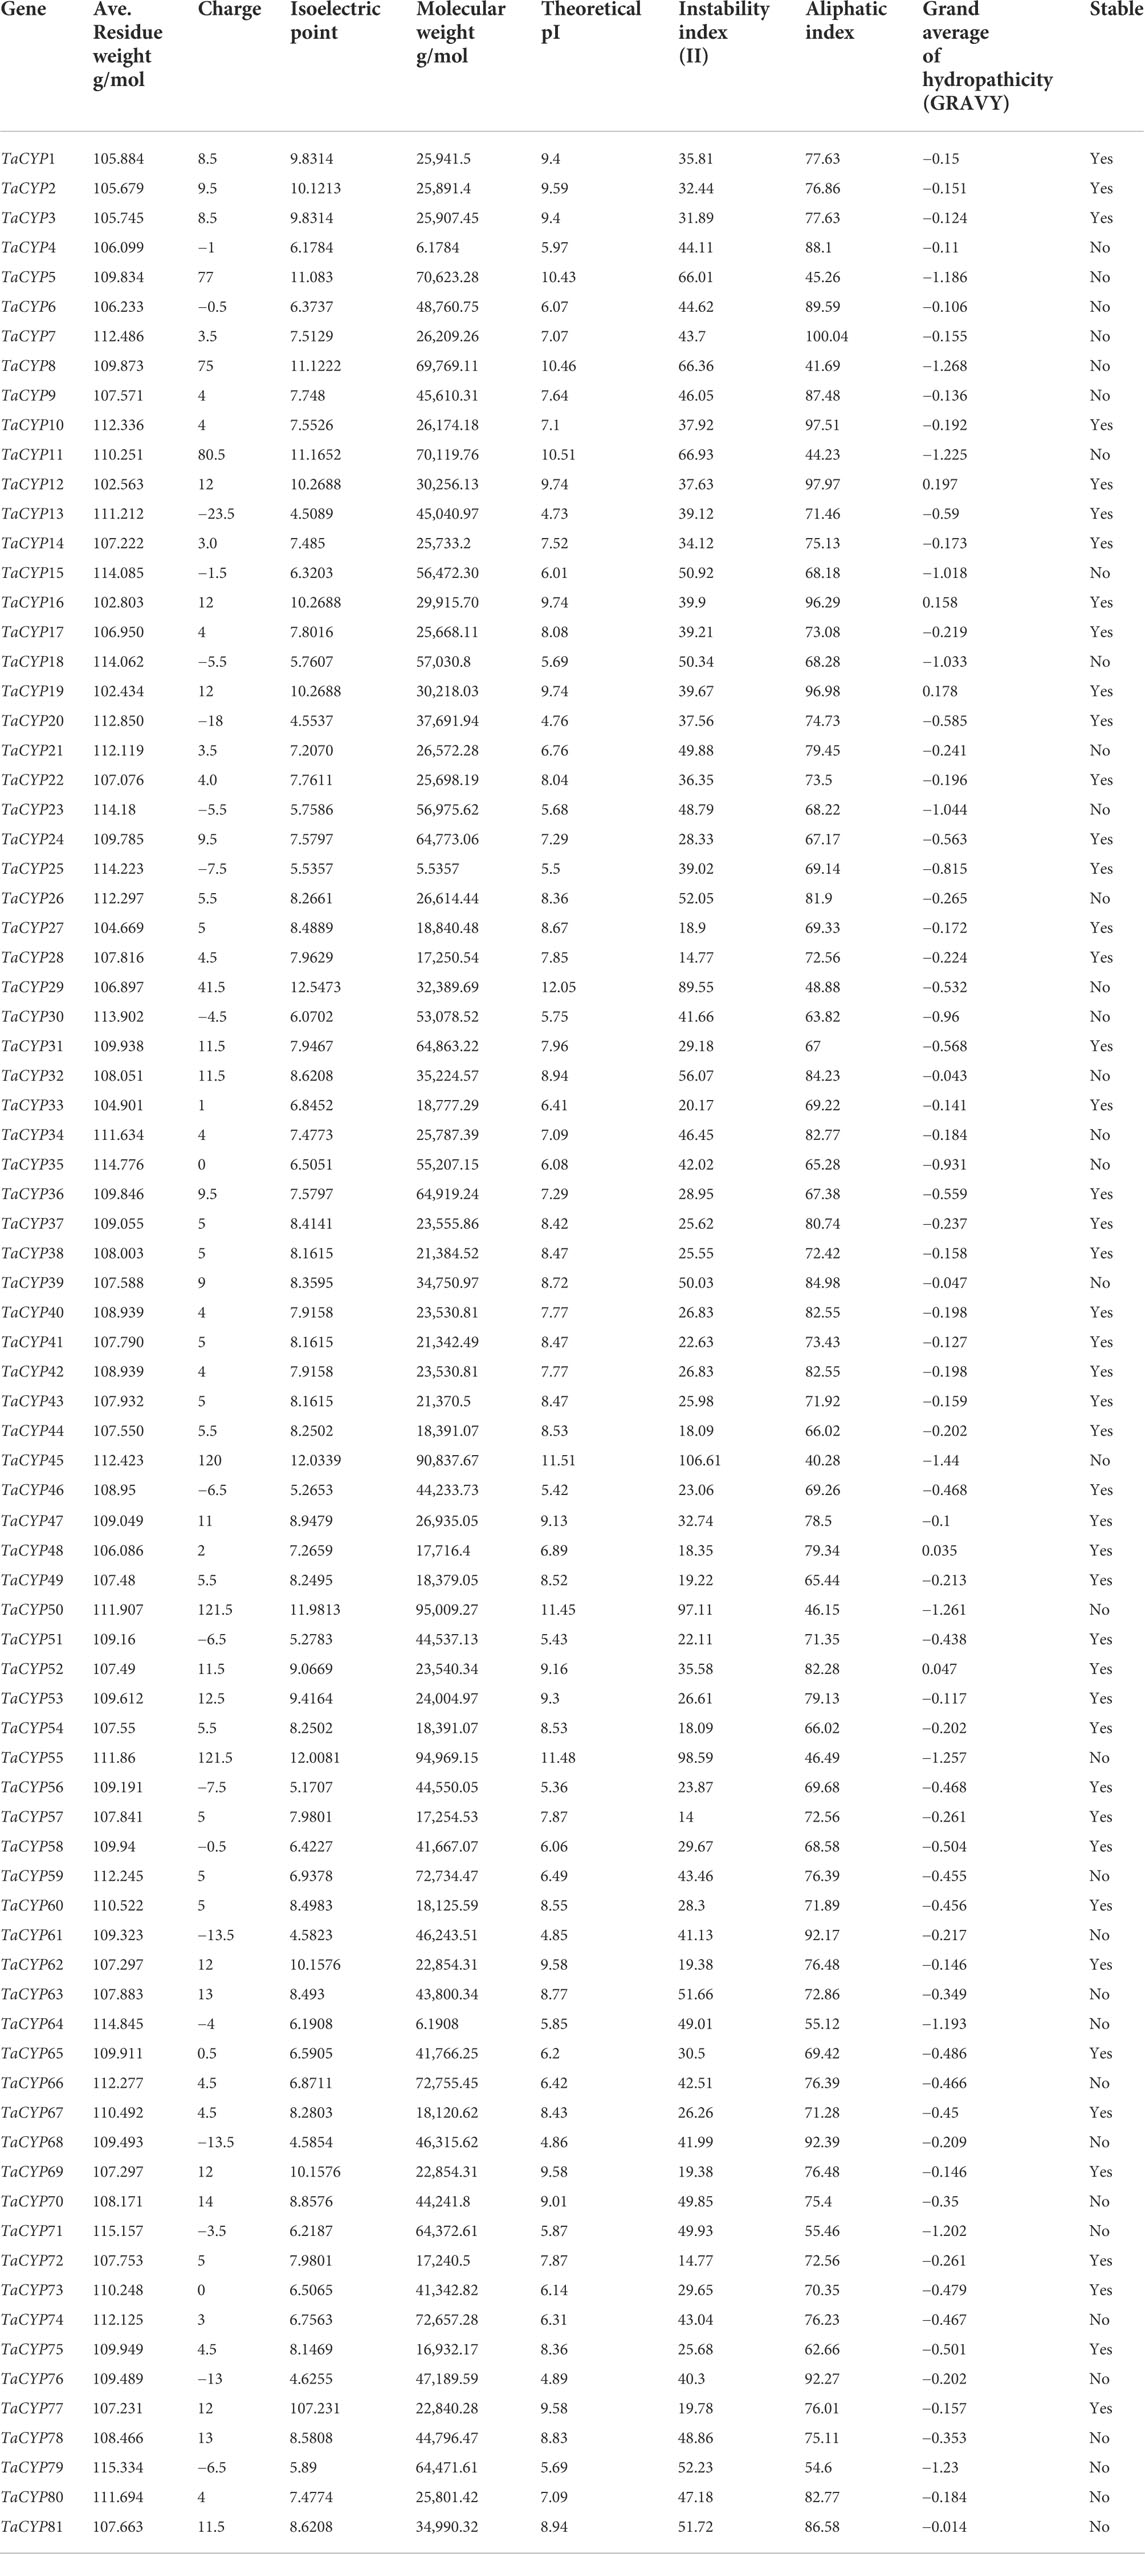
TABLE 3. Details of 81 TaCYP proteins, including average residue weight g/mol, charge, isoelectric point, molecular weight, theoretical PI, instability index, aliphatic index, grand average of hydropathicity (GRAVY) and stability.
Prediction of subcellular localization analysis indicated that TaCYP proteins are localized throughout the cell, including different cell organelles. Maximum TaCYP proteins were localized in the nucleus (27 TaCYPs), followed by the extracellular space (13 TaCYPs), cytoplasm (9 TaCYPs), chloroplast thylakoid lumen (8 TaCYPs), organelle membrane (7 TaCYPs), mitochondrial membrane (4 TaCYPs), chloroplast thylakoid membrane (3 TaCYPs), endomembrane system (3 TaCYPs), mitochondrion (2 TaCYPs), chloroplast (2 TaCYPs), chloroplast outer membrane (2 TaCYPs), and plasma membrane (1 TaCYP) (Table 4). TaCYP genes located in the nucleus (e.g., TaCYP5, TaCYP8, TaCYP 11, TaCYP64, TaCYP71, and TaCYP79) showed longer exon–intron architecture (coding exons: 14), while the TaCYP genes located in the extracellular space (TaCYP44, TaCYP49, TaCYP54, TaCYP57, TaCYP72) and chloroplast thylakoid membrane (TaCYP12, TaCYP16, TaCYP19) showed the shortest exon–intron (coding exons: 1 or 2) frame.
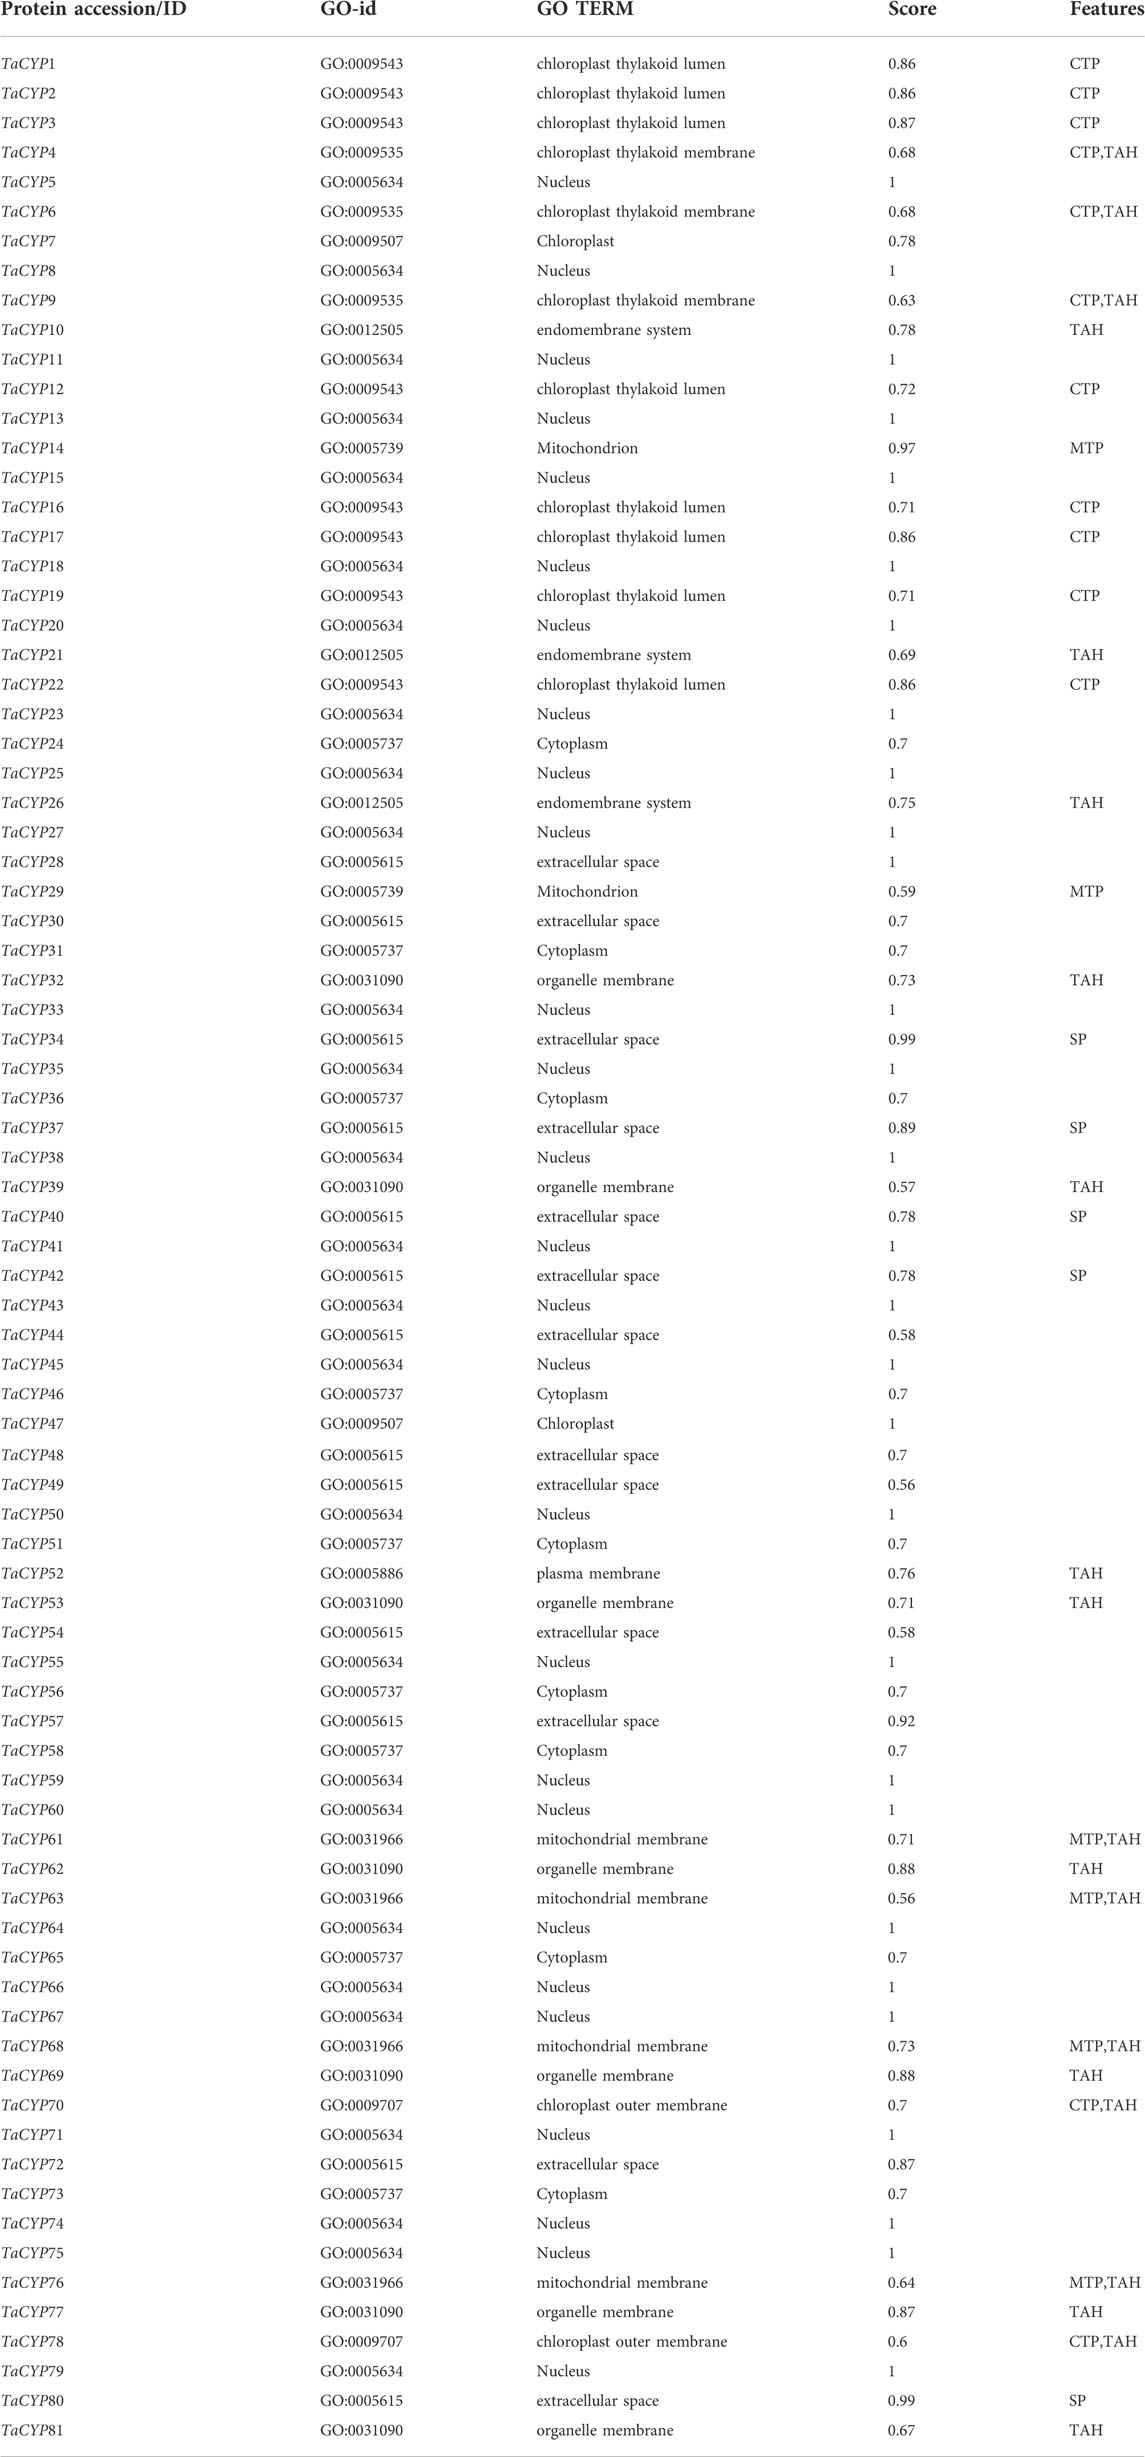
TABLE 4. Subcellular location of all 81 identified TaCYP genes.
3.9 Homology modeling
The 3D structures of fifteen (15) representative TaCYP proteins were modeled based on the homology modeling approach. Modeled 3D structures of TaCYP proteins shared a high similarity up to 100% with template structures. The obtained percentage of protein similarity was adequate for annotating protein 3D structures that were predicted using an automated Swiss-Model server. As per the homology modeling method rule, a good protein model should be more than 30% similar to the template structure (Kumar et al., 2019). Modeled 3D structures were further interactively visualized in CPK by UCSF CHIMERA (Figure 6). Calculated 3D structures of fifteen (15) representative proteins depict <1 Å RMSD values for suitable template structures upon superposition.
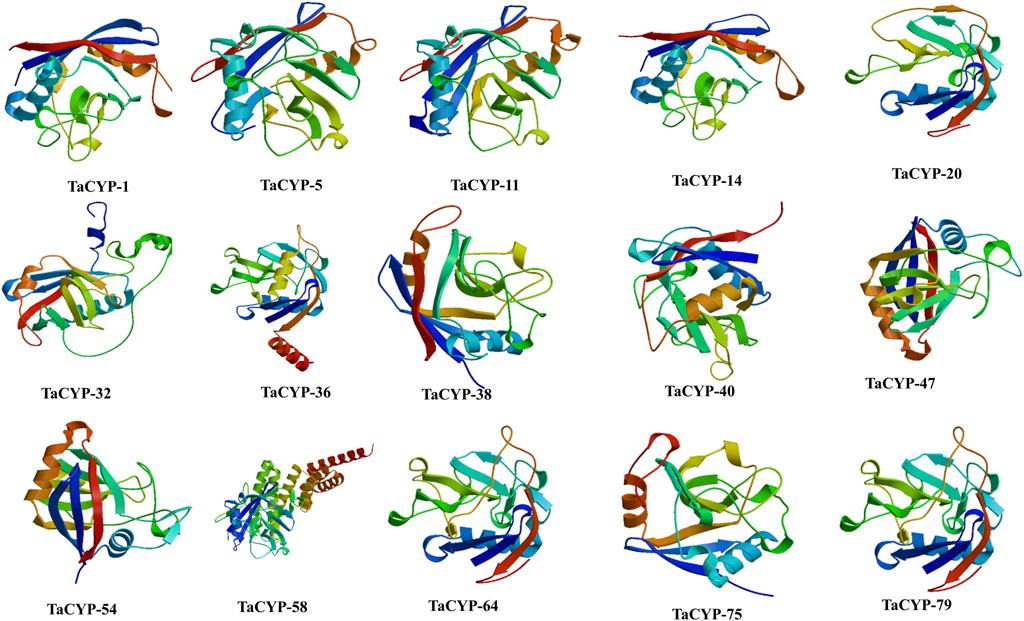
FIGURE 6. 3D structures of 15 representative proteins simulated using the SWISS-MODEL server.
Ramachandran plot calculation is crucial to evaluate the quality of protein 3D structure and trend. As evident from Supplementary Figure S4 and Supplementary Table S3, the evaluated Ramachandran plots of torsion angles for phi (Φ) and psi (Ψ) revealed the excellent geometry of the predicted 3D structures of TaCYPs. The calculated Ramachandran plots of TaCYPs showed up to 90.2% residues in most favored regions and up to 21.6% in additional allowed regions. In contrast, up to 2.6 residues in generously allowed regions follow the suitable quality parameters of the PROCHECK algorithm (Supplementary Figure S4). The fruitful utilization of the Ramachandran plot has been demonstrated in several recent findings (Arnold et al., 2006; Kumar et al., 2016; 2018b).
3.10 Accumulation of ROS
The results suggest an ROS burst, as indicated by the localization and accumulation of ROS [SOR and H2O2] contents in wheat seedlings. The presence of H2O2 was confirmed via the appearance of the brown-colored product, while the development of dark blue colour indicated the presence of SOR (Figure 7). The spectrophotometric assay and tissue localisation indicates more SOR and H2O2 in CS w.r.t. TR at 24 and 72 HAI (Figure 7). The correlation heatmap showed that the accumulation of H2O2 and SOR positively correlated with the TaCYP genes during the span of infections (24HAI and 72 HAI) in CS. On the other hand, the accumulation of H2O2 showed a negative correlation with the TaCYP genes, which showed downregulation during 24 HAI and upregulation with the 72 HAI span of infection (Supplementary Figure S5) in TR.
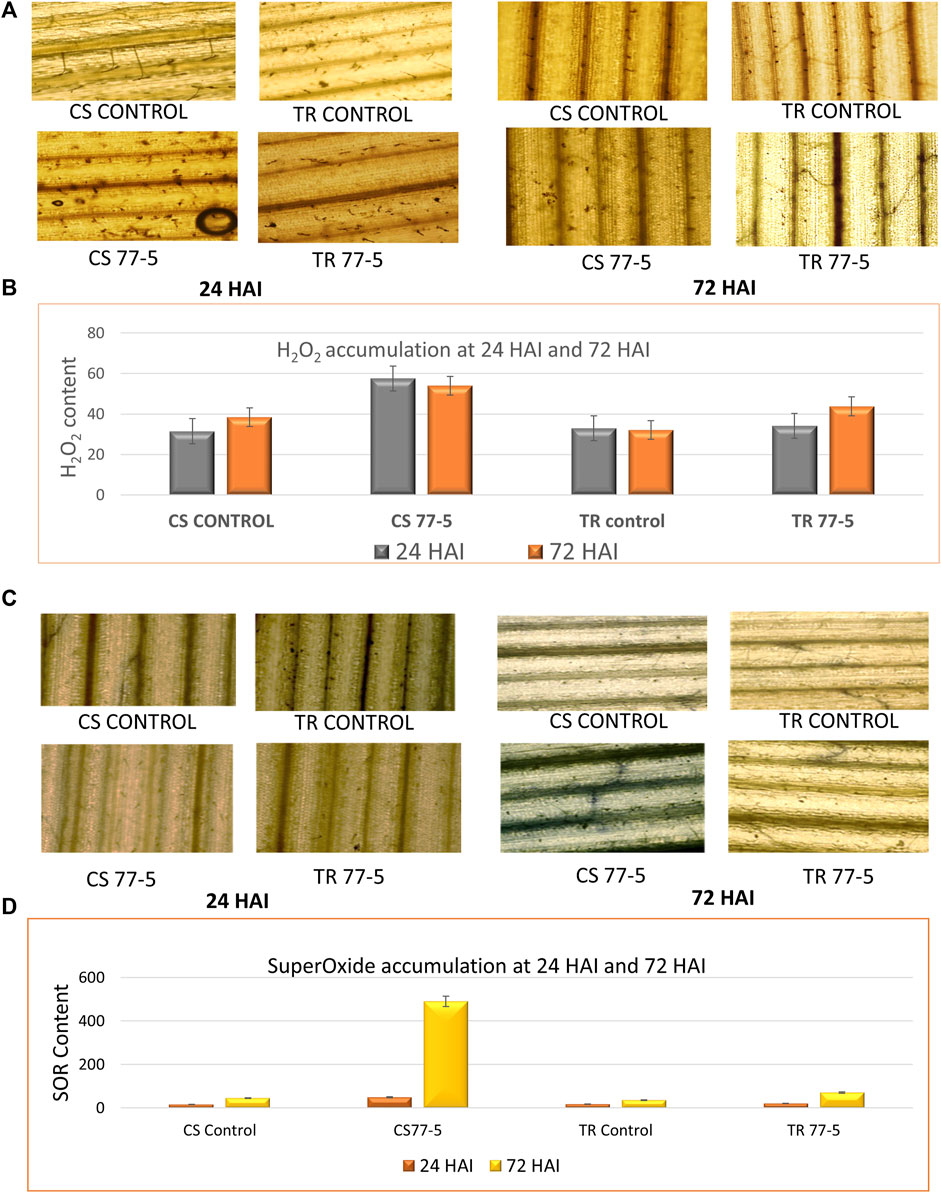
FIGURE 7. Effects of leaf rust pathogen on the localization and content of reactive oxygen species, hydrogen peroxide (A,B) and superoxide radical (C,D). CS; Chinese spring and TR; Transfer.
4 Discussion
A significant area of varietal development is the breeding of wheat varieties that are resistant to the rust disease, and continuing research is being carried out in this direction. Understanding the molecular basis of leaf rust resistance will be aided by characterising genes involved in downstream signaling during wheat-leaf rust infection. The allelic information of regulatory genes can then be utilized to create functional markers for leaf rust resistance molecular breeding. In order to develop wheat cultivars resistant to leaf rust, it was planned for the current study to characterise CYP genes on a genome-wide scale and identify important CYP candidate genes that may serve as possible targets for allele mining and functional marker development.
Our initial genome-wide search revealed 81 members of the CYP gene family, and it was discovered that these 81 members were dispersed throughout all 21 bread wheat chromosomes, indicating more sequence divergence. The same number of introns/exons and nearly identical length of CDS/aa displayed by the TaCYPs on the chromosomes of the same homoeologous group can be attributed to the CYP members conservation between homoeologous chromosomes or to major structural rearrangements. This implies that among these known TaCYPs, mutation and selection are evolutionarily conserved (Yu et al., 2022). This is also supported by an earlier study that found intron sites that are likely preserved (ancestral) throughout multiple kingdoms (including animals, plants, and fungi) (Fedorov et al., 2002). The chromosomal locations of all identified TaCYPs revealed an intriguing pattern of clustering, with TaCYPs clustered on one chromosome and their paralogs clustered on the other. These results indicate segmental duplication, which has been demonstrated to be crucial in the evolutionary analysis of several other gene families (Moore et al., 2015), is also involved in the chromosomal areas harbouring TaCYP genes.
Further, the phylogenetic analysis revealed the following interesting findings: 1) In the evolutionary tree, 66 of the 81 TaCYP proteins were clustered into a group of three (22 pairs) and the remaining 15 TaCYPs were placed as a separate branch, 2) multidomain (MD) wheat cyclophilin genes (MD-TaCYPs) were clustered together, and 3) a correlation was observed between the clustering pattern of TaCYPs and their subcellular localization. For example, genes predicted to be found in the chloroplast, nucleus, and mitochondria were found to be divided into three distinct clusters based on their predicted location. Maximum TaCYP genes in a specific group in the phylogenetic tree matched exon-intron numbers, intron phases, and other characteristics (Figure 3).
The sub-organelle membrane is the location of the majority of the CYP members clustered with the TLP40 domain. It has been reported that TLP40 (MD) cyclophilins play a significant function in the photosynthetic membrane of chloroplasts by acting as negative regulators of the thylakoid membrane protein phosphatase (Fulgosi et al., 1998; Vener et al., 1999; Olejnik et al., 2021). For instance, they influence the dephosphorylation of a number of crucial proteins in photosystem II, which is engaged in light reactions during photosynthesis (Fulgosi et al., 1998), and hence play a significant role in chloroplast biogenesis and intracellular signalling. Because leaf rust is known to have a major impact on photosynthesis rate and diminish grain production (Yahya et al., 2020), the presence of this crucial domain may help in increasing photosynthesis in wheat varieties that have been affected. Additionally, AtCYP38 in Arabidopsis is a homolog of TLP40 in spinach (Fulgosi et al., 1998), and in the current study, AtCYP38 formed a cluster with all CYP genes (with TLP40 domain) located in the sub-organelle membrane.
The CYPs in a particular group also had a similar pattern of conserved motifs. Overall, the CYP contained 15 conserved regulatory motifs, which confirms previous reports for CYPs in Arabidopsis and rice (Romano et al., 2004; Singh et al., 2019). However, some motifs exclusively appeared in a particular group of TaCYP proteins; motifs 9, 13, and 14 were present in the members of group III, and upregulated genes (TaCYP24) along with their homeologus genes (TaCYP31 and TaCYP36) contain two copies of motif 14 compared to other genes, which may provide specificity during resistance. The motif distribution among TaCYPs suggested that the proteins in the same group perform identical functions (Schaeffer et al., 2016).
The range of the protein instability index, which is variable, may be an indication of the variability in the stability of wheat TaCYP proteins under a variety of environmental conditions, including potential biotic stresses. The degree of thermal stability demonstrated by a protein under a range of stresses is indicated by the aliphatic index derived in the current study for various TaCYP proteins. As a result, proteins with higher values of the aliphatic index may be more thermostable than those with lower values of the aliphatic index (Rashid and Salih, 2022). The aliphatic index of TaCYP proteins in the current study ranged from 40.28 to 100.04, demonstrating that these TaCYP proteins are thermostable under a spectrum of conditions.
Protein stability at the sequence and structure levels play important role in controlling the plant immune system in response to biotic stress (Holt et al., 2005). Most (76 out of 81) of the identified TaCYP proteins had a negative GRAVY value, indicating the hydrophilic nature of the proteins. Only five proteins (TaCYP12, TaCYP16, TaCYP19, TaCYP48, and TaCYP52) show a hydrophobic nature, suggesting a high level of stability of the identified TaCYP proteins. Protein localization results revealed the clustering of most genes in the nucleus (27 TaCYPs), It is not surprising given that the nucleus is where active signaling genes are most frequently targeted (Peng and Gao, 2014; Robles and Quesada 2021). The identified homoeologous TaCYP genes shared a similar pattern of exon–intron structure and intron phrase in the same sub cell organelle, e.g., TaCYP4(2A), TaCYP6 (2B), and TaCYP9 (2D) are localized in the chloroplast thylakoid membrane; similarly, TaCYP24(4A), TaCYP31(4B), and TaCYP36(4D) are members of subcellular organelle cytoplasm, confirming structural rearrangements or conservation of CYP members between homoeologous chromosomes. The present study revealed that a highly upregulated group of TaCYP genes (TaCYP24, TaCYP31, and TaCYP36) are localized in the cytoplasm, which also receives support from an earlier study involving the Arabidopsis-P. syringeae pathosystem, where the overexpressed AtCYP19 and AtCYP57 genes were also localized in the cytoplasm and their overexpression induced resistance against Pseudomonas syringae (Pogorelko et al., 2014). Therefore, we believe that the above three upregulated genes (TaCYP24, TaCYP31, and TaCYP36) in the present study may have a potential role in providing resistance against leaf rust infection; however, future studies involving overexpression or suppression through suitable approaches will lead to a better understanding of the role of these genes during wheat-leaf rust interactions.
When the genes were analysed for expression using qRT-PCR, the amplicon from primer XTaCYP-8 (derived from the genes TaCYP24, TaCYP31, and TaCYP36) located on similar location of homoeologous chromosomes 4A, 4B, and 4D exhibited a significant upregulation (100FC) in the resistant line as compared to the control. Additionally, these were found to be an ortholog of the peptidyl-prolyl cis-trans isomerase gene that has been previously identified in a variety of crops, including rice (OsCYP65), Arabidopsis (AtCYP65), Sorghum bicolor (SORBl3001G466700), Brassica napus (BnaC03g48580D), Hordeum vulgare (HORVHr1 (AET4Gv20643700). It is a protein that functions as a RING-type E3 ubiquitin transferase isomerase in the folding, peptidyl-prolyl isomerization, and polyubiquitination of proteins. It has been previously reported that wheat’s E3 ubiquitin ligase participates in the defence response against the Bgt fungus and against salt stress (Li et al., 2014; Zhu et al., 2015).
In addition, a leaf rust-resistant QTL Lr. ace-4A, conferring resistance at the seedling stage and tightly linked with the stem rust-resistant QTL QSr.ace-4A, has also been identified and mapped on the short arm of chromosome 4A within a QTL interval of 37, 813, 793 bp–581,470,783 bp (Aoun et al., 2019). An in silico study revealed that the identified wheat TaCYP24 is also located at 37,302,555 bp–37,306,196 bp on chromosome 4AS, indicating that the differentially expressed TaCYP24 gene is a strong candidate or some cis-regulatory element involved during resistance through a leaf rust-resistant QTL (Lr.ace-4A) that maps to this region. Earlier, it was also demonstrated that variation in sequences near candidate genes is often responsible for the prominent differences in expression (Mozhui et al., 2008).
The in silico experiment filtered out three highly expressed transcripts of homoeologous genes, TaCYP44, TaCYP49, and TaCYP54, at the leaf disease stage against powdery mildew. The qRT–PCR experiment also showed that the gene associated with primer XTaCYP-13 (designed from the cluster of TaCYP44, TaCYP49, and TaCYP54) displayed the differential expression in contrasting lines. Further, the TBLASTN confirmed that Arabidopsis ROTAMASE CYCLOPHILIN 1 (ROC1) (AtCYP18-3; used as a query sequence in the present study) has three orthologous genes in wheat: TaCYP44 (6A), TaCYP49 (6B), and TaCYP54 (6D). It has been validated that the AtROC1 modulates the immunity specified by R proteins NLRs, RPM1 and RPS2 and concludes that prolyl-peptidyl isomerase activity is required for immune response regulation (Trupkin et al., 2012; Li et al., 2014). Additionally, it has been confirmed that effector AvrRpt2 is activated by binding of host CYP that results in proper folding of AvrRpt2 by virtue of prolyl isomerization catalyzed by host CYP. Activation of AvrRpt2 leads to the cleavage of RIN4, which further activates RPS2 (R protein) and the subsequent orchestration of defense responses (Day et al., 2005). Therefore, the function of the CYP homeologues on chromosome six can be linked to their involvement in leaf rust resistance.
The miRNA targeting wheat TaCYP search resulted in the identification of miR1137 targeting TaCYP24. The role of isomiRs of the miR1137 family has also been reported in targeting anthranilate synthase (AS) (Ravichandran et al., 2019), which helps to catalyze the first reaction branching from the AAA pathway (aromatic amino acid pathway of plants, fungi, and bacteria) toward the biosynthesis of tryptophan and has been studied for its role against pathogens and herbivores. An increase in steady-state AS mRNA levels during/after infiltration helps in the production of secondary metabolites and provides resistance against bacterial pathogen infection (Pal and Gardener 2006; Pusztahelyi et al., 2015). In view of the above, it has been suggested that the low expression of miR1137 in resistant varieties results in a higher accumulation of the target gene TaCYP24, TaCYP31, and TaCYP36 transcripts. Furthermore, miR1137 is downregulated during stripe rust infection in resistant lines (Ramachandran et al., 2020), supporting that the expression of these genes could be regulated through miR1137. However, further study needs to be conducted to explore the detailed role of miR1137 during leaf rust resistance.
ROS production is often the earliest manifestation of the host defense response (Wojtaszek 1997; Dietz et al., 2016; Sewelam et al., 2016). Several studies have suggested that plant-derived ROS generated by membrane-bound Nox and apoplast-secreted peroxidase are involved in the host defense response to cereal rust fungi (Fofana et al., 2007; Dmochowska-Boguta et al., 2013). Our results on SOR localization in response to leaf rust showed maximum accumulation at 72 HAI. In an earlier study, the localization of SOR was observed in the case of the incompatible race but not in the compatible race (Doke, 1983). A recent study demonstrated that Puccinia triticina (Pt) generates ROS, and ROS are critical in the virulence of the wheat leaf rust fungus Puccinia triticina (Wang et al., 2020). The upregulated TaCYP24/31/36 genes also showed maximum expression at 72 HAI. Additionally, an earlier study showed that overexpression of CMPG1–V (in transgenic wheat) provided resistance against powdery mildew in wheat and was associated with an increase in the expression of H2O2 accumulation (Zhu et al., 2015). Previously, the overexpression of AtCYP19 was reported to be involved in ROS production (Olejnik et al., 2021). The fact that the TaCYP genes (TaCYP24, TaCYP31, and TaCYP36) grouped with AtCYP19 in the current study displayed upregulation at 72 HAI compared to 24 HAI suggests that these genes play a role in the control of ROS during rust infection. On the other hand, the ROC1/AtCYP18-3 orthologous gene in wheat [TaCYP44 (6A), TaCYP49 (6B), and TaCYP54 (6D) showed a downregulated expression pattern], confirming the negative regulation of these CYP genes during wheat rust interaction. The correlation of TaCYP gene expression and ROS accumulation at 24 HAI and 72 HAI after inoculation in TR and CS indicates a significant association (Supplementary Figures S5A,B). For example, as depicted in the correlation heatmap, the expression of most of the downregulated TaCYPs showed a positive correlation with H2O2 and SOR accumulation in CS and a negative correlation in TR.
5 Conclusion
In the present study, we report genome-wide analysis to identify the role of TaCYP genes against wheat leaf rust. The TaCYP24/31/36 genes located on homoeologous chromosome 4, were maximally upregulated in the leaf rust resistant line compared to the susceptible line and will be potential targets for further validation and molecular breeding approaches. Also the current presents a significant correlation of CYPs gene expression nad and the accumulation of SOR and H2O2 during leaf rust infection in wheat. The current findings significantly extend previous conclusions about the role of CYP genes and reveal their critical role in minimizing the effect of leaf rust disease in the world’s second most important cereal crop.
Data availability statement
The original contributions presented in the study are included in the article/Supplementary Material, further inquiries can be directed to the corresponding authors.
Author contributions
ST and SJ conceptualized and curated the data. AK, RB, DH, and LS helped in methodology. ST and AK analyzed the data and prepared the manuscript. GS, NM, SJ, VC, LS, RM, and V revised the manuscript. All authors read and approved the manuscript.
Funding
ST acknowledges receipt of funding support from NAHEP of ICAR and World Bank.
Conflict of interest
The authors declare that the research was conducted in the absence of any commercial or financial relationships that could be construed as a potential conflict of interest.
Publisher’s note
All claims expressed in this article are solely those of the authors and do not necessarily represent those of their affiliated organizations, or those of the publisher, the editors and the reviewers. Any product that may be evaluated in this article, or claim that may be made by its manufacturer, is not guaranteed or endorsed by the publisher.
Supplementary material
The Supplementary Material for this article can be found online at: https://www.frontiersin.org/articles/10.3389/fgene.2022.972474/full#supplementary-material
References
Ahn, J. C., Kim, D. W., You, Y. N., Seok, M. S., Park, J. M., Hwang, H., et al. (2010). Classification of rice (Oryza sativa L. Japonica nipponbare) immunophilins (FKBPs, CYPs) and expression patterns under water stress. BMC Plant Biol. 10 (1), 253. doi:10.1186/1471-2229-10-253
Altschul, S. F., Madden, T. L., Schäffer, A. A., Zhang, J., Zhang, Z., Miller, W., et al. (1997). Gapped BLAST and PSI-BLAST: A new generation of protein database search programs. Nucleic Acids Res. 25 (17), 3389–3402. doi:10.1093/nar/25.17.3389
Aoun, M., Kolmer, J. A., Rouse, M. N., Elias, E. M., Breiland, M., Bulbula, W. D., et al. (2019). Mapping of novel leaf rust and stem rust resistance genes in the Portuguese durum wheat landrace PI 192051. G3 9 (8), 2535–2547. doi:10.1534/g3.119.400292
Arnold, K., Bordoli, L., Kopp, J., and Schwede, T. (2006). The SWISS-model workspace: A web-based environment for protein structure homology modelling. Bioinformatics 22 (2), 195–201. doi:10.1093/BIOINFORMATICS/BTI770
Bailey, T. L., Boden, M., Buske, F. A., Frith, M., Grant, C. E., Clementi, L., et al. (2009). Meme suite: Tools for motif discovery and searching. Nucleic Acids Res. 37, W202–W208. doi:10.1093/nar/gkp335
Bailey, T. L., Johnson, J., Grant, C. E., and Noble, W. S. (2015). The MEME suite. Nucleic Acids Res. 43, W39–W49. doi:10.1093/nar/gkv416
Bari, R., and Jones, J. D. G. (2009). Role of plant hormones in plant defence responses. Plant Mol. Biol. 69 (4), 473–488. doi:10.1007/s11103-008-9435-0
Biasini, M., Bienert, S., Waterhouse, A., Arnold, K., Studer, G., Schmidt, T., et al. (2014). SWISS-MODEL: Modelling protein tertiary and quaternary structure using evolutionary information. Nucleic Acids Res. 42, W252–W258. doi:10.1093/nar/gku340
Chaitanya, K. S. K., and Naithani, S. C. (1994). Role of superoxide, lipid peroxidation and superoxide dismutase in membrane perturbation during loss of viability in seeds of Shorea robusta Gaertn. F. New Phytol. 126 (4), 623–627. doi:10.1111/j.1469-8137.1994.tb02957.x
Chen, Q., Chen, Q. J., Sun, G. Q., Zheng, K., Yao, Z. P., Han, Y. H., et al. (2019). Genome-wide identification of cyclophilin gene family in cotton and expression analysis of the fibre development in Gossypium barbadense. Int. J. Mol. Sci. 20 (2), 349. doi:10.3390/ijms20020349
Cloutier, S., McCallum, B. D., Loutre, C., Banks, T. W., Wicker, T., Feuillet, C., et al. (2007). Leaf rust resistance gene Lr1, isolated from bread wheat (Triticum aestivum L.) is a member of the large psr567 gene family. Plant Mol. Biol. 65 (1–2), 93–106. doi:10.1007/s11103-007-9201-8
Coaker, G., Falick, A., and Staskawicz, B. (2005). Activation of a phytopathogenic bacterial effector protein by a eukaryotic cyclophilin. Science 308 (5721), 548–550. doi:10.1126/science.1108633
Dai, X., and Zhao, P. X. (2011). psRNATarget: a plant small RNA target analysis server. Nucleic Acids Res. 39, W155–W159. doi:10.1093/NAR/GKR319
Day, B., Dahlbeck, D., Huang, J., Chisholm, S. T., Li, D., and Staskawicz, B. J. (2005). Molecular basis for the RIN4 negative regulation of RPS2 disease resistance. Plant Cell 17 (4), 1292–1305. doi:10.1105/tpc.104.030163
Dhariwal, R., Vyas, S., Bhaganagare, G. R., Jha, S. K., Khurana, J. P., Tyagi, A. K., et al. (2011). Analysis of differentially expressed genes in leaf rust infected bread wheat involving seedling resistance gene Lr28. Funct. Plant Biol. 38 (6), 479–492. doi:10.1071/FP10246
Dietz, K.-J., Mittler, R., and Noctor, G. (2016). Recent progress in understanding the role of reactive oxygen species in plant cell signaling. Plant Physiol. 171 (3), 1535–1539. doi:10.1104/pp.16.00938
Dmochowska-Boguta, M., Nadolska-Orczyk, A., and Orczyk, W. (2013). Roles of peroxidases and NADPH oxidases in the oxidative response of wheat (Triticum aestivum) to Brown rust (Puccinia triticina) infection. Plant Pathol. 62 (5), 993–1002. doi:10.1111/ppa.12009
Doke, N. (1983). Involvement of superoxide anion generation in the hypersensitive response of potato tuber tissues to infection with an incompatible race of Phytophthora infestans and to the hyphal wall components. Physiol. Plant Pathol. 23 (3), 345–357. doi:10.1016/0048-4059(83)90019-x
Felsenstein, J. (1985). Confidence limits on phylogenies: An approach using the bootstrap. Evolution 39 (4), 783–791. doi:10.1111/j.1558-5646.1985.tb00420.x
Feuillet, C., Travella, S., Stein, N., Albar, L., Nublat, A., and Keller, B. (2003). Map-based isolation of the leaf rust disease resistance gene Lr10 from the hexaploid wheat (Triticum aestivum L.) genome. Proc. Natl. Acad. Sci. U. S. A. 100 (25), 15253–15258. doi:10.1073/pnas.2435133100
Finn, R. D., Attwood, T. K., Babbitt, P. C., Bateman, A., Bork, P., Bridge, A. J., et al. (2017). InterPro in 2017—Beyond protein family and domain annotations. Nucleic Acids Res. 45, D190–D199. doi:10.1093/nar/gkw1107
Fofana, B., Banks, T. W., McCallum, B., Strelkov, S. E., and Cloutier, S. (2007). Temporal gene expression profiling of the wheat leaf rust pathosystem using cDNA microarray reveals differences in compatible and incompatible defence pathways. Int. J. Plant Genomics 2007, 17542. doi:10.1155/2007/17542
Friendly, M. (2002). Corrgrams: Exploratory displays for correlation matrices. Am. Statistician 56 (4), 316–324. doi:10.1198/000313002533
Gan, P. H. P., Shan, W., Blackman, L. M., and Hardham, A. R. (2009). Characterization of cyclophilin-encoding genes in Phytophthora. Mol. Genet. Genomics 281 (5), 565–578. doi:10.1007/s00438-009-0431-0
Gasser, C. S., Gunning, D. A., Budelier, K. A., and Brown, S. M. (1990). Structure and expression of cytosolic cyclophilin/peptidyl-prolyl cis-trans isomerase of higher plants and production of active tomato cyclophilin in Escherichia coli. Proc. Natl. Acad. Sci. U. S. A. 87 (24), 9519–9523. doi:10.1073/pnas.87.24.9519
Gasteiger, E., Hoogland, C., Gattiker, A., Duvaud, S., Wilkins, M. R., Appel, R. D., et al. (2005). “Protein identification and analysis tools on the ExPASy server,” in The proteomics protocols handbook (New Jersey, United States: Humana Press), 571–607. doi:10.1385/1-59259-890-0:571
Gautam, T., Saripalli, G., Gahlaut, V., Kumar, A., Sharma, P. K., Balyan, H. S., et al. (2019). Further studies on sugar transporter (SWEET) genes in wheat (Triticum aestivum L.). Mol. Biol. Rep. 46 (2), 2327–2353. doi:10.1007/s11033-019-04691-0
Gething, M.-J. (1997). Guidebook to molecular chaperones and protein-folding catalysts. Oxford, United Kingdom: Oxford University Press, 554.
Godoy, A. V., Lazzaro, A. S., Casalongué, C. A., and San Segundo, B. (2000). Expression of a Solanum tuberosum cyclophilin gene is regulated by fungal infection and abiotic stress conditions. Plant Sci. 152 (2), 123–134. doi:10.1016/S0168-9452(99)00211-3
Harding, M. W., Galat, A., Uehling, D. E., and Schreiber, S. L. (1989). A receptor for the immuno-suppressant FK506 is a cis-trans peptidyl-prolyl isomerase. Nature 341 (6244), 758–760. doi:10.1038/341758a0
Holt, B. F., Belkhadir, Y., and Dangl, J. L. (2005). Antagonistic control of disease resistance protein stability in the plant immune system. Science 309 (5736), 929–932. doi:10.1126/science.1109977
Hu, B., Jin, J., Guo, A.-Y., Zhang, H., Luo, J., and Gao, G. (2015). Gsds 2.0: An upgraded gene feature visualization server. Bioinformatics 31 (8), 1296–1297. doi:10.1093/bioinformatics/btu817
Huang, L., Brooks, S. A., Li, W., Fellers, J. P., Trick, H. N., and Gill, B. S. (2003). Map-based cloning of leaf rust resistance gene Lr21 from the large and polyploid genome of bread wheat. Genetics 164 (2), 655–664. doi:10.1093/genetics/164.2.655
Huerta-Espino, J., Singh, R. P., German, S., McCallum, B. D., Park, R. F., Chen, W. Q., et al. (2011). Global status of wheat leaf rust caused by Puccinia triticina. Euphytica 179 (1), 143–160. doi:10.1007/s10681-011-0361-x
Krattinger, S. G., Kang, J., Bräunlich, S., Boni, R., Chauhan, H., Selter, L. L., et al. (2019). Abscisic acid is a substrate of the ABC transporter encoded by the durable wheat disease resistance gene Lr34. New Phytol. 223 (2), 853–866. doi:10.1111/NPH.15815
Kumar, A., Kumar, S., Kumar, U., Suravajhala, P., and Gajula, M. N. V. P. (2016). Functional and structural insights into novel DREB1A transcription factors in common wheat (Triticum aestivum L.): A molecular modeling approach. Comput. Biol. Chem. 64, 217–226. doi:10.1016/j.compbiolchem.2016.07.008
Kumar, A., Sharma, M., Gahlaut, V., Nagaraju, M., Chaudhary, S., Kumar, A., et al. (2019). Genome-wide identification, characterization, and expression profiling of SPX gene family in wheat. Int. J. Biol. Macromol., 140, 17–32. doi:10.1016/j.ijbiomac.2019.08.105
Li, M., Ma, X., Chiang, Y.-H., Yadeta, K. A., Ding, P., Dong, L., et al. (2014). Proline isomerization of the immune receptor-interacting protein RIN4 by a cyclophilin inhibits effector-triggered immunity in Arabidopsis. Cell Host Microbe 16 (4), 473–483. doi:10.1016/j.chom.2014.09.007
Mainali, H. R., Chapman, P., and Dhaubhadel, S. (2014). Genome-wide analysis of Cyclophilin gene family in soybean (Glycine max). BMC Plant Biol. 14 (1), 282–311. doi:10.1186/s12870-014-0282-7
Marivet, J., Frendo, P., and Burkard, G. (1992). Effects of abiotic stresses on cyclophilin gene expression in maize and bean and sequence analysis of bean cyclophilin cDNA. Plant Sci. 84 (2), 171–178. doi:10.1016/0168-9452(92)90131-5
Mathpal, D. (2021). An analysis of proteomics and its applications. Asian J. Multidimensional Res. 10 (10), 633–640. doi:10.5958/2278-4853.2021.00861.2
Mcintosh, R. A., Dubcovsky, J., Rogers, W. J., Morris, C., Appels, R., and Xia, X. C. (2014). Catalogue of gene symbols for wheat: 2013–2014 supplement. http://www.shigen.nig.ac.jp/wheat/komugi/genes/macgene/supplement2013.pdf(2014) (Accessed January 20, 2015).
Moore, J. W., Herrera-Foessel, S., Lan, C., Schnippenkoetter, W., Ayliffe, M., Huerta-Espino, J., et al. (2015). A recently evolved hexose transporter variant confers resistance to multiple pathogens in wheat. Nat. Genet. 47 (12), 1494–1498. doi:10.1038/ng.3439
Mozhui, K., Ciobanu, D. C., Schikorski, T., Wang, X., Lu, L., and Williams, R. W. (2008). Dissection of a QTL hotspot on mouse distal chromosome 1 that modulates neurobehavioral phenotypes and gene expression. PLoS Genet. 4 (11), e1000260. doi:10.1371/journal.pgen.1000260
Olejnik, P., M\kadrzak, C. J., and Nuc, K. (2021). Cyclophilins and their functions in abiotic stress and plant-microbe interactions. Biomolecules 11 (9), 1390. doi:10.3390/biom11091390
Pal, K. K., and McSpadden Gardener, B. (2006). Biological control of plant pathogens. The Plant Health Instructor. doi:10.1094/PHI-A-2006-1117-02
Pandian, B. A., Sathishraj, R., Djanaguiraman, M., Prasad, P. V., and Jugulam, M. (2020). Role of cytochrome P450 enzymes in plant stress response. Antioxidants 9 (5), 454. doi:10.3390/antiox9050454
Pemberton, T. J., and Kay, J. E. (2005). The cyclophilin repertoire of the fission yeast Schizosaccharomyces pombe. Yeast 22, 927–945. doi:10.1002/yea.1288
Pettersen, E. F., Goddard, T. D., Huang, C. C., Couch, G. S., Greenblatt, D. M., Meng, E. C., et al. (2004). UCSF chimera—A visualization system for exploratory research and analysis. J. Comput. Chem. 25 (13), 1605–1612. doi:10.1002/jcc.20084
Pogorelko, G. V., Mokryakova, M., Fursova, O. V., Abdeeva, I., Piruzian, E. S., and Bruskin, S. A. (2014). Characterization of three Arabidopsis thaliana immunophilin genes involved in the plant defense response against Pseudomonas syringae. Gene 538 (1), 12–22. doi:10.1016/j.gene.2014.01.029
Prabhu, K. V., Gupta, S. K., Charpe, A., Koul, S., Cherukuri, D. P., Dhaliwal, H. S., et al. (2012). Molecular markers detect redundancy and miss-identity in genetic stocks with alien leaf rust resistance genes Lr32 and Lr28 in bread wheat. J. Plant Biochem. Biotechnol. 12 (2), 123–129. doi:10.1007/BF03263172
Pusztahelyi, T., Holb, I. J., and Pócsi, I. (2015). Secondary metabolites in fungus-plant interactions. Front. Plant Sci. 6, 573. doi:10.3389/fpls.2015.00573
Qiao, M., Sun, J., Liu, N., Sun, T., Liu, G., Han, S., et al. (2015). Changes of nitric oxide and its relationship with H2O2 and Ca2+ in defense interactions between wheat and Puccinia triticina. PLOS ONE 10 (7), e0132265. doi:10.1371/journal.pone.0132265
Qiu, L., Wang, H., Li, Y., Wang, W., Liu, Y., Mu, J., et al. (2020). Fine mapping of the wheat leaf rust resistance gene LrLC10 (Lr13) and validation of its co-segregation markers. Front. Plant Sci. 11, 470. doi:10.3389/fpls.2020.00470
Ramachandran, S. R., Mueth, N. A., Zheng, P., and Hulbert, S. H. (2020). Analysis of miRNAs in two wheat cultivars infected with Puccinia striiformis f. sp. tritici. Front. Plant Sci. 10, 1574. doi:10.3389/fpls.2019.01574
Rao, M. V., Paliyath, G., Ormrod, D. P., Murr, D. P., and Watkins, C. B. (1997). Influence of salicylic acid on H2O2 production, oxidative stress, and H2O2-metabolizing enzymes. Salicylic acid-mediated oxidative damage requires H2O2. Plant Physiol. 115 (1), 137–149. doi:10.1104/pp.115.1.137
Ravichandran, S., Ragupathy, R., Edwards, T., Domaratzki, M., and Cloutier, S. (2019). MicroRNA-guided regulation of heat stress response in wheat. BMC Genomics 20 (1), 488–516. doi:10.1186/s12864-019-5799-6
Robles, P., and Quesada, V. (2021). Organelle genetics in plants. Int. J. Mol. Sci. 22, 2104. doi:10.3390/ijms22042104
Romano, P. G. N., Horton, P., and Gray, J. E. (2004). The arabidopsis cyclophilin gene family. Plant Physiol. 134 (4), 1268–1282. doi:10.1104/pp.103.022160
Saitou, N., and Nei, M. (1987). The neighbor-joining method: A new method for reconstructing phylogenetic trees. Mol. Biol. Evol. 4 (4), 406–425. doi:10.1093/OXFORDJOURNALS.MOLBEV.A040454
Savojardo, C., Martelli, P. L., Fariselli, P., Profiti, G., and Casadio, R. (2018). Busca: An integrative web server to predict subcellular localization of proteins. Nucleic Acids Res. 46 (W1), W459–W466. doi:10.1093/nar/gky320
Sears, E. R. (1956). “The transfer of leaf-rust resistance from Aegilops umbellulata to wheat,” in Brookhaven symp in biol. No. 9, genetics in plant breeding, 1–22.
Sewelam, N., Kazan, K., and Schenk, P. M. (2016). Global plant stress signaling: Reactive oxygen species at the cross-road. Front. Plant Sci. 7, 187. doi:10.3389/fpls.2016.00187
Shannon, P., Markiel, A., Ozier, O., Baliga, N. S., Wang, J. T., Ramage, D., et al. (2003). Cytoscape: A software environment for integrated models of biomolecular interaction networks. Genome Res. 13 (11), 2498–2504. doi:10.1101/GR.1239303
Sigrist, C. J. A., De Castro, E., Cerutti, L., Cuche, B. A., Hulo, N., Bridge, A., et al. (2012). New and continuing developments at PROSITE. Nucleic Acids Res. 41 (D1), D344–D347. doi:10.1093/nar/gks1067
Singh, A., Lim, G. H., and Kachroo, P. (2017). Transport of chemical signals in systemic acquired resistance. J. Integr. Plant Biol. 59, 336–344. doi:10.1111/jipb.12537
Singh, H., Kaur, K., Singh, S., Kaur, P., and Singh, P. (2019). Genome-wide analysis of cyclophilin gene family in wheat and identification of heat stress responsive members. Plant gene.. 19, 100197. doi:10.1016/j.plgene.2019.100197
Singh, K., Zouhar, M., Mazakova, J., and Rysanek, P. (2014). Genome wide identification of the immunophilin gene family in Leptosphaeria maculans: A causal agent of blackleg disease in oilseed rape (Brassica napus). OMICS A J. Integr. Biol. 18 (10), 645–657. doi:10.1089/omi.2014.0081
Thind, A. K., Wicker, T., Šimková, H., Fossati, D., Moullet, O., Brabant, C., et al. (2017). Rapid cloning of genes in hexaploid wheat using cultivar-specific long-range chromosome assembly. Nat. Biotechnol. 35 (8), 793–796. doi:10.1038/nbt.3877
Thomas D Schmittgen, K. J. L., and Livak, K. J. (2008). Analyzing real-time PCR data by the comparative CT method. Nat. Protoc. 3 (6), 1101–1108. doi:10.1038/nprot.2008.73
Trupkin, S. A., Mora-Garc\’\ia, S., and Casal, J. J. (2012). The cyclophilin ROC1 links phytochrome and cryptochrome to brassinosteroid sensitivity. Plant J. 71 (5), 712–723. doi:10.1111/j.1365-313X.2012.05013.x
Wang, X., Che, M. Z., Khalil, H. B., McCallum, B. D., Bakkeren, G., Rampitsch, C., et al. (2020). The role of reactive oxygen species in the virulence of wheat leaf rust fungus Puccinia triticina. Environ. Microbiol. 22 (7), 2956–2967. doi:10.1111/1462-2920.15063
Wasternack, C., and Strnad, M. (2016). Jasmonate signaling in plant stress responses and development-active and inactive compounds. N. Biotechnol. 33 (5), 604–613. doi:10.1016/j.nbt.2015.11.001
Wilson, R. A., and Talbot, N. J. (2009). Under pressure: Investigating the biology of plant infection by Magnaporthe oryzae. Nat. Rev. Microbiol. 7 (3), 185–195. doi:10.1038/nrmicro2032
Wojtaszek, P. (1997). Oxidative burst: An early plant response to pathogen infection. Biochem. J. 322 (3), 681–692. doi:10.1042/bj3220681
Yan, Q., Cui, X., Lin, S., Gan, S., Xing, H., and Dou, D. (2016). GmCYP82A3, a soybean cytochrome P450 family gene involved in the jasmonic acid and ethylene signaling pathway, enhances plant resistance to biotic and abiotic stresses. PloS One 11 (9), e0162253. doi:10.1371/journal.pone.0162253
Keywords: bread wheat, genome-wide identification, cyclophilin, leaf rust resistance, reactive oxygen species
Citation: Tyagi S, Jha SK, Kumar A, Saripalli G, Bhurta R, Hurali DT, Sathee L, Mallick N, Mir RR, Chinnusamy V and Vinod (2022) Genome-wide characterization and identification of cyclophilin genes associated with leaf rust resistance in bread wheat (Triticum aestivum L.). Front. Genet. 13:972474. doi: 10.3389/fgene.2022.972474
Received: 18 June 2022; Accepted: 31 August 2022;
Published: 30 September 2022.
Edited by:
Sunil S. Gangurde, University of Georgia, United StatesReviewed by:
Javaid Akhter Bhat, Nanjing Agricultural University, ChinaPrashant Raghunath Shingote, Dr. Panjabrao Deshmukh Krishi Vidyapeeth, India
Nisha Singh, Gujarat Biotechnology University, India
Copyright © 2022 Tyagi, Jha, Kumar, Saripalli, Bhurta, Hurali, Sathee, Mallick, Mir, Chinnusamy and Vinod. This is an open-access article distributed under the terms of the Creative Commons Attribution License (CC BY). The use, distribution or reproduction in other forums is permitted, provided the original author(s) and the copyright owner(s) are credited and that the original publication in this journal is cited, in accordance with accepted academic practice. No use, distribution or reproduction is permitted which does not comply with these terms.
*Correspondence: Shailendra Kumar Jha, amhhc2hhaWw3OEBnbWFpbC5jb20=; Vinod, dmlub2QuZ2VuZXRpY3NAZ21haWwuY29t