 Xueqin Zhang
 Peng Chao2†
 Gulimire Muhetaer
- 1Department of Nephrology, People’s Hospital of Xinjiang Uygur Autonomous Region, Urumqi, China
- 2Department of Cardiology, People’s Hospital of Xinjiang Uygur Autonomous Region, Urumqi, China
- 3Department of Nephrology, The First Affiliated Hospital of Xinjiang Medical University, Urumqi, China
Objective: RNA-binding proteins (RBPs) are essential for most post-transcriptional regulatory events, which exert critical roles in nearly all aspects of cell biology. Here, characteristic RBPs of IgA nephropathy were determined with multiple machine learning algorithms.
Methods: Our study included three gene expression datasets of IgA nephropathy (GSE37460, GSE73953, GSE93798). Differential expression of RBPs between IgA nephropathy and normal samples was analyzed via limma, and hub RBPs were determined through MCODE. Afterwards, three machine learning algorithms (LASSO, SVM-RFE, random forest) were integrated to determine characteristic RBPs, which were verified in the Nephroseq database. Immune cell infiltrations were estimated through CIBERSORT. Utilizing ConsensusClusterPlus, IgA nephropathy were classified based on hub RBPs. The potential upstream miRNAs were predicted.
Results: Among 388 RBPs with differential expression, 43 hub RBPs were determined. After integration of three machine learning algorithms, three characteristic RBPs were finally identified (DDX27, RCL1, and TFB2M). All of them were down-regulated in IgA nephropathy than normal specimens, with the excellent diagnostic efficacy. Additionally, they were significantly linked to immune cell infiltrations, immune checkpoints, and pyroptosis-relevant genes. Based on hub RBPs, IgA nephropathy was stably classified as two subtypes (cluster 1 and 2). Cluster 1 exhibited the relatively high expression of pyroptosis-relevant genes and characteristic RBPs. MiR-501-3p, miR-760, miR-502-3p, miR-1224-5p, and miR-107 were potential upstream miRNAs of hub RBPs.
Conclusion: Collectively, our findings determine three characteristic RBPs in IgA nephropathy and two RBPs-based subtypes, and thus provide a certain basis for further research on the diagnosis and pathogenesis of IgA nephropathy.
Introduction
Immunoglobulin A (IgA) nephropathy is the most frequent form of primary glomerulonephritis globally (Moldoveanu et al., 2021). About one-third of IgA nephropathy patients will develop end-stage renal disease within 20 years after diagnosis by kidney biopsy (Zeng et al., 2021). IgA nephropathy has been an important cause of end-stage renal disease among young adults. The predominant histological characteristics are immune deposits dominated by granular diffuse IgA (primarily comprising polymeric IgA1) in the mesangial region, usually linked to increased mesangial cells along with matrix expansion (Xie et al., 2021). In China, IgA nephropathy occupies 45.26% of primary glomerular diseases, and remains the most common cause of uremia (26.69%) (Li Y. et al., 2021). Currently, the comprehension of the pathophysiology of IgA nephropathy remains undefined, which involves multiple potential players (composed of mucosal immune system, complement system, microbiome, etc.) (Suzuki and Novak, 2021). Nevertheless, the absence of gene models to diagnose IgA nephropathy limits personalized risk-based therapeutic options.
RNA binding proteins (RBPs) exert critical roles in nearly all aspects of cell biology (Sternburg and Karginov, 2020). They orchestrate post-transcriptional regulatory events of gene expression (messenger RNA (mRNA) splicing, RNA stability, translation, etc.) (Wu and Xu, 2022). RBPs act as repressors or activators when interacting with mRNAs, and their binding sites are broad ranging from 5′-UTR to 3′-UTR. The most updated human RBP catalog comprises of 1,542 genes (Supplementary Table S1). Several RBPs have been proven to correlate with innate immune response and various programmed cell death types especially pyroptosis (Zheng and Kanneganti, 2020). Altered expression and dysfunctions of RBPs result in IgA nephropathy progression (Hahn et al., 2010; Wu et al., 2020). In the present study, three machine learning algorithms (LASSO, SVM-RFE, random forest) were integrated to determine characteristic RBPs in IgA nephropathy as well as developed two RBPs-based subtypes, offering a certain basis for further research on the diagnosis and pathogenesis of IgA nephropathy. Figure 1 illustrates the overall design of our study.
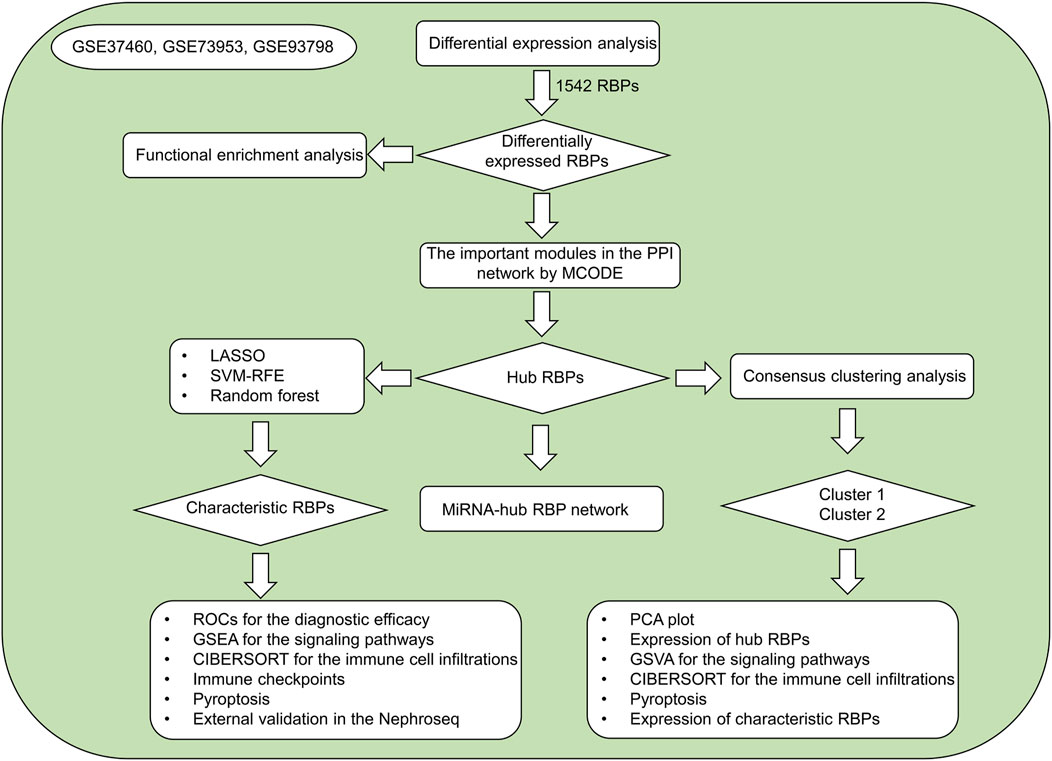
FIGURE 1. The overall flowchart of our study.
Materials and methods
Data collection
This study retrospectively included four gene expression datasets of IgA nephropathy from the Gene Expression Omnibus (GEO) repository (https://www.ncbi.nlm.nih.gov/gds/), including GSE37460 (Guo et al., 2019), GSE73953 (Nagasawa et al., 2016), and GSE93798 (Liu et al., 2017). The raw transcriptomic data from the Affymetrix platform were pre-processed with robust multiarray averaging method derived from Affy package (Gautier et al., 2004). The batch effects from different datasets were eliminated by ComBat method from surrogate variable analysis (sva) package (Leek et al., 2012). Figures 2A,B depicted the principal component analysis (PCA) before and after batch correction. Probe IDs were mapped to gene symbols on the basis of the corresponding annotation files, and the expression values of all probes matching the same gene were averaged as the final value. Additionally, we retrieved microRNA (miRNA) expression profiling of IgA nephropathy from GSE25590 dataset (Serino et al., 2012).
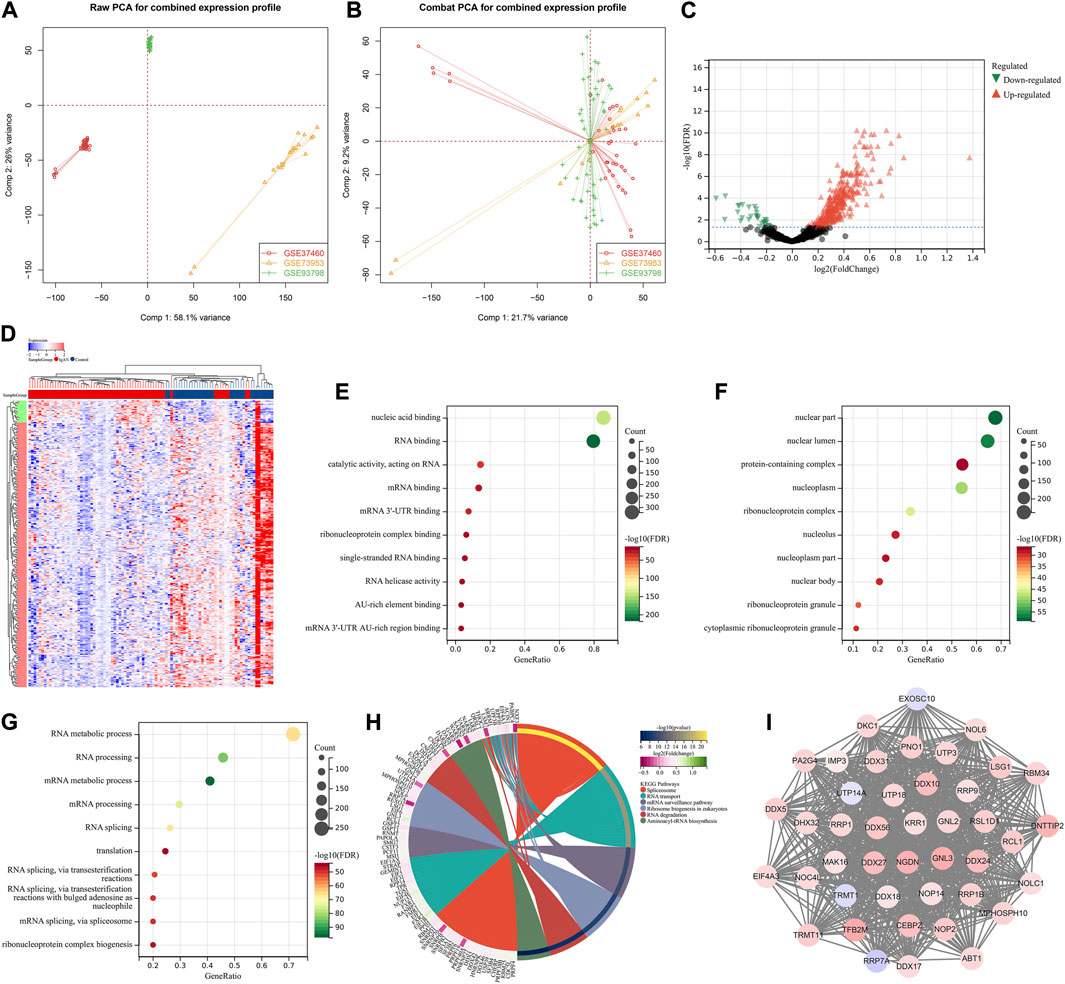
FIGURE 2. Identification of hub RBPs in IgA nephropathy. (A, B) PCA plots for combined transcriptomic profiling of GSE37460, GSE73953, and GSE93798 datasets before and after batch correction. (C) Volcano diagram for the up- and down-regulated RBPs in IgA nephropathy than normal samples. Red, up-regulated RBPs; black, not significant RBPs; green, down-regulated RBPs. (D) Heatmap of the differential expression of RBPs in IgA nephropathy and normal samples. Red, up-regulation; blue, down-regulation. (E–G) The top ten biological processes, cellular components, and molecular functions significantly enriched by RBPs with differential expression. (H) KEGG pathways significantly enriched by RBPs with differential expression. (I) The important module derived from PPI network of RBPs with differential expression. IgAN, IgA nephropathy.
Identification of RBPs with differential expression
Differential expression of RBPs between IgA nephropathy and normal samples was analyzed through linear models for microarray data (limma) (Ritchie et al., 2015). False discovery rate (FDR)<0.05 was set as the cut-off criterion. Gene Ontology (GO) and Kyoto Encyclopedia of Genes and Genomes (KEGG) pathway enrichment analysis of RBPs with differential expression was executed utilizing clusterProfiler package (Yu et al., 2012).
Analysis of protein-protein interaction (PPI)
Interaction between RBPs with differential expression was probed utilizing the Search Tool for the Retrieval of Interacting Genes (STRING) online database according to the default criteria. Through Cytoscape plugin Molecular Complex Detection (MCODE), the important modules in the PPI network were visualized, and the hub RBPs were identified for subsequent analysis (Shannon et al., 2003).
Screening characteristic RBPs
Three machine learning algorithms were applied for selecting characteristic RBPs. Hub RBPs were utilized for establishing a penalized multivariate Cox proportional hazard survival model through variable selection on the basis of L1-penalized Least Absolute Shrinkage and Selection Operator (LASSO) regression approach from glmnet package, with 10-fold cross-validation (Goeman, 2010). Support Vector Machine-Recursive Feature Elimination (SVM-RFE) method was employed to search for lambda with the smallest classification error to determine the variables. Random forest algorithm was implemented for generating decision tree forest with 10-fold cross-validation. Characteristic RBPs analyzed by above algorithms were intersected.
Gene set enrichment analysis (GSEA)
GSEA was executed for determining the significant functional terms between groups (Subramanian et al., 2005). The “c2. cp.kegg.v7.5. symbols.gmt” was downloaded from the Molecular Signatures Database (MSigDB), as the reference gene set (Liberzon et al., 2015). The gene set was regarded as significant enrichment if FDR<0.05.
Estimation of immune cell infiltrations and immune checkpoints
CIBERSORT, a deconvolution algorithm, was execute to quantify 24 immune cell types via applying 547 gene expression signatures (Newman et al., 2015). The permutations were set as 100. Samples with p < 0.05 reflected that the deconvolution results were relatively reliable, which were included for subsequent analysis. We also collected common immune checkpoints from published literature (IDO1, LAG3, CTLA4, TNFRSF9, ICOS, CD80, PDCD1LG2, CD70, TNFSF9, KIR3DL1, CD86, PDCD1, LAIR1, TNFRSF8, TNFSF15, TNFRSF14, CD40, TNFRSF4, TNFSF14, HHLA2, CD244, CD27, LGALS9, CD28, CD48, TNFRSF25, CD40LG, VTCN1, CD160, CD44, TNFSF18, BTNL2, TNFSF4, CD200, and NRP1.
Consensus clustering analysis
Through ConsensusClusterPlus package (Wilkerson and Hayes, 2010), a consistency matrix of IgA nephropathy samples was established based on the expression profiling of hub RBPs according to item subsampling = 0.8, feature subsampling = 0.8, distance = 1—Pearson correlation, iteration = 1,000, and the maximum k value = 9. The optimal number of clusters was determined through consensus CDF, tracking plot, and consensus matrix. Principal component analysis (PCA) was conducted to verify this classification.
Gene set variation analysis (GSVA)
A single sample gene set enrichment analysis (ssGSEA) was executed for estimating the enrichment score of the specified gene signature utilizing GSVA package, with the “c2. cp.kegg.v7.5. symbols.gmt” as the reference gene set (Hänzelmann et al., 2013). The enrichment score was compared between subtypes via limma approach.
External validation
The expression of characteristic RBPs was externally verified in the Nephroseq database (http://v5.nephroseq.org/) that combines a large number of publicly available renal transcriptome profiling. Associations between characteristic RBPs and clinical features were also evaluated.
Establishment of a miRNA-hub RBP network
The Encyclopedia of RNA interactomes (ENCORI) integrates eight distinct databases for predicting miRNA-mRNA interactions. Here, four databases (Targetscan, PITA, PicTar, and miRanda) were utilized. MiRNAs were regarded as upstream miRNAs of hub RBPs if the results appeared in ≥2 databases. Afterwards, a miRNA-hub RBP network was visualized via cytoscape software.
Statistical analysis
All statistical analysis was executed with R software (version 3.6.3). Continuous variables that fit normal distribution between binary groups were compared utilizing student’s t-test. Otherwise, Mann-Whitney U test was carried out. Receiver operating characteristic curves (ROCs) were plotted to evaluate the diagnostic efficacy of characteristic RBPs in IgA nephropathy. Associations between variables were evaluated with Pearson or Spearman coefficients. The significance was set as p < 0.05, and all statistical tests were two-sided.
Results
Identification of hub RBPs in IgA nephropathy
A total of 388 RBPs with differential expression were identified according to FDR<0.05 (Figures 2C,D; Supplementary Table S2). GO enrichment results (nucleic acid binding, RNA binding, mRNA binding, AU-rich element binding, mRNA 3′-UTR binding, etc.) revealed the primary biological functions of these RBPs (Figures 2E–G). Additionally, spliceosome, RNA transport, mRNA surveillance pathway, ribosome biogenesis in eukaryotes, RNA degradation and aminoacyl-tRNA biosynthesis pathways were significantly enriched by these RBPs with differential expression (Figure 2H). A total of 43 hub RBPs were identified, including DDX56, UTP3, MPHOSPH10, DDX10, CEBPZ, TRMT11, NOP14, RRP9, PA2G4, NGDN, KRR1, UTP14A, MAK16, UTP18, DDX27, ABT1, DDX24, DNTTIP2, NOP2, IMP3, EXOSC10, DHX32, RRP1, RRP1B, TFB2M, GNL2, RRP7A, NOC4L, LSG1, DDX17, EIF4A3, GNL3, DKC1, RSL1D1, NOL6, DDX31, DDX5, TRMT1, NOLC1, RBM34, RCL1, PNO1, DDX18 (Figure 2I).
Identification of characteristic RBPs in IgA nephropathy via integrating three machine learning algorithms
Three machine learning algorithms were applied for identifying characteristic RBPs in IgA nephropathy. According to LASSO model, 15 characteristic genes were identified, composed of DDX56, DDX10, UTP14A, DDX27, DDX24, DNTTIP2, IMP3, EXOSC10, TFB2M, RRP7A, GNL3, RSL1D1, DDX31, TRMT1, and RCL1 (Figures 3A,B). SVM-RFE analysis identified 10 characteristic genes including TFB2M, RCL1, RSL1D1, RRP7A, DDX56, DDX27, NGDN, DDX24, TRMT1, and CEBPZ (Figure 3C). Additionally, three characteristic genes were determined based on random forest approach, comprising TFB2M, DDX27, and RCL1 (Figures 3D,E). After integration of above machine learning algorithms, we finally determined TFB2M, DDX27, and RCL1 as characteristic RBPs of IgA nephropathy (Figure 3F). Compared with normal specimens, TFB2M, DDX27, and RCL1 expressions were significantly down-regulated in IgA nephropathy (Figure 3G).
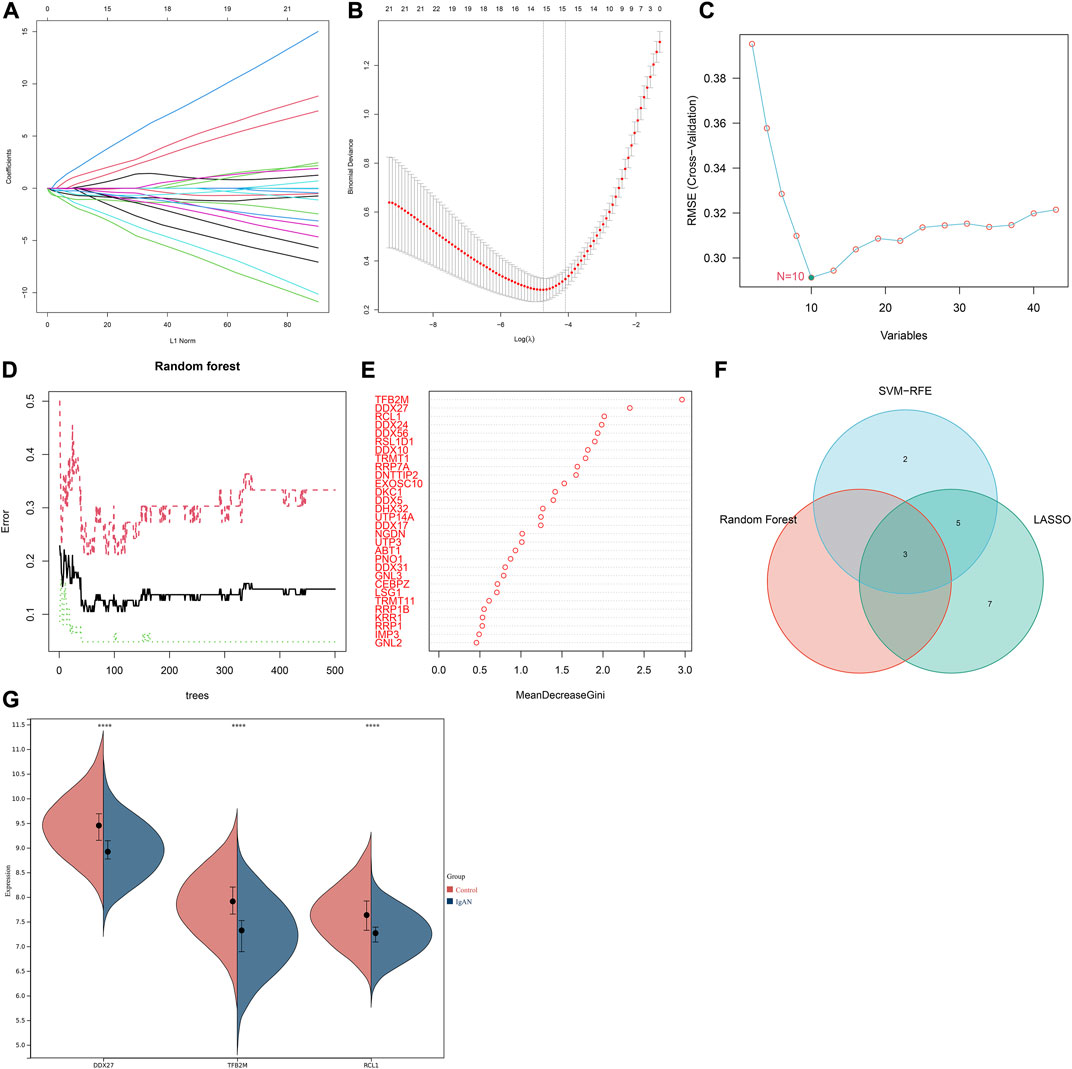
FIGURE 3. Integration of three machine learning algorithms to determine characteristic RBPs in IgA nephropathy. (A) The regression coefficient of each independent variable in the LASSO model. (B) Binomial deviance under different log(lambda) in the model. (C) SVM-RFE for feature section. (D) Random forest for screening characteristic genes. (E) The rank of genes according to the relative importance. (F) Venn diagram of the intersection results of characteristic genes from three machine learning approaches. (G) Expression of characteristic RBPs in IgA nephropathy and normal specimens (****p < 0.0001). IgAN, IgA nephropathy.
Characteristic RBPs as reliable diagnostic markers of IgA nephropathy
To evaluate the diagnostic efficacy of the characteristic RBPs in IgA nephropathy, ROCs were plotted. As a result, the AUC values of DDX27 (Figure 4A), RCL1 (Figure 4B), and TFB2M (Figure 4C) were separately 0.82, 0.78, and 0.85. Above analysis demonstrated that the characteristic RBPs might be reliable diagnostic markers of IgA nephropathy.
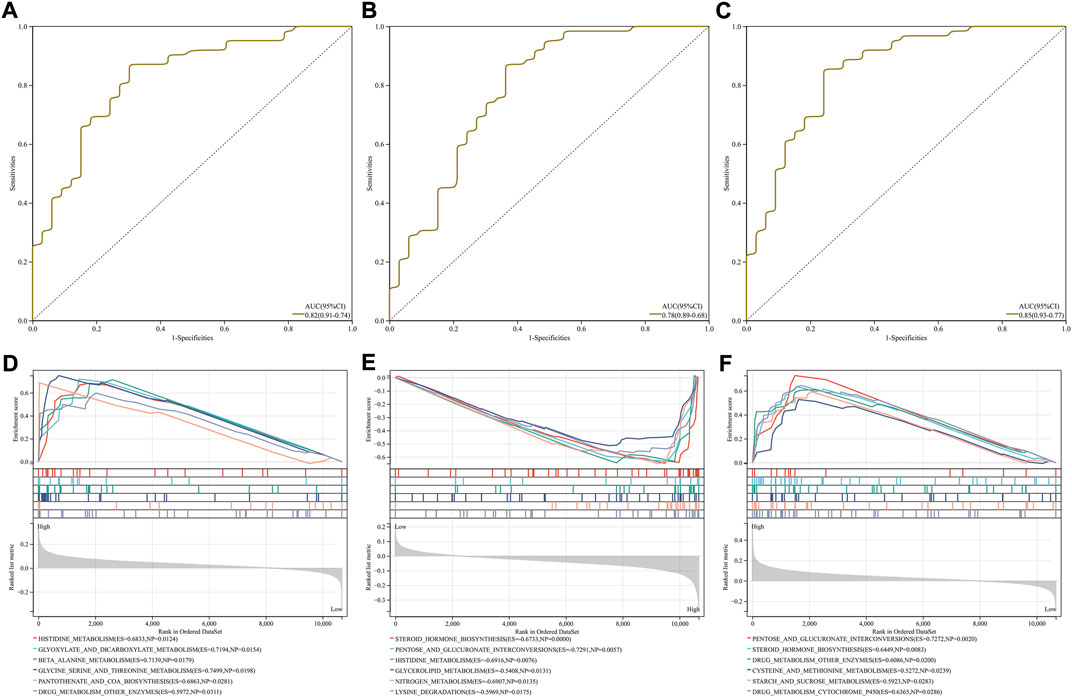
FIGURE 4. Diagnostic efficacy and involved signaling pathways of characteristic RBPs in IgA nephropathy. (A–C) ROCs of (A) DDX27, (B) RCL1, and (C) TFB2M in diagnosing IgA nephropathy. (D–F) KEGG pathways involved in (D) DDX27, (E) RCL1, and (F) TFB2M.
Signaling pathways involved in characteristic RBPs
DDX27 was positively correlated to histidine metabolism, glyoxylate and dicarboxylate metabolism, β-alanine metabolism, glycine serine and threonine metabolism, pantothenate and coA biosynthesis, and drug metabolism other enzymes (Figure 4D). In Figure 4E, RCL1 was negatively linked to steroid hormone biosynthesis, pentose and glucuronate interconversions, histidine metabolism, glycerolipid metabolism, nitrogen metabolism and lysine degradation. Moreover, TFB2M exhibited positive associations with pentose and glucuronate interconversions, steroid hormone biosynthesis, drug metabolism other enzymes, cysteine and methionine metabolism, starch and sucrose metabolism and drug metabolism cytochrome P450 (Figure 4F).
Characteristic RBPs are linked to immune cell infiltrations and pyroptosis in IgA nephropathy
Through CIBERSORT approach, we quantified the enrichment levels of 24 immune cell types. As illustrated in Figure 5A, there were dramatic interactions between immune cells. Compared with normal specimens, CD8 T cells, follicular helper T cells, gamma delta T cells, resting NK cells, activated NK cells, M1 macrophages, M2 macrophages, resting dendritic cells, activated dendritic cells, endothelial cells and fibroblasts exhibited higher enrichment levels in IgA nephropathy (Figure 5B). We also evaluated the correlations between characteristic RBPs and immune cell infiltrations. In Figure 5C, DDX27 was positively associated with memory resting CD4 T cells, but was negatively associated with endothelial cells, M2 macrophages, gamma delta T cells, fibroblasts, M1 macrophages, resting dendritic cells, CD8 T cells, and monocytes. RCL1 exhibited positive interactions with regulatory T cells (Tregs), follicular helper T cells, memory activated CD4 T cells, resting mast cells, memory B cells, but exhibited negative interactions with endothelial cells, fibroblasts, M1 macrophages, and M2 macrophages (Figure 5D). Additionally, TFB2M was negatively linked to endothelial cells, fibroblasts, M1 macrophages, M2 macrophages, activated dendritic cells, activated NK cells, gamma delta T cells, resting NK cells, resting dendritic cells, CD8 T cells, naïve B cells, and M0 macrophages (Figure 5E). Pyroptosis is a type of cell death, that is, crucial for immunity (Niu et al., 2022). Here, the relationships of characteristic RBPs with pyroptosis-relevant genes (DDX27, RCL1, and TFB2M) were analyzed. Among them, TFB2M displayed significantly negative correlations to NOD2, NLRP1, TP53, CASP4, and TNF (Figures 5F–H).
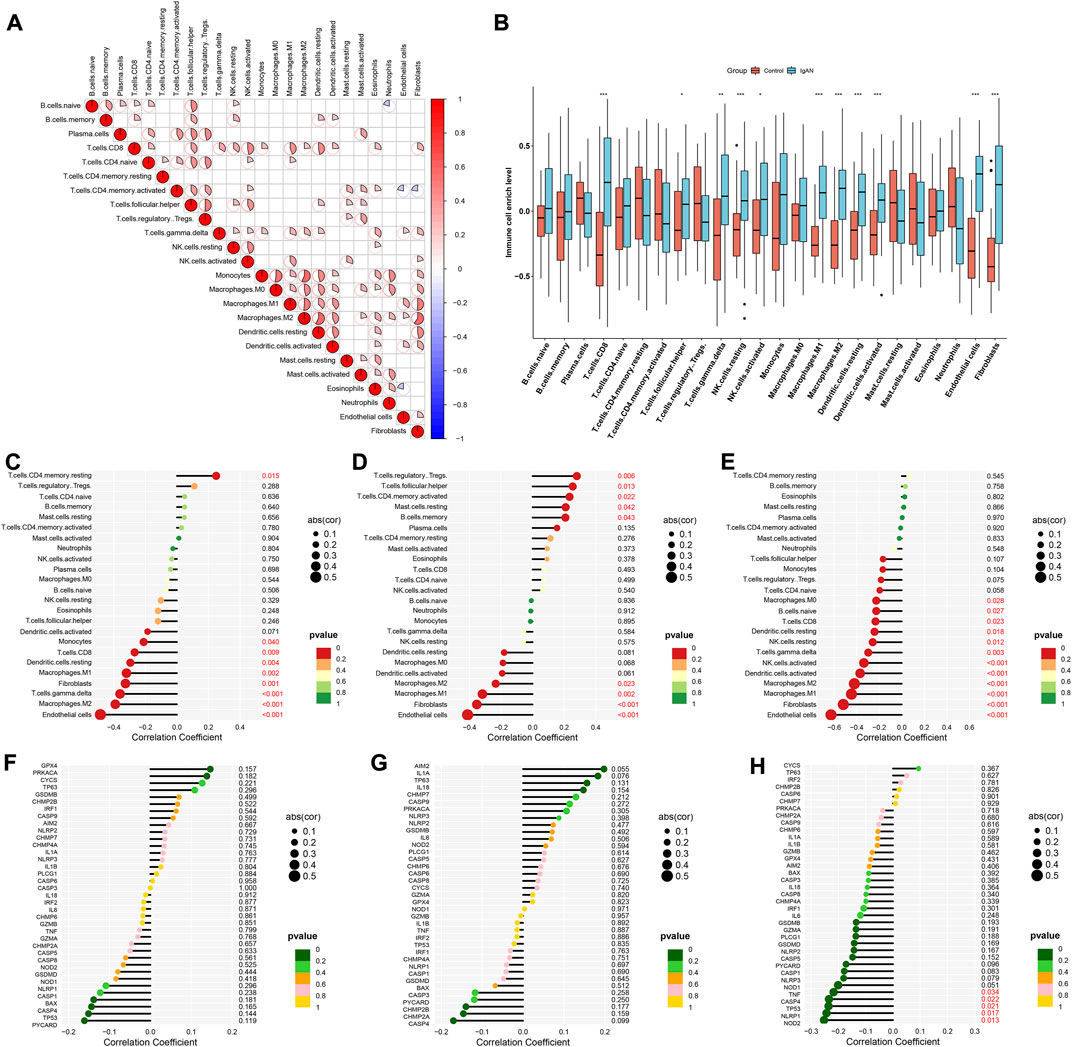
FIGURE 5. Characteristic RBPs are linked to immune cell infiltrations in IgA nephropathy. (A) Correlations between 24 immune cell types in IgA nephropathy specimens. (B) Enrichment levels of 24 immune cell types in IgA nephropathy and normal specimens (*p < 0.05; **p < 0.01; ***p < 0.001). (C–E) Associations of (C) DDX27, (D) RCL1, and (E) TFB2M with enrichment levels of each immune cell type. (F–H) Relationships of (F) DDX27, (G) RCL1, and (H) TFB2M with the expression of pyroptosis-relevant genes. IgAN, IgA nephropathy.
IgA nephropathy is classified as two subtypes based on hub RBPs
Through consensus clustering approach, IgA nephropathy specimens were stably classified as two subtypes, namely cluster 1 and 2 (Figures 6A–D; Supplementary Table S3). PCA plot also demonstrated the difference between subtypes (Figure 6E). Additionally, most hub RBPs exhibited higher expressions in cluster 1 than 2 (Figure 6F).
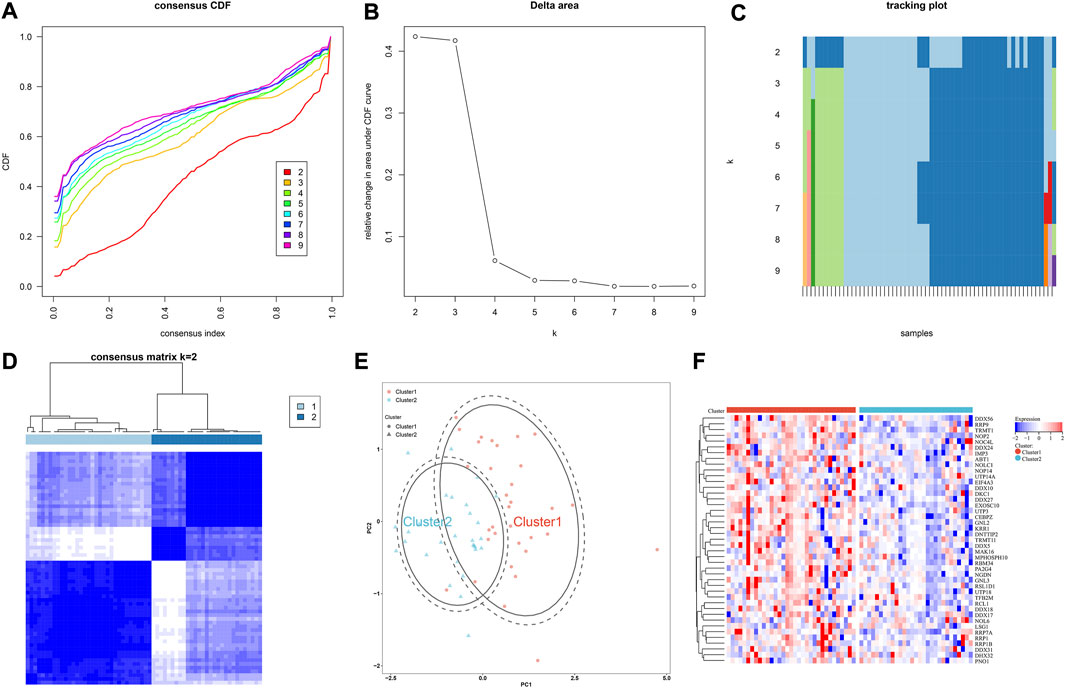
FIGURE 6. IgA nephropathy is classified as two subtypes based on hub RBPs. (A) The consensus CDF across different k values. (B) Delta area plot for the relative change in the area under the CDF curves. (C) Tracking plot for the item cluster membership across different k values. (D) Consensus matrix at k = 2. (E) PCA plot of two subtypes. (F) Expression of hub RBPs in two subtypes.
Differences in signaling pathways, immune cell infiltrations, immune checkpoints and pyroptosis between hub RBPs-based subtypes
In Figure 7A, cytosolic DNA sensing pathway, proteasome, RNA degradation, nucleotide excision repair, mismatch repair, DNA replication, spliceosome, basal transcription factors and RNA polymerase exhibited higher enrichment levels in cluster 1 than 2. Oppositely, linoleic acid metabolism, olfactory transduction, aldosterone regulation sodium reabsorption, folate biosynthesis, renin angiotensin system, PPAR signaling pathway, pyruvate metabolism, citrate cycle TCA cycle, valine leucine and isoleucine degradation, proximal tubule bicarbonate reclamation, drug metabolism cytochrome P450, tyrosine metabolism, peroxisome, phenylalanine metabolism, glycine serine and threonine metabolism, arginine and proline metabolism, glycolysis gluconeogenesis, β-alanine metabolism, limonene and pinene degradation, steroid hormone biosynthesis, retinol metabolism and nitrogen metabolism had higher enrichment levels in cluster 2 in comparison to cluster 1. Compared with cluster 1, cluster 2 was characterized by lower infiltrations of memory B cells, and higher infiltrations of plasma cells, M2 macrophages, activated mast cells and neutrophils (Figure 7B). Additionally, immune checkpoints IDO1, CD86, LAIR1, TNFRSF14, TNFRSF4, CD48, TNFRSF25, CD44, and NRP1 were up-regulated in IgA nephropathy than normal specimens (Figure 7C). Differently, down-regulated LAG3, CTLA4, TNFSF9, PDCD1, TNFRSF8, HHLA2, CD40LG, BTNL2, TNFSF4, and CD200 were found in IgA nephropathy. In Figure 7D, cluster 1 was characterized by higher expressions of IDO1, TNFRSF8, TNFRSF14, CD40, CD48, CD44 and NRP1 than cluster 2. Most pyroptosis-relevant genes exhibited higher expression in IgA nephropathy versus normal specimens (Figure 7E), indicating the activation of pyroptosis pathway in IgA nephropathy. Afterwards, the heterogeneity in pyroptosis was measured between subtypes. In comparison to cluster 1, cluster 2 had lower expression of pyroptosis-relevant genes, indicating higher activity of pyroptosis in cluster 1 (Figure 7F).
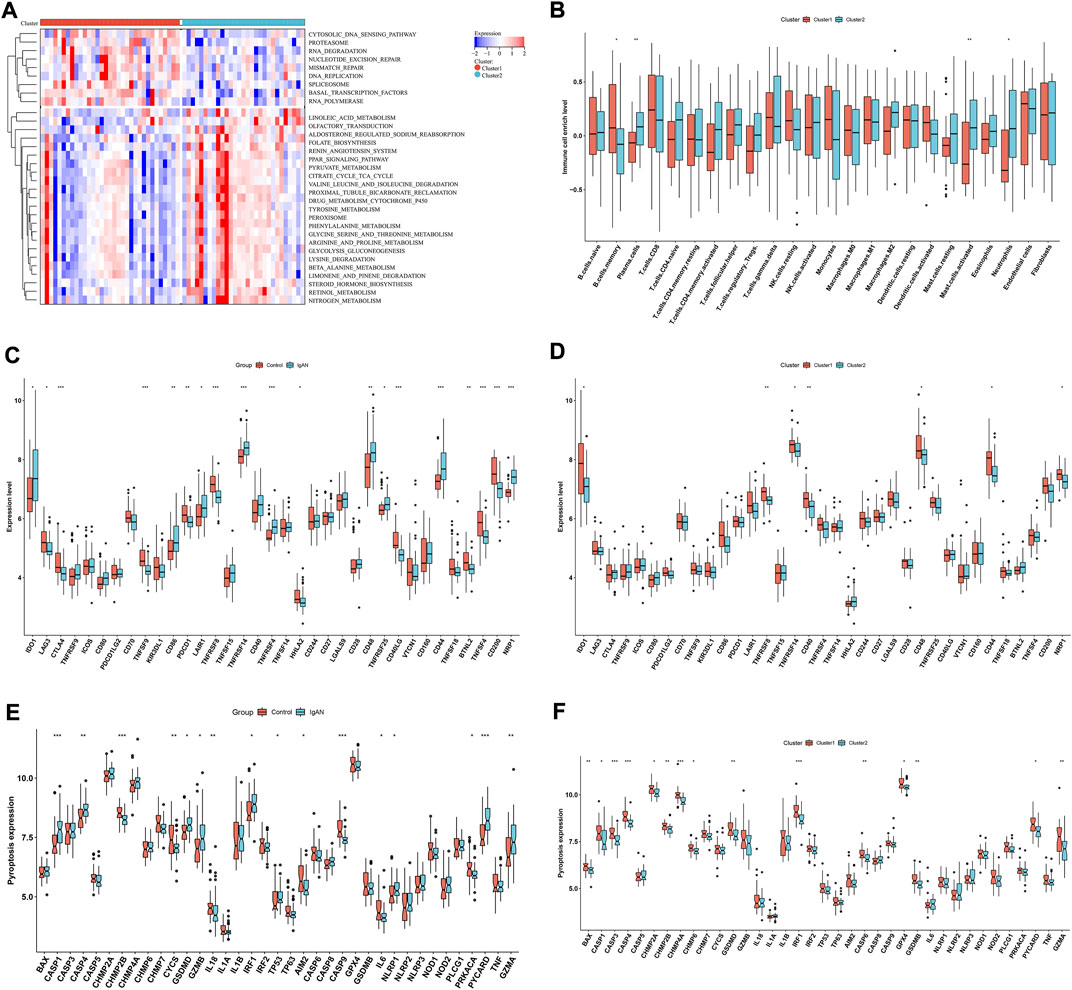
FIGURE 7. Differences in signaling pathways, immune cell infiltrations and immune checkpoints between hub RBPs-based subtypes. (A) Heatmap of the enrichment levels of signaling pathways between subtypes. (B) The enrichment levels of 24 immune cell types between subtypes. (C) The expression of immune checkpoints in IgA nephropathy and normal specimens. (D) The expression of immune checkpoints in two subtypes. (E) The expression of pyroptosis-relevant genes in IgA nephropathy and normal specimens. (F) The expression of pyroptosis-relevant genes in two subtypes. *p < 0.05; **p < 0.01; ***p < 0.001. IgAN, IgA nephropathy.
Association of characteristic RBPs with clinical features, hub RBPs-based subtypes and immune cell infiltrations
Characteristic RBPs were further verified in the Nephroseq database. DDX27 was significantly up-regulated in chronic kidney disease than normal kidneys, and was negatively correlated to body mass index (Figures 8A,B). Additionally, up-regulated TFB2M was examined in chronic kidney disease compared with normal kidneys (Figure 8C). Moreover, DDX27, RCL1, and TFB2M expressions were relatively higher in cluster 1 than 2 (Figure 8D). All of them were positively correlated to most immune checkpoints in IgA nephropathy samples (Figure 8E).
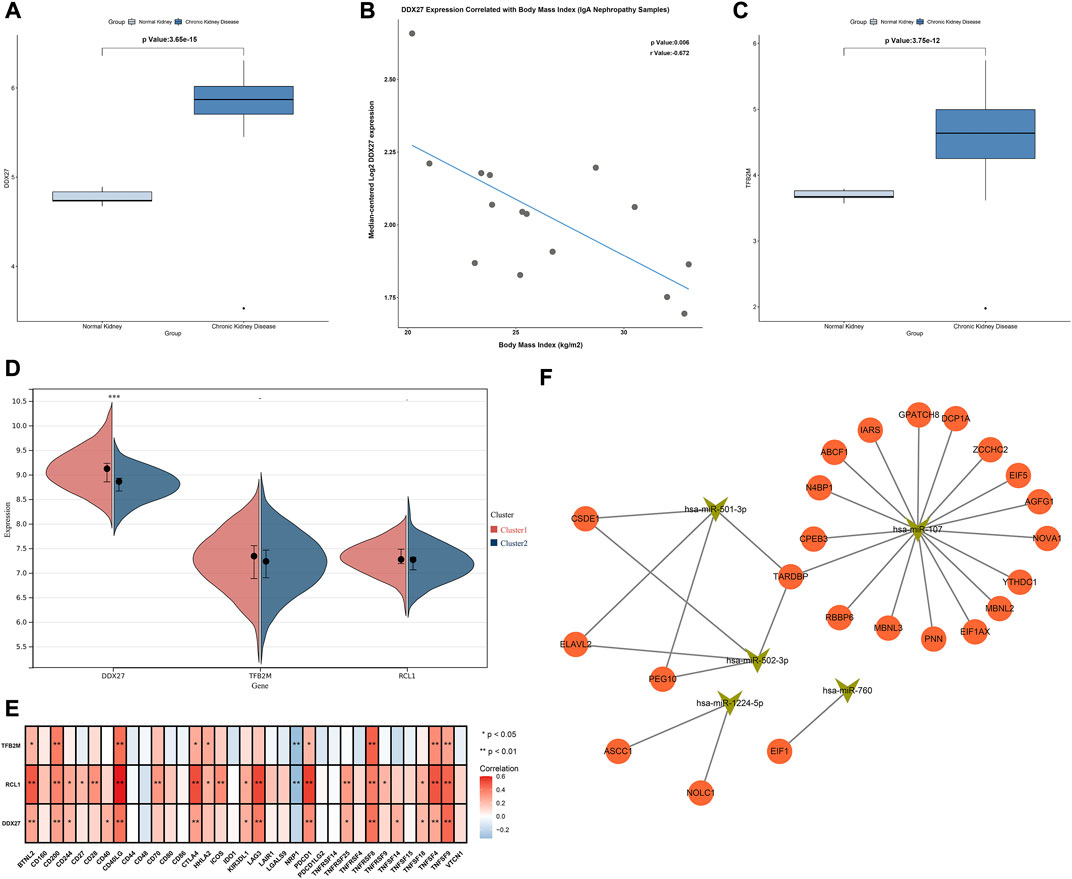
FIGURE 8. Association of characteristic RBPs with clinical features, hub RBPs-based subtypes, immune cell infiltrations and upstream miRNAs. (A) Expression of DDX27 in normal and chronic kidney disease in the Nephroseq database. (B) Correlation between DDX27 expression and body mass index of IgA nephropathy samples in the Nephroseq database. (C) Expression of TFB2M in normal and chronic kidney disease in the Nephroseq database. (D) Expression of characteristic RBPs in two subtypes. (E) Heatmap of the associations between characteristic RBPs and immune cell infiltrations in IgA nephropathy. (F) The network of characteristic RBPs and upstream miRNAs. *p < 0.05; **p < 0.01.
Upstream miRNAs of hub RBPs
We further predicted the upstream miRNAs of hub RBPs. Firstly, we determined miRNAs with differential expression in IgA nephropathy from GSE25590 dataset (Table 1). In Figure 8F, miR-501-3p, miR-760, miR-502-3p, miR-1224-5p, and miR-107 were potential upstream miRNAs of hub RBPs after prediction.
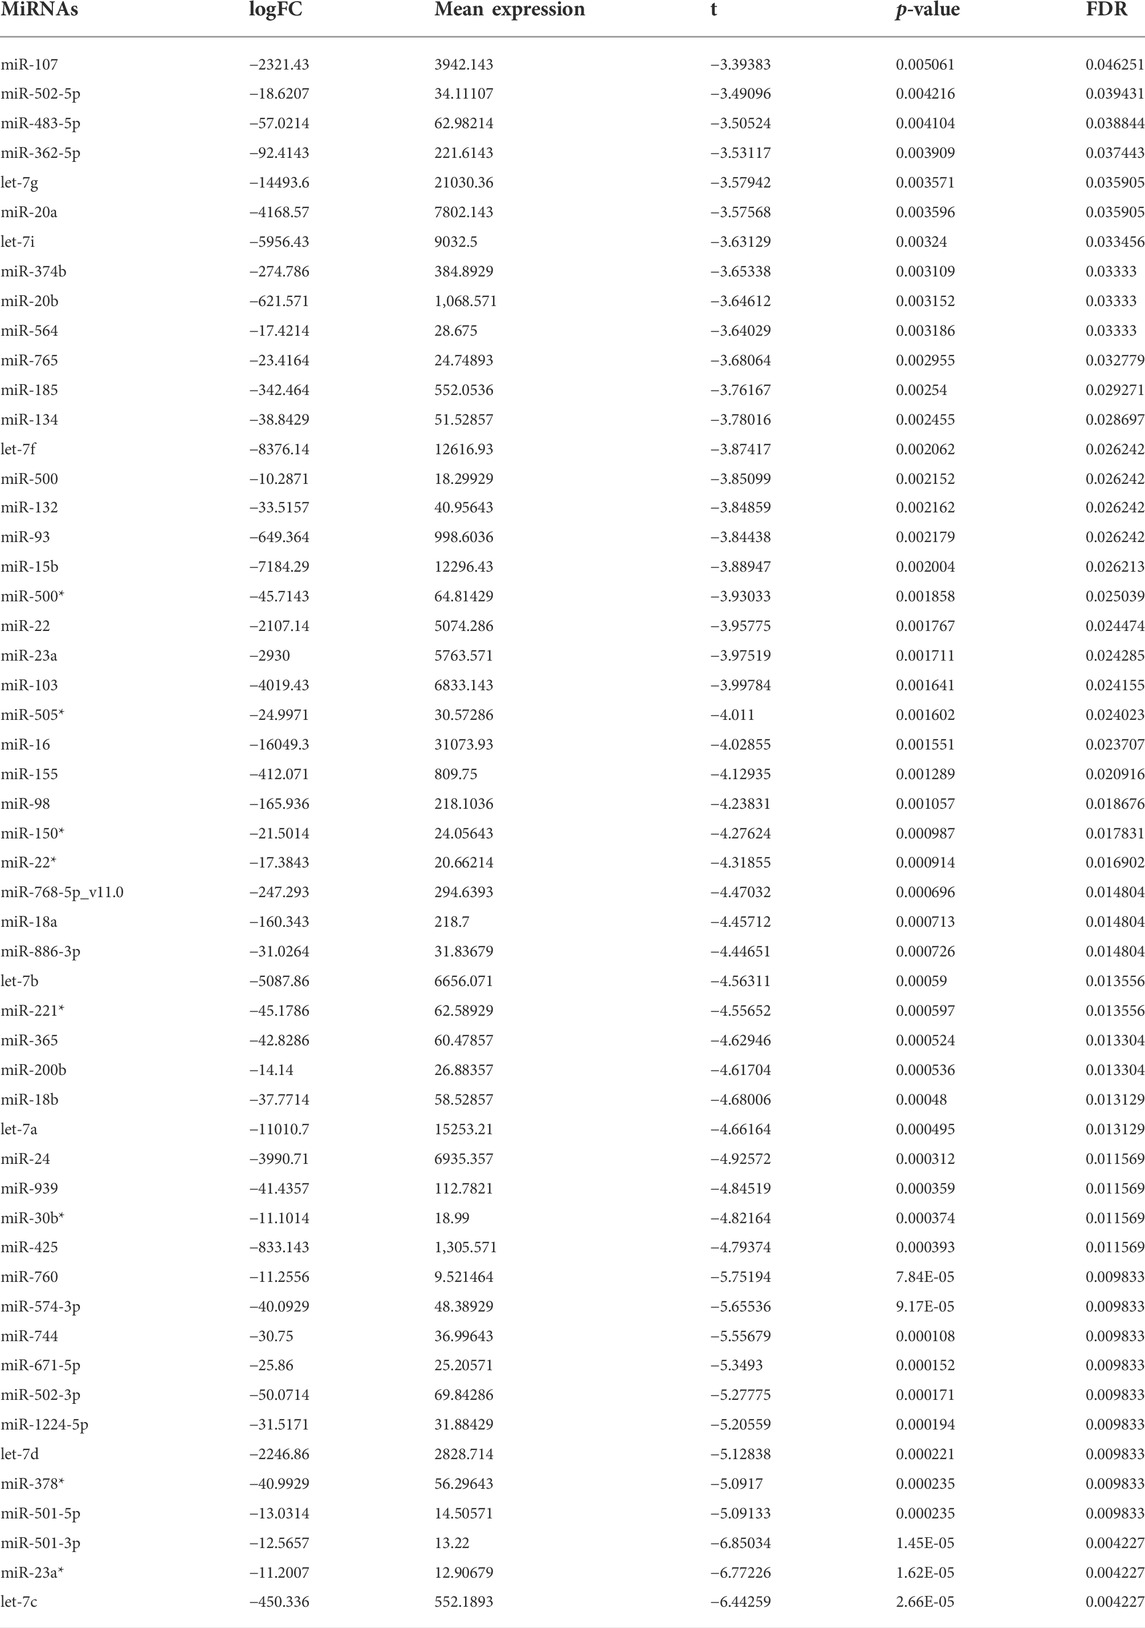
TABLE 1. The list of miRNAs with differential expression in IgA nephropathy.
Discussion
Currently, anatomopathological evaluation of renal biopsies is crucial for diagnosing IgA nephropathy (Li H. et al., 2021). Nevertheless, percutaneous renal biopsies are often not carried out, and proposed histological classifications (Oxford classification system, etc.) have a few shortcomings (Kouri et al., 2021). As the undesirable clinical outcomes of patients with IgA nephropathy is in part the results of delayed diagnosis, reliable non-invasive biomarkers are urgently required, which could be applied to routine clinical practice (Moresco et al., 2015).
Through integration of three machine learning approaches (LASSO, SVM-RFE, random forest), we finally determined three characteristic RBPs of IgA nephropathy: DDX27, RCL1, and TFB2M. All of them displayed remarkable down-regulation in IgA nephropathy. DDX27 is a member of the DEAD-Box nucleic acid helicase family. Previous evidence demonstrates that DDX27 is involved in tumorigenesis. Specifically, DDX27 facilitates hepatocellular carcinoma progression via activating ERK signaling (Xiaoqian et al., 2021), and enhances stem cell-like features with undesirable survival outcome of breast cancer (Li S. et al., 2021) and colorectal cancer (Yang et al., 2019). Moreover, it heightens colony-forming capacity of gastric cancer cells and results in terrible survival outcome (Tsukamoto et al., 2015), and strengthens colorectal cancer growth and metastasis (Tang et al., 2018). Other studies demonstrate that DDX27 modulates skeletal muscle growth and regeneration through translational processes (Bennett et al., 2018), and modulates 3’ end generation of ribosomal 47S RNA and stably correlates to the PeBoW-complexing (Kellner et al., 2015). RCL1 is essential for co-transcriptional steps in 18 S rRNA biogenesis (Horn et al., 2011). Evidence suggests that RCL1 weakens hepatocellular carcinoma progression (Jiaze et al., 2022). TFB2M is a mitochondrial transcription factor (Basu et al., 2020), and its C-terminal tail is a part of the autoinhibitory mechanisms that modulate DNA binding (Basu et al., 2020). However, no studies have reported the roles of DDX27, RCL1, and TFB2M in IgA nephropathy. Our ROCs demonstrated the excellent efficacy of these characteristic genes in diagnosing IgA nephropathy.
Our GSEA results demonstrated that DDX27, RCL1, and TFB2M were significantly involved in metabolism pathways such as histidine metabolism, glyoxylate and dicarboxylate metabolism, β-alanine metabolism, glycine serine and threonine metabolism, indicating their crucial roles in RNA metabolism. Most immune cell types exhibited increased infiltration levels in IgA nephropathy, comprising CD8 T cells, follicular helper T cells, gamma delta T cells, resting NK cells, activated NK cells, M1 macrophages, M2 macrophages, resting dendritic cells, activated dendritic cells, endothelial cells, and fibroblasts, consistent with previous research (Chen et al., 2021; Tang et al., 2021). Especially, DDX27, RCL1, and TFB2M were significantly linked to most immune cell populations and immune checkpoints, indicating that above characteristic RBPs might participate in modulating immune cell infiltrations during IgA nephropathy progression. Pyroptosis has gained increasing attention due to its relationship to innate immunity and diseases (Yu et al., 2021). Among characteristic RBPs, TFB2M negatively correlated to several pyroptosis-relevant genes, indicating that TFB2M might modulate pyroptosis pathway during IgA nephropathy.
Genome-wide meta-analysis has uncovered the remarkable molecular heterogeneity across IgA nephropathy patients (Li et al., 2020). Here, based on the hub RBPs, we classified IgA nephropathy two subtypes. Most hub RBPs exhibited higher expressions in cluster 1 than 2. There was the notable heterogeneity in pyroptosis between subtypes, with higher activity of pyroptosis in cluster 1. Additionally, most metabolism pathways displayed higher activity in cluster 2 in comparison to cluster 1. We also noted that cluster 2 had lower infiltrations of memory B cells as well as higher infiltrations of plasma cells, M2 macrophages, activated mast cells and neutrophils. Meanwhile, cluster 1 was characterized by elevated expressions of IDO1, TNFRSF8, TNFRSF14, CD40, CD48, CD44 and NRP1. Altogether, the hub RBP-based subtypes exhibited widespread differences in signaling pathways, immune cell infiltrations and immune checkpoints.
Accumulated evidence shows that miRNAs exert crucial roles in the pathogenesis of IgA nephropathy (Noor et al., 2021; Pawluczyk et al., 2021; Xu et al., 2021). Our further analysis demonstrated that miR-501-3p, miR-760, miR-502-3p, miR-1224-5p, and miR-107 were potential upstream miRNAs of hub RBPs, which might post-transcriptionally regulate the expression of hub RBPs during IgA nephropathy. Despite this, the limitations of our study should be pointed out. First, although we tried our best to collect IgA nephropathy public datasets, the sample size was relatively small. Furthermore, the post-transcriptional mechanisms of hub RBPs will be experimentally verified.
Conclusion
Collectively, the present study determined three characteristic RBPs as potential diagnostic biomarkers of IgA nephropathy patients through integrating three machine learning approaches (LASSO, SVM-RFE, random forest). Additionally, we classified IgA nephropathy as two RBPs-based subtypes. Altogether, our findings provided a novel clue on the diagnosis and mechanisms of IgA nephropathy.
Data availability statement
The original contributions presented in the study are included in the article/Supplementary Material, further inquiries can be directed to the corresponding authors.
Author contributions
CL and XS conceived and designed the study. XZ, PC, and HJ conducted most of the experiments and data analysis, and wrote the manuscript. SY, GM, and JZ participated in collecting data and helped to draft the manuscript. All authors reviewed and approved the manuscript.
Conflict of interest
The authors declare that the research was conducted in the absence of any commercial or financial relationships that could be construed as a potential conflict of interest.
Publisher’s note
All claims expressed in this article are solely those of the authors and do not necessarily represent those of their affiliated organizations, or those of the publisher, the editors and the reviewers. Any product that may be evaluated in this article, or claim that may be made by its manufacturer, is not guaranteed or endorsed by the publisher.
Supplementary material
The Supplementary Material for this article can be found online at: https://www.frontiersin.org/articles/10.3389/fgene.2022.975521/full#supplementary-material
Abbreviations
IgA, immunoglobulin A; RBPs, RNA binding proteins; mRNA, messenger RNA; GEO, gene expression omnibus; sva, surrogate variable analysis; PCA, principal component analysis; miRNA, microRNA; limma, linear models for microarray data; GO, gene ontology; KEGG, kyoto encyclopedia of genes and genomes; PPI, protein-protein interaction; STRING, search tool for the retrieval of interacting genes; MCODE, molecular complex detection; LASSO, least absolute shrinkage and selection operator; SVM-RFE, support vector machine-recursive feature elimination; GSEA, gene set enrichment analysis; MSigDB, molecular signatures database; GSVA, gene set variation analysis; ssGSEA, single sample gene set enrichment analysis; ROCs, receiver operating characteristic curves.
References
Basu, U., Mishra, N., Farooqui, M., Shen, J., Johnson, L. C., and Patel, S. S. (2020). The C-terminal tails of the mitochondrial transcription factors Mtf1 and TFB2M are part of an autoinhibitory mechanism that regulates DNA binding. J. Biol. Chem. 295 (20), 6823–6830. doi:10.1074/jbc.RA120.013338
Bennett, A. H., O'Donohue, M. F., Gundry, S. R., Chan, A. T., Widrick, J., Draper, I., et al. (2018). RNA helicase, DDX27 regulates skeletal muscle growth and regeneration by modulation of translational processes. PLoS Genet. 14 (3), e1007226. doi:10.1371/journal.pgen.1007226
Chen, Z., Zhang, T., Mao, K., Shao, X., Xu, Y., Zhu, M., et al. (2021). A single-cell survey of the human glomerulonephritis. J. Cell. Mol. Med. 25 (10), 4684–4695. doi:10.1111/jcmm.16407
Gautier, L., Cope, L., Bolstad, B. M., and Irizarry, R. A. (2004). affy--analysis of Affymetrix GeneChip data at the probe level. Bioinformatics 20 (3), 307–315. doi:10.1093/bioinformatics/btg405
Goeman, J. J. (2010). L1 penalized estimation in the Cox proportional hazards model. Biom. J. 52 (1), 70–84. doi:10.1002/bimj.200900028
Guo, F., Zhang, W., Su, J., Xu, H., and Yang, H. (2019). Prediction of drug positioning for quan-du-zhong capsules against hypertensive nephropathy based on the robustness of disease network. Front. Pharmacol. 10, 49. doi:10.3389/fphar.2019.00049
Hahn, W. H., Suh, J. S., Cho, S. H., Cho, B. S., and Kim, S. D. (2010). Polymorphisms of signal transducers and activators of transcription 1 and 4 (STAT1 and STAT4) contribute to progression of childhood IgA nephropathy. Cytokine 50 (1), 69–74. doi:10.1016/j.cyto.2009.12.004
Hänzelmann, S., Castelo, R., and Guinney, J. (2013). Gsva: Gene set variation analysis for microarray and RNA-seq data. BMC Bioinforma. 14, 7. doi:10.1186/1471-2105-14-7
Horn, D. M., Mason, S. L., and Karbstein, K. (2011). Rcl1 protein, a novel nuclease for 18 S ribosomal RNA production. J. Biol. Chem. 286 (39), 34082–34087. doi:10.1074/jbc.M111.268649
Jiaze, Y., Sinan, H., Minjie, Y., Yongjie, Z., Nan, D., Liangwen, W., et al. (2022). Rcl1 suppresses tumor progression of hepatocellular carcinoma: A comprehensive analysis of bioinformatics and in vitro experiments. Cancer Cell. Int. 22 (1), 114. doi:10.1186/s12935-022-02533-x
Kellner, M., Rohrmoser, M., Forné, I., Voss, K., Burger, K., Mühl, B., et al. (2015). DEAD-box helicase DDX27 regulates 3' end formation of ribosomal 47S RNA and stably associates with the PeBoW-complex. Exp. Cell. Res. 334 (1), 146–159. doi:10.1016/j.yexcr.2015.03.017
Kouri, N. M., Stangou, M., Lioulios, G., Mitsoglou, Z., Serino, G., Chiurlia, S., et al. (2021). Serum levels of miR-148b and let-7b at diagnosis may have important impact in the response to treatment and long-term outcome in IgA nephropathy. J. Clin. Med. 10 (9), 1987. doi:10.3390/jcm10091987
Leek, J. T., Johnson, W. E., Parker, H. S., Jaffe, A. E., and Storey, J. D. (2012). The sva package for removing batch effects and other unwanted variation in high-throughput experiments. Bioinformatics 28 (6), 882–883. doi:10.1093/bioinformatics/bts034
Li, H., Chen, Z., Chen, W., Li, J., Liu, Y., Ma, H., et al. (2021). MicroRNA-23b-3p deletion induces an IgA nephropathy-like disease associated with dysregulated mucosal IgA synthesis. J. Am. Soc. Nephrol. 32 (10), 2561–2578. doi:10.1681/asn.2021010133
Li, M., Wang, L., Shi, D. C., Foo, J. N., Zhong, Z., Khor, C. C., et al. (2020). Genome-wide meta-analysis identifies three novel susceptibility loci and reveals ethnic heterogeneity of genetic susceptibility for IgA nephropathy. J. Am. Soc. Nephrol. 31 (12), 2949–2963. doi:10.1681/asn.2019080799
Li, S., Ma, J., Zheng, A., Song, X., Chen, S., and Jin, F. (2021). DEAD-box helicase 27 enhances stem cell-like properties with poor prognosis in breast cancer. J. Transl. Med. 19 (1), 334. doi:10.1186/s12967-021-03011-0
Li, Y., Xia, M., Peng, L., Liu, H., Chen, G., Wang, C., et al. (2021). Downregulation of miR-214-3p attenuates mesangial hypercellularity by targeting PTEN-mediated JNK/c-Jun signaling in IgA nephropathy. Int. J. Biol. Sci. 17 (13), 3343–3355. doi:10.7150/ijbs.61274
Liberzon, A., Birger, C., Thorvaldsdóttir, H., Ghandi, M., Mesirov, J. P., and Tamayo, P. (2015). The Molecular Signatures Database (MSigDB) hallmark gene set collection. Cell. Syst. 1 (6), 417–425. doi:10.1016/j.cels.2015.12.004
Liu, P., Lassén, E., Nair, V., Berthier, C. C., Suguro, M., Sihlbom, C., et al. (2017). Transcriptomic and proteomic profiling provides insight into mesangial cell function in IgA nephropathy. J. Am. Soc. Nephrol. 28 (10), 2961–2972. doi:10.1681/asn.2016101103
Moldoveanu, Z., Suzuki, H., Reily, C., Satake, K., Novak, L., Xu, N., et al. (2021). Experimental evidence of pathogenic role of IgG autoantibodies in IgA nephropathy. J. Autoimmun. 118, 102593. doi:10.1016/j.jaut.2021.102593
Moresco, R. N., Speeckaert, M. M., and Delanghe, J. R. (2015). Diagnosis and monitoring of IgA nephropathy: The role of biomarkers as an alternative to renal biopsy. Autoimmun. Rev. 14 (10), 847–853. doi:10.1016/j.autrev.2015.05.009
Nagasawa, Y., Okuzaki, D., Muso, E., Yamamoto, R., Shinzawa, M., Iwasaki, Y., et al. (2016). IFI27 is a useful genetic marker for diagnosis of immunoglobulin A nephropathy and membranous nephropathy using peripheral blood. PLoS One 11 (4), e0153252. doi:10.1371/journal.pone.0153252
Newman, A. M., Liu, C. L., Green, M. R., Gentles, A. J., Feng, W., Xu, Y., et al. (2015). Robust enumeration of cell subsets from tissue expression profiles. Nat. Methods 12 (5), 453–457. doi:10.1038/nmeth.3337
Niu, X., Chen, L., Li, Y., Hu, Z., and He, F. (2022). Ferroptosis, necroptosis, and pyroptosis in the tumor microenvironment: Perspectives for immunotherapy of SCLC. Semin. Cancer Biol. 12. doi:10.1016/j.semcancer.2022.03.009
Noor, F., Saleem, M. H., Aslam, M. F., Ahmad, A., and Aslam, S. (2021). Construction of miRNA-mRNA network for the identification of key biological markers and their associated pathways in IgA nephropathy by employing the integrated bioinformatics analysis. Saudi J. Biol. Sci. 28 (9), 4938–4945. doi:10.1016/j.sjbs.2021.06.079
Pawluczyk, I. Z. A., Didangelos, A., Barbour, S. J., Er, L., Becker, J. U., Martin, R., et al. (2021). Differential expression of microRNA miR-150-5p in IgA nephropathy as a potential mediator and marker of disease progression. Kidney Int. 99 (5), 1127–1139. doi:10.1016/j.kint.2020.12.028
Ritchie, M. E., Phipson, B., Wu, D., Hu, Y., Law, C. W., Shi, W., et al. (2015). Limma powers differential expression analyses for RNA-sequencing and microarray studies. Nucleic Acids Res. 43 (7), e47. doi:10.1093/nar/gkv007
Serino, G., Sallustio, F., Cox, S. N., Pesce, F., and Schena, F. P. (2012). Abnormal miR-148b expression promotes aberrant glycosylation of IgA1 in IgA nephropathy. J. Am. Soc. Nephrol. 23 (5), 814–824. doi:10.1681/asn.2011060567
Shannon, P., Markiel, A., Ozier, O., Baliga, N. S., Wang, J. T., Ramage, D., et al. (2003). Cytoscape: A software environment for integrated models of biomolecular interaction networks. Genome Res. 13 (11), 2498–2504. doi:10.1101/gr.1239303
Sternburg, E. L., and Karginov, F. V. (2020). Global approaches in studying RNA-binding protein interaction networks. Trends biochem. Sci. 45 (7), 593–603. doi:10.1016/j.tibs.2020.03.005
Subramanian, A., Tamayo, P., Mootha, V. K., Mukherjee, S., Ebert, B. L., Gillette, M. A., et al. (2005). Gene set enrichment analysis: A knowledge-based approach for interpreting genome-wide expression profiles. Proc. Natl. Acad. Sci. U. S. A. 102 (43), 15545–15550. doi:10.1073/pnas.0506580102
Suzuki, H., and Novak, J. (2021). IgA glycosylation and immune complex formation in IgAN. Semin. Immunopathol. 43 (5), 669–678. doi:10.1007/s00281-021-00883-8
Tang, J., Chen, H., Wong, C. C., Liu, D., Li, T., Wang, X., et al. (2018). DEAD-box helicase 27 promotes colorectal cancer growth and metastasis and predicts poor survival in CRC patients. Oncogene 37 (22), 3006–3021. doi:10.1038/s41388-018-0196-1
Tang, R., Meng, T., Lin, W., Shen, C., Ooi, J. D., Eggenhuizen, P. J., et al. (2021). A partial picture of the single-cell transcriptomics of human IgA nephropathy. Front. Immunol. 12, 645988. doi:10.3389/fimmu.2021.645988
Tsukamoto, Y., Fumoto, S., Noguchi, T., Yanagihara, K., Hirashita, Y., Nakada, C., et al. (2015). Expression of DDX27 contributes to colony-forming ability of gastric cancer cells and correlates with poor prognosis in gastric cancer. Am. J. Cancer Res. 5 (10), 2998–3014.
Wilkerson, M. D., and Hayes, D. N. (2010). ConsensusClusterPlus: A class discovery tool with confidence assessments and item tracking. Bioinformatics 26 (12), 1572–1573. doi:10.1093/bioinformatics/btq170
Wu, C. Y., Hua, K. F., Hsu, W. H., Suzuki, Y., Chu, L. J., Lee, Y. C., et al. (2020). IgA nephropathy benefits from compound K treatment by inhibiting NF-κB/NLRP3 inflammasome and enhancing autophagy and SIRT1. J. Immunol. 205 (1), 202–212. doi:10.4049/jimmunol.1900284
Wu, X., and Xu, L. (2022). The RNA-binding protein HuR in human cancer: A friend or foe? Adv. Drug Deliv. Rev. 184, 114179. doi:10.1016/j.addr.2022.114179
Xiaoqian, W., Bing, Z., Yangwei, L., Yafei, Z., Tingting, Z., Yi, W., et al. (2021). DEAD-Box helicase 27 promotes hepatocellular carcinoma progression through ERK signaling. Technol. Cancer Res. Treat. 20, 15330338211055953. doi:10.1177/15330338211055953
Xie, X., Liu, P., Gao, L., Zhang, X., Lan, P., Bijol, V., et al. (2021). Renal deposition and clearance of recombinant poly-IgA complexes in a model of IgA nephropathy. J. Pathol. 254 (2), 159–172. doi:10.1002/path.5658
Xu, Y., He, Y., Hu, H., Xu, R., Liao, Y., Dong, X., et al. (2021). The increased miRNA-150-5p expression of the tonsil tissue in patients with IgA nephropathy may be related to the pathogenesis of disease. Int. Immunopharmacol. 100, 108124. doi:10.1016/j.intimp.2021.108124
Yang, C., Li, D., Bai, Y., Song, S., Yan, P., Wu, R., et al. (2019). DEAD-box helicase 27 plays a tumor-promoter role by regulating the stem cell-like activity of human colorectal cancer cells. Onco. Targets. Ther. 12, 233–241. doi:10.2147/ott.S190814
Yu, G., Wang, L. G., Han, Y., and He, Q. Y. (2012). clusterProfiler: an R package for comparing biological themes among gene clusters. Omics 16 (5), 284–287. doi:10.1089/omi.2011.0118
Yu, P., Zhang, X., Liu, N., Tang, L., Peng, C., and Chen, X. (2021). Pyroptosis: Mechanisms and diseases. Signal Transduct. Target. Ther. 6 (1), 128. doi:10.1038/s41392-021-00507-5
Zeng, H., Wang, L., Li, J., Luo, S., Han, Q., Su, F., et al. (2021). Single-cell RNA-sequencing reveals distinct immune cell subsets and signaling pathways in IgA nephropathy. Cell. Biosci. 11 (1), 203. doi:10.1186/s13578-021-00706-1
Keywords: IgA nephropathy, RNA binding proteins, machine learning, diagnosis, subtypes, immunity, pyroptosis
Citation: Zhang X, Chao P, Jiang H, Yang S, Muhetaer G, Zhang J, Song X and Lu C (2022) Integration of three machine learning algorithms identifies characteristic RNA binding proteins linked with diagnosis, immunity and pyroptosis of IgA nephropathy. Front. Genet. 13:975521. doi: 10.3389/fgene.2022.975521
Received: 22 June 2022; Accepted: 12 September 2022;
Published: 28 September 2022.
Edited by:
Muhammad Hamzah Saleem, University of Chinese Academy of Sciences, ChinaReviewed by:
Muhammad Ahsan Naeem, University of Veterinary and Animal Sciences, PakistanAftab Shaukat, Huazhong Agricultural University, China
Sidra Aslam, Government College University, Faisalabad, Pakistan
Copyright © 2022 Zhang, Chao, Jiang, Yang, Muhetaer, Zhang, Song and Lu. This is an open-access article distributed under the terms of the Creative Commons Attribution License (CC BY). The use, distribution or reproduction in other forums is permitted, provided the original author(s) and the copyright owner(s) are credited and that the original publication in this journal is cited, in accordance with accepted academic practice. No use, distribution or reproduction is permitted which does not comply with these terms.
*Correspondence: Xue Song, c29uZ3h1ZTA2MDlAMTYzLmNvbQ==; Chen Lu, bHVjaGVuNzA2ODEyQDE2My5jb20=
†These authors have contributed equally to this work and share first authorship