 Yufei Yang
 Lijun Xu
 Yuqi Qiao
 Qing Zheng
- Division of Gastroenterology and Hepatology, Key Laboratory of Gastroenterology and Hepatology, Ministry of Health, Inflammatory Bowel Disease Research Center, Ren ji Hospital, School of Medicine, Shanghai Jiao Tong University, Shanghai Institute of Digestive Disease, Shanghai, China
Objective: Crohn’s disease (CD), a chronic recurrent illness, is a type of inflammatory bowel disease whose incidence and prevalence rates are gradually increasing. However, there is no universally accepted criterion for CD diagnosis. The aim of this study was to create a diagnostic prediction model for CD and identify immune cell infiltration features in CD.
Methods: In this study, gene expression microarray datasets were obtained from the Gene Expression Omnibus (GEO) database. Then, we identified differentially expressed genes (DEGs) between 178 CD and 38 control cases. Enrichment analysis of DEGs was also performed to explore the biological role of DEGs. Moreover, the “randomForest” package was applied to select core genes that were used to create a neural network model. Finally, in the training cohort, we used CIBERSORT to evaluate the immune landscape between the CD and normal groups.
Results: The results of enrichment analysis revealed that these DEGs may be involved in biological processes associated with immunity and inflammatory responses. Moreover, the top 3 hub genes in the protein-protein interaction network were IL-1β, CCL2, and CXCR2. The diagnostic model allowed significant discrimination with an area under the ROC curve of 0.984 [95% confidence interval: 0.971–0.993]. A validation cohort (GSE36807) was utilized to ensure the reliability and applicability of the model. In addition, the immune infiltration analysis indicated nine different immune cell types were significantly different between the CD and healthy control groups.
Conclusion: In summary, this study offers a novel insight into the diagnosis of CD and provides potential biomarkers for the precise treatment of CD.
Introduction
Inflammatory bowel disease (IBD) includes two main types, ulcerative colitis and Crohn’s disease (CD) (Zhang and Li, 2014). The area of damage in CD is the entire gastrointestinal tract and extra-intestinal sites. In the absence of a gold standard for diagnosis, we usually diagnose patients through comprehensive considerations based on clinical features, endoscopy, and imaging examinations (Wehkamp et al., 2016). In most cases, it is difficult to diagnose CD and distinguish when patients are in the early stages of disease. However, it is widely recognized that an early diagnosis and treatment have a better prognosis than CD with complications such as intestinal obstruction, anal fistula, and perianal abscess. Therefore, it is necessary to explore potential biomarkers to provide a precise diagnosis and effective therapy.
Although little is known about its pathogenesis, there is convincing evidence that genetic susceptibility, immune imbalance, change in environmental factors, and intestinal microbiota disorders are contributors to CD pathogenesis (Seyedian et al., 2019). It is now obvious that CD is an autoimmune disease characterized by an imbalance of the immune system (Li and Shi, 2018). Therefore, the role of immune cells in CD pathogenesis needs to be investigated further.
Recently, the development of high-throughput sequencing technology has laid the foundation for precision medicine. Many machine learning algorithms, such as random forest and support vector machine, have been developed and used in various research fields (Bao et al., 2022). Bao et al. proposed a new identification algorithm to accurately identify modified residues, which has contributed to bioinformatics and research related to diseases and the development of drugs (Bao et al., 2021). However, many investigators require an operational model for the early identification and diagnosis of CD. Recently, Chen et al. developed and validated a predictive nomogram for CD, which can identify potential biomarkers for a diagnosis of CD (Chen et al., 2020). However, few studies have focused on the construction of a predictive model for CD diagnosis from the perspective of an artificial neural network (ANN).
A neural network combined with artificial intelligence has gradually been applied to the medical field to help physicians cope with large amounts of data and implement precision medicine more conveniently. ANN is a type of deep learning, which was inspired by the human brain. The specific algorithm of artificial neural networks is based on the learning and trail-and-error techniques. Previous studies of ANN mainly focused on the prediction and prognosis of tumors (Kourou et al., 2015; Daoud and Mayo, 2019; Albaradei et al., 2021). Our study aimed to establish an artificial neural network model for CD based on the weight of candidate genes and to investigate the different immune cell types between the CD and control groups. Given the superiority of this model in this study, it can be used to effectively distinguish between CD samples and normal samples, which will be of great significance for the diagnosis of CD in the future.
Materials and methods
Data collection and analysis
Three gene expression microarray datasets (GSE16879, GSE112366, and GSE36807) were selected from the Gene Expression Omnibus (GEO) database, an internationally available repository that provides several web-based tools to help users browse and download data. GSE16879 and GSE112366, whose platforms were based on GPL570 and GPL13158, respectively, were merged as a training cohort. The dataset GSE36807, also based on the platform GPL570, was used as a validation cohort. Three eligible datasets were incorporated into this study and the related information of the datasets is shown in Table 1.
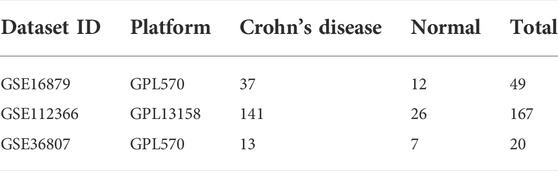
TABLE 1. Baseline characteristics of the training and validation cohorts.
Screening of DEGs and enrichment analysis
We selected DEGs in the CD and control groups using the “limma” package in R software. A |log-fold change (FC)|>1.2 and adjusted p-values < 0.05 were considered significant criteria to screen DEGs. To visualize the results, R package “ggplot2” and “pheatmap” were applied to transform the outcome into a volcano plot and heat map. To investigate whether there was differential expression between different phenotypes in CD, we excluded healthy samples in the training set and divided the biopsy samples into two groups according to different disease locations: colon and ileum groups. We selected DEGs between the colon and ileum groups using the same method. The result is also presented in the heat map. GO and KEGG enrichment analyses were performed to explore the biological functions and pathways of the DEGs between the CD and healthy control groups. An adjusted p-value < 0.05 was considered the cutoff value. The results of GO and KEGG enrichment analysis are shown as a bubble plot.
Protein-protein interaction (PPI) network construction and hub genes investigation
To study the functional connections of DEGs from a protein perspective, STRING analysis databases, common online platforms (https://cn.string-db.org/cgi/input.pl), include data on the physical interactions and full network function associations of proteins. Before constructing the PPI Network, we studied high-scoring physical interactions at the protein level. Only genes with a score >0.7 in STRING were considered significant and used to construct the PPI Network. The results were visualized by Cytoscape.
Identifying candidate genes by random forest
The R package “randomForset” was utilized to develop a random forest model to further screen out DEGs. First, 500 trees were seen as a variable of the model and the average miscalculation of all variables in the two groups was calculated. The optimal tree number was obtained by calculating the lowest error rate of cross validation. Next, a random forest was created according to the calculated parameters. Finally, the top 30 DEGs were identified as candidate genes based on the decreasing accuracy method to construct the ANN.
Construction and validation of the ANN prediction model
The first step for model construction was expression data processing, which transformed the 30 DEGs into a “Gene Score”. The score of candidate genes was analyzed based on their expression levels, which were compared with the median of all sample expression values. When the expression level of an upregulated gene is lower, it will receive a score of 0, otherwise it is assigned a value of 1. When the expression level of a downregulated gene is lower, it will receive a score of 1, otherwise it is assigned a value of 0.
Then, we developed a “Gene Score” sheet, which included 216 lines of samples and 30 columns of DEGs. The R package “neuralnet” was used to develop an ANN model, which included five hidden layers. In this model, the result of the output layer was determined by the sum of the gene score multiplied by the gene weight. Considering the potential impact of biopsy samples in different disease locations on the diagnostic model, we performed binary logistic regression to analyze the influence of disease location on the diagnosis of CD. A p-value < 0.05 was considered statistically significant. The performance of the model was assessed by ROC analysis and presented as the area under the ROC curve (AUC). To verify the applicability of the model, the microarray data of GSE36807 were obtained from the GEO database and the genetic expression information was transformed into a gene score in the same way.
Immune infiltration analysis
CIBERSORT is an algorithm that accurately estimates the immune cell composition of tissues based on gene expression profiles. We obtained the proportion of 22 types of immune cells between CD and healthy individuals. A p-value <0.05 was considered the filtration condition and the findings were visualized in a bar plot. We used the R package “corrplot” to analyze the correlation of 22 types of immune cells, which was visualized in a heatmap. The R package “vioplot” was used to investigate the difference in infiltrating immune cells between CD and control samples.
Results
Identification of DEGs
The workflow of the study is illustrated in Figure 1. In this study, we merged the datasets GSE16879 and GSE112366 into a training cohort and removed the batch effect using the “Sva” package. The training cohort included 216 samples, of which 178 were from CD biopsy samples and 38 were from healthy biopsy samples. According to the foregoing criteria, 102 DEGs were determined by using the “limma” package from 16,933 genes in the training set (Figure 2A, Figure 2B). DEGs of different disease phenotypes in CD is presented in Figure 2C.
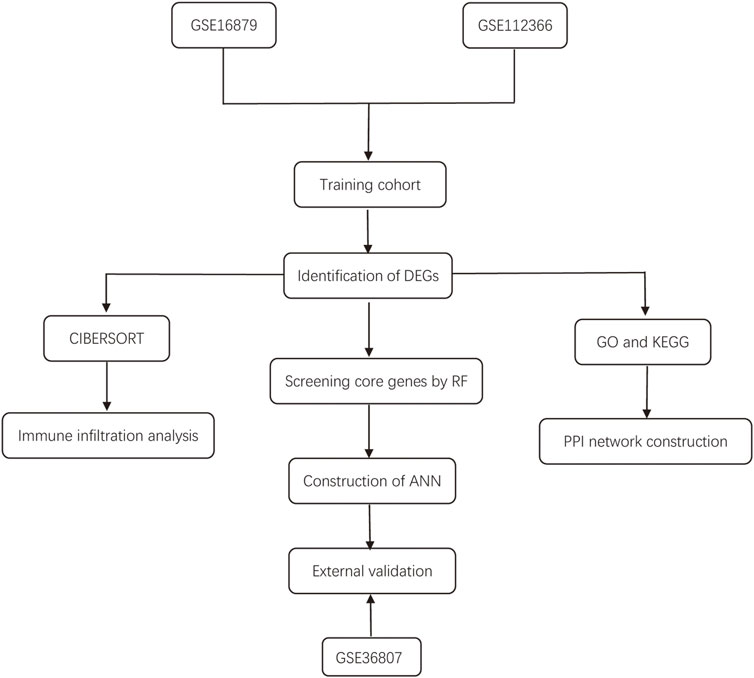
FIGURE 1. Flow diagram of the study design.
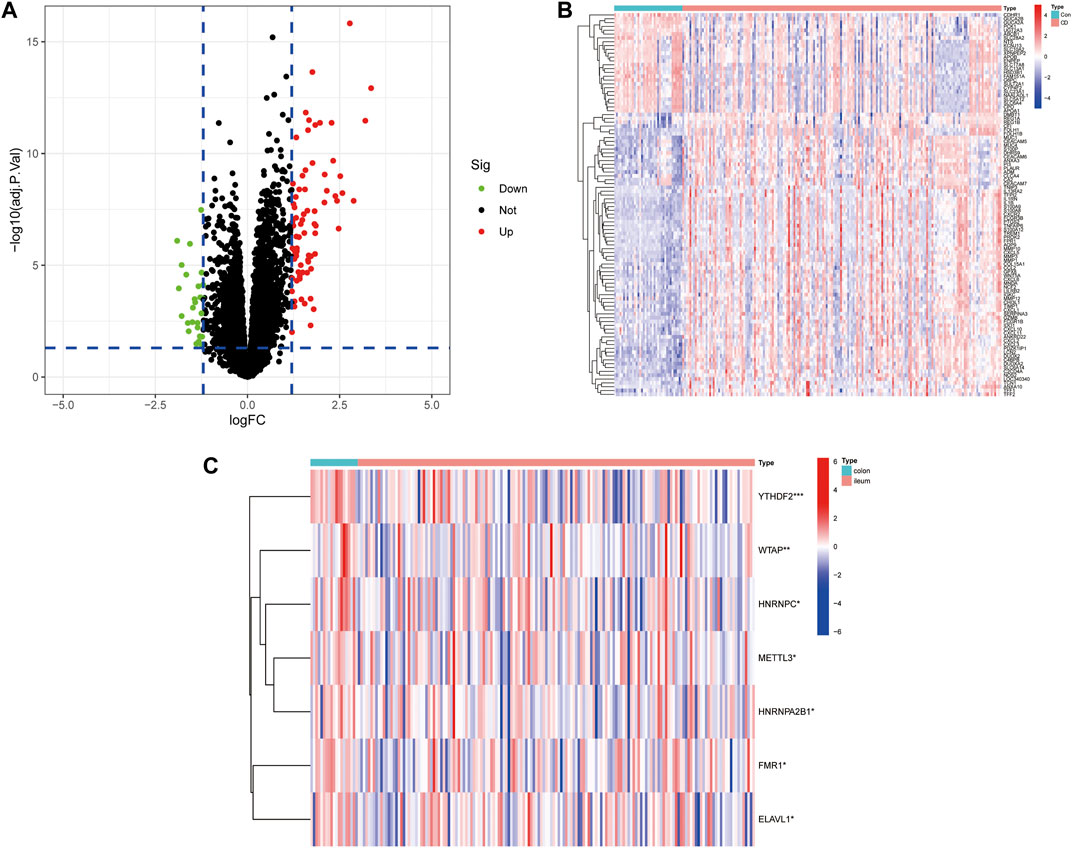
FIGURE 2. (A) A volcano plot of differentially expressed genes between Crohn’s disease and control groups. (B) Heatmap of DEGs between Crohn’s disease and control groups. (C) Heatmap of DEGs between colon and ileum groups in the Crohn’s disease group.
GO enrichment and KEGG pathway analysis of DEGs
As shown in Figure 3A, GO enrichment analysis demonstrated that DEGs were involved in biological processes associated with immune responses and inflammatory responses, including humoral immune responses, responses to molecules of bacterial origin, neutrophil chemotaxis and migration, granulocyte chemotaxis and migration, cytokine and chemokine activity, and CXCR chemokine receptor binding. KEGG pathway analysis revealed that DEGs were mainly enriched in the inflammatory signaling pathway, including the IL-17 signaling pathway, TNF signaling pathway, and chemokine signaling pathway, which have a vital role in the development of CD (Figure 3B).
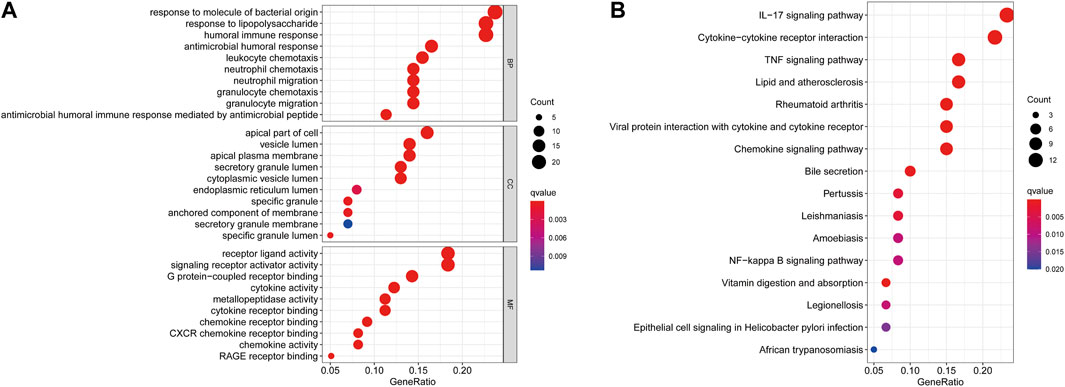
FIGURE 3. GO (A) and KEGG (B) enrichment analysis of differentially expressed genes between the CD and healthy control groups.
PPI network analysis and selection of hub genes
The physical interaction of proteins in the STRING network is shown in Figure 4A. To explore the related information of DEGs at the protein level, we used the STRING database to construct a PPI network, which consisted of 61 nodes and 106 edges (Figure 4B). According to the PPI network, we gained a total of 15 Hub genes (Figure 4C). The top three hub genes were IL-1β, CCL2, and CXCR2.
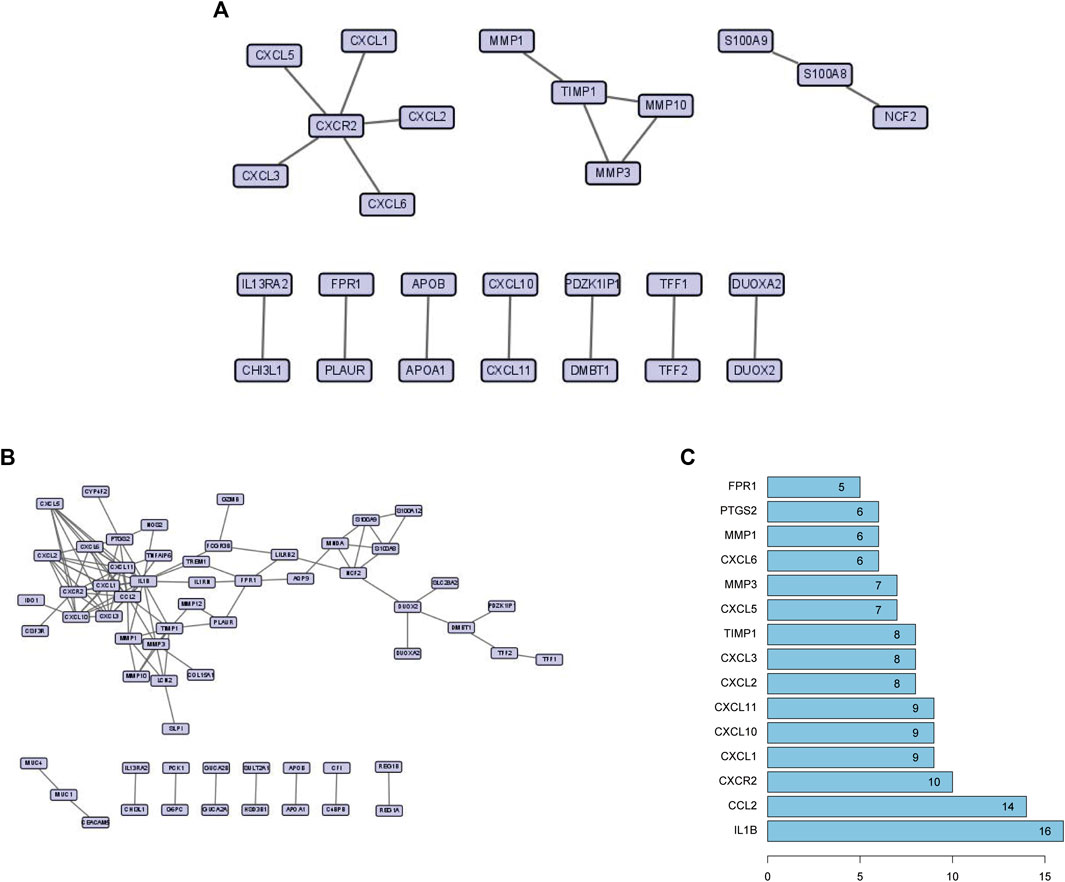
FIGURE 4. (A) High-scoring physical interactions from the STRING network. (B) A protein-protein interaction network of differentially expressed genes. (C) The top 15 hub genes and their degree values of modules.
Screening characteristic genes by random forest
First, 102 DEGs were identified and incorporated into the random forest classifier. Then, we calculated the average error rate of the CD and healthy groups, respectively and observed that the error of cross validation was minimum when the number of trees was 38 (Figure 5A). Subsequently, the 30 DEGs were screened by random forest for subsequent analysis and the importance of 30 DEGs is presented in Figure 5B.
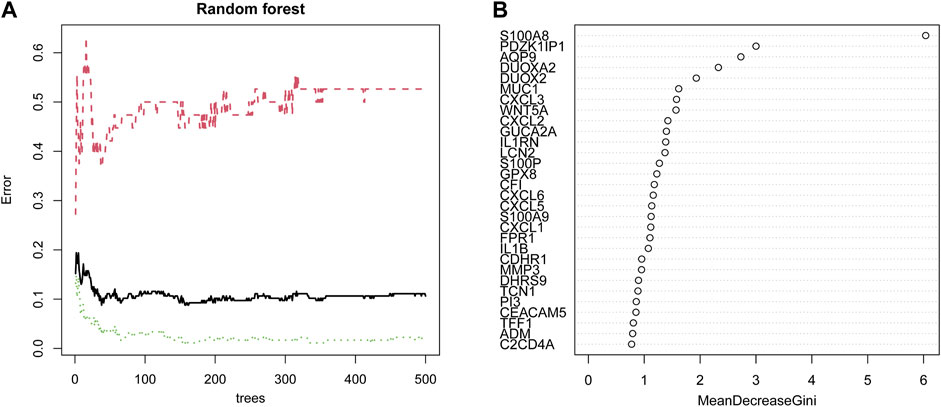
FIGURE 5. Identification of candidate genes by random forest. (A) The influence of the number of decision trees on the error rate. The x-axis represents the number of decision trees, and the y-axis indicates the error rate. (B) The importance of the top 30 genes identified by random forest. The candidate genes were identified based on the algorithm requirements of the random forest.
Construction and validation of the diagnostic model
The thirty characteristic gene scores were incorporated into the Neural Network to build a diagnostic prediction model, which included three parts: an input layer, hidden layer, and output layer (Figure 6A). A deep machine learning algorithm was performed based on the candidate gene weight to establish the ANN model, whose formula was calculated as follows: Neural CD = ∑ (Gene Score*Gene Weight). Based on the output results obtained from the neural network model, we observed that the entire training process was repeatedly conducted 2709 times. A detailed description of gene weight is shown in Table 2. Binary logistic regression analysis showed that the effect of disease location on the diagnosis of CD was not statistically significant (Table 3). The accuracy of the Neural Network to predict CD in the training and validation sets is presented in Table 4 and Table 5, respectively. We obtained positive predictive values of the training and validation sets (93.3 and 92.3, respectively), based on the Bayes algorithm. As shown in Figure 6B, the AUC of the predictive model was 0.984 [95% confidence interval (CI): 0.971–0.993], indicating that the model manifested an excellent predictive performance for CD. We used the random forest classifier to identify 30 DEGs in the validation set, which were the same as those in the training set. The AUC of the validation set was 0.945, demonstrating the credibility and stability of our model (Figure 6C).
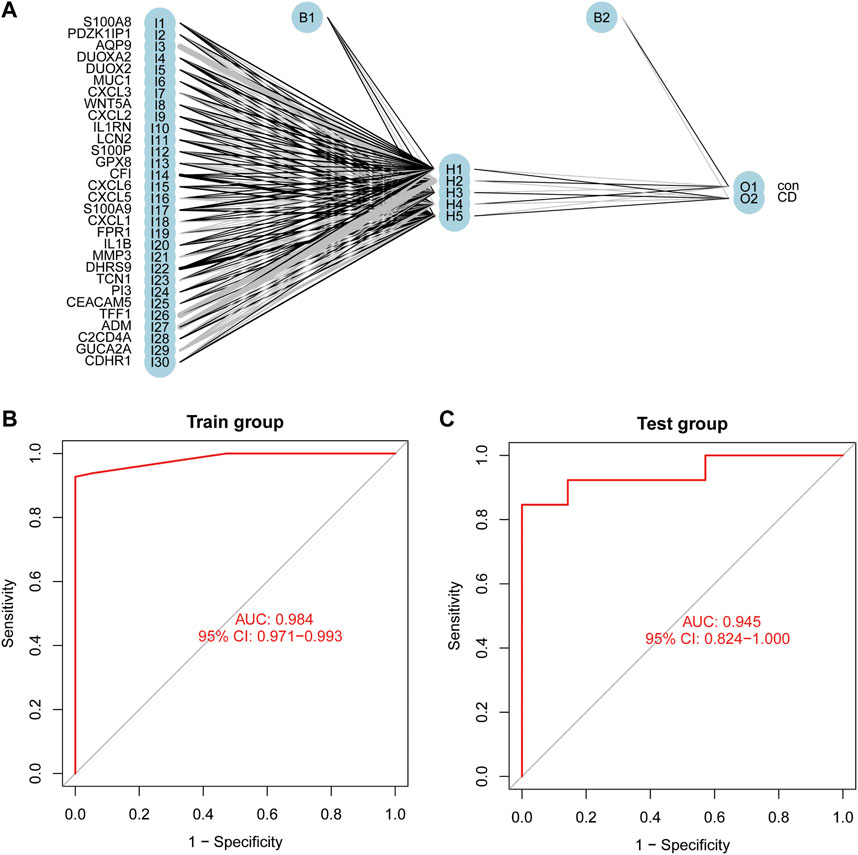
FIGURE 6. Construction of an Artificial Neural Network (ANN). (A) The result of ANN. (B) The AUC of the training cohort. (C) The AUC of the validation cohort.
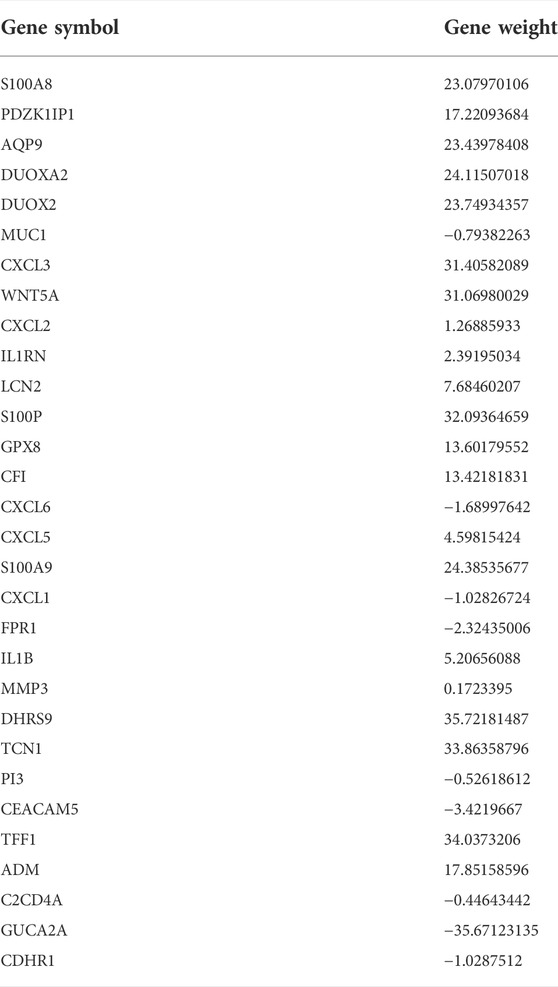
TABLE 2. The gene weight of candidate genes.
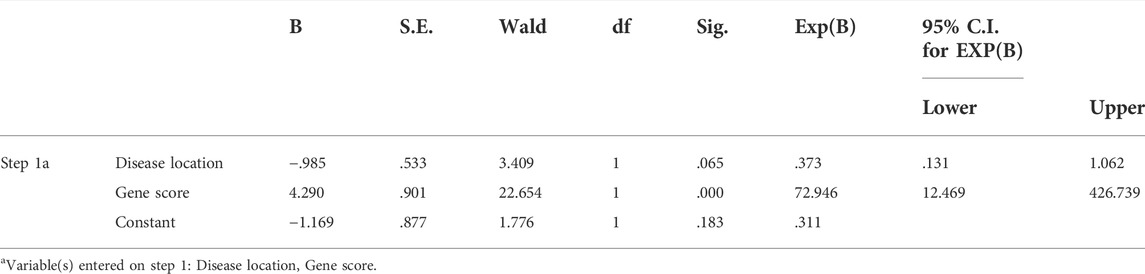
TABLE 3. Binary logistic regression analysis.
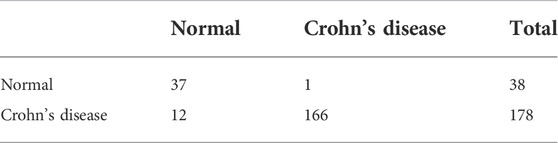
TABLE 4. The accuracy of this model for predicting Crohn’s disease in the training cohort.

TABLE 5. The accuracy of this model for predicting Crohn’s disease in the validation cohort.
Immune infiltration analysis
To evaluate the proportion of the 22 types of immune cells in the CD and normal groups, we used the CIBERSORT algorithm and the results are shown as a bar plot (Figure 7A). The relevant heatmap analysis of immune cells is shown in Figure 7B, in which neutrophils were positively related to activated mast cells (r = 0.46), whereas memory B cells were negatively correlated with plasma cells (r = −0.55). Violin plots (Figure 7C) showing the immune landscape derived from the CIBERSORT algorithm revealed that CD patients had higher levels of plasma cells, CD8 T cells, follicular helper T cells, monocytes, M1 macrophages, eosinophils, and neutrophils compared with the normal group (p < 0.05). Consequently, these findings indicated a considerable difference in immune cell composition between the CD and healthy groups.
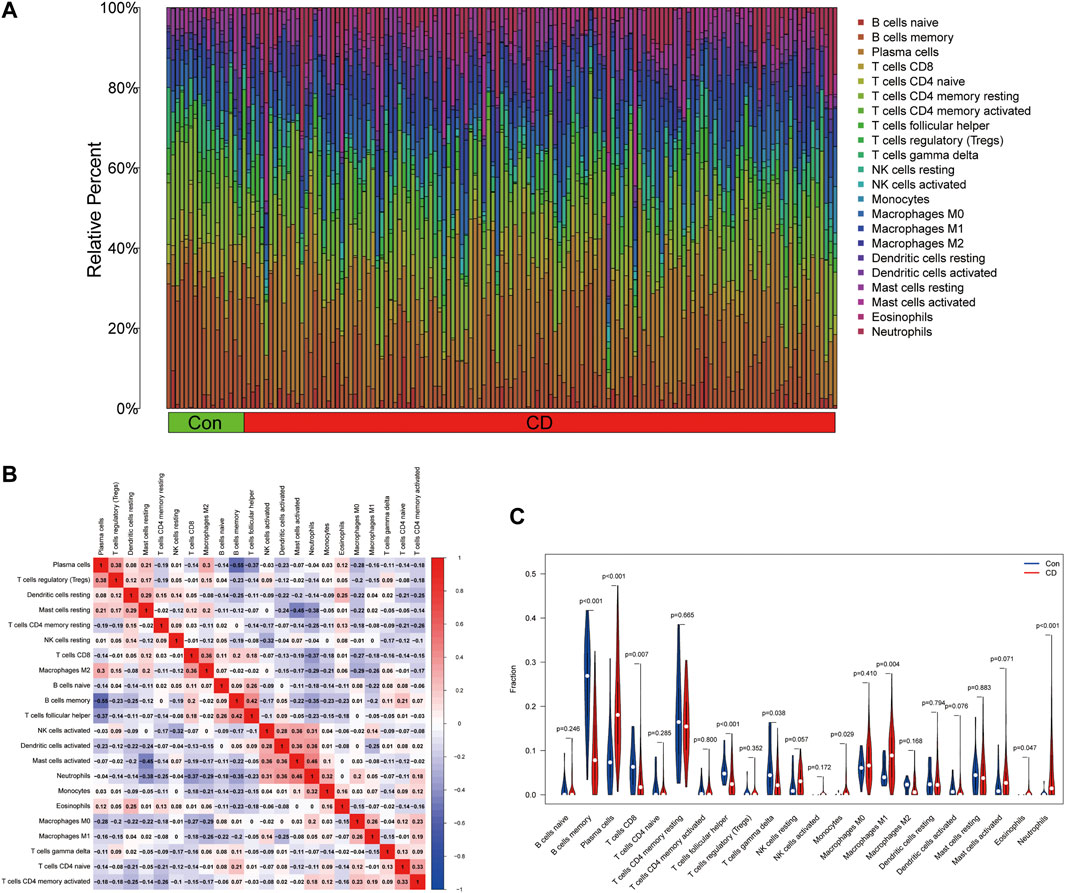
FIGURE 7. Estimation of the immune composition in tissues using CIBERSORT. (A) The proportion of 22 types of immune cells in CD patients and healthy individuals. (B) Correlation heatmap of 22 types of immune cells. (C) Differences in the amount of immune cell infiltration between CD and control samples.
Discussion
CD is a global public health problem, which threatens human health and living quality. Although the etiology of CD remains unclear, accumulating evidence indicates that the initiation of CD is significantly correlated with immunological lesions and the prominent infiltration of immune cells including T lymphocytes, macrophages, neutrophils, and plasma cells (Ramos and Papadakis, 2019). Despite its low mortality rate, its high disability rate and expense require systematic healthcare management (Hsieh et al., 2020). The first step for the effective healthcare management of CD is a definitive diagnosis, which is still a big challenge for physicians. Therefore, the development of an effective tool to diagnose CD is urgently required. A predictive model was developed to diagnose CD on the basis of deep machine learning algorithms, which has already been widely applied to the medical field to solve complicated clinical problems.
In the present study, we identified 102 DEGs associated with CD from two publicly available datasets and obtained candidate genes by a random forest classifier. GO and KEGG enrichment analysis of DEGs suggested a link between inflammatory responses and the occurrence of CD, which was reported previously (Banks et al., 2003). Singh et al. found a marked increase in cytokines and chemokines in CD patients compared with control donors, which aggravated intestinal inflammation and injury (Singh et al., 2016). Cytokines mediate inflammation, and pro-inflammatory cytokines and anti-inflammatory cytokines have a crucial role in regulating intestinal homeostasis (Moldoveanu et al., 2015; Chen et al., 2021). The aim of the targeted treatment of CD is to balance immune responses by modulating pro-inflammation and intensifying anti-inflammation. Furthermore, the top three hub genes in the PPI network were IL-1β, CCL2, and CXCR2. CCL2 and CXCR2, which belong to different subfamilies of chemokines, functioned as active biomarkers (Mello et al., 2021). Li et al. reported that CXCR2, a specific receptor for CXCL2/CXCL5, which are overexpressed in mesenchymal stromal cells (MSCs), promoted the migration of MSCs to sites of damage and achieved good therapeutic effects in an IBD mouse model (Li et al., 2021). Of note, the hub genes based on the PPI network might have an indispensable role in the pathogenesis of CD. Previous investigations indicated that IL-1β acted as an inflammasome and was overexpressed in the intestinal mucosa of CD patients (Moriyama et al., 2005; Mao et al., 2018). Inflammasomes secreted by immune cells have a pivotal role in the perpetuation of chronic and active inflammation (Zhen and Zhang, 2019; Jackson and Theiss, 2020; Mahapatro et al., 2021).
In addition, CIBERSORT analysis presented a landscape of 22 immune cells and we analyzed the differences between CD patients and healthy donors. Innate immunity is an immediate non-specific response, in which pathogens are recognized and innate immune cells include macrophages, neutrophils, dendritic cells, and natural killer cells are activated (Xu et al., 2014; Holleran et al., 2017). The intestinal innate immune system protects the mucosa by immune defense and surveillance. Recent research demonstrated that the innate immune response is equally significant as adaptive immunity in CD. In addition to defense against many aggressors, innate immunity also contributes to abnormal immune responses, such as autophagy, innate microbial sensing, and antimicrobial peptide production, which are linked to CD pathogenesis (Geremia et al., 2014; Zhou et al., 2019; Castellanos and Longman, 2020). Based on our findings, the numbers of plasma cells and CD8 T cells in patients with CD were higher than in the normal group, as were the follicular helper T cells, monocytes, M1 macrophages, and neutrophils.
To the best of our knowledge, this is the first study to combine a random forest classifier with an ANN algorithm to develop a diagnostic prediction model for CD, which had a good performance when discriminating CD from healthy controls. S100A8 was the best candidate gene identified by a random forest classifier in our study. A recent study reported that the expression levels of serum biomarkers, including S100A8, were elevated in patients who later had a disease relapse (Kessel et al., 2021). It was also reported that maintaining the production balance of S100A8 might be involved in intestinal homeostasis (Fujita et al., 2018; Loh et al., 2021). Due to its high efficiency and accuracy, random forest algorithms as a type of ensemble learning method have been successful in the prediction and identification of clinical disease (Savargiv et al., 2021). Wang et al. developed a model to predict coronary artery disease using a random forest algorithm, which had good discrimination abilities (Wang et al., 2021). Another study demonstrated that endobronchial optical coherence tomography based on a random forest algorithm was effective for the detection of early malignant pulmonary disease (Ding et al., 2021). A recent study reported that Support Vector Machines and multi-layer neural network models were developed to predict a protein’s post translational modification sites, which contributed to solving a difficult problem in the field of molecular biology (Bao et al., 2018). ANN have also increasingly been used in gastrointestinal disease because of its outstanding performance in diagnostic and prognostic prediction (Cao et al., 2021). In the 1990s, Karakitsos et al. reported the use of ANN to detect malignant gastric lesions with a discrimination performance of 97% (Karakitsos et al., 1998). Furthermore, a previous study reported combining machine algorithms to predict the migration of cancer cells (Zhang et al., 2018). Moreover, a joint machine algorithm of a random forest and ANN contributed to a diagnosis of non-tumor diseases including heart failure (Tian et al., 2020). Li et al. also successfully developed a novel diagnostic model for UC integrating a random forest and ANN algorithm (Li et al., 2020). Therefore, corresponding deep machine learning should be applicable for the diagnosis of CD. Several studies have focused on potential biomarkers as predictive factors to develop a model for CD diagnosis. The prediction performance in our study had better accuracy and precision compared with previous investigations. It is essential to further explore the use of joint algorithms for the prognosis and treatment of inflammatory bowel disease in the future.
Although this study developed a new prediction model for CD based on high-throughput sequencing data, there were several limitations that should be taken into account. First, our study was a retrospective analysis and the sample size was relatively small. Due to the use of a public limited database, there was a mismatch between the CD patients and controls. In the future, a prospective study with a large sample of matching data is required to demonstrate the reliability of this finding. Second, our training cohort consisted of different platform datasets; therefore, the these differences in study design and measurement errors might have influenced the study results. Third, due to the lack of laboratory investigation, the specific role of each immune cell type in the pathogenesis of CD was not be completely elucidated.
However, this research provides a novel insight into the accurate diagnosis of CD, and identified potential biomarkers for precise treatment.
Conclusion
Based on the points mentioned above, the correlation analysis of immune cells helped us to enhance our current understanding of the etiology of CD. A co-operative diagnosis model using a random forest and ANN was an effective diagnostic method for CD, and had good predictive performance in the training and validation sets. However, clinical trials are needed to investigate and validate the credibility of our findings.
Data availability statement
The original contributions presented in the study are included in the article/Supplementary material, and further inquiries can be directed to the corresponding author.
Author contributions
YY performed the study and completed the manuscript. LX, YQ, and TW helped analyze the data and revised the manuscript. QZ helped design the experiments and revise the manuscript. The final draft of the manuscript has been read and approved by all writers.
Acknowledgments
We want to thank all contributors for this study.
Conflict of interest
The authors declare that the research was conducted in the absence of any commercial or financial relationships that could be construed as a potential conflict of interest.
Publisher’s note
All claims expressed in this article are solely those of the authors and do not necessarily represent those of their affiliated organizations, or those of the publisher, the editors and the reviewers. Any product that may be evaluated in this article, or claim that may be made by its manufacturer, is not guaranteed or endorsed by the publisher.
References
Albaradei, S., Thafar, M., Alsaedi, A., Van Neste, C., Gojobori, T., Essack, M., et al. (2021). Machine learning and deep learning methods that use omics data for metastasis prediction. Comput. Struct. Biotechnol. J. 19, 5008–5018. doi:10.1016/j.csbj.2021.09.001
Banks, C., Bateman, A., Payne, R., Johnson, P., and Sheron, N. (2003). Chemokine expression in IBD. Mucosal chemokine expression is unselectively increased in both ulcerative colitis and Crohn's disease. J. Pathol. 199 (1), 28–35. doi:10.1002/path.1245
Bao, W., Cui, Q., Chen, B., and Yang, B. (2022). Phage_UniR_LGBM: Phage virion proteins classification with UniRep features and LightGBM model. Comput. Math. Methods Med. 2022, 9470683. doi:10.1155/2022/9470683
Bao, W., Yang, B., and Chen, B. (2021). 2-hydr_Ensemble: Lysine 2-hydroxyisobutyrylation identification with ensemble method. Chemom. Intelligent Laboratory Syst. 215, 104351. doi:10.1016/j.chemolab.2021.104351
Bao, W., Yuan, C. A., Zhang, Y., Han, K., Nandi, A. K., Honig, B., et al. (2018). Mutli-features prediction of protein translational modification sites. IEEE/ACM Trans. Comput. Biol. Bioinform. 15 (5), 1453–1460. doi:10.1109/TCBB.2017.2752703
Cao, B., Zhang, K. C., Wei, B., and Chen, L. (2021). Status quo and future prospects of artificial neural network from the perspective of gastroenterologists. World J. Gastroenterol. 27 (21), 2681–2709. doi:10.3748/wjg.v27.i21.2681
Castellanos, J. G., and Longman, R. S. (2020). Innate lymphoid cells link gut microbes with mucosal T cell immunity. Gut Microbes 11 (2), 231–236. doi:10.1080/19490976.2019.1638725
Chen, H., Chen, C., Yuan, X., Xu, W., Yang, M. Q., Li, Q., et al. (2020). Identification of immune cell landscape and construction of a novel diagnostic nomogram for crohn's disease. Front. Genet. 11, 423. doi:10.3389/fgene.2020.00423
Chen, Y., Cui, W., Li, X., and Yang, H. (2021). Interaction between commensal bacteria, immune response and the intestinal barrier in inflammatory bowel disease. Front. Immunol. 12, 761981. doi:10.3389/fimmu.2021.761981
Daoud, M., and Mayo, M. (2019). A survey of neural network-based cancer prediction models from microarray data. Artif. Intell. Med. 97, 204–214. doi:10.1016/j.artmed.2019.01.006
Ding, M., Pan, S. Y., Huang, J., Yuan, C., Zhang, Q., Zhu, X. L., et al. (2021). Optical coherence tomography for identification of malignant pulmonary nodules based on random forest machine learning algorithm. PLoS One 16 (12), e0260600. doi:10.1371/journal.pone.0260600
Fujita, Y., Khateb, A., Li, Y., Tinoco, R., Zhang, T., Bar-Yoseph, H., et al. (2018). Regulation of S100A8 stability by RNF5 in intestinal epithelial cells determines intestinal inflammation and severity of colitis. Cell. Rep. 24 (12), 3296–3311. e3296. doi:10.1016/j.celrep.2018.08.057
Geremia, A., Biancheri, P., Allan, P., Corazza, G. R., and Di Sabatino, A. (2014). Innate and adaptive immunity in inflammatory bowel disease. Autoimmun. Rev. 13 (1), 3–10. doi:10.1016/j.autrev.2013.06.004
Holleran, G., Lopetuso, L., Petito, V., Graziani, C., Ianiro, G., McNamara, D., et al. (2017). The innate and adaptive immune system as targets for biologic therapies in inflammatory bowel disease. Int. J. Mol. Sci. 18 (10), 2020. doi:10.3390/ijms18102020
Hsieh, M. S., Hsu, W. H., Wang, J. W., Wang, Y. K., Hu, H. M., Chang, W. K., et al. (2020). Nutritional and dietary strategy in the clinical care of inflammatory bowel disease. J. Formos. Med. Assoc. 119 (12), 1742–1749. doi:10.1016/j.jfma.2019.09.005
Jackson, D. N., and Theiss, A. L. (2020). Gut bacteria signaling to mitochondria in intestinal inflammation and cancer. Gut Microbes 11 (3), 285–304. doi:10.1080/19490976.2019.1592421
Karakitsos, P., Ioakim-Liossi, A., Pouliakis, A., Botsoli-Stergiou, E. M., Tzivras, M., Archimandritis, A., et al. (1998). A comparative study of three variations of the learning vector quantizer in the discrimination of benign from malignant gastric cells. Cytopathology 9 (2), 114–125. doi:10.1046/j.1365-2303.1998.00063.x
Kessel, C., Lavric, M., Weinhage, T., Brueckner, M., de Roock, S., Däbritz, J., et al. (2021). Serum biomarkers confirming stable remission in inflammatory bowel disease. Sci. Rep. 11 (1), 6690. doi:10.1038/s41598-021-86251-w
Kourou, K., Exarchos, T. P., Exarchos, K. P., Karamouzis, M. V., and Fotiadis, D. I. (2015). Machine learning applications in cancer prognosis and prediction. Comput. Struct. Biotechnol. J. 13, 8–17. doi:10.1016/j.csbj.2014.11.005
Li, H., Lai, L., and Shen, J. (2020). Development of a susceptibility gene based novel predictive model for the diagnosis of ulcerative colitis using random forest and artificial neural network. Aging (Albany NY) 12 (20), 20471–20482. doi:10.18632/aging.103861
Li, N., and Shi, R. H. (2018). Updated review on immune factors in pathogenesis of Crohn's disease. World J. Gastroenterol. 24 (1), 15–22. doi:10.3748/wjg.v24.i1.15
Li, Q., Lian, Y., Deng, Y., Chen, J., Wu, T., Lai, X., et al. (2021). mRNA-engineered mesenchymal stromal cells expressing CXCR2 enhances cell migration and improves recovery in IBD. Mol. Ther. Nucleic Acids 26, 222–236. doi:10.1016/j.omtn.2021.07.009
Loh, J. T., Lee, K. G., Lee, A. P., Teo, J. K. H., Lim, H. L., Kim, S. S., et al. (2021). DOK3 maintains intestinal homeostasis by suppressing JAK2/STAT3 signaling and S100a8/9 production in neutrophils. Cell. Death Dis. 12 (11), 1054. doi:10.1038/s41419-021-04357-5
Mahapatro, M., Erkert, L., and Becker, C. (2021). Cytokine-mediated crosstalk between immune cells and epithelial cells in the gut. Cells 10 (1), 111. doi:10.3390/cells10010111
Mao, L., Kitani, A., Strober, W., and Fuss, I. J. (2018). The role of NLRP3 and IL-1β in the pathogenesis of inflammatory bowel disease. Front. Immunol. 9, 2566. doi:10.3389/fimmu.2018.02566
Mello, J. D. C., Gomes, L. E. M., Silva, J. F., Siqueira, N. S. N., Pascoal, L. B., Martinez, C. A. R., et al. (2021). The role of chemokines and adipokines as biomarkers of crohn's disease activity: A systematic review of the literature. Am. J. Transl. Res. 13 (8), 8561–8574.
Moldoveanu, A. C., Diculescu, M., and Braticevici, C. F. (2015). Cytokines in inflammatory bowel disease. Rom. J. Intern Med. 53 (2), 118–127. doi:10.1515/rjim-2015-0016
Moriyama, T., Matsumoto, T., Jo, Y., Yada, S., Hirahashi, M., Yao, T., et al. (2005). Mucosal proinflammatory cytokine and chemokine expression of gastroduodenal lesions in Crohn's disease. Aliment. Pharmacol. Ther. 21, 85–91. doi:10.1111/j.1365-2036.2005.02480.x
Ramos, G. P., and Papadakis, K. A. (2019). Mechanisms of disease: Inflammatory bowel diseases. Mayo Clin. Proc. 94 (1), 155–165. doi:10.1016/j.mayocp.2018.09.013
Savargiv, M., Masoumi, B., and Keyvanpour, M. R. (2021). A new random forest algorithm based on learning automata. Comput. Intell. Neurosci. 2021, 5572781. doi:10.1155/2021/5572781
Seyedian, S. S., Nokhostin, F., and Malamir, M. D. (2019). A review of the diagnosis, prevention, and treatment methods of inflammatory bowel disease. J. Med. Life 12 (2), 113–122. doi:10.25122/jml-2018-0075
Singh, U. P., Singh, N. P., Murphy, E. A., Price, R. L., Fayad, R., Nagarkatti, M., et al. (2016). Chemokine and cytokine levels in inflammatory bowel disease patients. Cytokine 77, 44–49. doi:10.1016/j.cyto.2015.10.008
Tian, Y., Yang, J., Lan, M., and Zou, T. (2020). Construction and analysis of a joint diagnosis model of random forest and artificial neural network for heart failure. Aging (Albany NY) 12 (24), 26221–26235. doi:10.18632/aging.202405
Wang, C., Zhao, Y., Jin, B., Gan, X., Liang, B., Xiang, Y., et al. (2021). Development and validation of a predictive model for coronary artery disease using machine learning. Front. Cardiovasc. Med. 8, 614204. doi:10.3389/fcvm.2021.614204
Wehkamp, J., Götz, M., Herrlinger, K., Steurer, W., and Stange, E. F. (2016). Inflammatory bowel disease. Dtsch. Arztebl. Int. 113 (5), 72–82. doi:10.3238/arztebl.2016.0072
Xu, X. R., Liu, C. Q., Feng, B. S., and Liu, Z. J. (2014). Dysregulation of mucosal immune response in pathogenesis of inflammatory bowel disease. World J. Gastroenterol. 20 (12), 3255–3264. doi:10.3748/wjg.v20.i12.3255
Zhang, Y. Z., and Li, Y. Y. (2014). Inflammatory bowel disease: Pathogenesis. World J. Gastroenterol. 20 (1), 91–99. doi:10.3748/wjg.v20.i1.91
Zhang, Z., Chen, L., Humphries, B., Brien, R., Wicha, M. S., Luker, K. E., et al. (2018). Morphology-based prediction of cancer cell migration using an artificial neural network and a random decision forest. Integr. Biol. 10 (12), 758–767. doi:10.1039/c8ib00106e
Zhen, Y., and Zhang, H. (2019). NLRP3 inflammasome and inflammatory bowel disease. Front. Immunol. 10, 276. doi:10.3389/fimmu.2019.00276
Keywords: inflammatory bowel disease, Crohn’s disease, immune cells, bioinformatics, artificial neural network model
Citation: Yang Y, Xu L, Qiao Y, Wang T and Zheng Q (2022) Construction of a neural network diagnostic model and investigation of immune infiltration characteristics for Crohn’s disease. Front. Genet. 13:976578. doi: 10.3389/fgene.2022.976578
Received: 23 June 2022; Accepted: 16 August 2022;
Published: 15 September 2022.
Edited by:
Alfredo Pulvirenti, University of Catania, ItalyReviewed by:
Padhmanand Sudhakar, KU Leuven, BelgiumWenzheng Bao, Xuzhou University of Technology, China
Copyright © 2022 Yang, Xu, Qiao, Wang and Zheng. This is an open-access article distributed under the terms of the Creative Commons Attribution License (CC BY). The use, distribution or reproduction in other forums is permitted, provided the original author(s) and the copyright owner(s) are credited and that the original publication in this journal is cited, in accordance with accepted academic practice. No use, distribution or reproduction is permitted which does not comply with these terms.
*Correspondence: Qing Zheng, emhlbmdxaW5nQHJlbmppLmNvbQ==