 Mang Liang1†Bingxing An1†
 Tianyu Deng1Lili Du1Keanning Li1Sheng Cao1Yueying Du1
 Lingyang Xu1
 Lupei Zhang1
 Xue Gao1Yang Cao2Yuming Zhao2
 Junya Li1
 Huijiang Gao1*
- 1Institute of Animal Science, Chinese Academy of Agricultural Sciences, Beijing, China
- 2Jilin Academy of Agricultural Sciences, Changchun, China
Locating the genetic variation of important livestock and poultry economic traits is essential for genetic improvement in breeding programs. Identifying the candidate genes for the productive ability of Huaxi cattle was one crucial element for practical breeding. Based on the genotype and phenotype data of 1,478 individuals and the RNA-seq data of 120 individuals contained in 1,478 individuals, we implemented genome-wide association studies (GWAS), transcriptome-wide association studies (TWAS), and Fisher’s combined test (FCT) to identify the candidate genes for the carcass trait, the weight of longissimus dorsi muscle (LDM). The results indicated that GWAS, TWAS, and FCT identified seven candidate genes for LDM altogether: PENK was located by GWAS and FCT, PPAT was located by TWAS and FCT, and XKR4, MTMR3, FGFRL1, DHRS4, and LAP3 were only located by one of the methods. After functional analysis of these candidate genes and referring to the reported studies, we found that they were mainly functional in the progress of the development of the body and the growth of muscle cells. Combining advanced breeding techniques such as gene editing with our study will significantly accelerate the genetic improvement for the future breeding of Huaxi cattle.
Introduction
In ancient China, cattle, as the primary means of production, were mainly used as the draft ox and rarely considered the source of meat. With the rapid development of the economy, consumers’ demand for beef, concerning quantity and quality, has increased in China. There is an urgent need to improve the productivity and quality of beef for the beef breed in China by directly changing the production capacity of beef cattle.
Locating the genetic variation of important livestock and poultry economic traits is still essential for genetic improvement. The genome-wide association study (GWAS) has successfully identified thousands of loci associated with complex features (Watanabe et al., 2019). However, 90% of the associated single nucleotide polymorphisms (SNPs) are located in the non-coding region of the gene, and their functions still are unknown, so the molecular mechanism of phenotypic variation cannot be explained clearly (Cannon and Mohlke, 2018). Previous studies have proved that gene expression is important in the phenotype of human diseases (He et al., 2013), and many genetic variations associated with phenotypes were likely to be expression quantitative trait loci (eQTL) (Nicolae et al., 2010). Furthermore, eQTL can be used to estimate the effects on gene expression and then be combined with physical phenotypes to conduct transcriptome-wide association studies (TWAS) to identify pivotal expression–trait associations (Gusev et al., 2016). The TWAS algorithm has been successfully implemented to identify the causal genes for the essential quantitative trait in cattle (Koupaie et al., 2019; Liu et al., 2021).
In this study, we utilized three strategies to identify the candidate genes that significantly affect the producibility of Huaxi cattle. First, we applied GWAS to identify the candidate gene by using 1,478 Huaxi cattle genotypes with the phenotypes of longissimus dorsi muscle (LDM) weight. Second, we implemented TWAS with genotypes (1,478 individuals), gene expression data of 120 individuals (contained in the 1,478 individuals), and phenotypes. Third, we utilized an ensemble approach, Fisher’s test (Yu et al., 2008; Kremling et al., 2019), combining the results of GWAS and TWAS to identify the candidate gene. Finally, we analyzed the function and preliminarily explored the molecular mechanism of the candidate genes with Gene Ontology (GO) and Kyoto Encyclopedia of Genes and Genomes (KEGG) analyses, which was helpful to the following breeding of Huaxi cattle.
Materials and methods
Animal resources and phenotype: The Huaxi cattle population, including 1,478 cattle born between 2008 and 2021, was established in Ulgai, Xilingol League, and Inner Mongolia of China. After weaning, all calves were moved to the Jinweifuren fattening farm in Beijing, where they shared uniform management and standardized feeding [they were fed with the total mixed ratio (TMR) according to the eighth revised edition of the Nutrition Requirements of Beef Cattle (NRC, 2006)]. Animals were slaughtered at 22–26 months of age with electrical stunning, followed by bloodletting. The weight of the longissimus dorsi muscle (LCM, kg) was weighed after being chilled at 4°C for 24 h.
Genotype and quality control: Genomic DNA was isolated from blood samples using the TIANamp Blood DNA Kit (Tiangen Biotech Co., Ltd., Beijing, China). DNA quality was acceptable when the A260/A280 ratio was in the range of 1.8–2.0. All individuals were genotyped using an Illumina BovineHD BeadChip that contained 770,000 SNPs. Quality control (QC) procedures were carried out using PLINK v1.9 (Purcell et al., 2007) to filter out SNPs with call rate <90%, minor allele frequency (MAF) < 0.05, and a significant deviation from the Hardy–Weinberg equilibrium (p < 10−6), and >10% animals with missing genotype data were removed from the analysis. Finally, 1,478 cattle with 607,198 SNPs on 29 autosomal chromosomes with an average distance of 3 kb were included in subsequent analyses.
RNA extraction, library construction, sequencing, and quality control: Total RNA was extracted from SAT samples using TRIzol reagent (Invitrogen, Life Technologies) following the manufacturers’ instructions. The RNA concentration, purity, and integrity were, respectively, analyzed on Qubit RNA Assay Kit (Life Technologies, CA, United States), NanoPhotometer Spectrophotometer (Thermo Fisher Scientific, MA, United States), and RNA Nano 6000 Assay Kit of the Bioanalyzer 2,100 system (Agilent Technologies, CA, United States). The high-quality samples with 28S/18S > 1.8 and OD 260/280 ratio >1.9 were applied for constructing cDNA libraries according to the protocol of IlluminaTruSeqTM RNA Kit (Illumina, United States). Samples that presented an RNA integrity number greater than 7.0 were then sent for paired-end RNA sequencing (read length 150 bp) on the Illumina NovaSeq 6,000 platform (Modi et al., 2021). The RNA sequencing was completed by Beijing Novogene Technology Co., Ltd. Trimmomatic (v0.39) was applied to remove the reads containing low-quality reads, poly-N, and adaptor sequences (Bolger et al., 2014). Sequentially, the clean reads were aligned to the Bos taurus reference genome ARS-UCD1.2 using HISAT2 (v2.2.1) (Lachmann et al., 2020), and then the generated SAM files were converted to BAM files through SAMtools (v1.11). featureCounts (v1.5.2) was used to estimate read counts (Liao et al., 2014).
GWAS: GWAS analysis of LDM traits based on the linear mixed model (LMM) was completed using GEMMA (Zhou and Stephens, 2012):
where
TWAS: REML (restricted maximum likelihood) was utilized to evaluate the heritability of each gene base on the gene expression and cis-SNPs located within 1 Mb of the physical position of the gene. Then, the gene with significantly non-zero heritability will be incorporated in the subsequent analysis. For the preselected gene, Bayesian Sparse LMM (BSLMM) was used to estimate the effect values of the cis-SNPs for gene expression, and the prediction model that estimated gene expression with cis-SNPs was constructed (Zhou et al., 2013). Afterward, the prediction model was utilized to estimate the gene expression values of the 1,358 individuals without transcriptome sequencing data but with genotypes (Dai et al., 2019; Zhou et al., 2020). Finally, all of the gene expression data were integrated with phenotypes to implement TWAS with LMM:
where y and b are the same as in GWAS, W is the design matrix of the gene expression matrix, which is constructed with transcripts per kilobase million (TPM) (Luningham et al., 2020),
Fisher’s combined test (FCT): The p-value in GWAS of each SNP in the top 10% of most associated SNPs was assigned to the nearest gene and then combined with the p-value in TWAS (linear model with multi-dimensional scaling (MDS) principal coordinates + 5 probabilistic estimation of expression residuals (PEERs)) for that same gene using Fisher’s combined test as implemented in the sumlog method in the metap package (Dewey 2017) in R. TWAS p-values for genes which were not tested in TWAS was set to p = 1 prior to combining with GWAS p-values (Kremling et al., 2019). Similarly, the significant gene test was implemented in FCT using FDR with an identical threshold of the p-value.
Gene functional analysis: Gene Ontology (GO) is a database describing the function of genes and proteins. It annotated the genes into three types of terms: MF, BP, and CC (Ashburner et al., 2000). The KEGG database integrated the genome, regulatory network, and system function information (Kanehisa et al., 2016). To explore the function of candidate genes, we applied DAVID (https://david.ncifcrf.gov/) to implement GO and KEGG analyses of the genes and constructed the associated network of the gene-participated terms using ToppCluster (https://toppcluster.cchmc.org/).
Results
Genome-wide association studies
Figure 1A shows the Manhattan plot and QQ-plot of the GWAS analysis of LDM. The QQ-plot showed that there was no apparent systematic deviation. Most of the points were distributed around the diagonal (the expansion coefficient is 1.05), which means that only a few SNPs were associated with the phenotype. The threshold of the p-value (p = 1.65 × 10⁻⁶) was set with Bonferroni’s multiple test, and three SNPs in the 14th chromosome were significantly associated with the phenotypes, among which BovineHD1400006836 and BovineHD4100011289 were annotated to PENK, BTB-00557532 was annotated to XKR4, and the reference cattle genome was ARS-UCD1.2 more details are demonstrated in Table 1.
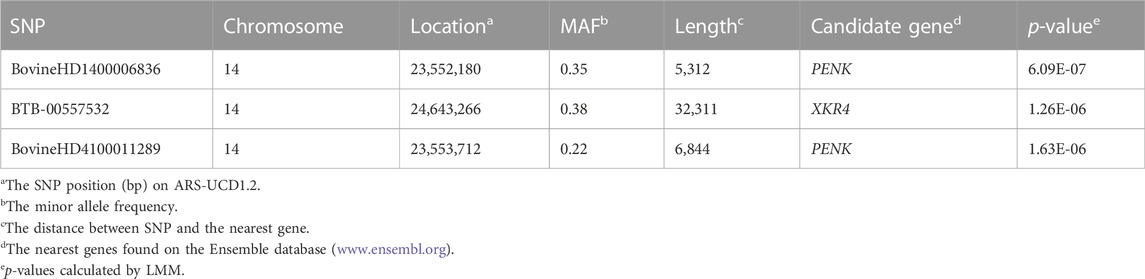
TABLE 1. Details of the significantly associated SNPs identified by GWAS.
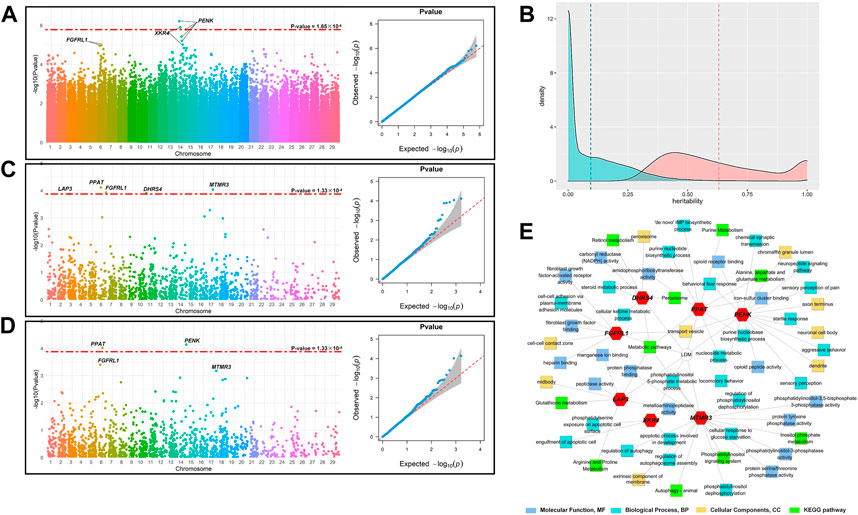
FIGURE 1. Identification of the candidate genes for LDM. (A) Manhattan plot and QQ plot of GWAS; the red dashed line indicates the threshold of Bonferroni’s multiple test, p = 1.65 × 10⁻⁶. (B) Manhattan and QQ plots of TWAS; the red dashed line indicates the threshold of the corrected p-value with FDR = 0.01 (p = 1.33 × 10⁻⁴). (C) Manhattan and QQ plots of FCT; the red dashed line indicates the threshold of the corrected p-value with FDR = 0.01 (p = 1.33 × 10⁻⁴). (D) Distribution of the estimated heritability of the genes. The blue area represents the distribution of the heritability of all gene expression, and the blue dashed line represents the mean of the heritability estimates of converged gene expression (0.152 ± 0.263); the orange area represents the expression of 1,650 significant genes (p < 0.05), and the orange dashed line represents the mean of the heritability estimates of significant gene expression (0.631 ± 0.324). (E) Results of GO and KEGG analyses of the candidate genes.
Transcriptome-wide association studies
After removing the genes with the average TPM (transcripts per kilobase million) less than 0.1, the expression levels of 15,325 genes of 120 individuals were assigned as phenotypes and 15,401 cis-SNPs, located within 1 Mb of the physical position of the gene, were assigned as the genotypes, and the heritability of the gene expression was estimated with REML. As shown in Figure 1B, the heritability of 15,324 genes converged in the progress of REML, and the average heritability was 0.152 ± 0.263. With p < 0.05 as the threshold, 1,650 genes were retained for the subsequent analysis, with an average heritability of 0.631 ± 0.324.
The Manhattan plot and QQ plot of TWAS for LDM were demonstrated in Figure 1C. The QQ-plot indicated that most points were distributed around the diagonal (expansion coefficient λ = 1.03), and several genes were significantly associated with LDM. After being corrected for the false discovery rate (FDR) of 0.01, the threshold of the p-value was set at 1.33 × 10⁻⁴, and five genes were found to be significantly associated with LDM. The location of these genes is listed in Table 2. PPAT (p = 7.68 × 10⁻⁵), MTMR3 (p = 9.11 × 10⁻⁵), FGFRL1 (p = 1.17 × 10⁻⁴), DHRS4 (p = 1.26 × 10⁻⁴), and LAP3 (p = 1.32 × 10⁻⁴) were located in chromosomes 6, 17, 6, 10, and 3, respectively.
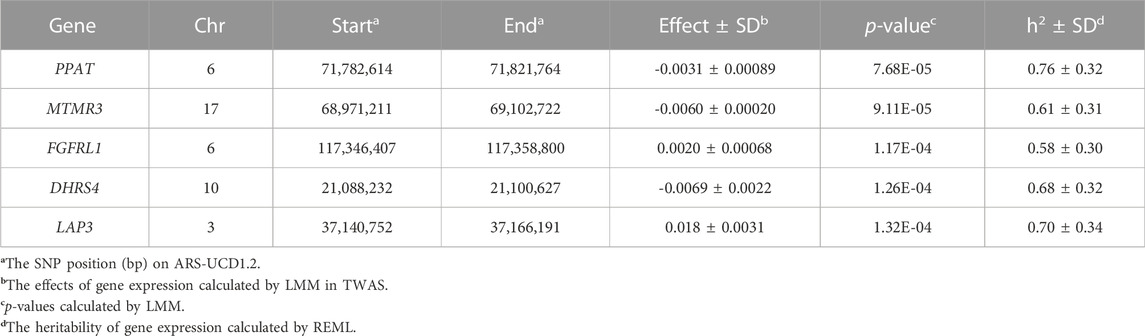
TABLE 2. Details of the five candidate genes identified by TWAS.
Fisher’s combined test
The Manhattan plot and QQ plot of FCT analysis are shown in Figure 1D. The expansion coefficient λ of the QQ-plot was 1.02 with no systematic deviation, and most points were distributed on the diagonal, with only a minority of points floating above the diagonal. As with TWAS, the threshold of the p-value was set at 1.33 × 10⁻⁴. The Manhattan plot indicated that FCT identified two candidate genes significantly associated with LDM, namely, PPAT (p = 9.69 × 10⁻⁵) and PENK (p = 7.26 × 10⁻⁵), which were also identified by TWAS and GWAS, respectively.
Functional analysis of candidate genes
Combining the results of GWAS, TWAS, and FCT, PENK, XKR4, PPAT, MTMR3, FGFRL1, DHRS4, and LAP3 were identified as the candidate genes of LDM. To further explore the function of these genes, we performed GO and KEGG analyses of these genes. The results are demonstrated in Figure 1E. These candidate genes participated in 48 GO terms, which contained 16 molecular function (MF) terms, 23 biological progress (BP) terms, and nine cellular component (CC) terms. For MF, the candidate genes mainly function in the progress of fibroblast growth factor activity regulation (GO:0005007 and GO:0017134), NADPH activity (GO:0004090), and serine, threonine, and tyrosine metabolism (GO:0004722 and GO:0004725). KEGG pathway analysis found that candidate genes were involved in 10 pathways, mainly including amino acid and peptide metabolism, signal transduction pathway, purine metabolism, and other biological processes.
Discussion
Abundant studies have proven that GWAS could precisely locate the candidate loci for the quantitative traits in livestock breeding, especially for the traits with high heritability. It was one of the most widespread methods used in plant and animal improvement programs. However, the regulatory mechanism from SNP to phenotypic variation was still unknown in most cases, and it was impossible to determine the genuine pathogenic gene of the trait associated with the candidate SNPs due to the linkage disequilibrium (LD) in the SNPs. In recent years, the innovation of sequencing technology provided more other omics biological information, transcriptome, metabolome, etc., and assisted in locating candidate genes more accurately. TWAS implement the association analysis based on the gene expression data with the phenotype to locate the candidate genes directly. The results of previous studies indicated that TWAS performed well in practice (Dai et al., 2019; Luningham et al., 2020; Li et al., 2021). In this study, we not only performed GWAS and TWAS individually but also utilized an ensemble approach, FCT, combining the results of GWAS and TWAS to locate the candidate genes for LDM.
For LDM in this study, we indented seven candidate genes by GWAS, TWAS, and FCT in total: PENK was located by GWAS and FCT, PPAT was located by TWAS and FCT, and the remaining five genes were only located by one of the methods. An et al. (2019) also located PENK, which was associated with the height of Brahman cattle and Nerol cattle populations. The studies on humans also found that PENK regulated cell development by encoding the opioid peptide growth factor (ORF) to affect height (Pryce et al., 2011). Zhan et al. (2014) found that a variation site (8p12.1) in XKR4 was associated with human thyroid-stimulating hormone (TSH) secretion, and it was the candidate gene for the development traits in Brahman cattle, Korean yellow cattle, Chinese Holstein cattle, and Chinese Sujiang pig populations (Lindholm-Perry et al., 2012; Edea et al., 2020; Naserkheil et al., 2020; Xu et al., 2020). The protein encoded by PPAT was a member of the purine/pyrimidine phosphoribosyltransferase family, which was essential in regulating the proliferation, migration, and invasion of thyroid cancer. Gene function analysis found PPAT functionals in inosinic acid biosynthesis (GO:0006189), and GART was the functional partner of PPAT, which had a fundamental impact on nucleotide metabolism and internal environment balance (Welin et al., 2010). MTMR3 is a member of the MTM family associated with muscular dysplasia, which participates in the cell progress of proliferation, differentiation, autophagy, and division by regulating the synthesis of myotube (Hnia et al., 2012). The reported studies have confirmed that MTMR3 was the virtually candidate gene in the Holstein population for the quantitative traits, such as milk fat rate, milk yield, and milk protein content (Pimentel et al., 2011). FGFRL1 encoded fibroblast growth factor receptor one, which plays a crucial role in the progress of cell adhesion, embryonic slow muscle fiber development, and bone tissue formation (Amann et al., 2014; Niu et al., 2015; Yang et al., 2016). Bluteau et al. (2014) indicated a slight reduction in the whole bone of the FGFRL1 gene knockout mice. The study on Holstein also identified FGFRL1 as a candidate gene for development traits in the Holstein population (Zhang et al., 2017). DHRS4 encodes NADP(H)-dependent retinol dehydrogenase/reductase. The study on pigs found that rs196958886, one of the SNPs of this gene, may induce the peroxisome proliferator-activated receptor alpha (PPARα) gene, affect the interaction between fatty acids and glucose metabolism, and ultimately affect the quality of pork (Hwang et al., 2017). LAP3 encodes leucine aminopeptidase, which is functional in protein metabolism and growth (Yao et al., 2020). Substantial studies on cattle found that LAP3 was a candidate gene that affects important production traits such as visceral organ weight, body size, and carcass traits (Setoguchi et al., 2009; Bongiorni et al., 2012; Xia et al., 2017; An et al., 2018; An et al., 2020). Zheng et al. (2011) implemented association analyses between LAP3 and milking traits in the Holstein population and concluded that LAP3 was the vital candidate gene for milking traits.
Conclusion
In conclusion, we identified seven candidate genes of LDM by GWAS, TWAS, and FCT based on genome and transcriptome information. According to the previous relevant studies and the results of gene function analysis, the candidate genes were mainly functional in the progress of the development of the body and the growth of muscle cells. Combining advanced breeding techniques such as gene editing with our study will significantly accelerate the genetic improvement of Huaxi cattle.
Data availability statement
The data presented in the study are deposited in the NCBI repository (https://www.ncbi.nlm.nih.gov/), accession number PRJNA721166, and DRYAD repository (https://datadryad.org/stash), accession number 10.5061/dryad.4qc06.
Author contributions
ML wrote the paper. JL and HG revised the paper. BA and LD performed experiments. TD, KL, SC, and YD collected the data. YC and YZ provided fund support. LX, XG, and LZ participated in the design of the study and contributed to the acquisition of data. All authors reviewed and approved the final manuscript.
Funding
This work was supported by funds from the National Natural Science Foundation of China (32172693) and the Program of National Beef Cattle and Yak Industrial Technology System (CARS-37). The China Agriculture Research System of MOF and MARA supported the statistical analysis and writing of the paper. The Technology Project of Inner Mongolia Autonomous Region (2020GG0210) and the Open project of key laboratory of Beef Cattle Genetics and Breeding, Ministry of Agriculture and Rural Affairs P.R.China (BC2022kfkt01) also supported this work.
Conflict of interest
The authors declare that the research was conducted in the absence of any commercial or financial relationships that could be construed as a potential conflict of interest.
Publisher’s note
All claims expressed in this article are solely those of the authors and do not necessarily represent those of their affiliated organizations, or those of the publisher, the editors, and the reviewers. Any product that may be evaluated in this article, or claim that may be made by its manufacturer, is not guaranteed or endorsed by the publisher.
References
Amann, R., Wyder, S., Slavotinek, A. M., and Trueb, B. (2014). The FgfrL1 receptor is required for development of slow muscle fibers. Dev. Biol. 394 (2), 228–241. doi:10.1016/j.ydbio.2014.08.016
An, B., Xia, J., Chang, T., Wang, X., Miao, J., Xu, L., et al. (2018). Genome-wide association study identifies loci and candidate genes for internal organ weights in Simmental beef cattle. Physiol. Genomics 50 (7), 523–531. doi:10.1152/physiolgenomics.00022.2018
An, B., Xia, J., Chang, T., Wang, X., Xu, L., Zhang, L., et al. (2019). Genome-wide association study reveals candidate genes associated with body measurement traits in Chinese Wagyu beef cattle. Anim. Genet. 50 (4), 386–390. doi:10.1111/age.12805
An, B., Xu, L., Xia, J., Wang, X., Miao, J., Chang, T., et al. (2020). Multiple association analysis of loci and candidate genes that regulate body size at three growth stages in Simmental beef cattle. BMC Genet. 21 (1), 32–11. doi:10.1186/s12863-020-0837-6
Ashburner, M., Ball, C. A., Blake, J. A., Botstein, D., Butler, H., Cherry, J. M., et al. (2000). Gene ontology: Tool for the unification of biology. The gene ontology consortium. Nat. Genet. 25 (1), 25–29. doi:10.1038/75556
Benjamini, Y., and Hochberg, Y. (1995). Controlling the false discovery rate: A practical and powerful approach to multiple testing. J. R. Stat. Soc. Ser. B Methodol. 57 (1), 289–300. doi:10.1111/j.2517-6161.1995.tb02031.x
Bluteau, G., Zhuang, L., Amann, R., and Trueb, B. (2014). Targeted disruption of the intracellular domain of receptor FgfrL1 in mice. PloS one 9 (8), e105210. doi:10.1371/journal.pone.0105210
Bolger, A. M., Lohse, M., and Usadel, B. (2014). Trimmomatic: A flexible trimmer for Illumina sequence data. Bioinformatics 30 (15), 2114–2120. doi:10.1093/bioinformatics/btu170
Bongiorni, S., Mancini, G., Chillemi, G., Pariset, L., and Valentini, A. (2012). Identification of a short region on chromosome 6 affecting direct calving ease in Piedmontese cattle breed. PLoS One 7 (12), e50137. doi:10.1371/journal.pone.0050137
Cannon, M. E., and Mohlke, K. L. (2018). Deciphering the emerging complexities of molecular mechanisms at GWAS loci. Am. J. Hum. Genet. 103 (5), 637–653. doi:10.1016/j.ajhg.2018.10.001
Dai, Y., Pei, G., Zhao, Z., and Jia, P. (2019). A convergent study of genetic variants associated with crohn’s disease: Evidence from GWAS, gene expression, methylation, eQTL and TWAS. Front. Genet. 10, 318. doi:10.3389/fgene.2019.00318
Edea, Z., Jung, K. S., Shin, S.-S., Yoo, S.-W., Choi, J. W., and Kim, K.-S. (2020). Signatures of positive selection underlying beef production traits in Korean cattle breeds. J. Anim. Sci. Technol. 62 (3), 293–305. doi:10.5187/jast.2020.62.3.293
Gusev, A., Ko, A., Shi, H., Bhatia, G., Chung, W., Penninx, B. W., et al. (2016). Integrative approaches for large-scale transcriptome-wide association studies. Nat. Genet. 48 (3), 245–252. doi:10.1038/ng.3506
He, X., Fuller, C. K., Song, Y., Meng, Q., Zhang, B., Yang, X., et al. (2013). Sherlock: Detecting gene-disease associations by matching patterns of expression QTL and GWAS. Am. J. Hum. Genet. 92 (5), 667–680. doi:10.1016/j.ajhg.2013.03.022
Hnia, K., Vaccari, I., Bolino, A., and Laporte, J. (2012). Myotubularin phosphoinositide phosphatases: Cellular functions and disease pathophysiology. Trends Mol. Med. 18 (6), 317–327. doi:10.1016/j.molmed.2012.04.004
Hwang, J. H., An, S. M., Kwon, S. G., Park, D. H., Kim, T. W., Kang, D. G., et al. (2017). Associations of the polymorphisms in DHRS4, SERPING1, and APOR genes with postmortem pH in berkshire pigs. Anim. Biotechnol. 28 (4), 288–293. doi:10.1080/10495398.2017.1279171
Kanehisa, M., Sato, Y., Kawashima, M., Furumichi, M., and Tanabe, M. (2016). KEGG as a reference resource for gene and protein annotation. Nucleic Acids Res. 44 (1), D457–D462. doi:10.1093/nar/gkv1070
Koupaie, E. H., Azizi, A., Lakeh, A. B., Hafez, H., and Elbeshbishy, E. (2019). A comprehensive dataset on anaerobic digestion of cattle manure, source separated organics, and municipal sludge using different inoculum sources. Data Brief. 24, 103913. doi:10.1016/j.dib.2019.103913
Kremling, K. A., Diepenbrock, C. H., Gore, M. A., Buckler, E. S., and Bandillo, N. B. (2019). Transcriptome-wide association supplements genome-wide association in Zea mays. G3 9 (9), 3023–3033. doi:10.1534/g3.119.400549
Lachmann, A., Clarke, D. J., Torre, D., Xie, Z., and Ma'ayan, A. (2020). Interoperable RNA-Seq analysis in the cloud. Biochim. Biophys. Acta. Gene Regul. Mech. 1863 (6), 194521. doi:10.1016/j.bbagrm.2020.194521
Li, D., Liu, Q., and Schnable, P. S. (2021). TWAS results are complementary to and less affected by linkage disequilibrium than GWAS. Plant Physiol. 186 (4), 1800–1811. doi:10.1093/plphys/kiab161
Liao, Y., Smyth, G. K., and Shi, W. (2014). featureCounts: an efficient general purpose program for assigning sequence reads to genomic features. Bioinformatics 30 (7), 923–930. doi:10.1093/bioinformatics/btt656
Lindholm-Perry, A., Kuehn, L., Smith, T., Ferrell, C., Jenkins, T., Freetly, H., et al. (2012). A region on BTA14 that includes the positional candidate genes LYPLA1, XKR4 and TMEM68 is associated with feed intake and growth phenotypes in cattle 1. Anim. Genet. 43 (2), 216–219. doi:10.1111/j.1365-2052.2011.02232.x
Liu, D., Chen, Z., Zhao, W., Guo, L., Sun, H., Zhu, K., et al. (2021). Genome-wide selection signatures detection in Shanghai Holstein cattle population identified genes related to adaption, health and reproduction traits. BMC genomics 22 (1), 1–19. doi:10.1186/s12864-021-08042-x
Luningham, J. M., Chen, J., Tang, S., De Jager, P. L., Bennett, D. A., Buchman, A. S., et al. (2020). Bayesian genome-wide TWAS method to leverage both cis-and trans-eQTL information through summary statistics. Am. J. Hum. Genet. 107 (4), 714–726. doi:10.1016/j.ajhg.2020.08.022
Modi, A., Vai, S., Caramelli, D., and Lari, M. (2021). “The Illumina sequencing protocol and the NovaSeq 6000 system,” in Bacterial pangenomics (New York, United States: Springer), 15–42.
Naserkheil, M., Bahrami, A., Lee, D., and Mehrban, H. (2020). Integrating single-step GWAS and bipartite networks reconstruction provides novel insights into yearling weight and carcass traits in hanwoo beef cattle. Animals. 10 (10), 1836. doi:10.3390/ani10101836
Nicolae, D. L., Gamazon, E., Zhang, W., Duan, S., Dolan, M. E., and Cox, N. J. (2010). Trait-associated SNPs are more likely to be eQTLs: Annotation to enhance discovery from GWAS. PLoS Genet. 6 (4), e1000888. doi:10.1371/journal.pgen.1000888
Niu, T., Liu, N., Zhao, M., Xie, G., Zhang, L., Li, J., et al. (2015). Identification of a novel FGFRL1 MicroRNA target site polymorphism for bone mineral density in meta-analyses of genome-wide association studies. Hum. Mol. Genet. 24 (16), 4710–4727. doi:10.1093/hmg/ddv144
NRC (2006). “NY/T 1180-2006. Determination of meat tenderness and shear force method ,” in Beijing: Ministry of Agricultre of the PRC.
Pimentel, E., Bauersachs, S., Tietze, M., Simianer, H., Tetens, J., Thaller, G., et al. (2011). Exploration of relationships between production and fertility traits in dairy cattle via association studies of SNPs within candidate genes derived by expression profiling. Anim. Genet. 42 (3), 251–262. doi:10.1111/j.1365-2052.2010.02148.x
Pryce, J. E., Hayes, B. J., Bolormaa, S., and Goddard, M. E. (2011). Polymorphic regions affecting human height also control stature in cattle. Genetics 187 (3), 981–984. doi:10.1534/genetics.110.123943
Purcell, S., Neale, B., Todd-Brown, K., Thomas, L., Ferreira, M. A., Bender, D., et al. (2007). Plink: A tool set for whole-genome association and population-based linkage analyses. Am. J. Hum. Genet. 81 (3), 559–575. doi:10.1086/519795
Setoguchi, K., Furuta, M., Hirano, T., Nagao, T., Watanabe, T., Sugimoto, Y., et al. (2009). Cross-breed comparisons identified a critical 591-kb region for bovine carcass weight QTL (CW-2) on chromosome 6 and the Ile-442-Met substitution in NCAPG as a positional candidate. BMC Genet. 10 (1), 43–12. doi:10.1186/1471-2156-10-43
Watanabe, K., Stringer, S., Frei, O., Umićević Mirkov, M., de Leeuw, C., Polderman, T. J., et al. (2019). A global overview of pleiotropy and genetic architecture in complex traits. Nat. Genet. 51 (9), 1339–1348. doi:10.1038/s41588-019-0481-0
Welin, M., Grossmann, J. G., Flodin, S., Nyman, T., Stenmark, P., Tresaugues, L., et al. (2010). Structural studies of tri-functional human GART. Nucleic Acids Res. 38 (20), 7308–7319. doi:10.1093/nar/gkq595
Wu, Y., Fan, H., Wang, Y., Zhang, L., Gao, X., Chen, Y., et al. (2014). Genome-wide association studies using haplotypes and individual SNPs in Simmental cattle. PloS one 9 (10), e109330. doi:10.1371/journal.pone.0109330
Xia, J., Fan, H., Chang, T., Xu, L., Zhang, W., Song, Y., et al. (2017). Searching for new loci and candidate genes for economically important traits through gene-based association analysis of Simmental cattle. Sci. Rep. 7 (1), 42048–42049. doi:10.1038/srep42048
Xu, P., Ni, L., Tao, Y., Ma, Z., Hu, T., Zhao, X., et al. (2020). Genome-wide association study for growth and fatness traits in Chinese Sujiang pigs. Anim. Genet. 51 (2), 314–318. doi:10.1111/age.12899
Yang, X., Steinberg, F., Zhuang, L., Bessey, R., and Trueb, B. (2016). Receptor FGFRL1 does not promote cell proliferation but induces cell adhesion. Int. J. Mol. Med. 38 (1), 30–38. doi:10.3892/ijmm.2016.2601
Yao, H., Liu, C., Lin, D., Liu, S., Lin, Z., and Dong, Y. (2020). Polymorphisms of LAP3 gene and their association with the growth traits in the razor clam Sinonovacula constricta. Mol. Biol. Rep. 47 (2), 1257–1264. doi:10.1007/s11033-019-05231-6
Yu, J., Holland, J. B., McMullen, M. D., and Buckler, E. S. (2008). Genetic design and statistical power of nested association mapping in maize. Genetics 178 (1), 539–551. doi:10.1534/genetics.107.074245
Zhan, M., Chen, G., Pan, C.-M., Gu, Z.-H., Zhao, S.-X., Liu, W., et al. (2014). Genome-wide association study identifies a novel susceptibility gene for serum TSH levels in Chinese populations. Hum. Mol. Genet. 23 (20), 5505–5517. doi:10.1093/hmg/ddu250
Zhang, X., Chu, Q., Guo, G., Dong, G., Li, X., Zhang, Q., et al. (2017). Genome-wide association studies identified multiple genetic loci for body size at four growth stages in Chinese Holstein cattle. PloS one 12 (4), e0175971. doi:10.1371/journal.pone.0175971
Zheng, X., Ju, Z., Wang, J., Li, Q., Huang, J., Zhang, A., et al. (2011). Single nucleotide polymorphisms, haplotypes and combined genotypes of LAP3 gene in bovine and their association with milk production traits. Mol. Biol. Rep. 38 (6), 4053–4061. doi:10.1007/s11033-010-0524-1
Zhou, D., Jiang, Y., Zhong, X., Cox, N. J., Liu, C., and Gamazon, E. R. (2020). A unified framework for joint-tissue transcriptome-wide association and Mendelian randomization analysis. Nat. Genet. 52 (11), 1239–1246. doi:10.1038/s41588-020-0706-2
Zhou, X., Carbonetto, P., and Stephens, M. (2013). Polygenic modeling with Bayesian sparse linear mixed models. PLoS Genet. 9 (2), e1003264. doi:10.1371/journal.pgen.1003264
Keywords: longissimus dorsi muscle, GWAS, TWAS, FCT, Huaxi cattle
Citation: Liang M, An B, Deng T, Du L, Li K, Cao S, Du Y, Xu L, Zhang L, Gao X, Cao Y, Zhao Y, Li J and Gao H (2023) Incorporating genome-wide and transcriptome-wide association studies to identify genetic elements of longissimus dorsi muscle in Huaxi cattle. Front. Genet. 13:982433. doi: 10.3389/fgene.2022.982433
Received: 30 June 2022; Accepted: 07 December 2022;
Published: 06 January 2023.
Edited by:
Lucas Lima Verardo, Universidade Federal dos Vales do Jequitinhonha e Mucuri (UFVJM), BrazilReviewed by:
Yahui Gao, University of Maryland, United StatesXiangdong Ding, China Agricultural University, China
Copyright © 2023 Liang, An, Deng, Du, Li, Cao, Du, Xu, Zhang, Gao, Cao, Zhao, Li and Gao. This is an open-access article distributed under the terms of the Creative Commons Attribution License (CC BY). The use, distribution or reproduction in other forums is permitted, provided the original author(s) and the copyright owner(s) are credited and that the original publication in this journal is cited, in accordance with accepted academic practice. No use, distribution or reproduction is permitted which does not comply with these terms.
*Correspondence: Huijiang Gao, Z2FvaHVpamlhbmdAY2Fhcy5jbg==
†These authors have contributed equally to this work.