 Cheng-long Zhang
 Jihu Zhang
 Mirenisa Tuersuntuoheti
 Qianqian Chang
 Shudong Liu
- 1College of Animal Science and Technology, Tarim University, Alar, China
- 2Key Laboratory of Tarim Animal Husbandry Science and Technology, Xinjiang Production and Construction Corps, Alar, China
Extreme environmental conditions are a major challenge for livestock production. Changes in climate conditions, especially those that lead to extreme weather, can reduce livestock production. The screening of genes and molecular markers is of great significance to explore the genetic mechanism of sheep prolificacy traits in Taklimakan Desert environment. We selected healthy adult Pishan Red Sheep (PRS) and Qira Black Sheep (QR) which live in Taklimakan Desert environment, collected blood from jugular vein, extracted DNA, and prepared Illumina Ovine SNP50 chip. For PRS, linkage disequilibrium (LD) was calculated using the ovine SNP50 Beadchip and the effective population size (Ne) was estimated using SMC++. The genetic characteristics of PRS were analyzed by integrated haplotype score (iHS) and fixation index (FST). The result showed that r2 of PRS was 0.233 ± 0.280 in the range of 0–10 Kb and decreased with increasing distances. SMC++ tested that the Ne of PRS remained at 236.99 in recent generations. 184 genes were screened out under iHS 1% threshold, and 1148 genes were screened out with FST under the 5% threshold, and 29 genes were obtained from the intersection of the two gene sets. In this study, the genetic characteristics of PRS and QR were compared by ovine genome chip, and the related excellent genes were searched, providing reference for the protection of sheep germplasm resources and molecular breeding in a desert environment.
1 Introduction
Sheep is one of the earliest domesticated animals in the world, and also one of the most successful animals domesticated by human beings in the Neolithic age. After long-term domestication and different environments, sheep have great changes in morphology, physiology and behavior. Pishan Red sheep (PRS) living in the Taklimakan Desert is characterized by perennial estrus and multiple fetuses after long-term selection by nature and people. In addition to its high-quality production traits, PRS is also a rare breed of sheep because its origin is on the southern edge of the Taklimakan Desert and north of the Karakoram Mountains (Lv et al., 2020). Pishan red sheep is a local sheep breed formed under the local cultural and geographical conditions. The origin and formation history of PRS is not fully understood. Therefore, to dig the genetic structure and molecular markers of PRS can better protect PRS.
Linkage disequilibrium (LD) can improve the accuracy of genomic association analysis and predict marker regions (Liu et al., 2017). LD decay patterns also provide information about the evolutionary history of the population and can be used to estimate ancestral effective population size (Ne) (Tenesa et al., 2007). Ne and other genetic events can also influence the extent of LD in the population (Wang, 2005). Therefore, LD helps in understanding the selection patterns experienced by individual breeds. Currently, LD estimates have been reported in several studies for a variety of livestock species, such as cattle (Porto-Neto et al., 2014), pigs (Uimari and Tapio, 2011), horses (Corbin et al., 2010), chickens (Rao et al., 2008) and sheep (Kijas et al., 2014).
The selected regions were searched through different chromosomes to provide a molecular genetic basis for sheep protection. Compared with traditional selection methods, genomics can be evaluated early with higher accuracy (Hayes et al., 2013). Voight and Kudaravalli proposed an integrated haplotype score (iHS) test based on extended haplotype homozygosity (Voight et al., 2006). The incomparability of test statistics caused by differences in recombination rates between different chromosome segments was corrected by calculating the Extended Haplotype Homozygosity (EHH) statistics and genetic distance integration. Fixation index (FST) is used to measure the degree of population differentiation, indicating that there are obvious allele frequency differences between populations (Akey et al., 2002). Genetic drift and selection process can usually cause the genetic differentiation between populations. This method is suitable for selection signal detection of multiple populations. Now, it is necessary to selectively intervene in the breeding work of PRS through genomic selection technology to guarantee a better inheritance of the excellent production traits of PRS to future generations.
In order to analyze the genetic mechanism of prolific traits in PRS under desert environment, we selected prolific PRS and singleton pregnancy Qira Black Sheep (QR) under relevant survival background as research objects. Genetic basis of PRS was analyzed based on LD and Ne and the genetic mechanism of prolific traits in Taklimakan Desert was explored by using genomic selection method.
2 Materials and methods
2.1 Animal care
This work was conducted in accordance with the specifications of the Ethics Committee of Tarim University of Science and Technology (SYXK 2020-009).
2.2 Animal collection
33 PRS (polyembryony) and 40 QR (singleton pregnancy) were randomly selected from Pishan County and Cele County in Hetian region and all of them were healthy adult sheep with no genetic relationship. Blood samples were collected from the jugular vein and DNA was extracted with a DNA kit (Tiangen Biotech Co. Ltd., Beijing, China). The samples were sent to Beijing Compass Agritechnology Co., Ltd. to prepare the Illumina Ovine SNP50 Beadchip (The number of SNPs in this chip is 50 k). The validation samples were 130 PRS (first lambing) from Pishan Farm, with the same feeding conditions, 1.5–2.5 years old, no relationship.
2.3 Genotyping and data quality control
Genome Studio software was used to process the preliminary data results and obtain the VCF files. Plink (Purcell et al., 2007) software was used for quality control. Unqualified SNP sites were eliminated. The quality control criteria of this study were as follows: 1) individual detection rate >0.95, 2) SNP detection rate >0.95, and 3) Hardy-Weinberg equilibrium (HWE) with p values
2.4 LD calculation method
LD is the basis of association analysis, and the analysis of LD between loci helps to understand the LD level of the PRS genome. Since r2 is more capable of objectively reflecting the LD between different loci, it was adopted in this study as the LD measurement standard. The LD values ranged from 0 to 1. As the LD level increased with the value of r2, the linkage degree increased. The calculation formula of r2 is as follows (Hill, 1974):
Where PA1 and PB1 are the frequency of the first allele at the two marker loci and the haplotype frequency formed between alleles. The correlation coefficient (r2 mean) of alleles was calculated to measure the level of linkage disequilibrium (LD) using PopLDdecay V3.41 (Zhang et al., 2018), and perl scripts were used to visualize the results.
2.5 Estimation of effective population size
The SMC++ (Terhorst et al., 2016) method was used to estimate Ne. The population size history and splitting time of the PRS can be predicted with SMC++. A new spline regularization scheme was adopted in this method, significantly reducing estimation errors. The conversion of each VCF file into an input file in SMC++ format was made using the vcf2smc script distributed by SMC++. All the simulations were performed under the initial condition of a mutation rate of 1.25 × 10⁻⁸.
2.6 Genetic diversity and population structure
The genotypic data after quality control was subjected to Principal Component Analysis (PCA) using MingPCACluster (https://github.com/hewm2008/MingPCACluster). The VCF2Dis v1.09 (https://github.com/BGI-shenzhen/VCF2Dis) was used to calculate the P distance matrix, and then the NJ-tree was constructed by ATGC:FastME (http://www.atgc-montpellier.fr/fastme) program. Genetic admixture calculations were performed using Admixture (Patterson et al., 2012).
2.7 Fixation index
FST is used to measure the degree of population differentiation and can reflect the level of species population differentiation. This method is suitable for selective signal detection of multiple populations and as follows:
Where, MSG is the mean square of error within the population, MSP is the mean square of error between the populations, and nc is the average sample size between the populations after correction. By using a sliding window with a window size of 50 Kb and a sliding step size of 25 Kb, the FST value of each sliding window SNP is calculated. Vcftools was used to calculate the FST value for each window, and then CMplot was used to plot Manhattan Yin et al. (2021).
2.8 Integrated haplotype score
An intrapopulation selective genomic sweep analysis was performed on all individuals using iHS. iHS is an alternative EHH statistic using a single marker loci haploid type. It is defined as the core in the site, the expansion of the ancestors in the core loci alleles in the haploid type, and new mutant alleles in the extension of the haploid type EHH statistics for the integral genetic distance. It is possible to calculate the ratio between the previously mentioned genetic metrics to select a signal detection statistic using this method, as expressed by Voight et al. (2006):
uniHS is:
Where IHH (Integrated EHH) refers to integrating genetic distance with EHH; A is the ancestral allele, and D is the newly derived allele.
2.9 Enrichment analysis of candidate genes
The iHS results and FST results were selected for intersection analysis, with annotations with the sheep genome Ovis Oar_v4.0. Gene functional annotation was performed referencing the NCBI databases (http://www.ncbi.nlm.nih.gov/gene) and OMIM database (http://www.ncbi.nlm.nih.gov/omim). The g:Profiler (https://biit.cs.ut.ee/gprofiler/gost) was used for autosomal enrichment of candidate genes for GO and Reactome/KEGG pathway analysis.
2.10 PCR amplification of BMPR1B
The FecB locus of the BMPR1B gene in 130 PRS was amplified by PCR according to the primers shown in Supplementary Material. After the PCR products were detected by 1.5% agarose gel electrophoresis, all qualified PCR products were sent to Beijing Compass Agritechnology Co., Ltd. for DNA sequencing and genotype identification.
3 Results
3.1 Descriptive statistics
Genotypic quality control was conducted on the SNPs of the 33 PRS and 40 QR used in the experiment. After the unqualified SNPs were removed, there were 49,219 informative SNPs in the PRS and QR population.
3.2 The extent of genome-wide LD and effective population size of PRS
When LD was calculated, the distance between markers was set in the 0–1 Mb (0–10, 10–25, 25–50, 50–100, 100–500 Kb, 0.5–1 Mb) autosomal range (Table 1). The average r2 decreased with increasing physical distance (Figure 1A). When the distance between markers was 10–25 Kb, the average r2 value was 0.151 ± 0.200. Compared with the average r2 value between SNPs within 0–10 Kb (0.233 ± 0.280), the difference was 0.082, much larger than the average r2 value between other adjacent distance regions. When the distance increased to 50–100 Kb, the r2 value was lower than 0.1, indicating that the LD was weak.
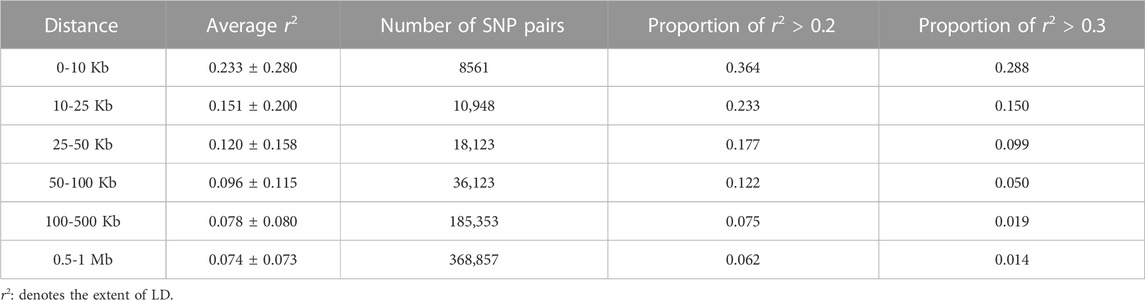
TABLE 1. LD statistical analysis between different distances (0–1 Mb).
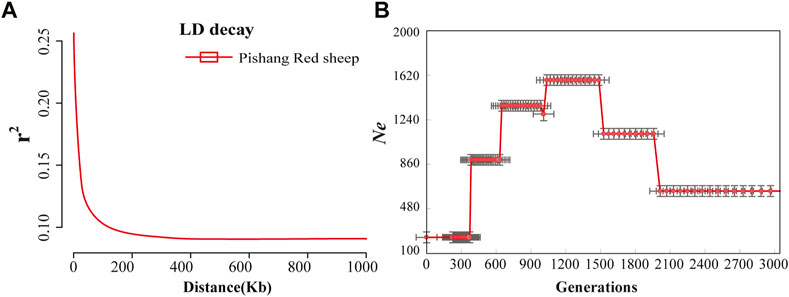
FIGURE 1. LD decay and Ne in PRS. (A): Distribution of average r2 values for PRS with respect to physical distance (kb) in 1,000 kb windows. (B): Genome-wide LD (r2) between SNPs was used to estimate the Ne of the PRS.
Based on LD, six generations Ne of PRS were estimated (Figure 1B). The PRS remained relatively stable at about 631.97 during the 2,500–2,000 generations. It rose to 1,119.99 with 1,500 generations, 1,328.81 with 1,000 generations, and fell to 898.12 with 500 generations. It declined even faster until recent generations stood at 236.99. During the first 200-100 years, PRS populations remained relatively stable. It was only in the last 10 years that the population increased slightly due to the introduction of measures to protect the endemic species.
3.3 Genetic diversity and population structure
PCA analysis can separate PRS from QR, and part of PRS extended outward (Figure 2A). In Figure 2A, k-means clustering was carried out according to the predefined subsets. When k = 2, the distinction was obvious. Neighbor-Joining (N-J) Tree showed that PRS and QR were divided into two varieties (Figure 2B), which was consistent with PCA analysis. Admixture analysis showed that PRS and QR had similar genetic backgrounds (Figure 2C).
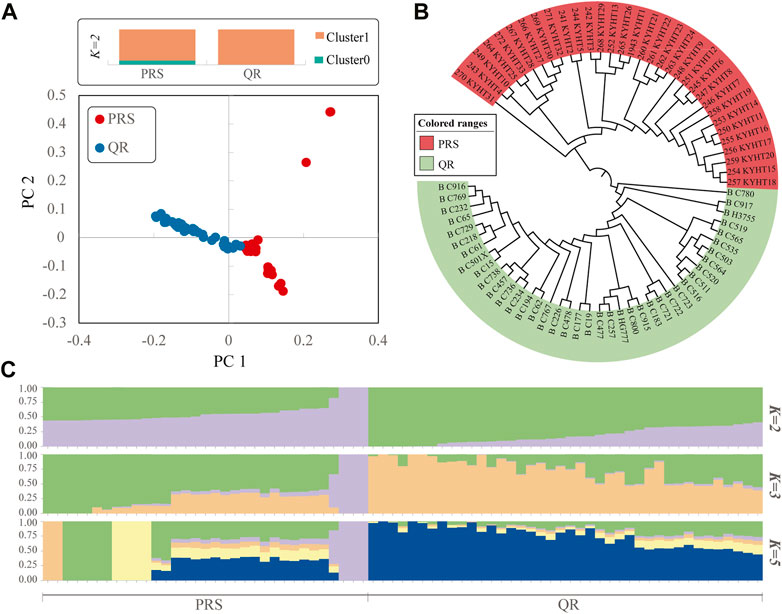
FIGURE 2. Analysis of the population structure in PRS and QR. (A), Principal component analysis, k-means clustering was carried out according to the predefined subsets. (B), Neighbor-joining tree. (C), Analysis of Admixture with the assumed number (K = 2, 3 and 5).
3.4 Selective gene sweep
The FST values of PRS and QR were calculated, and the FST values were arranged in descending order. The first 5% was regarded as the significant window (Figure 3A), and a total of 1148 genes were obtained. Under the 1% threshold, 184 candidate genes were screened out with iHS (Figure 3B). A total of 29 genes were obtained from the intersection of the two gene sets (Figure 3C), scuh as BMPR1B, 3BHSD, STPG2, ATRN, GANS, etc (Tabel A2. xlsx).
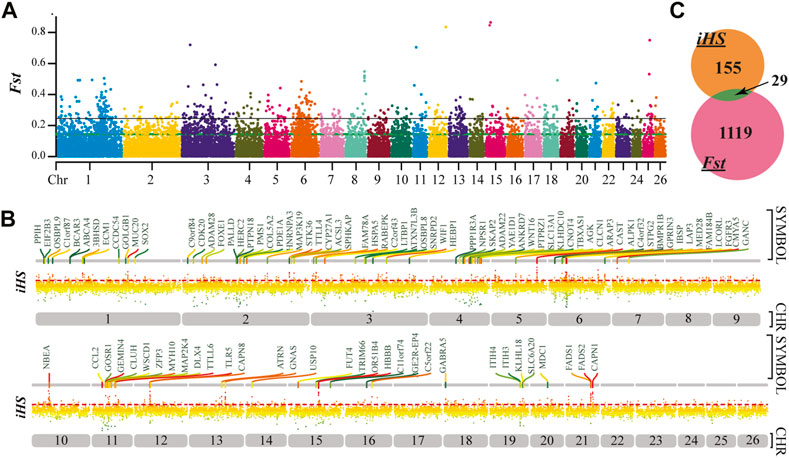
FIGURE 3. Selective gene sweep. (A), FST detection results of PRS and QR. The black line represents the 1% threshold line and the green line represents the 5% threshold line. (B), The 100 high-rank genes under the iHS 1% threshold. (C), The intersection of FST and IHS results.
3.5 Functional annotation of genes
A total of 184 genes were screened by iHS and GO and Reactome pathway analysis were performed on the 184 genes. The enrichment results of the Reactome pathway of the candidate genes were shown in Figure 4. Some genes were related to animal reproduction (Table 2). Genes ABCA4, ARL4C, and PARP14 can affect the function of ion channels. Genes SOX2, DAB1, and COL5A2 regulate cell differentiation. 29 genes were obtained by the intersection of the results of FST and IHS, and after pathway enrichment, these genes were found to be related to GnRH signalingpathway, Ovarian steroidogenesis and Estrogen signaling pathway (Figure 5), indicateing that these genes may control PRS prolific trait.
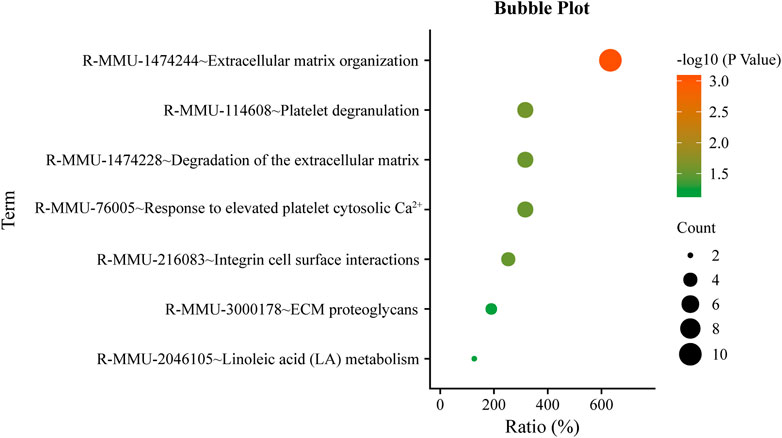
FIGURE 4. The Reactome pathways of 184 candidate genes screened out with iHS.
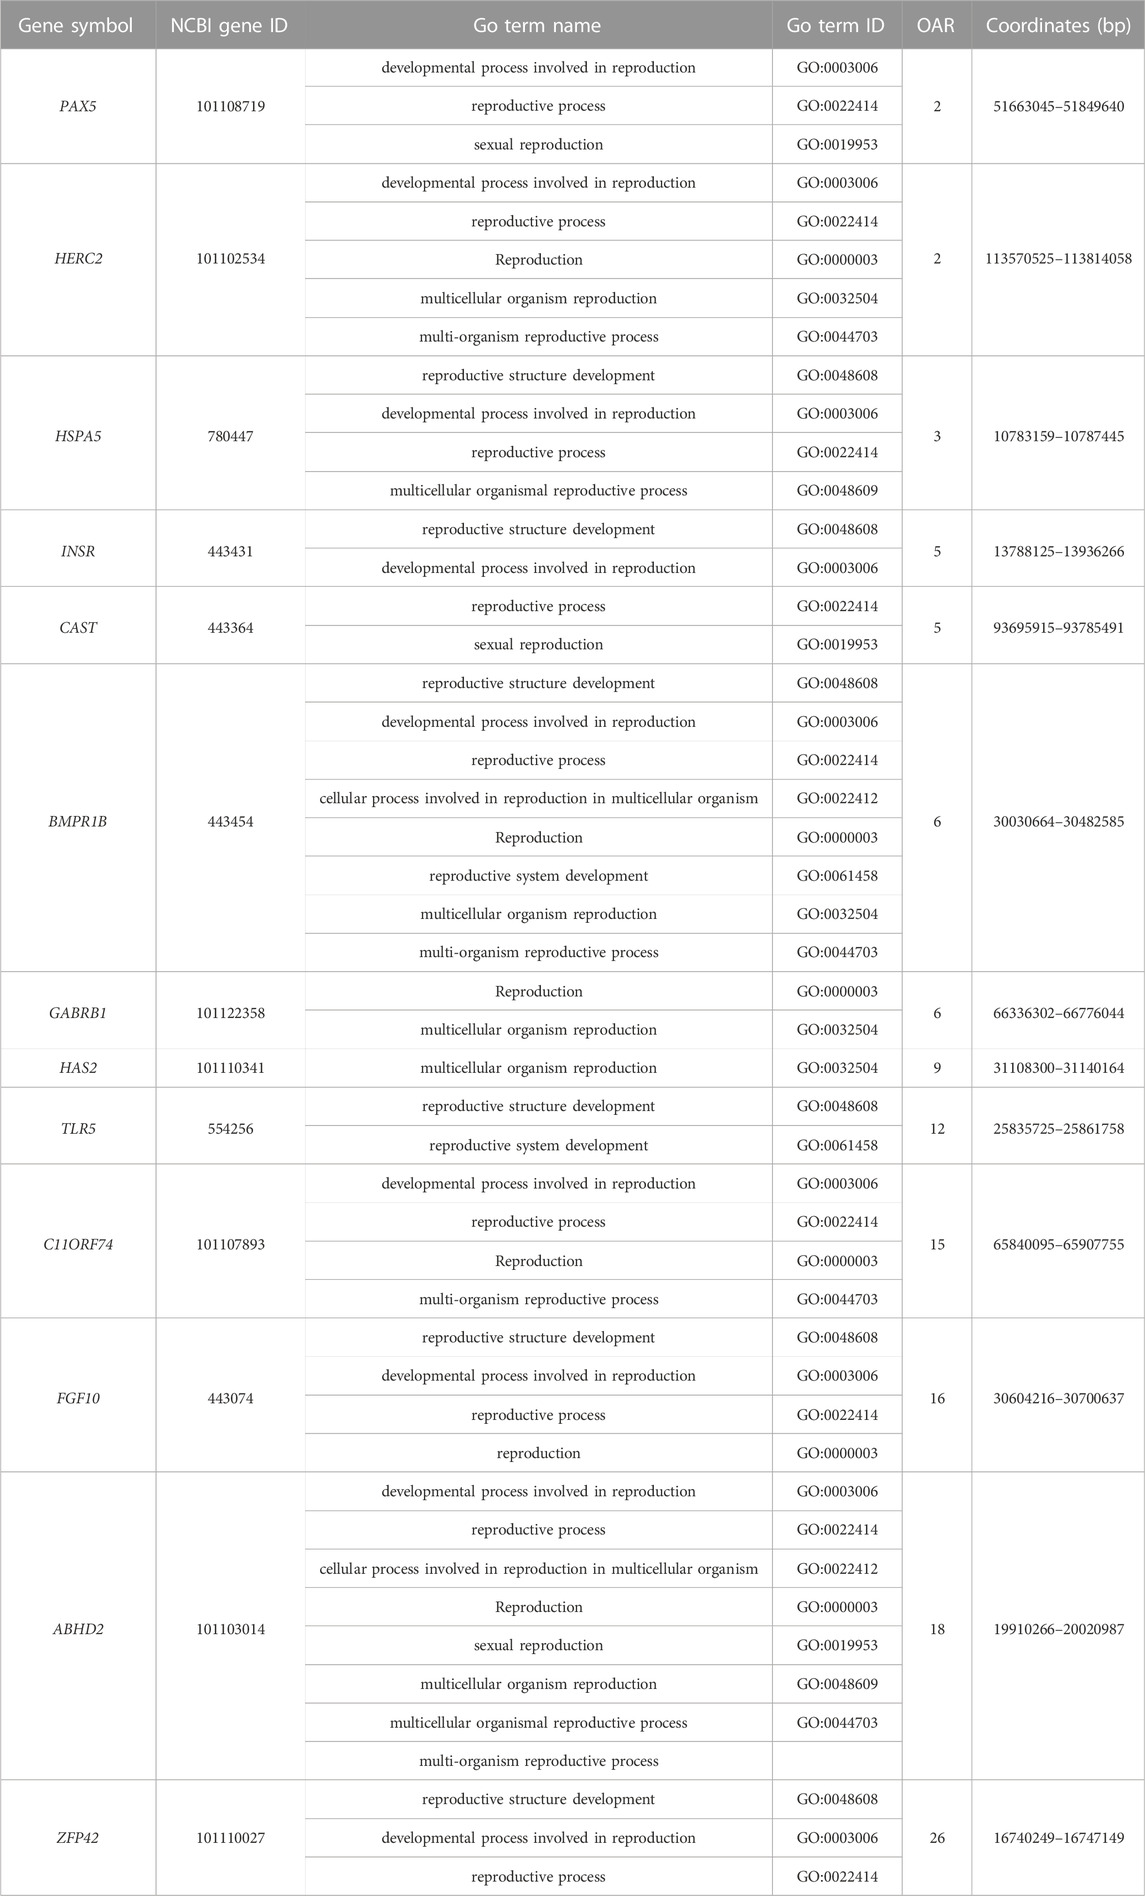
TABLE 2. Candidate genes related to reproduction.
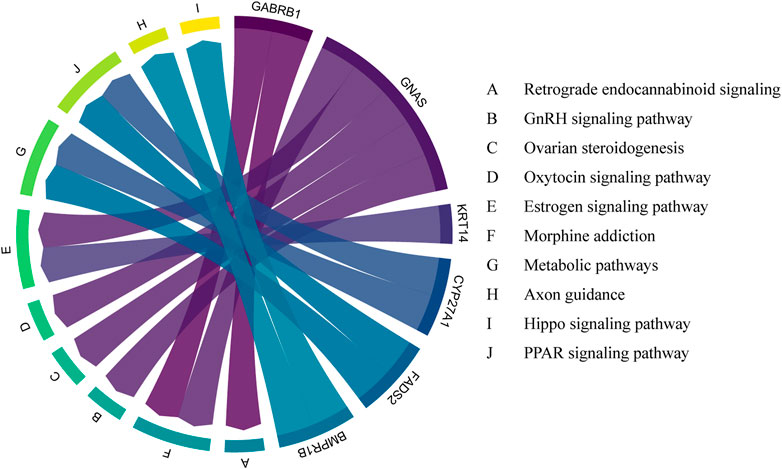
FIGURE 5. Enrichment pathways of 29 genes obtained by intersection of FST and IHS and their relationship.
3.6 PCR product sequencing and genotyping
After 1.5% agarose gel electrophoresis, the PCR products were found to conform to the expected size, indicating that the target fragment was successfully amplified (Figure 6A). The sequencing results are shown in Figure 6B. SNP locus detection revealed that BMPR1B gene G.431965A > G, and three genotypes, B+, ++, and BB, were detected (Table 3). The number of lambs of the BB genotype was significantly higher than that of the B+ and ++ genotypes (p < 0.05). The number of lambs of the B+ genotype was significantly higher than that of the ++ genotype (p < 0.05). It was shown in the χ2 test that the PRS reached Hardy-Weinberg equilibrium at the FecB locus.
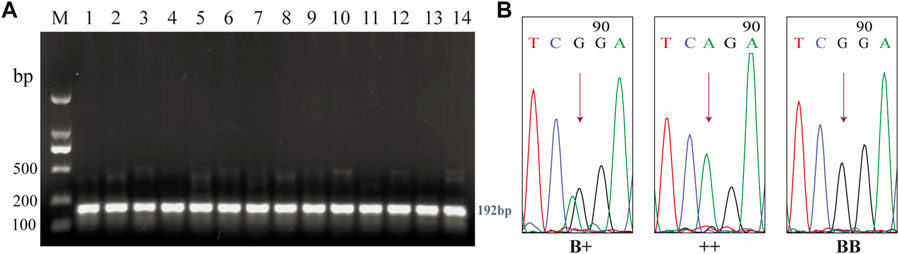
FIGURE 6. PCR amplification and sequencing of BMRPR1B. (A), Detection of PCR amplification products of BMPR1B gene in PRS. M, DL2000DNA Marker. 1-14, PCR amplification product of BMPR1B gene. (B), Sequencing results of the B+, ++, and BB genotypes.

TABLE 3. The genotype frequency and litter size of different BMPR1B genotypes of Pishan Red sheep.
4 Discussion
The Pishan Red sheep is a newly discovered local sheep group known for its stress resistance, perennial estrus, and high fecundity. Understanding the breed characteristics and evolutionary history of PRS will help to further strengthen the conservation and utilization of its genetic resources. PCA, N-J tree and Admixture suggest that PRS and QR could be subdivided into two genetic clusters, and have similar ancestral components.
4.1 LD and Ne population size
In PRS, LD was only moderate at 0–10 Kb and rapidly decreased to 0.120 ± 0.158 at 25–50 Kb. The r2 we calculated for PRS was close to that of other sheep breeds and species. In Iranian Zandi sheep, the average r2 for the pairwise space of 0–10 Kb was 0.26 (Ghoreishifar et al., 2019). In the Barbaresca sheep, the average r2 for the intermarker distance of 0.5–1.0 Mb was 0.12 (Mastrangelo et al., 2017). However, in Border Leicester and Poll Dorset, the average r2 for the intermarker distance of 0–10 Kb was 0.34 and 0.33, respectively (Al-Mamun et al., 2015). The average r2 for the intermarker distances of 0–10 Kb and 10–25 Kb was 0.43 and 0.26, respectively, in Vrindavani cattle (Singh et al., 2021). In Gir cattle, the average r2 value of 0.5–1 Mb was 0.032 (Ospina et al., 2019). Thus, the variation in the reported r2 in different breeds and species suggests that LD are highly specific in sheep breeds. The PRS is located at the edge of the Taklimakan Desert. Its unique geographical environment may be the main reason for its high genetic diversity.
Mean r2 values varied on chromosomes (from 0.182 ± 0.269 in OAR25 to 0.285 ± 0.367 in OAR19, distance <10 Kb), consistent with previous reports in sheep (Liu et al., 2017), beef cattle (Edea et al., 2014), and dairy cows (Qanbari et al., 2009). This phenomenon may be due to differences in recombination rates in different chromosomes, natural or artificial selection, and genetic drift (Mastrangelo et al., 2017). In the Vrindavani cattle, the highest mean r2 value of chromosome 28 was 0.643, and the lowest r2 value of chromosome 18 was 0.172 (0–10 Kb) (Singh et al., 2021). Moreover, the variation in r2 estimated for different chromosomes was higher in short SNP pair distances, which is in line with the results reported for Chinese Merino sheep (Xinjiang type) (Liu et al., 2017). As seen from the attenuation of LD of 26 chromosomes of PRS, the LD of each chromosome was weak. The r2 values were higher where the distance between the marked sites was close, but there were also higher r2 values between the two sites, indicating a certain pattern of LD between the distant sites. The weak LD levels of OAR12, OAR18, OAR20, and OAR25 indicated that the degree of purification of these chromosomes was not high, leading to higher genetic diversity than other chromosomes. The chromosomes with higher r2 values were OAR19, OAR15, OAR13, and OAR14, indicating that these four chromosomes may be more strongly selected than the other chromosomes.
The Ne of 236.99 of PRS 50 generations ago was similar to that of Chinese Merino sheep (Liu et al., 2017). We observed that Ne decreased more strongly from about 380 generations ago, consistent with the results of Chinese Merino sheep (Liu et al., 2017). The low level of r2, even at relatively short distances, showed that the Ne in PRS was large in recent past generations compared with other species. For example, the r2 for SNP pairs within 0.9–1.0 Mb and the Ne in recent generations in Duroc pigs were reported to be 0.2 and 75, respectively (Grossi et al., 2017). However, given the sharp drop in Ne in recent generations, we should be careful to maintain Ne larger than 100 individuals.
4.2 Adaptive mechanisms of the desert environment
The environmental adaptability differs between the Taklimakan Desert sheep breeds and those of other areas. PRS can adapt to extreme conditions, such as high salinity, drought, and ultraviolet rays. Under the iHS 1% threshold, 184 genes were screened. It was revealed that the genetic evidence and physiological mechanism of PRS adaptation to the desert environment. In terms of linoleic acid (LA) metabolism (R-MMU-2046105), FADS1 and FADS2 control polyunsaturated fatty acids (Hanson and Korotkova, 2002; Lawrence and Lawrence, 2004; Das, 2006; Calder, 2015), which accumulate fat to cope with extreme weather. The activation of phospholipase C enzymes results in the generation of second messengers of the phosphatidylinositol pathway in terms of adaptability. The events resulting from this pathway increase intracellular calcium and protein kinase C (PKC) activation. Phospholipase C cleaves the phosphodiester bond in PIP2 to form 1,2 diacylglycerol (DAG) and 1,4,5-inositol trisphosphate (IP3). IP3 opens Ca2+ channels in the platelet-dense tubular system, raising intracellular Ca2+ levels (R-MMU-76005). In terms of immunity, HERC2 and USP10 can promote the activation of the ATR-CHK1 pathway, triggering cell cycle checkpoints (Yuan et al., 2014). PAALD is involved in the process of phagocytosis (Sun et al., 2017). KIF2A, TRIM66, BCL11B, and CLEC14A play essential roles in repairing damaged cell DNA (Chen et al., 2019; Seira et al., 2019; Valisno et al., 2021; Su et al., 2021). GPRIN3 and HERC3 control cell senescence and apoptosis (Chen et al., 2018; Ding et al., 2021). In terms of growth and development, ZFP42 can control the differentiation of embryonic stem cells (Scotland et al., 2009). EVC can promote chondrogenesis (Lamuedra et al., 2022). GABRB1 correlates with hypothalamic volume and regulates intelligence (Zhu et al., 2014).
4.3 Genetic mechanisms of perennial estrus and reproduction
The estrus cycle refers to the time between the previous and next ovulation. The ovary undergoes follicular growth, maturation, ovulation, luteal formation, and degeneration during the estrus cycle. The vast majority of sheep are singleton and seasonally estrus, leading to the failure of a balanced supply of lamb meat in the four seasons, seriously restricting the production efficiency of the meat sheep industry. PRS live in desert environments, and after natural and artificial selection, it forms the characteristics of perennial estrus and the early onset of puberty. TLR5 can effectively alleviate the stimulation caused by radiation (Brackett et al., 2021), and SOX10 independently regulates the expression of IRF1 in melanoma through the JAK-STAT signaling pathway (Yokoyama et al., 2021). ATP6V0A can affect fetal brain development (Aoto et al., 2021). AUH can cause the early onset of puberty (Bizjak et al., 2020). During the luteal phase of the estrus cycle, IFNE is highly expressed in the uterus and has a protective effect against uterine infection (Fischer et al., 2018). As a member of the BMP system, BMPR1B plays a significant role in the sheep ovary. The BMP system can control the proliferation and differentiation of ovarian granulosa cells and the development of oocytes, among which BMPR1B plays an essential role in the regulation of ovarian function. The SNP of BMPR1B C.746 A > G, the 249th amino acid change, partially inactivates BMPR1B protein. This change affects the reaction of the ligands GDF5 and BMP4 recognized by BMPR1B to steroid production, making follicles mature earlier and increasing the ovine ovulation number (Kumar et al., 2020). BMPR1B is the primary gene affecting the trait of lambing abundance in sheep (Mulsant et al., 2001; Al-Samerria et al., 2015).
Fibroblast growth factor (FGF) is a large family of paracrine cells that can regulate follicular development and oocyte maturation. FGF10 can interact with BMP15 to increase cumulus cell diffusion and improve glucose utilization (Caixeta et al., 2013). FGF10 was expressed in oocytes and membrane cells in cattle follicles, acting on granulosa cells to inhibit steroid production. FGF10 regulates the cumulus-oocyte complex, improving expansion and development ability (Zhang et al., 2010; Zhang et al., 2020). FGF10 can also reduce the proportion of apoptotic oocytes and increase the number of cells developing to the blastocyst stage (Pinto et al., 2014). In embryonic development, FGF10 can activate the MAPK pathway, increase the phosphorylation level of MAPK, and mediate the migration of sheep trophoblast cells (Yang et al., 2011). FGF10 can reduce the level of FSHR mRNA in granulosa cells in vitro. FGF10 can also inhibit the secretion of estrogen. The injection of FGF10 at the initial stage of follicular selection can inhibit follicular growth, which may be achieved by reducing FSHR mRNA levels and thus inhibiting estrogen expression. At the same time, the FGF10 mRNA concentration in the ovaries of healthy and growing bovine follicles was higher than that in atresia follicles (Buratini et al., 2007), which indicated that FGF10 played an inhibitory role in early follicular development and promoted follicular maturation in late follicular development. FGF10 can also regulate the expression of genes CD9, CD81, DNMT1, and DNMT3B to improve embryo quality (Pan et al., 2019).
Hyaluronic acid (HA), also called hyaluronate or hyaluronan, is an essential extracellular matrix component widely available in various mammalian tissues (Rodgers and Irving-Rodgers, 2010). HA is synthesized by three HA synthase families (HAS1, HAS2, and HAS3). HAS2 is so critical to development that the HAS2-HA system is considered an essential HAS-HA system. HAS2 is responsible for the rapid hyaluronic acid synthesis in cumulus-oocyte complexes and granulosa cells. In the dominant follicles of mammals, most of the hyaluronic acid is secreted by cumulus cells and is also present in the follicular fluid. HAS2 plays a vital physiological role in oocyte maturation, ovulation, in vivo fertilization, and early embryonic development (Irving-Rodgers and Rodgers, 2006). C11orf74 enhances sperm motility and improves fertilization (Majkowski et al., 2018). Progesterone can upregulate ABHD2 to activate the camp-PKA signaling pathway (Jiang et al., 2021). These genes were strongly selected, suggesting that perennial estrus may result from a combination of these genes.
The number of lambs is a complex character affected by many factors, among which heredity is the main factor. The FecB gene is the most studied gene and can significantly affect the ovulation number and lambing number of sheep breeds. The B+ genotype exists among multiple sheep breeds in Xinjiang, China, including Duolang and Hotan sheep. The number of lambs of the B+ genotype was significantly higher than that of the ++ genotype. We detected FecB in 130 leather-red sheep and found three genotypes: BB, B+, and ++. The average number of lambs born in the BB genotype was the highest, followed by the B+ and ++ genotypes, indicating that the FecB gene is an effective gene for improving the fecality of PRS.
5 Conclusion
In the extreme environment of the desert, PRS has formed the characteristics of perennial estrus, multiple pregnancies, and adequate resistance to stress. The LD decay rate of the PRS was faster, and LD and the Ne were at a relatively low level, suggesting that we should take reasonable protection measures to increase the PRS population. Genomic selection signal analysis and population validation showed that FecB could be used as a molecular breeding marker for multiple fetal lines of PRS in desert environments.
Data availability statement
The datasets presented in this study can be found in online repositories. The names of the repository/repositories and accession number(s) can be found below: Our data has been uploaded to this website https://figshare.com/articles/dataset/e_vcf/21700937.
Author contributions
C-lZ and JZ led the bioinformatic and statistical analyses of data and helped to draft the first version of the manuscript. SL generated and contributed 50 K SNP data for sheep breeds in the Xinjiang biota. JZ, SL, MT, and C-lZ wrote and/or revised the manuscript. All authors read and approved the manuscript.
Funding
This study was funded by grants form National Natural Science Foundation of China (32060743) supported by Bintuan Science and Technology Program (2022CB001-09).
Conflict of interest
The authors declare that the research was conducted in the absence of any commercial or financial relationships that could be construed as a potential conflict of interest.
Publisher’s note
All claims expressed in this article are solely those of the authors and do not necessarily represent those of their affiliated organizations, or those of the publisher, the editors and the reviewers. Any product that may be evaluated in this article, or claim that may be made by its manufacturer, is not guaranteed or endorsed by the publisher.
Supplementary material
The Supplementary Material for this article can be found online at: https://www.frontiersin.org/articles/10.3389/fgene.2023.1092066/full#supplementary-material
References
Akey, J. M., Zhang, G., Zhang, K., Jin, L., and Shriver, M. D. (2002). Interrogating a high-density SNP map for signatures of natural selection. Genome Res. 12, 1805–1814. doi:10.1101/gr.631202
Al-Mamun, H. A., Clark, S. A., Kwan, P., and Gondro, C. (2015). Genome-wide linkage disequilibrium and genetic diversity in five populations of Australian domestic sheep. Genet. Sel. Evol. 47, 90. doi:10.1186/s12711-015-0169-6
Al-Samerria, S., Al-Ali, I., McFarlane, J. R., and Almahbobi, G. (2015). The impact of passive immunisation against BMPRIB and BMP4 on follicle development and ovulation in mice. Reproduction 149, 403–411. doi:10.1530/rep-14-0451
Aoto, K., Kato, M., Akita, T., Nakashima, M., Mutoh, H., Akasaka, N., et al. (2021). ATP6v0a1 encoding the a1-subunit of the v0 domain of vacuolar h+-ATPases is essential for brain development in humans and mice. Nat. Commun. 12, 2107. doi:10.1038/s41467-021-22389-5
Bizjak, N., Tansek, M. Z., Stefanija, M. A., Lampret, B. R., Mezek, A., Torkar, A. D., et al. (2020). Precocious puberty in a girl with 3-methylglutaconic aciduria type 1 (3-MGA-i) due to a novel AUH gene mutation. Mol. Genet. Metabolism Rep. 25, 100691. doi:10.1016/j.ymgmr.2020.100691
Brackett, C. M., Greene, K. F., Aldrich, A. R., Trageser, N. H., Pal, S., Molodtsov, I., et al. (2021). Signaling through TLR5 mitigates lethal radiation damage by neutrophil-dependent release of MMP-9. Cell. Death Discov. 7, 266. doi:10.1038/s41420-021-00642-6
Buratini, J., Pinto, M., Castilho, A., Amorim, R., Giometti, I., Portela, V., et al. (2007). Expression and function of fibroblast growth factor 10 and its receptor, fibroblast growth factor receptor 2B, in bovine follicles. Biol. Reproduction 77, 743–750. doi:10.1095/biolreprod.107.062273
Caixeta, E. S., Sutton-McDowall, M. L., Gilchrist, R. B., Thompson, J. G., Price, C. A., Machado, M. F., et al. (2013). Bone morphogenetic protein 15 and fibroblast growth factor 10 enhance cumulus expansion, glucose uptake, and expression of genes in the ovulatory cascade during in vitro maturation of bovine cumulus–oocyte complexes. Reproduction 146, 27–35. doi:10.1530/rep-13-0079
Calder, P. C. (2015). Functional roles of fatty acids and their effects on human health. J. Parenter. Enter. Nutr. 39, 18S–32S. doi:10.1177/0148607115595980
Chen, J., Wang, Z., Guo, X., Li, F., Wei, Q., Chen, X., et al. (2019). TRIM66 reads unmodified h3r2k4 and h3k56ac to respond to DNA damage in embryonic stem cells. Nat. Commun. 10, 4273. doi:10.1038/s41467-019-12126-4
Chen, Y., Li, Y., Peng, Y., Zheng, X., Fan, S., Yi, Y., et al. (2018). δnp63α down-regulates c-myc modulator mm1 via e3 ligase herc3 in the regulation of cell senescence. Cell. Death Differ. 25, 2118–2129. doi:10.1038/s41418-018-0132-5
Corbin, L. J., Blott, S. C., Swinburne, J. E., Vaudin, M., Bishop, S. C., and Woolliams, J. A. (2010). Linkage disequilibrium and historical effective population size in the thoroughbred horse. Anim. Genet. 41, 8–15. doi:10.1111/j.1365-2052.2010.02092.x
Das, U. (2006). “Essential fatty acids,” in Encyclopedia of biophysics (Heidelberg: Springer Berlin Heidelberg), 706–714. doi:10.1007/978-3-642-16712-6_533
Ding, F., Luo, X., Tu, Y., Duan, X., Liu, J., Jia, L., et al. (2021). Alpk1 sensitizes pancreatic beta cells to cytokine-induced apoptosis via upregulating TNF-α signaling pathway. Front. Immunol. 12, 705751. doi:10.3389/fimmu.2021.705751
Edea, Z., Dadi, H., Kim, S.-W., Park, J.-H., Shin, G.-H., Dessie, T., et al. (2014). Linkage disequilibrium and genomic scan to detect selective loci in cattle populations adapted to different ecological conditions in Ethiopia. J. Animal Breed. Genet. 131, 358–366. doi:10.1111/jbg.12083
Fischer, C. D., Wachoski-Dark, G. L., Grant, D. M., Bramer, S. A., and Klein, C. (2018). Interferon epsilon is constitutively expressed in equine endometrium and up-regulated during the luteal phase. Animal Reproduction Sci. 195, 38–43. doi:10.1016/j.anireprosci.2018.05.003
Ghoreishifar, S. M., Moradi-Shahrbabak, H., Parna, N., Davoudi, P., and Khansefid, M. (2019). Linkage disequilibrium and within-breed genetic diversity in iranian zandi sheep. Arch. Anim. Breed. 62, 143–151. doi:10.5194/aab-62-143-2019
Grossi, D. A., Jafarikia, M., Brito, L. F., Buzanskas, M. E., Sargolzaei, M., and Schenkel, F. S. (2017). Genetic diversity, extent of linkage disequilibrium and persistence of gametic phase in canadian pigs. BMC Genet. 18, 6. doi:10.1186/s12863-017-0473-y
Hanson, L. Å., and Korotkova, M. (2002). The role of breastfeeding in prevention of neonatal infection. Seminars Neonatol. 7, 275–281. doi:10.1016/s1084-2756(02)90124-7
Hayes, B. J., Lewin, H. A., and Goddard, M. E. (2013). The future of livestock breeding: Genomic selection for efficiency, reduced emissions intensity, and adaptation. Trends Genet. 29, 206–214. doi:10.1016/j.tig.2012.11.009
Hill, W. G. (1974). Estimation of linkage disequilibrium in randomly mating populations. Heredity 33, 229–239. doi:10.1038/hdy.1974.89
Irving-Rodgers, H., and Rodgers, R. (2006). Extracellular matrix of the developing ovarian follicle. Seminars Reproductive Med. 24, 195–203. doi:10.1055/s-2006-948549
Jiang, F., Zhu, Y., Chen, Y., Tang, X., Liu, L., Chen, G., et al. (2021). Progesterone activates the cyclic AMP-protein kinase a signalling pathway by upregulating ABHD2 in fertile men. J. Int. Med. Res. 49, 300060521999527. doi:10.1177/0300060521999527
Kijas, J. W., Porto-Neto, L., Dominik, S., Reverter, A., Bunch, R., McCulloch, R., et al. (2014). Linkage disequilibrium over short physical distances measured in sheep using a high-density SNP chip. Anim. Genet. 45, 754–757. doi:10.1111/age.12197
Kumar, S., Rajput, P. K., Bahire, S. V., Jyotsana, B., Kumar, V., and Kumar, D. (2020). Differential expression of BMP/SMAD signaling and ovarian-associated genes in the granulosa cells of FecB introgressed GMM sheep. Syst. Biol. Reproductive Med. 66, 185–201. doi:10.1080/19396368.2019.1695977
Lamuedra, A., Gratal, P., Calatrava, L., Ruiz-Perez, V. L., Palencia-Campos, A., Portal-Núñez, S., et al. (2022). Blocking chondrocyte hypertrophy in conditional evc knockout mice does not modify cartilage damage in osteoarthritis. FASEB J. 36, e22258. doi:10.1096/fj.202101791rr
Lawrence, R. M., and Lawrence, R. A. (2004). Breast milk and infection. Clin. Perinatology 31, 501–528. doi:10.1016/j.clp.2004.03.019
Liu, S., He, S., Chen, L., Li, W., Di, J., and Liu, M. (2017). Estimates of linkage disequilibrium and effective population sizes in Chinese merino (xinjiang type) sheep by genome-wide SNPs. Genes. and Genomics 39, 733–745. doi:10.1007/s13258-017-0539-2
Lv, X., Chen, L., He, S., Liu, C., Han, B., Liu, Z., et al. (2020). Effect of nutritional restriction on the hair follicles development and skin transcriptome of Chinese merino sheep. Animals 10, 1058. doi:10.3390/ani10061058
Majkowski, M., Laszkiewicz, A., Sniezewski, L., Grzmil, P., Pawlicka, B., Tomczyk, I., et al. (2018). Lack of NWC protein (c11orf74 homolog) in murine spermatogenesis results in reduced sperm competitiveness and impaired ability to fertilize egg cells in vitro. PLOS ONE 13, e0208649. doi:10.1371/journal.pone.0208649
Mastrangelo, S., Portolano, B., Gerlando, R. D., Ciampolini, R., Tolone, M., Sardina, M., et al. (2017). Genome-wide analysis in endangered populations: A case study in barbaresca sheep. Animal 11, 1107–1116. doi:10.1017/s1751731116002780
Mulsant, P., Lecerf, F., Fabre, S., Schibler, L., Monget, P., Lanneluc, I., et al. (2001). Mutation in bone morphogenetic protein receptor-IB is associated with increased ovulation rate in booroola mérino ewes. Proc. Natl. Acad. Sci. 98, 5104–5109. doi:10.1073/pnas.091577598
Ospina, A. M. T., Maiorano, A. M., Curi, R. A., Pereira, G. L., Zerlotti-Mercadante, M. E., Cyrillo, J. N. S. G., et al. (2019). Linkage disequilibrium and effective population size in gir cattle selected for yearling weight. Reproduction Domest. Animals 54, 1524–1531. doi:10.1111/rda.13559
Pan, Y., Wang, M., Baloch, A. R., Zhang, Q., Wang, J., Ma, R., et al. (2019). FGF10 enhances yak oocyte fertilization competence and subsequent blastocyst quality and regulates the levels of CD9, CD81, DNMT1, and DNMT3b. J. Cell. Physiology 234, 17677–17689. doi:10.1002/jcp.28394
Patterson, N., Moorjani, P., Luo, Y., Mallick, S., Rohland, N., Zhan, Y., et al. (2012). Ancient admixture in human history. Genetics 192, 1065–1093. doi:10.1534/genetics.112.145037
Pinto, R. P., Fontes, P., Loureiro, B., Castilho, A. S., Ticianelli, J. S., Razza, E. M., et al. (2014). Effects of FGF10 on bovine oocyte meiosis progression, apoptosis, embryo development and relative abundance of developmentally important genes in vitro. Reproduction Domest. Animals 50, 84–90. doi:10.1111/rda.12452
Porto-Neto, L. R., Kijas, J. W., and Reverter, A. (2014). The extent of linkage disequilibrium in beef cattle breeds using high-density SNP genotypes. Genet. Sel. Evol. 46, 22. doi:10.1186/1297-9686-46-22
Purcell, S., Neale, B., Todd-Brown, K., Thomas, L., Ferreira, M. A., Bender, D., et al. (2007). Plink: A tool set for whole-genome association and population-based linkage analyses. Am. J. Hum. Genet. 81, 559–575. doi:10.1086/519795
Qanbari, S., Pimentel, E. C. G., Tetens, J., Thaller, G., Lichtner, P., Sharifi, A. R., et al. (2009). The pattern of linkage disequilibrium in German holstein cattle. Anim. Genet. 41, 346–356. doi:10.1111/j.1365-2052.2009.02011.x
Rao, Y. S., Liang, Y., Xia, M. N., Shen, X., Du, Y. J., Luo, C. G., et al. (2008). Extent of linkage disequilibrium in wild and domestic chicken populations. Hereditas 145, 251–257. doi:10.1111/j.1601-5223.2008.02043.x
Rodgers, R. J., and Irving-Rodgers, H. F. (2010). Formation of the ovarian follicular antrum and follicular fluid. Biol. Reproduction 82, 1021–1029. doi:10.1095/biolreprod.109.082941
Scotland, K. B., Chen, S., Sylvester, R., and Gudas, L. J. (2009). Analysis of rex1 (zfp42) function in embryonic stem cell differentiation. Dev. Dyn. 238, 1863–1877. doi:10.1002/dvdy.22037
Seira, O., Liu, J., Assinck, P., Ramer, M., and Tetzlaff, W. (2019). KIF2a characterization after spinal cord injury. Cell. Mol. Life Sci. 76, 4355–4368. doi:10.1007/s00018-019-03116-2
Singh, A., Kumar, A., Mehrotra, A., Karthikeyan, A., Pandey, A. K., Mishra, B. P., et al. (2021). Estimation of linkage disequilibrium levels and allele frequency distribution in crossbred vrindavani cattle using 50k SNP data. PLOS ONE 16, e0259572. doi:10.1371/journal.pone.0259572
Su, Z., Li, Y., Lv, H., Cui, X., Liu, M., Wang, Z., et al. (2021). CLEC14a protects against podocyte injury in mice with adriamycin nephropathy. FASEB J. 35, e21711. doi:10.1096/fj.202100283r
Sun, H.-M., Chen, X.-L., Chen, X.-J., Liu, J., Ma, L., Wu, H.-Y., et al. (2017). PALLD regulates phagocytosis by enabling timely actin polymerization and depolymerization. J. Immunol. 199, 1817–1826. doi:10.4049/jimmunol.1602018
Tenesa, A., Navarro, P., Hayes, B. J., Duffy, D. L., Clarke, G. M., Goddard, M. E., et al. (2007). Recent human effective population size estimated from linkage disequilibrium. Genome Res. 17, 520–526. doi:10.1101/gr.6023607
Terhorst, J., Kamm, J. A., and Song, Y. S. (2016). Robust and scalable inference of population history from hundreds of unphased whole genomes. Nat. Genet. 49, 303–309. doi:10.1038/ng.3748
Uimari, P., and Tapio, M. (2011). Extent of linkage disequilibrium and effective population size in Finnish Landrace and Finnish Yorkshire pig breeds. J. Animal Sci. 89, 609–614. doi:10.2527/jas.2010-3249
Valisno, J. A. C., May, J., Singh, K., Helm, E. Y., Venegas, L., Budbazar, E., et al. (2021). BCL11b regulates arterial stiffness and related target organ damage. Circulation Res. 128, 755–768. doi:10.1161/circresaha.120.316666
Voight, B. F., Kudaravalli, S., Wen, X., and Pritchard, J. K. (2006). A map of recent positive selection in the human genome. PLoS Biol. 4, e72. doi:10.1371/journal.pbio.0040072
Wang, J. (2005). Estimation of effective population sizes from data on genetic markers. Philosophical Trans. R. Soc. B Biol. Sci. 360, 1395–1409. doi:10.1098/rstb.2005.1682
Yang, Q. E., Giassetti, M. I., and Ealy, A. D. (2011). Fibroblast growth factors activate mitogen-activated protein kinase pathways to promote migration in ovine trophoblast cells. Reproduction 141, 707–714. doi:10.1530/rep-10-0541
Yin, L., Zhang, H., Tang, Z., Xu, J., Yin, D., Zhang, Z., et al. (2021). rMVP: A memory-efficient, visualization-enhanced, and parallel-accelerated tool for genome-wide association study. Genomics, Proteomics Bioinforma. 19, 619–628. doi:10.1016/j.gpb.2020.10.007
Yokoyama, S., Takahashi, A., Kikuchi, R., Nishibu, S., Lo, J. A., Hejna, M., et al. (2021). SOX10 regulates melanoma immunogenicity through an IRF4–IRF1 axis. Cancer Res. 81, 6131–6141. doi:10.1158/0008-5472.can-21-2078
Yuan, J., Luo, K., Deng, M., Li, Y., Yin, P., Gao, B., et al. (2014). HERC2-USP20 axis regulates DNA damage checkpoint through claspin. Nucleic Acids Res. 42, 13110–13121. doi:10.1093/nar/gku1034
Zhang, C., Dong, S.-S., Xu, J.-Y., He, W.-M., and Yang, T.-L. (2018). PopLDdecay: A fast and effective tool for linkage disequilibrium decay analysis based on variant call format files. Bioinformatics 35, 1786–1788. doi:10.1093/bioinformatics/bty875
Zhang, K., Hansen, P. J., and Ealy, A. D. (2010). Fibroblast growth factor 10 enhances bovine oocyte maturation and developmental competence in vitro. Reproduction 140, 815–826. doi:10.1530/rep-10-0190
Zhang, X., Zhang, L., Sun, W., Lang, X., Wu, J., Zhu, C., et al. (2020). Study on the correlation between BMPR1b protein in sheep blood and reproductive performance. J. Animal Sci. 98, skaa100. doi:10.1093/jas/skaa100
Keywords: desert environment, genomic selection, linkage disequilibrium, perennial estrus, litter size
Citation: Zhang C-l, Zhang J, Tuersuntuoheti M, Chang Q and Liu S (2023) Population structure, genetic diversity and prolificacy in pishan red sheep under an extreme desert environment. Front. Genet. 14:1092066. doi: 10.3389/fgene.2023.1092066
Received: 07 November 2022; Accepted: 28 March 2023;
Published: 11 April 2023.
Edited by:
Ibrar Muhammad Khan, Fuyang Normal University, ChinaReviewed by:
Hongyu Liu, Anhui Agricultural University, ChinaSamiullah Khan, Guizhou University, China
Copyright © 2023 Zhang, Zhang, Tuersuntuoheti, Chang and Liu. This is an open-access article distributed under the terms of the Creative Commons Attribution License (CC BY). The use, distribution or reproduction in other forums is permitted, provided the original author(s) and the copyright owner(s) are credited and that the original publication in this journal is cited, in accordance with accepted academic practice. No use, distribution or reproduction is permitted which does not comply with these terms.
*Correspondence: Shudong Liu, bGl1c2h1ZG9uZzYzQDEyNi5jb20=
†These authors have contributed equally to this work