 Xiaoxi Zhang
 Seungjun Ahn
 Peihua Qiu1
 Somnath Datta
- 1Department of Biostatistics, University of Florida, Gainesville, FL, United States
- 2Department of Population Health Science and Policy, Icahn School of Medicine at Mount Sinai, New York, NY, United States
The COVID-19 pandemic caused by SARS-CoV-2 has resulted in millions of confirmed cases and deaths worldwide. Understanding the biological mechanisms of SARS-CoV-2 infection is crucial for the development of effective therapies. This study conducts differential expression (DE) analysis, pathway analysis, and differential network (DN) analysis on RNA-seq data of four lung cell lines, NHBE, A549, A549.ACE2, and Calu3, to identify their common and unique biological features in response to SARS-CoV-2 infection. DE analysis shows that cell line A549.ACE2 has the highest number of DE genes, while cell line NHBE has the lowest. Among the DE genes identified for the four cell lines, 12 genes are overlapped, associated with various health conditions. The most significant signaling pathways varied among the four cell lines. Only one pathway, “cytokine-cytokine receptor interaction”, is found to be significant among all four cell lines and is related to inflammation and immune response. The DN analysis reveals considerable variation in the differential connectivity of the most significant pathway shared among the four lung cell lines. These findings help to elucidate the mechanisms of SARS-CoV-2 infection and potential therapeutic targets.
1 Introduction
As of 30 April 2023, the coronavirus disease 2019 (COVID-19) pandemic caused by severe acute respiratory syndrome coronavirus 2 (SARS-CoV-2) has led to more than 765 million confirmed cases and nearly 7 million deaths worldwide, reported to the World Health Organization (WHO). It’s reported that SARS-CoV-2 infection is similar to other respiratory infections such as SARS-CoV and MERS-CoV, which caused outbreaks in Southern China in 2003 and Saudi Arabia in 2012, respectively (Prompetchara et al., 2020). This similarity is attributed to the fact that all three viruses belong to the coronavirus family (Pustake et al., 2022). Genomic sequencing has shown that SARS-CoV-2 shares approximately 79% similarities with SARS-CoV and 50% similarities with MERS-CoV. Recent research indicates that the identifications of molecular mechanisms (Zhang et al., 2021a), cellular functions (Alipoor et al., 2021), and biological network activities (Habibi et al., 2021; Guo et al., 2022) are important to better understand the intricacies of disease biology and potentially lead to new therapies in treating COVID-19. The virus can invade cellular processes by moving proteins and genetic material from cells, resulting in the formation of new virus particles (Cohen, 2016). With regards to the SARS-CoV-2 virus, it has a detrimental effect on both lung epithelial cells (John et al., 2021) and lung adenocarcinoma cell lines (Stewart et al., 2021).
Our research of interest lies in comparing these four distinct lung cell lines: normal human bronchial epithelial cell line (NHBE), A549 lung adenocarcinoma cell line (A549), A549 expressing angiotensin-converting enzyme 2 receptors (A549.ACE2), and Calu-3 lung epithelial cell line (Calu3). This comparison is driven by the RNA-seq data (Blanco-Melo et al., 2020), providing information solely for these four specific lung cell lines. Rayner et al. (2019) state that NHBE, which is the primary lung epithelial cell, is widely employed as in vitro lung model for assessing the fundamental events that contribute to respiratory diseases. Blanco-Melo et al. (2020) and Vishnubalaji et al. (2020) indicate that A549 has a relatively low susceptibility to SAR-CoV-2 infection. Nevertheless, if A549 expresses angiotensin-converting enzyme 2 (ACE2) receptors, it can become compatible with SARS-CoV-2, as the exogenous expression of ACE2 allows SARS-CoV-2 to replicate in A549 cell (Blanco-Melo et al., 2020). In our study, we utilize A549.ACE2 to denote the A549 that has been modified to express ACE2 receptors. Calu3 is suitable for investigating innate immune responses to SARS-CoV-2 infection, as it reproduces IFN induction when exposed to SARS-CoV-2 (Rebendenne et al., 2021). These cells are of great significance in the study of SARS-CoV-2 infections and in the exploration of medical strategies through real-life experiments.
Recent studies related to COVID-19 disease have shed light on various aspects of the disease, including its pathogenesis, mechanisms of action, and potential therapeutic interventions. Here are some key findings. Draghici et al. (2021) examined the mechanisms of SARS-CoV-2 infection in NHBE, A549, and COVID-19 lung tissues. The analysis identified methylprednisolone as a promising therapy, which was confirmed by the survival analysis of clinical data. Blanco-Melo et al. (2020) conducted a comparison of the transcriptional response to the SARS-CoV-2 virus with other respiratory viruses such as influenza A virus (IAV) and respiratory syncytial virus (RSV). They concluded that the hallmark features of COVID-19 disease are reduced innate antiviral defenses and exuberant inflammatory cytokine production. Wu et al. (2021) conducted pathway enrichment analysis using two types of lung epithelial cells infected with SARS-CoV-2: A549 cells with overexpression of ACE2 and NHBE cells. They found that the main cause of the inability to eliminate SARS-CoV-2 is immune dysregulation and interferon malfunction. Chen et al. (2021) identified common mechanisms between SARS-CoV-2 infection and human cancers by conducting differential expression (DE) analysis and pathway analysis on three different lung cell lines (NHBE, A549, and Calu3) and performing a meta-analysis across various datasets. Daamen et al. (2021) investigated the pathogenesis of COVID-19 in COVID-19 patients by analyzing the lung, blood, and airway responses and discovered the dynamic nature of the inflammatory response to SARS-CoV-2. They also proposed various potential therapeutic suggestions based on their findings. A549 cells, lacking ACE2 expression, could still be infected by SARS-CoV-2, although its replication of SARS-CoV-2 is significantly higher in A549.ACE2 cells (Yang et al., 2020).
Although many studies have investigated COVID-19 using RNA-seq data from different cell lines, few have examined the common and unique biological characteristics among NHBE, A549, A549.ACE2, and Calu3 cell lines based on DE analysis, pathway analysis, and differential network (DN) analysis. Additionally, most of these studies have used only one approach for DE analysis, which could lead to biased results. In this study, we conduct a comparative analysis of the four different lung cell lines, namely, NHBE, A549, A549.ACE2, and Calu3. Our approaches involve DE analysis, pathway analysis, and DN analysis to identify both unique and common disease mechanisms among these cell lines. The structure of this paper is as follows. In Section 2, we provide a detailed description of the dataset used in our analysis, as well as our analysis plan and suggested statistical models. The results of the DE analysis, pathway analysis, and DN analysis are presented in Section 3. Finally, in Section 4, we provide some concluding remarks.
Our research project falls within the scope of the Disease Maps to Modeling COVID-19 research topic at the Critical Assessment of Massive Data Analysis (CAMDA) Annual Conference 2022.
2 Materials and methods
2.1 RNA-seq data
The RNA-seq data was obtained from the Gene Expression Omnibus (GEO) under the accession number GSE147507 (Blanco-Melo et al., 2020). To be specific, we incorporated Series1, Series2, Series5, Series6, Series7, and Series16 from the dataset. The dataset consists of 21797 genes and includes independent biological triplicates of four different human lung cell lines: primary human lung epithelium cell line (NHBE), transformed lung alveolar cell line (A549), transformed lung alveolar transduced with a vector expressing human ACE2 (A549.ACE2), and transformed lung-derived Calu-3 cells (Calu3), with mock treatment and SARS-CoV-2 infection as our research interest. Genes with low expression are filtered out based on a cutoff of median log2 transformed counts per gene per million mapped reads (CPM). After removing genes with a median log2(CPM) below −1, only 13111 genes are kept for the subsequent analysis. The right panel in Supplementary Figure S1 shows the normalized histogram of median log2(CPM) after removing the lowly expressed genes, which is in contrast to the highly left-skewed histogram before the filtering process, that is, shown in the left panel of Supplementary Figure S1.
2.2 Analysis plan
The study is designed to compare the mock-treated group and SARS-CoV-2-infected group in four different lung cell lines (NHBE, A549, A549.ACE2, and Calu3) with the aim of identifying singular and common DE genes, influenced pathways, and DN in these cell lines infected with the SARS-CoV-2 virus.
For A549.ACE2, the independent biological triplicates are also mock-treated or SARS-CoV-2-infected with or without Ruxolitinib (Rux) pre-treatment. Rux is verified as an effective and safe treatment for COVID-19 patients (La Rosée et al., 2020). In our analysis, we treat the independent biological triplicates infected with SARS-CoV-2 with and without Rux pre-treatment as one group based on the following two reasons: 1) The multidimensional scaling (MDS) and heatmap are techniques for visualizing the distances between two groups (cf., Mead, 1992; Wilkinson and Friendly, 2009). Both the MDS plot and the heatmap show a tiny difference between the independent biological triplicates infected with SARS-CoV-2 with and without Rux pre-treatment (cf., Supplementary Figures S2, S3). 2) Comparing DE genes between the mock-treated group and SARS-CoV-2-infected with Rux group and DE genes between the mock-treated group and SARS-CoV-2-infected without Rux group, there are negligible differences between these two lists of DE genes (cf., Supplementary Tables S1, S2).
A549.ACE2 is a modified version of A549 cells that expresses ACE2, the receptor for SARS-CoV-2 viral entry (Samavati and Uhal, 2020). In our study, we treat the independent biological triplicates of A549.ACE2 and A549 as distinct groups. We observe that similar to the analysis of Rux treatment, the difference between the independent biological triplicates of A549.ACE2 and A549 is smaller than other pairs of cell lines based on the MDS plot and heatmap. This is reasonable given that A549.ACE2 is a variant of A549. However, there are a small number of overlapping DE genes between the mock-treated and SARS-CoV-2-infected groups in both A549.ACE2 and A549 (cf., Supplementary Figures S2, S3; Supplementary Tables S3, S4).
2.3 Statistical methods
The objective of this study is to identify the singular and common DE genes, influenced pathways, and DN in the four lung cell lines (NHBE, A549, A549.ACE2, and Calu3) infected with the SARS-CoV-2 virus. All DE analysis, Pathway analysis, and DN analysis are performed based on the four pairs of comparison between the mock-treated group and SARS-CoV-2-infected group in each of the four cell lines (NHBEMock vs. NHBESARS.CoV.2, A549Mock vs. A549SARS.CoV.2, A549.ACE2Mock vs. A549.ACE2SARS.CoV.2, and Calu3Mock vs. Calu3SARS.CoV.2). Below, we outline the statistical methods used for the analysis of DE genes, pathways, and DN. All statistical analyses are conducted using R version 4.0.2 (R Foundation for Statistical Computing, Vienna, Austria).
2.3.1 Differential expression analysis
DE genes are defined as genes that exhibit a difference in expression between groups. In the fields of clinical trials and drug development, DE genes play an important role in the understanding of underlying disease mechanisms, the identification of potential biomarkers, the discovery of therapeutic targets, and the generation of gene signatures for diagnostic purposes. In our study, the DE analysis is conducted to find the DE genes in the four lung cell lines (NHBE, A549, A549.ACE2, and Calu3) infected with the SARS-CoV-2 virus. To prevent bias and validate the results of DE genes, we use multiple methods rather than relying on a single approach. Three commonly used R packages for DE analysis are utilized in our analysis, which are DESeq2 (Love et al., 2014), edgeR (Robinson et al., 2010), and limma (Ritchie et al., 2015), respectively. While these three methods have similar goals, there are some key differences in the normalization methods and statistical models that they use.
Three different normalization methods are utilized in these three DE methods (Dillies et al., 2013). The first method, employed by DESeq2, is called size factor normalization, which involves dividing the counts for each gene by a size factor that accounts for differences in library size. The second method, used by edgeR, is called trimmed mean of M-values (TMM), which adjusts for differences in library size and composition by scaling the counts for each sample to ensure that the average log-fold change between samples is zero. Finally, limma employs a method called quantile normalization, which adjusts for differences in library size and composition by matching the distribution of expression values across samples. As for statistical modeling techniques employed in this study, DESeq2 utilizes the negative binomial (a.k.a. gamma-poisson) distribution. Similarly, edgeR employs negative binomial-based models, with the addition of an empirical Bayes procedure to shrink the dispersions. Limma, on the other hand, utilizes a linear modeling-based method and incorporates an empirical Bayes approach to borrow information between genes. To adjust p-values for multiple comparisons, the Benjamini–Hochberg correction (Benjamini and Hochberg, 1995) is applied to all three differential expression methods and the significance threshold is set at 0.05.
After obtaining the ordered lists of DE genes for each of the four cell lines (NHBE, A549, A549.ACE2, and Calu3) by different DE methods (i.e., DESeq2, edgeR, and limma), the R package RankAggreg (Pihur et al., 2009) can be employed to aggregate these ordered lists based on the ranks using the Genetic Algorithm (Golberg, 1989).
2.3.2 Pathway analysis
DE analysis has a limitation that it can lead to the identification of a large number of DE genes between sample groups, making it challenging to apply visualization techniques and interpret in the biological context about these genes. To extract maximum information from RNA-seq data and gain a better understanding of the biological context of these DE genes and their potential role in disease or other biological processes, researchers can identify the signaling pathways affected by the observed changes. Signaling pathways consist of a group of genes that provides information about the fundamental cellular mechanisms and interactions required for the development of morphology and organs (Sanz-Ezquerro et al., 2017). In our study, the R package SPIA (Tarca et al., 2009) is utilized to examine the pathway topology, which includes listing the component genes and illustrating their interactions within the pathway (García-Campos et al., 2015). SPIA considers two pieces of evidence to evaluate the impact of DE genes on signaling pathways. Firstly, a “classical” pathway enrichment analysis is used to assess the number of DE genes observed in a given pathway. Secondly, the actual perturbation (activation or inhibition) of a given pathway under a specific condition is measured. Here, perturbation denotes the disturbance that induces changes in the gene-gene association. Human signaling pathways from the Kyoto Encyclopedia of Genes and Genomes (KEGG) database (Ogata et al., 1999), which is a knowledge open-source database for biological pathways, are used for this analysis. It should be mentioned that we consider pathways with an adjusted p-value below 0.05 to be statistically significant.
2.3.3 Differential network analysis
DN analysis is a method to identify group-specific changes in measures of differential connectivity (DC) by comparing networks between different sample groups (Gill et al., 2010; Grimes et al., 2019). In the analysis of RNA-seq data, the RNA-seq co-expression network is a type of differential network (Ballouz et al., 2015; Grimes et al., 2019), which comprise nodes representing genes and edges representing gene-gene associations (Mitra et al., 2013). The changes in the topology between two networks may suggest variations in cellular activity (Lu et al., 2007). In our study, we utilize the R package dnapath (Grimes et al., 2019) to perform DN analysis that integrates gene regulatory pathways into a DN analysis. The dnapath package can identify the DC pathways, DC genes, and DC edges by computing DC scores, with p-values calculated via monotonized permutation tests. The DN analysis is performed on pathways with sizes ranging from 10 to 200 in our study. The pathway information used in our analysis is obtained from the Reactome database (Jassal et al., 2020), which is a publicly available resource of biological pathways. The dnapath package is applied to the RNA-seq data from the literature (Ahn et al., 2021) to investigate the influence of tumor purity (TP) on gene expression data.
3 Results
3.1 Differential expression analysis
Table 1 displays the results of the three distinct DE methods, DESeq2, edgeR, and limma, for identifying DE genes among a total of 13111 genes in the four lung cell lines (NHBE, A549, A549.ACE2, and Calu3). The percentage of DE genes for each cell line is presented in the parenthesis in each entry of the table. It is worth noting that these methods exhibit minor differences, except for the limma method, which can detect almost 1.5 times as many DE genes for A549 in comparison with DESeq2 or edgeR. Among the four cell lines, NHBE has the lowest percentage of DE genes, which is approximately 0.2%, whereas A549.ACE2 has the highest percentage of DE genes, around 60%, which is consistent with the fact that ACE2 serves as the receptor for SARS-CoV-2 viral entry (Samavati and Uhal, 2020).
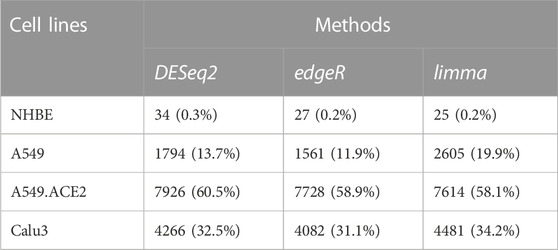
TABLE 1. Numbers of detected DE genes in the four lung cell lines (NHBE, A549, A549.ACE2, and Calu3) using the three DE methods (DESeq2, edgeR, and limma). The numbers in parentheses denote the percentages of detected DE genes for each cell line among a total of 13111 genes.
Given such a large number of DE genes, placing emphasis on the most biologically relevant genes can lead to more valuable insights in practical applications such as discovering biomarkers and potential therapeutic targets. Therefore, a list of the top 10 DE genes for each cell line using the three different DE methods is generated and presented in Table 2. It can be seen from the table that there is a little variation in the top 10 DE genes identified for each cell line by different DE methods. RankAggreg is then used to combine the ranked lists of DE genes from each cell line, based on the ranks obtained from the three DE methods via the Genetic Algorithm (Table 2).
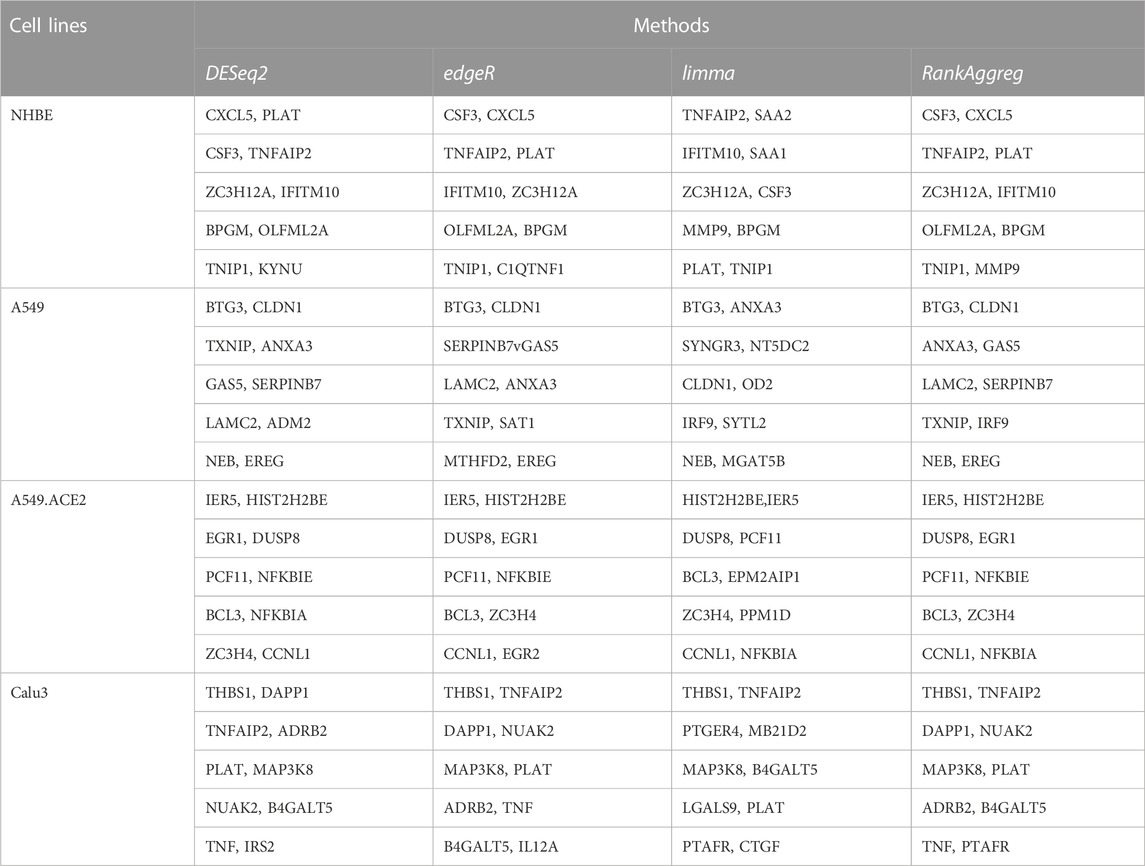
TABLE 2. Top ten DE genes in the four lung cell lines (NHBE, A549, A549.ACE2, and Calu3) using three DE methods (DESeq2, edgeR, and limma), as well as the Rank Aggregation Method RankAggreg.
Based on the DESeq2 results, we plot a Venn diagram (cr., Figure 1) to visualize the overlapping DE genes among the four lung cell lines, NHBE, A549, A549.ACE2, and Calu3. The analysis shows that there are 14 overlapping DE genes between A549 and NHBE, 26 overlapping DE genes between A549.ACE2 and NHBE, and 25 overlapping DE genes between Calu3 and NHBE. Moreover, there are 1086 overlapping DE genes between A549 and A549.ACE2, 816 overlapping DE genes between A549 and Calu3, and 3055 overlapping DE genes between A549.ACE2 and Calu3. Notably, 12 DE genes are shared among all four cell lines, including NHBE, A549, Calu3, and A549.ACE2. These genes are SAA2, BIRC3, TNFAIP2, IL32, CSF3, C1QTNF1, C3, KYNU, CXCL5, CXCL3, VNN1, and SOD2. These genes have been identified that are associated with both severe COVID-19 and various other health conditions. SAA2, for example, is linked to inflammation and tissue (e.g., cancer cell lines) injury (Malle et al., 2009) and has been identified as a biomarker of severe COVID-19 and poor prognosis (Li et al., 2020). BIRC3 is an upregulated gene, also verified in our analysis, in glioblastoma and leads to therapeutic resistance due to its critical role in the NF-κB signaling pathway (Wang et al., 2016). It has also been identified as one of the six common hub proteins involved in SARS-CoV-2 infection and the risk factors related to COVID-19 (Nain et al., 2021). Additionally, CXCL3, a member of the CXC-type chemokine family, is known to be involved in the development and progression of various types of cancer (Lou et al., 2023) and has also been linked to COVID-19 (Chua et al., 2020).
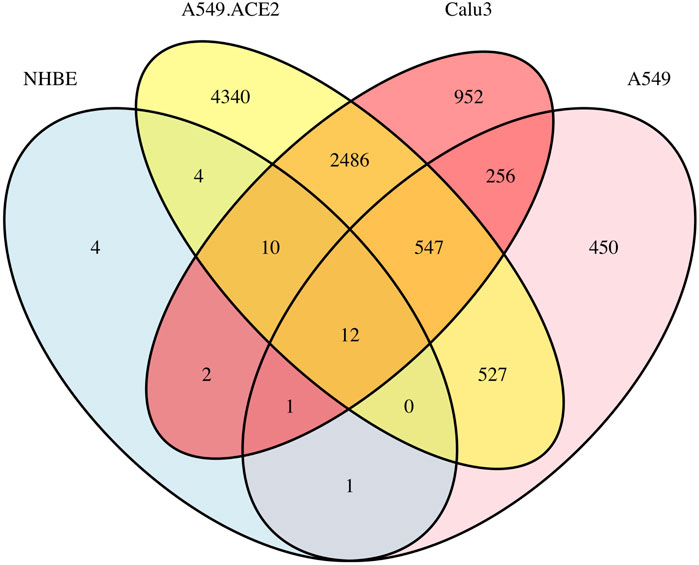
FIGURE 1. A Venn diagram illustrating the overlap of DE genes among the four lung cell lines (NHBE, A549, A549.ACE2, and Calu3) based on the results of DESeq2.
For more comprehensive information about DE genes, including the number of upregulated and downregulated genes and the complete table regarding the results of the top 10 significant DE genes for each cell line type, along with the corresponding volcano plots, please refer to Supplementary Tables S5–S9 and Supplementary Figure S4.
3.2 Pathway analysis
Based on the DE genes identified by DESeq2 for each lung cell line, SPIA is used to investigate the significant signaling pathways for each cell line. The top 10 significant signaling pathways for each lung cell line, as determined by SPIA, are presented in Tables 3–6. These pathways play crucial roles in the functioning of the four lung cell lines, highlighting their potential relevance in respiratory infections and diseases. Furthermore, Figure 2 displays the corresponding SPIA two-way evidence plots.
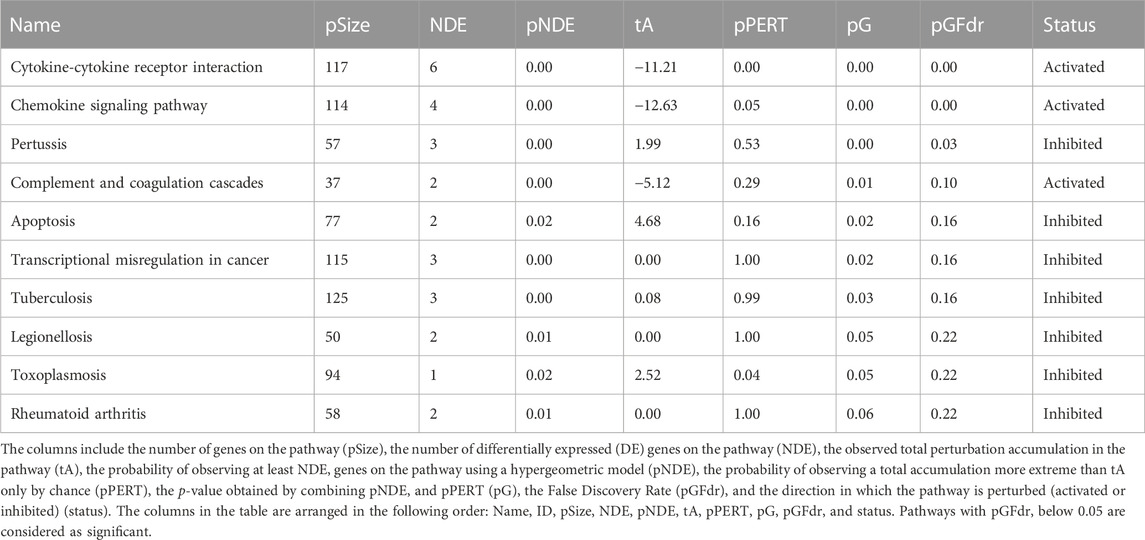
TABLE 3. Ten most significant pathways identified by SPIA for the lung cell line NHBE.
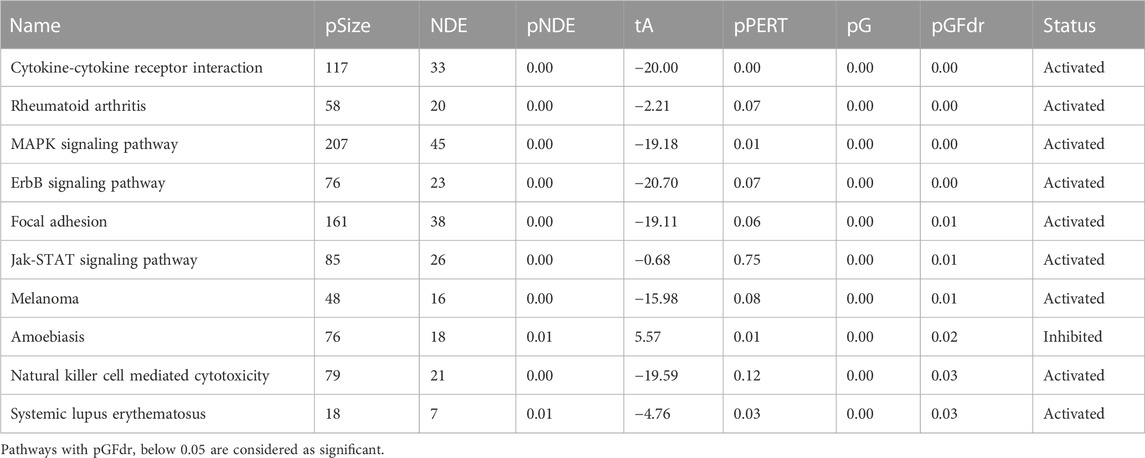
TABLE 4. Ten most significant pathways identified by SPIA for the lung cell line A549.
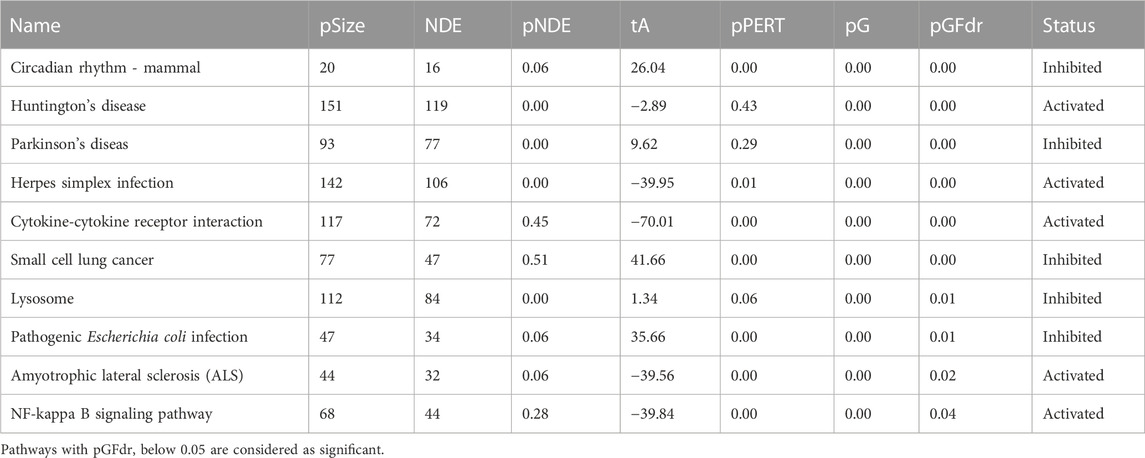
TABLE 5. Ten most significant pathways identified by SPIA for the lung cell line A549.ACE2.
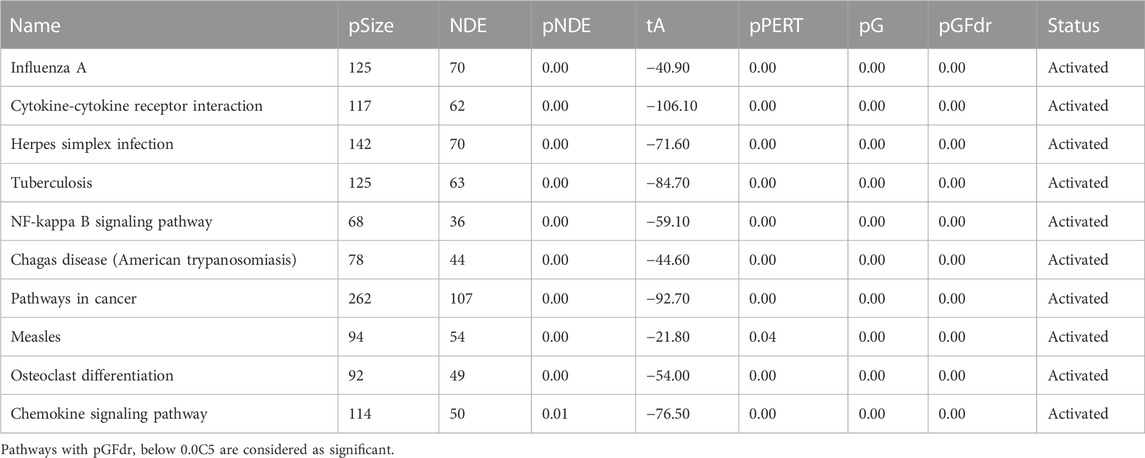
TABLE 6. Ten most significant pathways identified by SPIA for the lung cell line Calu3.
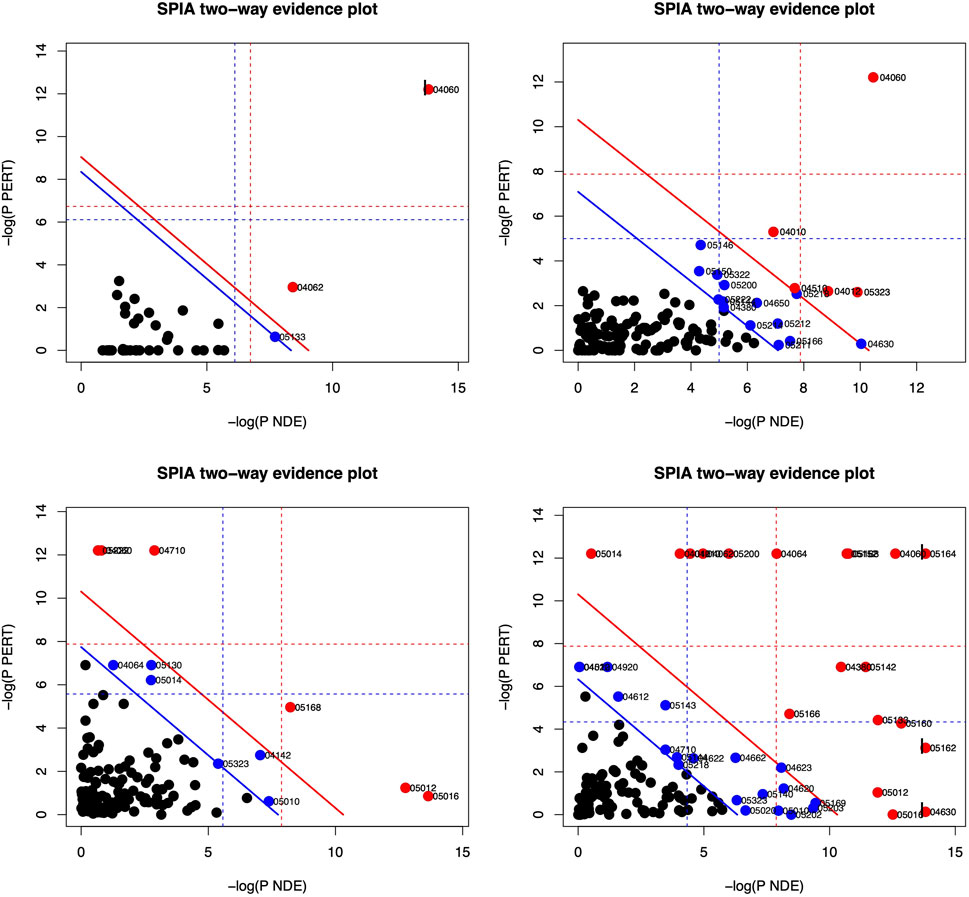
FIGURE 2. SPIA two-way evidence plots for the four lung cell lines: NHBE (top-left), A549 (top-right), A549.ACE (bottom-left), and Calu3 (bottom-right). The most significant pathways in the experiment are represented by the red dots. The significance is determined by measuring the log of pNDE and the log of pPERT.
Based on the False Discovery Rate (pGFdr) cutoff of 0.05, only three pathways are identified as significant in the NHBE lung cell type (cf., Table 3 and top-left panel in Figure 2), “Cytokine-cytokine receptor interaction” and “Chemokine signaling pathway” are associated with inflammation and immune response (Turner et al., 2014), and are known to be impacted by SARS-CoV-2 infection (Costela-Ruiz et al., 2020). Meanwhile, “Pertussis” is linked to common symptoms of COVID-19 disease, such as paroxysmal coughing with whooping and post-tussive vomiting (De Gouw et al., 2011).
The lung cell type A549 is analyzed to identify the top 10 significant signaling pathways (cf., Table 4 and top-right panel in Figure 2). Among these pathways, “Cytokine-cytokine receptor interaction” is not only the most significant for A549 but also the same as the top one for NHBE. Furthermore, “Rheumatoid arthritis” is a pathway associated with bone destruction (Takayanagi, 2009) and linked to severity and risk of COVID-19 (Dewanjee et al., 2021). Another pathway, “MAPK signaling pathway”, is crucial for various cellular processes such as proliferation, differentiation, development, inflammatory responses, and apoptosis (Zhang and Liu, 2002), and can be provoked by SARS-CoV-2 infection (Grimes and Grimes, 2020).
For the lung cell type A549.ACE2 (cf., Table 5 and bottom-left panel in Figure 2), the top three significant signaling pathways are identified as follows. The “Circadian rhythm—mammal” pathway controls the internal biological clock that enables the sustenance of 24-h physiological and behavioral processes in organisms (Takahashi, 2017), which is shown to be perturbated by SARS-CoV-2 infection (Liu et al., 2021). Landles and Bates (2004) described “Huntington’s disease” as an autosomal-dominant neurodegenerative disorder that primarily affects medium spiny striatal neurons (MSN) and leads to symptoms such as motor dysfunction (e.g., choreiform and involuntary movements), cognitive decline (e.g., dementia), and psychiatric disturbances (e.g., personality changes). “Parkinson’s disease” is a neurodegenerative movement disorder (Abou-Sleiman et al., 2006) that is, related to the third significant signaling pathway. Notably, several recent studies have linked COVID-19 disease to the pathways named after these diseases. (Ellul et al., 2020; Rahman et al., 2021).
Among the top 10 significant signaling pathways identified for the lung cell type Calu3 (cf., Table 6; bottom-right panel in Figure 2), the most significant one is “Influenza A” which is responsible for annual seasonal flu epidemics and periodic pandemics worldwide (Michael et al., 2013) and also related to COVID pandemic (Flerlage et al., 2021). “Cytokine-cytokine receptor interaction” is also identified as a significant signaling pathway for Calu3, similar to NHBE and A549. Additionally, the pathway, “Herpes simplex infection”, is associated with various symptoms, including orofacial lesions, infectious blindness, viral encephalitis, genital lesions, and neonatal encephalitis (Steiner and Benninger, 2013), and can be triggered by COVID-19 infection (Shanshal and Ahmed, 2021).
Furthermore, Supplementary Figure S5 displays six Venn diagrams that compare the significant signaling pathways shared among the four lung cell lines: A549 vs. NHBE, A549.ACE2 vs. NHBE, Calu3 vs. NHBE, A549 vs. A549.ACE2, A549 vs. Calu3, and A549.ACE2 vs. Calu3. In addition, Figure 3 illustrates the significant signaling pathways that overlap among these four lung cell lines. Only one significant signaling pathway overlaps across these four lung cell lines, which is the “cytokine-cytokine receptor interaction” pathway.
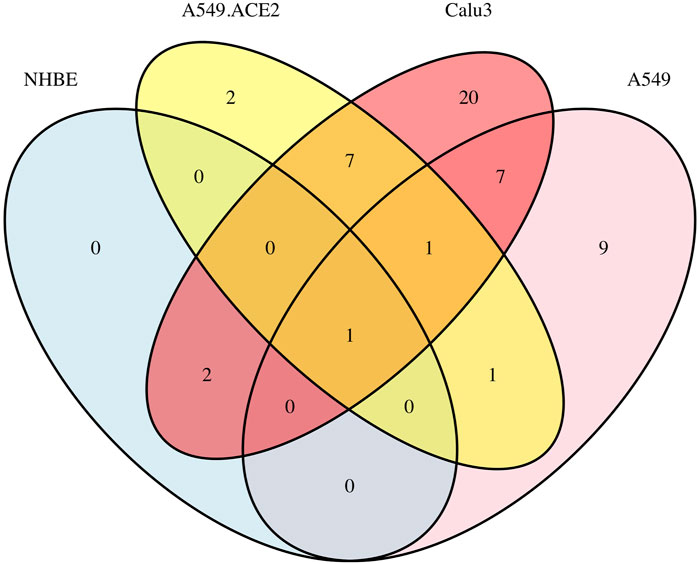
FIGURE 3. Overlap of significant signaling pathways in four lung cell lines A549, A549.ACE2, Calu3, and NHBE.
3.3 Differential network analysis
DN analysis is conducted on two sets of genes: 1) a total of 13,111 genes and 2) DE genes identified for each lung cell line. The DE genes are obtained using DESeq2, and Table 1 shows the number of DE genes for each cell line: 34 for NHBE, 1794 for A549, 7926 for A549.ACE2, and 4266 for Calu3.
To determine the DC pathways that are significantly affected by these genes, we analyze the DN results for both sets of genes separately. For the entire set of 13,111 genes, we identify the top ten significant DC pathways for each lung cell line and these results are presented in Tables 7–10. Meanwhile, for the DE genes, we obtain the top 10 significant DC pathways for each lung cell line and these results are shown in Supplementary Tables S10–S13. The DN analysis results for NHBE and Calu3 show relatively large p-values of differential connectivity score for each pathway, which could be attributed to the small sample size of these two cell lines, as each group only has three replicates (mock vs. SARS-CoV-2 infected). By examining the significant DC pathways for both sets of genes, we can gain insight into the specific biological processes that are influenced by these genes in each lung cell line. This information can help us better understand the molecular mechanisms underlying the COVID-19 disease. Based on the outcomes of the DN analysis conducted on 13,111 genes, the subsequent analysis is performed.
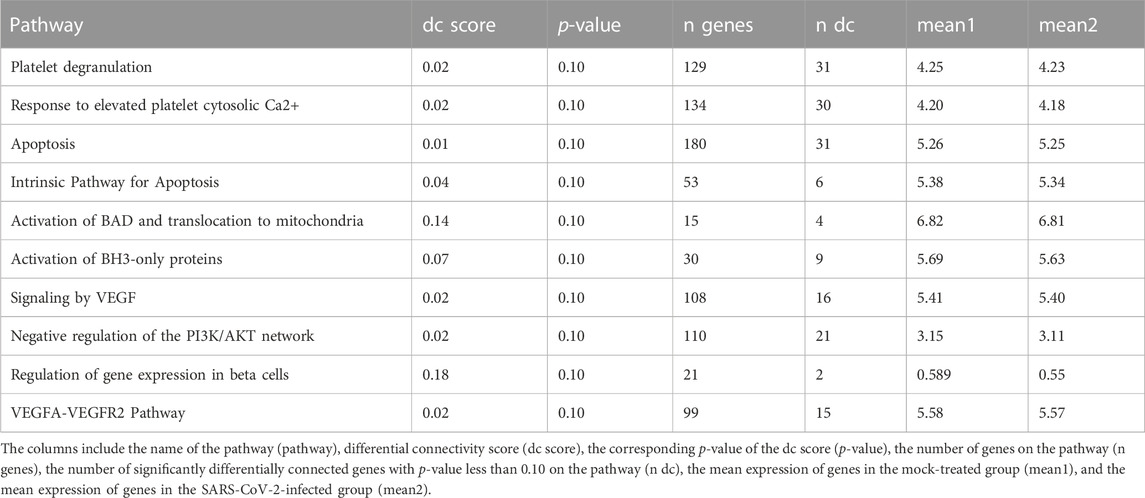
TABLE 7. Ten most significant DC pathways identified by dnapath for the lung cell line NHBE based on a total of 13,111 genes.
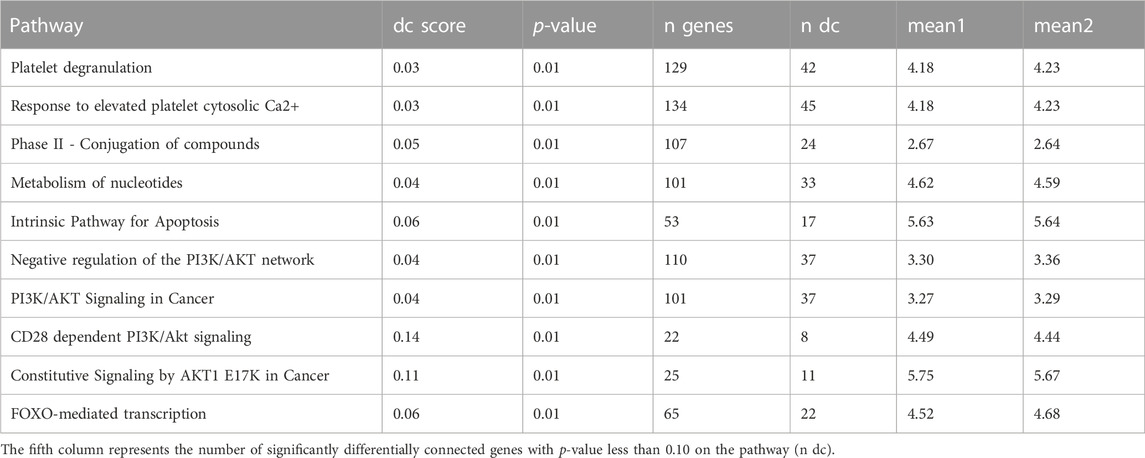
TABLE 8. Ten most significant DC pathways identified by dnapath for the lung cell line A549 based on a total of 13,111 genes.
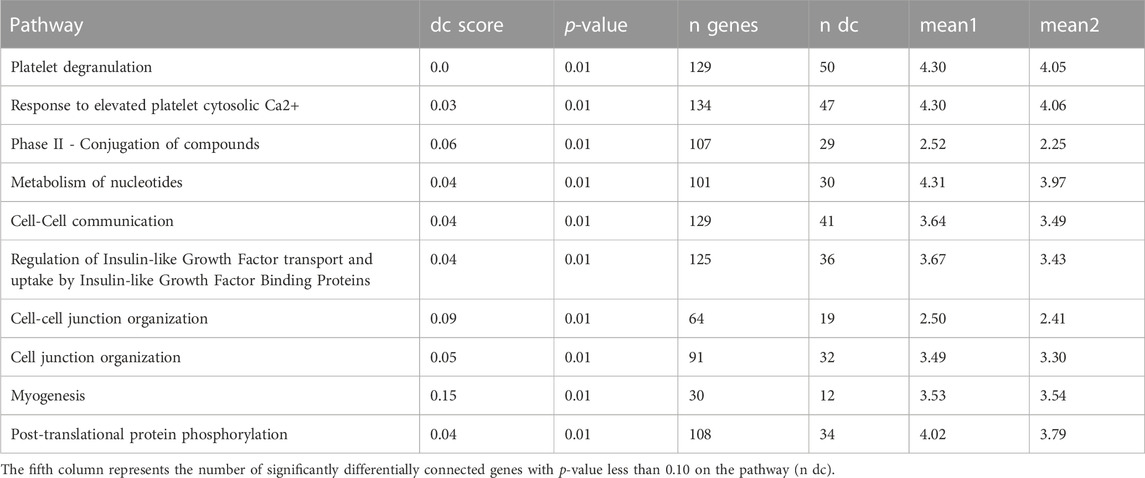
TABLE 9. Ten most significant DC pathways identified by dnapath for the lung cell line A549.ACE2 based on a total of 13,111 genes.
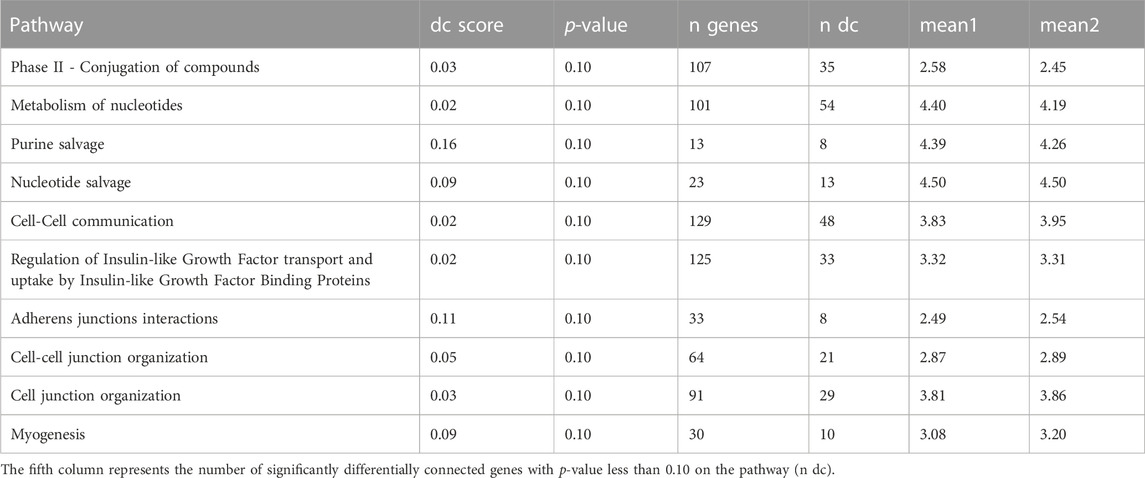
TABLE 10. Ten most significant DC pathways identified by dnapath for the lung cell line Calu3 based on a total of 13,111 genes.
The lung cell line NHBE infected with SARS-CoV-2 demonstrates three important characteristics (cr., Table 7). First, Coppinger et al. (2004) reported that “platelet degranulation” is associated with vascular injury, and it is known to be dysregulated in response to COVID-19 infection (Zamanian-Azodi et al., 2021). Second, Varga-Szabo et al. (2009) identified that “response to elevated platelet cytosolic Ca2+” serves as an event of platelet degranulation, which is essential for platelet activation in hemostasis and thrombosis. Third, MacFarlane and Williams (2004) revealed that “apoptosis” is related to cell death and manipulated by SARS-CoV-2 virus to evade its own elimination (Li et al., 2022).
For the lung cell line A549 (cr., Table 8), the two most significant DC pathways identified from DN analysis are similar to NHBE, which are “Platelets degranulation” and “Response to elevated platelet cytosolic Ca2+”. Additionally, the pathway “Phase II - Conjugation of compounds” is found to play a crucial role in the detoxification of various xenobiotics, drug metabolism, and endogenous substrates (Jančová and Šiller, 2012) and be suppressed by the COVID-19 disease (Hammoudeh et al., 2021).
For the lung cell line A549.ACE2 (cr., Table 9), similar to A549, the top three significant DC pathways identified from DN analysis are “Platelets degranulation”, “Response to elevated platelet cytosolic Ca2+”, and “Phase II—Conjugation of compounds”.
For the lung cell line Calu3 (cr., Table 10), the top significant DC pathway identified from DN analysis is “Phase II—Conjugation of compounds”, which is also significant for A549 and A549.ACE2. In addition, two other DC pathways are also identified as significant. “Metabolism of nucleotides” is essential to cellular signaling and energy transduction events (Welin and Nordlund, 2010) and affected by SARS-CoV-2 virus (Qin et al., 2022). “Purine salvage” plays a crucial role in energy conservation (Cappiello et al., 1992), and it is closely related to SARS-CoV-2 replication (Zhang et al., 2021b).
Figure 4 displays a Venn diagram of the top 100 significant DC pathways resulting from the DN analysis for the four different lung cell lines NHBE, A549, A549.ACE2, and Calu3. The overlapping significant DC pathways identified among these cell lines are “Intrinsic Pathway for Apoptosis”, “Negative regulation of the PI3K/AKT network”, “Fatty acid metabolism”, and “DDX58/IFIH1-mediated induction of interferon-alpha/beta”. “Intrinsic Pathway for Apoptosis” is mainly linked to immune cell depletion during COVID-19 disease (Bader et al., 2022) and triggered by cellular damage or stress, leading to the activation of “apoptosis” pathway (Krüger and Richter, 2022). “Negative regulation of the PI3K/AKT network” is associated with growth factors and hormones (Shorning et al., 2020), and it is known to be activated by SARS-CoV-2 infections (Farahani et al., 2022). “Fatty acid metabolism” is a crucial component of human energy metabolism (Vance and Vance, 1996)and is suggested as a potential target for inhibiting SARS-CoV-2 virus replication (Tanner and Alfieri, 2021). Finally, “DDX58/IFIH1-mediated induction of interferon-alpha/beta”, whose production is influenced by SARS-CoV-2 virus (Feizollahi et al., 2023), is also linked to Influenza A viruses and Hepatitis C Viruses (Yoneyama and Fujita, 2007).
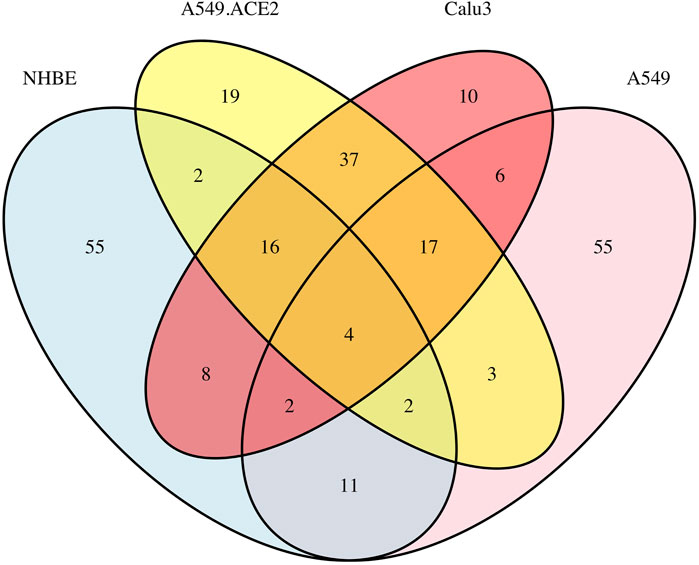
FIGURE 4. Overlap of the top 100 significant pathways based on the DN analysis of the four lung cell lines: A549, A549.ACE2, Calu3, and NHBE, using a total of 13,111 genes.
The network plots (cr. Figure 5) are generated for each of the four lung cell lines, depicting the differential connectivity of the most significant DC pathway that they share, “Intrinsic Pathway for Apoptosis”. This allows us to visually compare the differential connectivity of this pathway between the different cell lines. As depicted in Figure 5, there is a considerable variation in the differential connectivity of the “Intrinsic Pathway for Apoptosis” across the four lung cell lines. The detailed information about the nodes and edges of this pathway is available for reference in Supplementary Tables S14–S21.
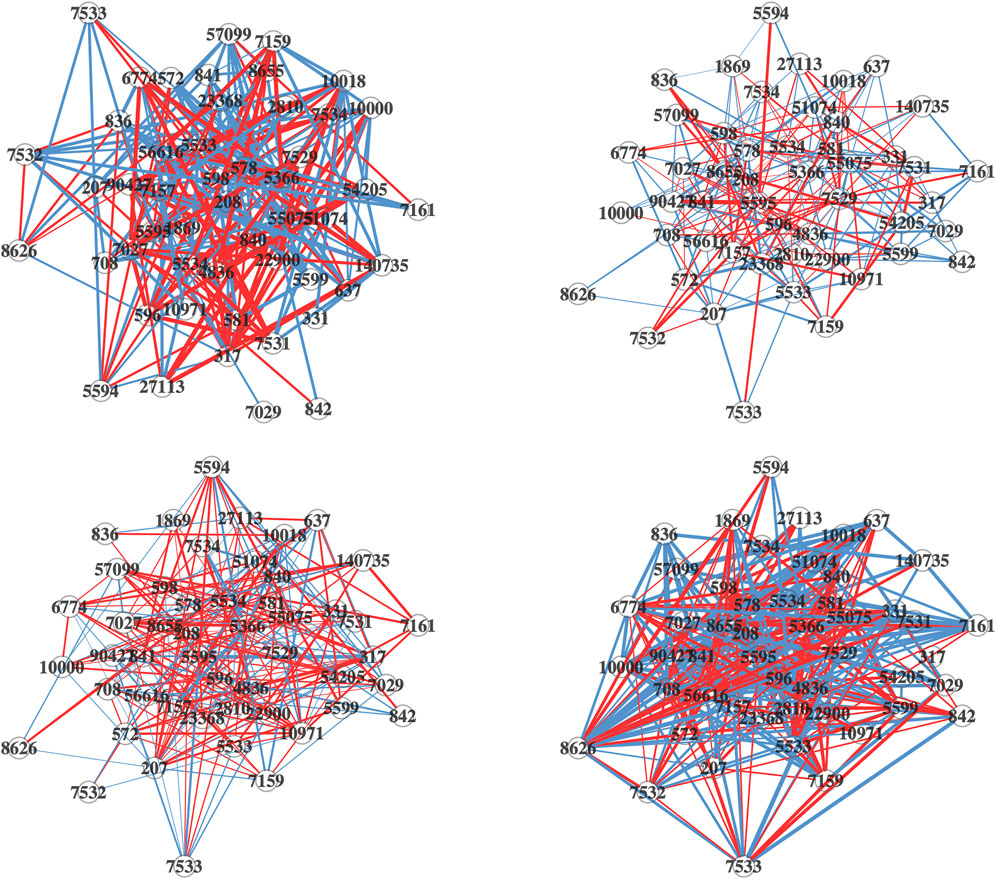
FIGURE 5. Differential network plots of “Intrinsic Pathway for Apoptosis” for the four lung cell Lines, NHBE (top-left), A549 (top-right), A549.ACE (bottom-left), and Calu3 (bottom-right). In the network plots, nodes represent genes. The edges in the network are color-coded: a blue edge denotes a stronger gene-gene association in the mock-treated group, while a red edge denotes a stronger association in the SARS-CoV-2 infected group. The width of the edges corresponds to the magnitude of the association, and the transparency is determined by the p-value of the edge’s differential connectivity score.
Unfortunately, Reactome does not currently have an exact mapping file to KEGG. Domingo-Fernández et al. (2018) provided insights on the mapping across different pathway databases, introducing a method called ComPath. For the KEGG pathway “cytokine-cytokine receptor interaction”, which is the only pathway found to be significant among all four cell lines, ComPath was used to obtain three sub-pathways from Reactome: “IL-6-type cytokine receptor ligand interactions”, “TNFs bind their physiological receptors”, and “Chemokine receptors bind chemokines”. Among these, “IL-6-type cytokine receptor ligand interactions” was identified as significantly differentially connected for Calu3, “TNFs bind their physiological receptors” for A549, A549.ACE2, and Calu3, and “Chemokine receptors bind chemokines” for NHBE and A549.
4 Discussion
The purpose of this study is to analyze the RNA-seq data of the four lung cell lines NHBE, A549, A549.ACE2, and Calu3, and identify their common and unique biological features by conducting the DE analysis, pathway analysis, and DN analysis on the data from each cell line.
This study reveals the shared and unique features of DE genes in the four lung cell lines NHBE, A549, A549.ACE2, and Calu3, using the R packages DESeq2, edgeR, and limma. The cell line A549.ACE2 exhibits the highest number of DE genes, while the cell line NHBE has the lowest, which is consistent with the finding in the literature (Alipoor et al., 2021). Although there exists some variation in the results of DE analysis between our study and other studies, this might be due to differences in data pre-processing and DE analysis methods. The ordered list of the top 10 DE genes for each lung cell line is determined by RankAggreg, which combines the results of the three DE analysis methods. Among the DE genes identified for the four lung cell lines, 12 genes are overlapped, which are SAA2, BIRC3, TNFAIP2, IL32, CSF3, C1QTNF1, C3, KYNU, CXCL5, CXCL3, VNN1, and SOD2. These genes are known to be associated with COVID-19 disease, which are elucidated in the recent literature (Malle et al., 2009; Chua et al., 2020; Liang et al., 2020; Menon et al., 2020; Nunnari et al., 2020; Yang et al., 2020; Fang et al., 2021; Zinellu and Mangoni, 2021; Bizjak et al., 2022; Jerotic et al., 2022; Luo et al., 2022; Zamani et al., 2022; Zoodsma et al., 2022). Out of these twelve genes, SAA2, BIRC3, TNFAIP2, IL32, CSF3, C3, KYNU, CXCL5, CXCL3, and SOD2 are linked to inflammation. CSF3, KYNU, and VNN1 are related to the immune system, while C1QTNF1, C3, and SOD2 are associated with blood coagulation. Identifying these specific genes associated with COVID-19 is essential to understand the molecular mechanisms underlying the disease, which can help researchers develop potential drug targets for therapeutic interventions to reduce the severity of COVID-19 and improve patient outcomes.
The study employs SPIA to investigate the significant signaling pathways in each of the four lung cell lines—NHBE, A549, A549.ACE2, and Calu3. The number of identified significant pathways by SPIA for the four cell lines are 3, 19, 12, and 38, respectively. The results show that the most significant signaling pathways vary among the four cell lines. For NHBE, the most significant signaling pathways are related to inflammation, immune response, and COVID-19 symptoms, such as coughing and vomiting. For A549, the most significant pathways are not only related to inflammation but also to bone destruction. The most significant pathways for A549.ACE2 are associated with internal biological clock, motor dysfunction, cognitive decline, psychiatric disturbances, and neurodegenerative movement disorder. In contrast, the most significant pathways for Calu3 are related to flu epidemics, inflammation, immune system, and orofacial lesions. Interestingly, only one pathway, “cytokine-cytokine receptor interaction” is found to be significant among all four cell lines and is closely related to inflammation and immune response. This finding is consistent with some recent research (Chen et al., 2020; Mehta et al., 2020), and there is a study even summarizes the crucial role that the “cytokine-cytokine receptor interaction” plays in COVID-19 disease (Costela-Ruiz et al., 2020). This information can help researchers better understand the underlying mechanisms of COVID-19 and develop more effective treatment plans that target the specific pathways involved in the disease.
Based on the results of DN analysis by using dnapath, it is observed that there are certain biological traits shared and distinct among the four distinct lung cell lines. The DN analysis indicates that the three most significant DC pathways for NHBE are linked to vascular injury and cell death. In contrast, the top three significant DC pathways for A549 are not only associated with vascular injury but also with various detoxification processes. Interestingly, the top three significant DC pathways for A549.ACE2 exhibit functions similar to those of A549. Finally, for Calu3, the three most significant DC pathways are involved in detoxification processes, energy transduction, and energy conservation. The DN analysis reveals that among the 100 most significant DC pathways for each of the four lung cell lines, there are some shared DC pathways, including “Intrinsic Pathway for Apoptosis”, “Negative regulation of the PI3K/AKT network”, “Fatty acid metabolism”, and “DDX58/IFIH1-mediated induction of interferon-alpha/beta”. These pathways are associated with various cellular processes such as cellular damage, growth factors, hormones, energy metabolism, and the periodic occurrence of flu epidemics. Despite the identification of many common significant pathways among the four lung cell lines from the DN analysis, the differential connectivity of these pathways is significantly different among the four cell lines. For instance, the “Intrinsic Pathway for Apoptosis” exhibits distinct differential connectivity patterns among these cell lines. Our results of the DN analysis can provide a more comprehensive understanding of molecular pathways and differential networks that are disrupted in COVID-19 and give potential therapeutic recommendations.
Our study aims to investigate the unique and shared mechanisms underlying COVID-19 disease in the four distinct lung cell lines NHBE, A549, A549.ACE2, and Calu3 using DE analysis, pathway analysis, and DN analysis. Following the application of the various statistical techniques to the RNA-Seq data, we successfully 1) generate the ordered lists of DE genes for individual cell lines through a rank aggregation method, identify overlapping DE genes across four distinct cell lines, 2) discover significant signaling pathways unique to each cell line, recognized shared significant signaling pathways among all cell lines, 3) unveil significant DN pathways for each cell line and identify common significant DC pathways among them. The outcomes of these analyses, which are previously demonstrated, reveal promising results. We eagerly anticipate the validation of these findings by experts in the fields of biology, medicine, and pharmacology. However, our study has limitations, including a small sample size and the absence of covariates in the analysis. Additionally, the current versions of the R packages SPIA and dnapath utilize different databases for pathway analysis and DN analysis. The former only includes KEGG pathways data, while the latter only includes Reactome pathways data. To address these limitations, we suggest searching more related RNA-seq data, incorporating covariates if clinical data are also available, and trying more approaches of pathway analysis and DN analysis to validate the results and avoid bias caused by relying on only one approach. Integrating both KEGG pathways and Reactome pathways data into these R packages (e.g., SPIA and dnapath) in the future would enable us to establish connections between our results of pathway analysis and DN analysis. Furthermore, we can also apply similar DE analysis, pathway analysis, and DN analysis to investigate other lung-related diseases using these lung cell lines. Furthermore, we can investigate the distinct and shared mechanisms of the SARS-CoV-2 virus and other comparable viruses, which can provide more insights into the pathogenesis of COVID-19.
Data availability statement
The RNA-Seq data was obtained from the Gene Expression Omnibus (GEO) under the accession number GSE147507 (Blanco-Melo et al., 2020).
Ethics statement
The studies involving humans were approved by Daniel Blanco-Melo (Department of Microbiology, Icahn School of Medicine at Mount Sinai, New York, NY, United States; Virus Engineering Center for Therapeutics and Research, Icahn School of Medicine at Mount Sinai, New York, NY, United States) Benjamin R tenOever (Department of Microbiology, Icahn School of Medicine at Mount Sinai, New York, NY, United States; Virus Engineering Center for Therapeutics and Research, Icahn School of Medicine at Mount Sinai, New York, NY, United States; Global Health and Emerging Pathogens Institute, Icahn School of Medicine at Mount Sinai, New York, NY, United States. Electronic address: YmVuamFtaW4udGVub2V2ZXJAbXNzbS5lZHU=). The studies were conducted in accordance with the local legislation and institutional requirements. The participants provided their written informed consent to participate in this study.
Author contributions
SD and PQ conceived and provided guidance to the project. XZ and SA developed the study of interest and designed the study. XZ conducted data pre-processing, performed data analysis, and drafted the first manuscript. SA provided suggestions and feedback during the data analysis and initial revision of the manuscript. SD and PQ provided suggestions in the final revision of the manuscript. All authors contributed to the article and approved the submitted version.
Acknowledgments
We would like to express our gratitude to the editor for inviting us to submit a full-length research paper to the research collection of ISMB CAMDA 2022. We would like to express our appreciation to the two reviewers for taking their time to evaluate our work and offering insightful suggestions. We would also like to thank our lab team members, Chijioke S Anyaso-Samuel, Yuting Yang, Shoumi Sarkar, and Owen C Visser, for providing their insightful discussions throughout the research process.
Conflict of interest
The authors declare that the research was conducted in the absence of any commercial or financial relationships that could be construed as a potential conflict of interest.
Publisher’s note
All claims expressed in this article are solely those of the authors and do not necessarily represent those of their affiliated organizations, or those of the publisher, the editors and the reviewers. Any product that may be evaluated in this article, or claim that may be made by its manufacturer, is not guaranteed or endorsed by the publisher.
Supplementary material
The Supplementary Material for this article can be found online at: https://www.frontiersin.org/articles/10.3389/fgene.2023.1235927/full#supplementary-material
References
Abou-Sleiman, P. M., Muqit, M. M., and Wood, N. W. (2006). Expanding insights of mitochondrial dysfunction in Parkinson’s disease. Nat. Rev. Neurosci. 7, 207–219. doi:10.1038/nrn1868
Ahn, S., Grimes, T., and Datta, S. (2021). The analysis of gene expression data incorporating tumor purity information. Front. Genet. 12, 642759. doi:10.3389/fgene.2021.642759
Alipoor, S. D., Mortaz, E., Jamaati, H., Tabarsi, P., Bayram, H., Varahram, M., et al. (2021). Covid-19: molecular and cellular response. Front. Cell. Infect. Microbiol. 11, 563085. doi:10.3389/fcimb.2021.563085
Bader, S. M., Cooney, J. P., Pellegrini, M., and Doerflinger, M. (2022). Programmed cell death: the pathways to severe covid-19? Biochem. J. 479, 609–628. doi:10.1042/BCJ20210602
Ballouz, S., Verleyen, W., and Gillis, J. (2015). Guidance for rna-seq co-expression network construction and analysis: safety in numbers. Bioinformatics 31, 2123–2130. doi:10.1093/bioinformatics/btv118
Benjamini, Y., and Hochberg, Y. (1995). Controlling the false discovery rate: a practical and powerful approach to multiple testing. J. R. Stat. Soc. Ser. B Methodol. 57, 289–300. doi:10.1111/j.2517-6161.1995.tb02031.x
Bizjak, D. A., Stangl, M. J., Börner, N., Bösch, F., Durner, J., Drunin, G., et al. (2022). Kynurenine serves as useful biomarker in acute, long-and post-covid-19 diagnostics. Front. Immunol. 13, 1004545. doi:10.3389/fimmu.2022.1004545
Blanco-Melo, D., Nilsson-Payant, B. E., Liu, W.-C., Uhl, S., Hoagland, D., Møller, R., et al. (2020). Imbalanced host response to sars-cov-2 drives development of covid-19. Cell. 181, 1036–1045.e9. doi:10.1016/j.cell.2020.04.026
Cappiello, M., Barsacchi, D., Corso, A. D., Tozzi, M. G., Camici, M., Mura, U., et al. (1992). Purine salvage as a metabolite and energy saving mechanism in the ocular lens. Curr. eye Res. 11, 435–444. doi:10.3109/02713689209001797
Chen, N., Zhou, M., Dong, X., Qu, J., Gong, F., Han, Y., et al. (2020). Epidemiological and clinical characteristics of 99 cases of 2019 novel coronavirus pneumonia in wuhan, China: a descriptive study. lancet 395, 507–513. doi:10.1016/S0140-6736(20)30211-7
Chen, F., Zhang, Y., Sucgang, R., Ramani, S., Corry, D., Kheradmand, F., et al. (2021). Meta-analysis of host transcriptional responses to sars-cov-2 infection reveals their manifestation in human tumors. Sci. Rep. 11, 2459. doi:10.1038/s41598-021-82221-4
Chua, R. L., Lukassen, S., Trump, S., Hennig, B. P., Wendisch, D., Pott, F., et al. (2020). Covid-19 severity correlates with airway epithelium–immune cell interactions identified by single-cell analysis. Nat. Biotechnol. 38, 970–979. doi:10.1038/s41587-020-0602-4
Cohen, F. S. (2016). How viruses invade cells. Biophysical J. 110, 1028–1032. doi:10.1016/j.bpj.2016.02.006
Coppinger, J. A., Cagney, G., Toomey, S., Kislinger, T., Belton, O., McRedmond, J. P., et al. (2004). Characterization of the proteins released from activated platelets leads to localization of novel platelet proteins in human atherosclerotic lesions. Blood 103, 2096–2104. doi:10.1182/blood-2003-08-2804
Costela-Ruiz, V. J., Illescas-Montes, R., Puerta-Puerta, J. M., Ruiz, C., and Melguizo-Rodríguez, L. (2020). Sars-cov-2 infection: the role of cytokines in covid-19 disease. Cytokine & growth factor Rev. 54, 62–75. doi:10.1016/j.cytogfr.2020.06.001
Daamen, A. R., Bachali, P., Owen, K. A., Kingsmore, K. M., Hubbard, E. L., Labonte, A. C., et al. (2021). Comprehensive transcriptomic analysis of covid-19 blood, lung, and airway. Sci. Rep. 11, 7052. doi:10.1038/s41598-021-86002-x
De Gouw, D., Diavatopoulos, D. A., Bootsma, H. J., Hermans, P. W., and Mooi, F. R. (2011). Pertussis: a matter of immune modulation. FEMS Microbiol. Rev. 35, 441–474. doi:10.1111/j.1574-6976.2010.00257.x
Dewanjee, S., Kandimalla, R., Kalra, R. S., Valupadas, C., Vallamkondu, J., Kolli, V., et al. (2021). Covid-19 and rheumatoid arthritis crosstalk: emerging association, therapeutic options and challenges. Cells 10, 3291. doi:10.3390/cells10123291
Dillies, M.-A., Rau, A., Aubert, J., Hennequet-Antier, C., Jeanmougin, M., Servant, N., et al. (2013). A comprehensive evaluation of normalization methods for illumina high-throughput rna sequencing data analysis. Briefings Bioinforma. 14, 671–683. doi:10.1093/bib/bbs046
Domingo-Fernández, D., Hoyt, C. T., Bobis-Álvarez, C., Marín-Llaó, J., and Hofmann-Apitius, M. (2018). Compath: an ecosystem for exploring, analyzing, and curating mappings across pathway databases. NPJ Syst. Biol. Appl. 4, 43. doi:10.1038/s41540-018-0078-8
Draghici, S., Nguyen, T.-M., Sonna, L. A., Ziraldo, C., Vanciu, R., Fadel, R., et al. (2021). Covid-19: disease pathways and gene expression changes predict methylprednisolone can improve outcome in severe cases. Bioinformatics 37, 2691–2698. doi:10.1093/bioinformatics/btab163
Ellul, M. A., Benjamin, L., Singh, B., Lant, S., Michael, B. D., Easton, A., et al. (2020). Neurological associations of covid-19. Lancet Neurology 19, 767–783. doi:10.1016/S1474-4422(20)30221-0
Fang, C., Mei, J., Tian, H., Liou, Y.-L., Rong, D., Zhang, W., et al. (2021). Csf3 is a potential drug target for the treatment of covid-19. Front. Physiology 11, 605792. doi:10.3389/fphys.2020.605792
Farahani, M., Niknam, Z., Amirabad, L. M., Amiri-Dashatan, N., Koushki, M., Nemati, M., et al. (2022). Molecular pathways involved in covid-19 and potential pathway-based therapeutic targets. Biomed. Pharmacother. 145, 112420. doi:10.1016/j.biopha.2021.112420
Feizollahi, P., Zamanian, M. H., Falahi, S., Salari, F., Mahmoudi, Z., Faryadi, E., et al. (2023). Association of ifih1 and ddx58 genes polymorphism with susceptibility to covid-19. Med. Microbiol. Immunol. 1–9, 221–229. doi:10.1007/s00430-023-00764-x
Flerlage, T., Boyd, D. F., Meliopoulos, V., Thomas, P. G., and Schultz-Cherry, S. (2021). Influenza virus and sars-cov-2: pathogenesis and host responses in the respiratory tract. Nat. Rev. Microbiol. 19, 425–441. doi:10.1038/s41579-021-00542-7
García-Campos, M. A., Espinal-Enríquez, J., and Hernández-Lemus, E. (2015). Pathway analysis: state of the art. Front. physiology 6, 383. doi:10.3389/fphys.2015.00383
Gill, R., Datta, S., and Datta, S. (2010). A statistical framework for differential network analysis from microarray data. BMC Bioinforma. 11, 95–10. doi:10.1186/1471-2105-11-95
Golberg, D. E. (1989). Genetic algorithms in search, optimization, and machine learning. United States: Addion wesley, 36.
Grimes, J. M., and Grimes, K. V. (2020). p38 mapk inhibition: a promising therapeutic approach for covid-19. J. Mol. Cell. Cardiol. 144, 63–65. doi:10.1016/j.yjmcc.2020.05.007
Grimes, T., Potter, S. S., and Datta, S. (2019). Integrating gene regulatory pathways into differential network analysis of gene expression data. Sci. Rep. 9, 5479. doi:10.1038/s41598-019-41918-3
Guo, Y., Esfahani, F., Shao, X., Srinivasan, V., Thomo, A., Xing, L., et al. (2022). Integrative covid-19 biological network inference with probabilistic core decomposition. Briefings Bioinforma. 23, bbab455. doi:10.1093/bib/bbab455
Habibi, M., Taheri, G., and Aghdam, R. (2021). A sars-cov-2 (covid-19) biological network to find targets for drug repurposing. Sci. Rep. 11, 9378. doi:10.1038/s41598-021-88427-w
Hammoudeh, S. M., Hammoudeh, A. M., Bhamidimarri, P. M., Mahboub, B., Halwani, R., Hamid, Q., et al. (2021). Insight into molecular mechanisms underlying hepatic dysfunction in severe covid-19 patients using systems biology. World J. Gastroenterology 27, 2850–2870. doi:10.3748/wjg.v27.i21.2850
Jančová, P., and Šiller, M. (2012). “Phase ii drug metabolism,” in Topics on drug metabolism, 35–60.
Jassal, B., Matthews, L., Viteri, G., Gong, C., Lorente, P., Fabregat, A., et al. (2020). The reactome pathway knowledgebase. Nucleic acids Res. 48, D498–D503. doi:10.1093/nar/gkz1031
Jerotic, D., Ranin, J., Bukumiric, Z., Djukic, T., Coric, V., Savic-Radojevic, A., et al. (2022). Sod2 rs4880 and gpx1 rs1050450 polymorphisms do not confer risk of covid-19, but influence inflammation or coagulation parameters in Serbian cohort. Redox Rep. 27, 85–91. doi:10.1080/13510002.2022.2057707
John, A. E., Joseph, C., Jenkins, G., and Tatler, A. L. (2021). Covid-19 and pulmonary fibrosis: a potential role for lung epithelial cells and fibroblasts. Immunol. Rev. 302, 228–240. doi:10.1111/imr.12977
Krüger, M., and Richter, P. (2022). To die or not to die: cell death in biology and disease. Int. J. Mol. Sci. 23, 6734. doi:10.3390/ijms23126734
La Rosée, F., Bremer, H., Gehrke, I., Kehr, A., Hochhaus, A., Birndt, S., et al. (2020). The janus kinase 1/2 inhibitor ruxolitinib in covid-19 with severe systemic hyperinflammation. Leukemia 34, 1805–1815. doi:10.1038/s41375-020-0891-0
Landles, C., and Bates, G. P. (2004). Huntingtin and the molecular pathogenesis of huntington’s disease: fourth in molecular medicine review series. EMBO Rep. 5, 958–963. doi:10.1038/sj.embor.7400250
Li, H., Xiang, X., Ren, H., Xu, L., Zhao, L., Chen, X., et al. (2020). Serum amyloid a is a biomarker of severe coronavirus disease and poor prognosis. J. Infect. 80, 646–655. doi:10.1016/j.jinf.2020.03.035
Li, X., Zhang, Z., Wang, Z., Gutierrez-Castrellon, P., and Shi, H. (2022). Cell deaths: involvement in the pathogenesis and intervention therapy of covid-19. Signal Transduct. Target. Ther. 7, 186. doi:10.1038/s41392-022-01043-6
Liang, Y., Li, H., Li, J., Yang, Z.-N., Li, J.-L., Zheng, H.-W., et al. (2020). Role of neutrophil chemoattractant cxcl5 in sars-cov-2 infection-induced lung inflammatory innate immune response in an in vivo hace2 transfection mouse model. Zoological Res. 41, 621–631. doi:10.24272/j.issn.2095-8137.2020.118
Liu, Z., Ting, S., and Zhuang, X. (2021). Covid-19, circadian rhythms and sleep: from virology to chronobiology. Interface Focus 11, 20210043. doi:10.1098/rsfs.2021.0043
Lou, F., Long, H., Luo, S., Liu, Y., Pu, J., Wang, H., et al. (2023). Chronic restraint stress promotes the tumorigenic potential of oral squamous cell carcinoma cells by reprogramming fatty acid metabolism via cxcl3 mediated wnt/β-catenin pathway. Exp. Neurol. 359, 114268. doi:10.1016/j.expneurol.2022.114268
Love, M. I., Huber, W., and Anders, S. (2014). Moderated estimation of fold change and dispersion for rna-seq data with deseq2. Genome Biol. 15, 550. doi:10.1186/s13059-014-0550-8
Lu, X., Jain, V. V., Finn, P. W., and Perkins, D. L. (2007). Hubs in biological interaction networks exhibit low changes in expression in experimental asthma. Mol. Syst. Biol. 3, 98. doi:10.1038/msb4100138
Luo, Q., Zhu, H., Li, Y., Wu, Q., Sun, J., and Zhou, F. (2022). Expression analysis of birc3 as one target gene of transcription factor nf-κb for esophageal cancer. Processes 10, 1673. doi:10.3390/pr10091673
MacFarlane, M., and Williams, A. C. (2004). Apoptosis and disease: a life or death decision: conference and workshop on apoptosis and disease. EMBO Rep. 5, 674–678. doi:10.1038/sj.embor.7400191
Malle, E., Sodin-Semrl, S., and Kovacevic, A. (2009). Serum amyloid a: an acute-phase protein involved in tumour pathogenesis. Cell. Mol. life Sci. 66, 9–26. doi:10.1007/s00018-008-8321-x
Mead, A. (1992). Review of the development of multidimensional scaling methods. J. R. Stat. Soc. Ser. D (The Statistician) 41, 27–39. doi:10.2307/2348634
Mehta, P., McAuley, D. F., Brown, M., Sanchez, E., Tattersall, R. S., Manson, J. J., et al. (2020). Covid-19: consider cytokine storm syndromes and immunosuppression. The lancet 395, 1033–1034. doi:10.1016/S0140-6736(20)30628-0
Menon, R., Otto, E. A., Sealfon, R., Nair, V., Wong, A. K., Theesfeld, C. L., et al. (2020). Sars-cov-2 receptor networks in diabetic and covid-19–associated kidney disease. Kidney international 98, 1502–1518. doi:10.1016/j.kint.2020.09.015
Michael, P., Brabant, D., Bleiblo, F., Ramana, C. V., Rutherford, M., Khurana, S., et al. (2013). Influenza a induced cellular signal transduction pathways. Journal of thoracic disease 5, S132–S141. doi:10.3978/j.issn.2072-1439.2013.07.42
Mitra, K., Carvunis, A.-R., Ramesh, S. K., and Ideker, T. (2013). Integrative approaches for finding modular structure in biological networks. Nature Reviews Genetics 14, 719–732. doi:10.1038/nrg3552
Nain, Z., Barman, S. K., Sheam, M. M., Syed, S. B., Samad, A., Quinn, J. M., et al. (2021). Transcriptomic studies revealed pathophysiological impact of covid-19 to predominant health conditions. Briefings in Bioinformatics 22, bbab197. doi:10.1093/bib/bbab197
Nunnari, G., Sanfilippo, C., Castrogiovanni, P., Imbesi, R., Volti, G. L., Barbagallo, I., et al. (2020). Network perturbation analysis in human bronchial epithelial cells following sars-cov2 infection. Experimental Cell. research 395, 112204. doi:10.1016/j.yexcr.2020.112204
Ogata, H., Goto, S., Sato, K., Fujibuchi, W., Bono, H., and Kanehisa, M. (1999). Kegg: kyoto Encyclopedia of genes and Genomes. Nucleic Acids Research 27, 29–34. doi:10.1093/nar/27.1.29
Pihur, V., Datta, S., and Datta, S. (2009). Rankaggreg, an r package for weighted rank aggregation. BMC bioinformatics 10, 62–10. doi:10.1186/1471-2105-10-62
Prompetchara, E., Ketloy, C., and Palaga, T. (2020). Immune responses in covid-19 and potential vaccines: lessons learned from sars and mers epidemic. Asian Pacific journal of allergy and immunology 38, 1–9. doi:10.12932/AP-200220-0772
Pustake, M., Tambolkar, I., Giri, P., and Gandhi, C. (2022). Sars, mers and covid-19: an overview and comparison of clinical, laboratory and radiological features. Journal of Family Medicine and Primary Care 11, 10–17. doi:10.4103/jfmpc.jfmpc_839_21
Qin, C., Rao, Y., Yuan, H., Wang, T.-Y., Zhao, J., Espinosa, B., et al. (2022). Sars-cov-2 couples evasion of inflammatory response to activated nucleotide synthesis. Proceedings of the National Academy of Sciences 119, e2122897119. doi:10.1073/pnas.2122897119
Rahman, M. H., Rana, H. K., Peng, S., Kibria, M. G., Islam, M. Z., Mahmud, S. H., et al. (2021). Bioinformatics and system biology approaches to identify pathophysiological impact of covid-19 to the progression and severity of neurological diseases. Computers in biology and medicine 138, 104859. doi:10.1016/j.compbiomed.2021.104859
Rayner, R. E., Makena, P., Prasad, G. L., and Cormet-Boyaka, E. (2019). Optimization of normal human bronchial epithelial (nhbe) cell 3d cultures for in vitro lung model studies. Scientific reports 9, 500. doi:10.1038/s41598-018-36735-z
Rebendenne, A., Chaves Valadão, A. L., Tauziet, M., Maarifi, G., Bonaventure, B., McKellar, J., et al. (2021). Sars-cov-2 triggers an mda-5-dependent interferon response which is unable to control replication in lung epithelial cells. Journal of virology 95, e02415–e02420. doi:10.1128/jvi.02415-20
Ritchie, M. E., Phipson, B., Wu, D., Hu, Y., Law, C. W., Shi, W., et al. (2015). Limma powers differential expression analyses for rna-sequencing and microarray studies. Nucleic acids research 43, e47. doi:10.1093/nar/gkv007
Robinson, M. D., McCarthy, D. J., and Smyth, G. K. (2010). edger: a bioconductor package for differential expression analysis of digital gene expression data. bioinformatics 26, 139–140. doi:10.1093/bioinformatics/btp616
Samavati, L., and Uhal, B. D. (2020). Ace2, much more than just a receptor for sars-cov-2. Frontiers in cellular and infection microbiology 317, 317. doi:10.3389/fcimb.2020.00317
Sanz-Ezquerro, J., Munsterberg, A., and Stricker, S. (2017). Editorial: signaling pathways in embryonic development. front Cell. dev biol 5, 76. doi:10.3389/fcell.2017.00076
Shanshal, M., and Ahmed, H. S. (2021). Covid-19 and herpes simplex virus infection: a cross-sectional study. Cureus 13, e18022. doi:10.7759/cureus.18022
Shorning, B. Y., Dass, M. S., Smalley, M. J., and Pearson, H. B. (2020). The pi3k-akt-mtor pathway and prostate cancer: at the crossroads of ar, mapk, and wnt signaling. International Journal of Molecular Sciences 21, 4507. doi:10.3390/ijms21124507
Steiner, I., and Benninger, F. (2013). Update on herpes virus infections of the nervous system. Current neurology and neuroscience reports 13, 414–417. doi:10.1007/s11910-013-0414-8
Stewart, C. A., Gay, C. M., Ramkumar, K., Cargill, K. R., Cardnell, R. J., Nilsson, M. B., et al. (2021). Lung cancer models reveal sars-cov-2-induced emt contributes to covid-19 pathophysiology. BioRxiv, 122291. doi:10.1101/2020.05.28.122291
Takahashi, J. S. (2017). Transcriptional architecture of the mammalian circadian clock. Nature Reviews Genetics 18, 164–179. doi:10.1038/nrg.2016.150
Takayanagi, H. (2009). Osteoimmunology and the effects of the immune system on bone. Nature Reviews Rheumatology 5, 667–676. doi:10.1038/nrrheum.2009.217
Tanner, J. E., and Alfieri, C. (2021). The fatty acid lipid metabolism nexus in covid-19. Viruses 13, 90. doi:10.3390/v13010090
Tarca, A. L., Draghici, S., Khatri, P., Hassan, S. S., Mittal, P., Kim, J.-s., et al. (2009). A novel signaling pathway impact analysis. Bioinformatics 25, 75–82. doi:10.1093/bioinformatics/btn577
Turner, M. D., Nedjai, B., Hurst, T., and Pennington, D. J. (2014). Cytokines and chemokines: at the crossroads of cell signalling and inflammatory disease. Biochimica et Biophysica Acta (BBA)-Molecular Cell. Research 1843, 2563–2582. doi:10.1016/j.bbamcr.2014.05.014
Vance, D. E., and Vance, J. E. (1996). Biochemistry of lipids, lipoproteins and membranes. Elsevier.
Varga-Szabo, D., Braun, A., and Nieswandt, B. (2009). Calcium signaling in platelets. Journal of Thrombosis and Haemostasis 7, 1057–1066. doi:10.1111/j.1538-7836.2009.03455.x
Vishnubalaji, R., Shaath, H., and Alajez, N. M. (2020). Protein coding and long noncoding rna (lncrna) transcriptional landscape in sars-cov-2 infected bronchial epithelial cells highlight a role for interferon and inflammatory response. Genes. 11, 760. doi:10.3390/genes11070760
Wang, J., Guo, C., Wei, Z., He, X., Kou, J., Zhou, E., et al. (2016). Morin suppresses inflammatory cytokine expression by downregulation of nuclear factor-κb and mitogen-activated protein kinase (mapk) signaling pathways in lipopolysaccharide-stimulated primary bovine mammary epithelial cells. Journal of dairy science 99, 3016–3027. doi:10.1016/j.celrep.2016.08.018
Welin, M., and Nordlund, P. (2010). Understanding specificity in metabolic pathways—Structural biology of human nucleotide metabolism. Biochemical and Biophysical Research Communications 396, 157–163. doi:10.1016/j.bbrc.2010.04.054
Wilkinson, L., and Friendly, M. (2009). The history of the cluster heat map. The American Statistician 63, 179–184. doi:10.1198/tas.2009.0033
Wu, Y.-H., Yeh, I.-J., Phan, N. N., Yen, M.-C., Liu, H.-L., Wang, C.-Y., et al. (2021). Severe acute respiratory syndrome coronavirus (sars-cov)-2 infection induces dysregulation of immunity: in silico gene expression analysis. International journal of medical sciences 18, 1143–1152. doi:10.7150/ijms.52256
Yang, S., Wu, S., Yu, Z., Huang, J., Zhong, X., Liu, X., et al. (2020). Transcriptomic analysis reveals novel mechanisms of sars-cov-2 infection in human lung cells. Immunity, Inflammation and Disease 8, 753–762. doi:10.1002/iid3.366
Yoneyama, M., and Fujita, T. (2007). Function of rig-i-like receptors in antiviral innate immunity. Journal of Biological Chemistry 282, 15315–15318. doi:10.1074/jbc.R700007200
Zamani, B., Najafizadeh, M., Motedayyen, H., and Arefnezhad, R. (2022). Predicting roles of il-27 and il-32 in determining the severity and outcome of covid-19. International Journal of Immunopathology and Pharmacology 36, 03946320221145827. doi:10.1177/03946320221145827
Zamanian-Azodi, M., Arjmand, B., Razzaghi, M., Tavirani, M. R., Ahmadzadeh, A., and Rostaminejad, M. (2021). Platelet and haemostasis are the main targets in severe cases of covid-19 infection; a system biology study. Archives of Academic Emergency Medicine 9, e27. doi:10.22037/aaem.v9i1.1108
Zhang, W., and Liu, H. T. (2002). Mapk signal pathways in the regulation of cell proliferation in mammalian cells. Cell. research 12, 9–18. doi:10.1038/sj.cr.7290105
Zhang, Q., Xiang, R., Huo, S., Zhou, Y., Jiang, S., Wang, Q., et al. (2021a). Molecular mechanism of interaction between sars-cov-2 and host cells and interventional therapy. Signal transduction and targeted therapy 6, 233. doi:10.1038/s41392-021-00653-w
Zhang, Y., Guo, R., Kim, S. H., Shah, H., Zhang, S., Liang, J. H., et al. (2021b). Sars-cov-2 hijacks folate and one-carbon metabolism for viral replication. Nature communications 12, 1676. doi:10.1038/s41467-021-21903-z
Zinellu, A., and Mangoni, A. A. (2021). Serum complement c3 and c4 and covid-19 severity and mortality: a systematic review and meta-analysis with meta-regression. Frontiers in immunology 12, 696085. doi:10.3389/fimmu.2021.696085
Keywords: SARS-CoV-2, COVID-19, RNA-seq, lung cell lines, differential expression analysis, pathway analysis, differential network analysis
Citation: Zhang X, Ahn S, Qiu P and Datta S (2023) Identification of shared biological features in four different lung cell lines infected with SARS-CoV-2 virus through RNA-seq analysis. Front. Genet. 14:1235927. doi: 10.3389/fgene.2023.1235927
Received: 06 June 2023; Accepted: 02 August 2023;
Published: 16 August 2023.
Edited by:
Paweł P. Łabaj, Jagiellonian University, PolandReviewed by:
Yilu Zhou, University of Southampton, United KingdomYuling Han, Cornell University, United States
Copyright © 2023 Zhang, Ahn, Qiu and Datta. This is an open-access article distributed under the terms of the Creative Commons Attribution License (CC BY). The use, distribution or reproduction in other forums is permitted, provided the original author(s) and the copyright owner(s) are credited and that the original publication in this journal is cited, in accordance with accepted academic practice. No use, distribution or reproduction is permitted which does not comply with these terms.
*Correspondence: Somnath Datta, c29tbmF0aC5kYXR0YUB1ZmwuZWR1