 Lirong Zhu
 Shuanglin Zhang
 Qiuying Sha
- Department of Mathematical Sciences, Michigan Technological University, Houghton, MI, United States
Genome-wide association studies (GWAS) have emerged as popular tools for identifying genetic variants that are associated with complex diseases. Standard analysis of a GWAS involves assessing the association between each variant and a disease. However, this approach suffers from limited reproducibility and difficulties in detecting multi-variant and pleiotropic effects. Although joint analysis of multiple phenotypes for GWAS can identify and interpret pleiotropic loci which are essential to understand pleiotropy in diseases and complex traits, most of the multiple phenotype association tests are designed for a single variant, resulting in much lower power, especially when their effect sizes are small and only their cumulative effect is associated with multiple phenotypes. To overcome these limitations, set-based multiple phenotype association tests have been developed to enhance statistical power and facilitate the identification and interpretation of pleiotropic regions. In this research, we propose a new method, named Meta-TOW-S, which conducts joint association tests between multiple phenotypes and a set of variants (such as variants in a gene) utilizing GWAS summary statistics from different cohorts. Our approach applies the set-based method that Tests for the effect of an Optimal Weighted combination of variants in a gene (TOW) and accounts for sample size differences across GWAS cohorts by employing the Cauchy combination method. Meta-TOW-S combines the advantages of set-based tests and multi-phenotype association tests, exhibiting computational efficiency and enabling analysis across multiple phenotypes while accommodating overlapping samples from different GWAS cohorts. To assess the performance of Meta-TOW-S, we develop a phenotype simulator package that encompasses a comprehensive simulation scheme capable of modeling multiple phenotypes and multiple variants, including noise structures and diverse correlation patterns among phenotypes. Simulation studies validate that Meta-TOW-S maintains a desirable Type I error rate. Further simulation under different scenarios shows that Meta-TOW-S can improve power compared with other existing meta-analysis methods. When applied to four psychiatric disorders summary data, Meta-TOW-S detects a greater number of significant genes.
1 Introduction
Genome-wide association study (GWAS) is typically employed to identify an individual genetic variant associated with a specific phenotype. However, in cases where causal variants have weak effects on the trait and it is challenging to detect these variants, set-based tests are employed to identify the joint effects of multiple variants (multi-variants) on a particular phenotype (Lin et al., 2022; Huang et al., 2011; Liu et al., 2010; Neale and Sham, 2004). Compared to single-variant approaches, set-based tests can help to reduce the number of genome-wide association tests and are effective when a causal variant is unobserved or multiple causal variants are present (Lin et al., 2022). Consequently, set-based tests have been applied in gene-set analyses of common variants and rare variants (Liu et al., 2014). For instance, both weighted and unweighted burden tests have a good performance when variants in a gene affect a phenotype in the same direction (Morris and Zeggini, 2010). The sequence kernel association test (SKAT) is a score-based variance-component test that accommodates variants in a gene with opposite effects on a phenotype (Wu et al., 2011). However, the performance of the approaches mentioned above depends on the weighting scheme, such as the MAF-based weighting scheme that up-weights the contribution of rare variants and down-weights that of common variants. This weighting scheme may lead to a loss in power when common variants in the region are associated with the phenotype (Dutta et al., 2019b; Dutta et al., 2019a). The optimal strategy for grouping or weighting genetic variants depends on the unknown genetic architecture of each phenotype and each variant. TOW for Testing the effect of an Optimal Weighted combination of variants in a set is a powerful method to increase power by assigning optimal weights to genetic variants (Sha et al., 2012).
Many complex phenotypes are influenced by multiple genetic variants, each with a small effect size. Set-based tests that consider a single phenotype might not capture the collective effects of these variants, leading to reduced power. Alternatively, cross-phenotype tests that aggregate associations in multiple phenotypes can substantially improve power over single phenotype-based methods (Dutta et al., 2019b; Dutta et al., 2019a). Meta-analysis of multiple phenotypes, using GWAS summary statistics, is a practical approach to increase power by increasing sample sizes and aggregating variants with small effect sizes to detect more significant pleiotropic genes (Cirulli et al., 2020; Panagiotou et al., 2013). Detecting the pleiotropic genes can provide insights into biological mechanisms influencing complex human phenotypes. The challenge in meta-analysis is that there is no uniformly most powerful (UMP) test. The power depends on signal directions and between-phenotype correlation. To boost analysis power, several methods have been proposed for GWAS multiple phenotype analysis. For instance, Fisher’s method of combining independent p-values has been extended to dependent univariate tests (Li et al., 2014). However, the p-value approximations of these tests are not accurate for small significance levels often required by GWASs. The minimum of the p-values (MinP) of multiple phenotypes has been proposed as a testing statistic (Conneely and Boehnke, 2007). And this test is powerful when a gene affects only a very small number of multiple phenotypes, but is less powerful in the presence of denser signals (Liu and Lin, 2018). The aggregated Cauchy association test (ACAT) is a flexible and computationally efficient p-value combination method that boosts power under various genetic architectures (Liu and Xie, 2019; Liu et al., 2019). Thus, in this article, we applied this approach to combine p-values of set-based tests from multiple cohort studies. Most importantly, the Cauchy combination is an extremely fast omnibus testing procedure that performs multiple testing adjustments analytically and applies to the combination of any tests (Li et al., 2023; Li et al., 2022; Li et al., 2020).
Meta-analysis is a promising approach to detecting a series of gene-phenotype associations that would have remained undetected by a participating cohort alone. In addition, a meta-analysis based on GWAS summary statistics simplifies data sharing, keeping sensitive individual data at the cohort level and sharing only non-sensitive summary data (Lin et al., 2022). For instance, Meta-MultiSKAT performs a variance component test and uses summary statistics to test for association between multiple continuous phenotypes and variants in a region. However, the p-value calculation of Meta-MultiSKAT relies on the normality assumption of the score vector and this assumption may be violated in the meta-analysis (Dutta et al., 2019b; Dutta et al., 2019a). MetaUSAT is a novel unified association test of multiple traits with only a single genetic variant, and the test statistic is dominated by a predefined parameter weight (Ray and Boehnke, 2018). In the cross meta-analysis, the overlapping subjects can induce a correlation between the summary statistics and inflate the false discovery rate of meta-analyses. Method FOLD is proposed to account for overlapping subjects at the summary statistics level using a split prior which categorizes subjects based on their contributions to the final statistic (Kim et al., 2017). However, it is designed for qualitative phenotypes and is difficult to obtain splitting prior if the numbers of cases and controls in any of the GWAS cohorts are missing. Here we propose a new approach, Meta-TOW-S, which conducts joint association tests between multiple phenotypes and genetic variants within a gene, utilizing GWAS summary statistics from diverse GWAS. Our approach applies set-based tests using an optimal weighted combination of variants and accounts for sample size differences across different GWAS by employing the Cauchy combination method. Meta-TOW-S combines the advantages of set-based tests and multi-phenotype modeling, exhibiting computational efficiency and enabling analysis across multiple phenotypes while accommodating overlapping samples from different cohorts.
To evaluate the performance of Meta-TOW-S, we need to mimic GWAS summary data from different cohorts. Thus, we also develop a phenotype simulator package that encompasses a comprehensive simulation scheme capable of modeling multiple phenotypes with multiple underlying genetic loci, intricate noise structures, and diverse correlation patterns among the phenotypes. The R package for the phenotype simulator is available on GitHub (https://github.com/Julia-lirong/PheGen). Furthermore, we evaluate the performance of our method using simulation studies and compare the power of our method with the power of three existing methods which integrate Burden (Morris and Zeggini, 2010), SKAT (Wu et al., 2011), and VEGAS (Liu et al., 2010) with Cauchy combination (Liu and Xie, 2019) to detect pleiotropic effects. Our simulation studies validate that Meta-TOW-S maintains a desirable Type I error rate and enhances power across various simulation scenarios compared with other existing meta-analysis methods. We also apply Meta-TOW-S to four psychiatric disorders summary data which are available from the Psychiatric Genomics Consortium (PGC) (Sullivan et al., 2018). The real data analyses demonstrate that Meta-TOW-S outperforms other comparison methods by detecting a greater number of significant genes.
2 Materials and methods
Consider
2.1 Meta-TOW-S
For the
Inspired by the idea proposed in this project (Svishcheva et al., 2019), Yan (2022) rewrite the test statistic
Consider
2.2 Comparison with other set-based association tests
Versatile set-based association study (VEGAS): For a specific region with
SKAT and Burden: For the
Let
3 Simulation studies
3.1 Phenotype simulator
Suppose we have
Next, to generate genotypes for individuals in a cohort, we employ the calibration coalescent model (COSI) to generate 10,000 haplotypes for a region of approximately 200 kbps, mimicking the LD structure found in individuals of European ancestry (He et al., 2017). We randomly select regions of 10 kbps in length, which encompass approximately 100 genetic variants, and utilize the simulated haplotypes to create genotypes for the variant sets. Among these genetic variants, we specifically designate 10% as causal variants, comprising 60% rare variants and 40% common variants, respectively. Subsequently, we generate the genetic component
3.2 Simulation
To set up a multi-cohort scenario, we generated individuals for multiple cohorts with different sample sizes but the same overlapping sample size for simplicity. To achieve a normally distributed input for the association test between gene and phenotype within each cohort, a rank-based inverse-normal transformation to the residuals of each phenotype was performed. In simulations, we access the performance of Meta-TOW-S with compared methods Meta-Vegas, Meta-Burden, and Meta-SKAT. We design different patterns of phenotypes by varying the correlation of phenotypes, sample sizes, and overlapping samples.
4 Results
4.1 Type I error rates
To evaluate the Type I error rates of Meta-TOW-S, we first simulate
For Type I error evaluations, we use the significance levels
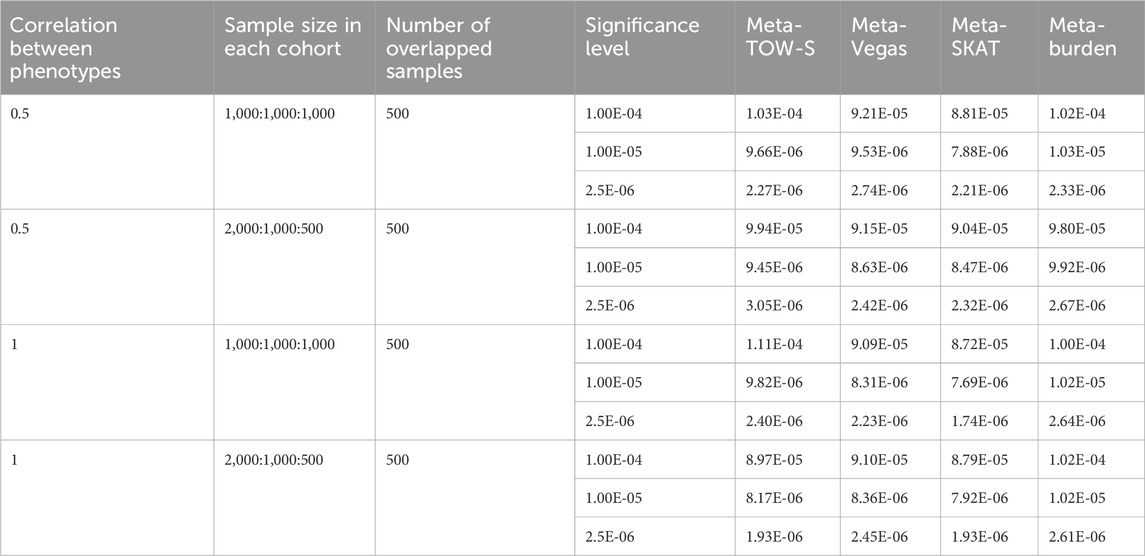
Table 1. Type I error estimates of the four tests. Each entry represents the Type I error rate estimated by the proportions of p-values less than α with
4.2 Power comparisons
We compare the empirical power of Meta-TOW-S with Meta-Vegas, Meta-SKAT, and Meta-Burden. The power is defined as the proportion of test statistics with p-values less than the nominal significance level and we evaluate power at the nominal significance level
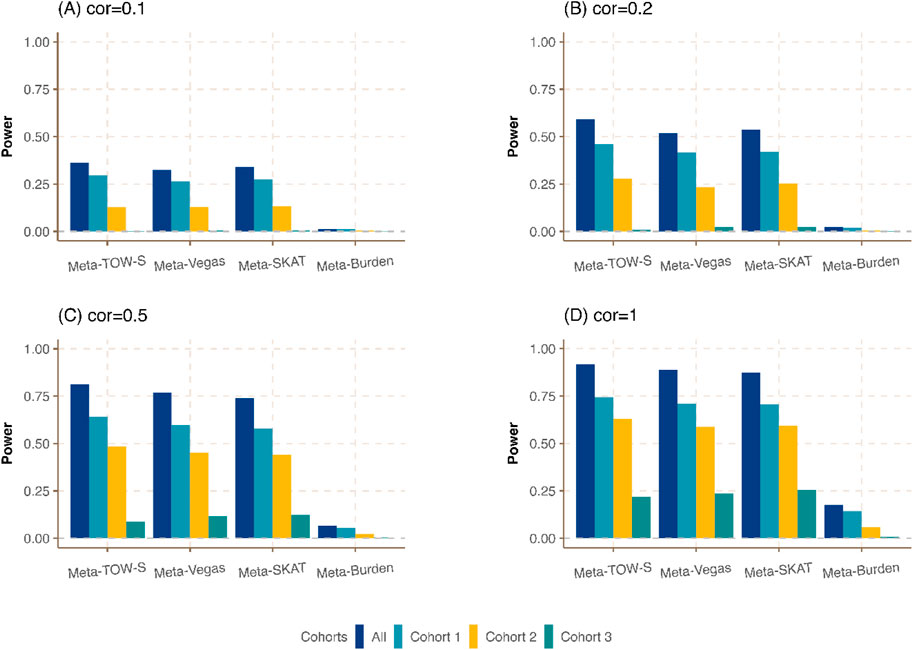
Figure 1. Power comparison of Meta-TOW-S, Meta-Vegas, Meta-SKAT, and Meta-Burden with single phenotype-based set-level tests at the significance level
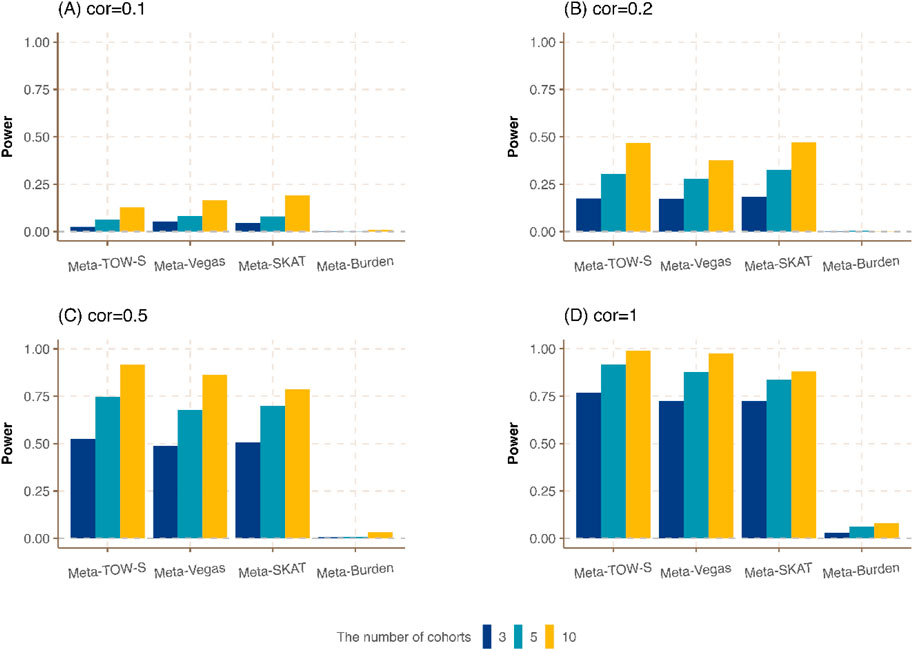
Figure 2. Power comparison of meta-analysis with different numbers of cohorts.
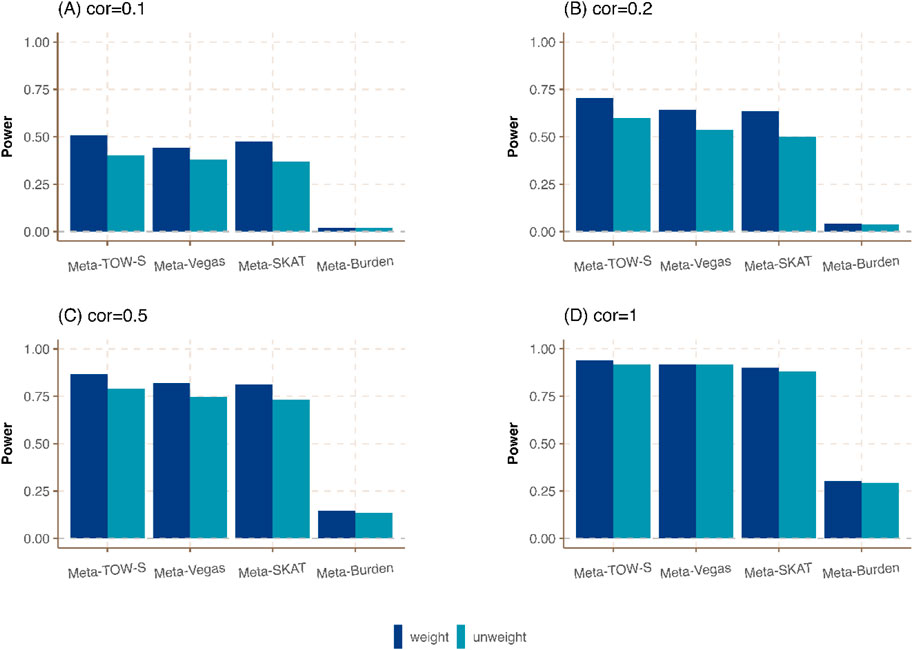
Figure 3. Power comparison of meta-analysis in the presence of weighting and unweighting scheme in Cauchy combination. Three phenotypes from three cohorts are generated. The sample sizes of these three cohorts are
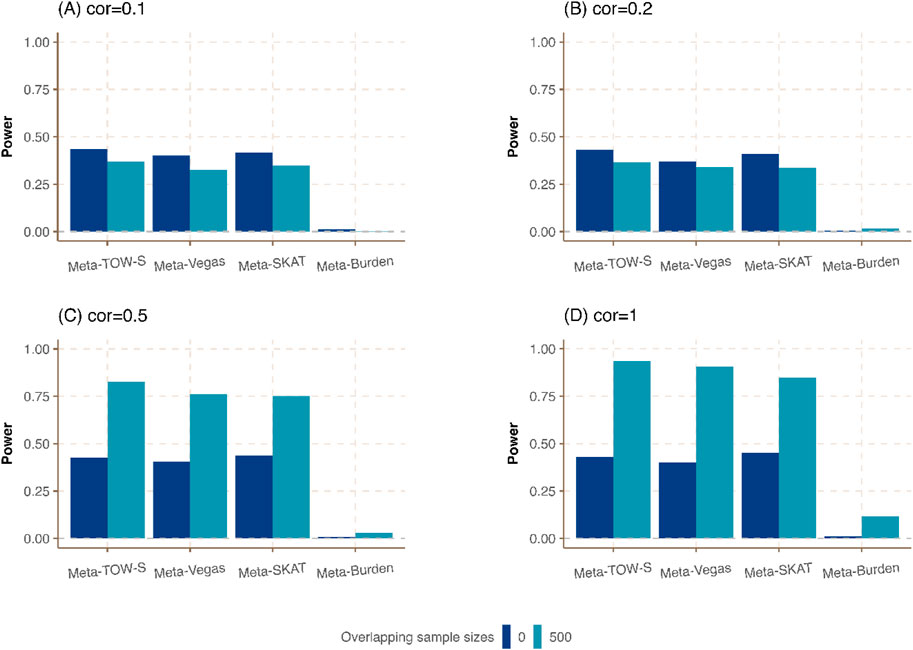
Figure 4. Power comparison of meta-analysis in the presence of the same sample size in each cohort but different overlapping individuals. The sample size of each cohort is
We first compare the meta-analysis with single phenotype-based set-level tests. It shows that the integration of different cohorts to detect the genetic variants in a region associated with at least one phenotype could boost power (Figure 1; Supplementary Figure S1). Our proposed Meta-TOW-S has slightly better performance compared with Meta-Vegas, and Meta-SKAT, and is better performed than Meta-Burden since the Burden-based method has poor performance if the effects of causal variants are in different directions. We also found the increase in correlation between pairs of phenotypes will boost power as well, indicating that the integration of phenotypes will benefit to detect more pleiotropic genes.
Next, we vary the number of cohorts where each cohort has the same sample size
In Meta-TOW-S, Meta-Vegas, Meta-SKAT, and Meta-Burden, more weight is assigned to a large study, and a small weight is assigned to a small study in the Cauchy combination. We compare those four methods with the unweighting scheme where the weight is the same among all studies in the Cauchy combination. Figure 3; Supplementary Figure S3 shows that the weighting scheme-based meta-analysis has a higher power compared with an unweighting scheme. Specifically, when the correlation between any pair of phenotypes is low, the weighting scheme meta-analysis exhibits significantly enhanced statistical power. Conversely, when the correlation between any pair of phenotypes is high, there is only a slight improvement in power. It indicates that the weighting scheme has a slight improvement when the genetic effect contributes to all three studies equivalently if the phenotype correlation is
Last, we consider the situation in which the sample sizes are the same in each cohort but different proportions of overlapping individuals are shared among all cohorts. As expected in Figure 4; Supplementary Figure S4, Meta-TOW-S outperforms the other three methods, and Meta-Vegas and Meta-SKAT have comparable performance. It shows that the power is further improved when there are larger overlapping samples between studies if phenotypes are highly correlated, which could be attributed to reduced heterogeneity across cohorts.
4.3 Real data analysis
We apply these four methods to GWAS summary statistics for four psychiatric disorders available from the Psychiatric Genomics Consortium (PGC) (Sullivan et al., 2018). These phenotypes are attention-deficit/hyperactivity disorder (ADHD), autism spectrum disorder (ASD), bipolar disorder (BD), and schizophrenia (SCZ) (Zhang et al., 2021). The sample sizes for these four traits range from
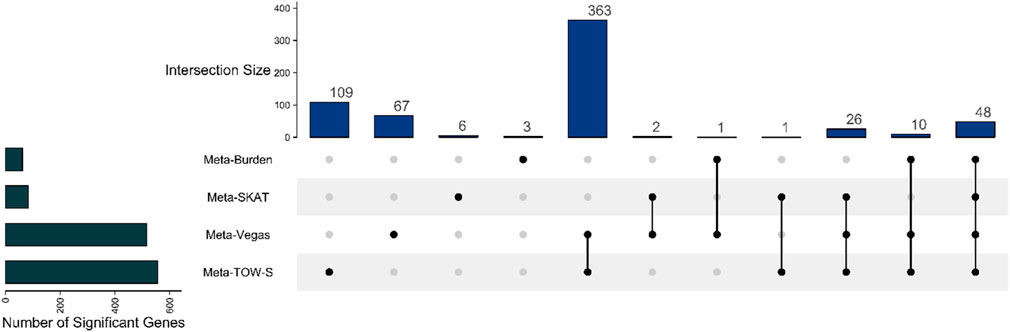
Figure 5. Upset plot showing the number of overlapping detected genes between Meta-TOW-S, Meta-Vegas, Meta-SKAT, and Meta-Burden.
4.4 Enrichment analysis
We implement the Gene Set Enrichment Analysis (GSEA) to analyze the significant genes identified by Meta-TOW-S that are enriched toward the top list of genes that are associated with specific biological pathways, processes, functions, or diseases (Subramanian et al., 2005). Gene Ontology (GO) is a community-based bioinformatics resource that employs ontologies to represent biological knowledge and describes information about gene and gene product information (Peng et al., 2017). Go is widely used to infer functional information for gene products, such as gene function enrichment, protein function prediction, and disease association analysis. And Go contains three categories: cellular component (CC), molecular function (MF: the biological function of the gene), and biological process (BP: pathways or larger processes that multiple gene products are involved in). KEGG (Kyoto Encyclopedia of Genes and Genomes) is a database resource for understanding high-level functions and utilities of the biological system. KEGG is used to search for the pathways associated with the identified genes. Detection of KEGG pathway database over-representation against a universal Homo Sapien background is assessed by hypergeometric tests (Solomon et al., 2022; Kanehisa et al., 2016). DisGeNET is an integrative and comprehensive resource of gene-disease associations from several public data sources and the literature (Piñero et al., 2015; Yu et al., 2014). It contains gene-disease associations and variant-gene-disease associations. The disease enrichment analysis is used to assess whether the genes associated with multiple phenotypes in meta-analysis are overrepresented in specific gene sets. A Bonferroni corrected cutoff of 0.05 was used for the significance of the pathway and disease. For genes annotation, we employed the org.Hs.e.g.,.db package in R. This package offers an extensive set of annotations for the human genome, including mappings between different gene identifiers and detailed genomic features.
We use the 557 significant genes identified by Meta-TOW-S, which are associated with four psychiatric disorders, for the enrichment analysis. We perform enrichment analyses at two different levels: pathways and diseases (Figures 6 and 7; Supplementary Figure S5). The top 20 enriched KEGG pathways are summarised in Figure 6 with results sorted from lowest to highest p-values. Of the 280 KEGG pathways tested, 37 were statistically significant after adjusting for multiple testing. The top KEGG pathways predominantly belong to groups associated with Human T-cell Leukemia virus 1 infection, Epstein-Barr virus infection, Antigen processing and presentation, etc. In the disease enrichment analysis, of the 5,496 disease tests, 455 had Bonferroni-corrected enrichment p-values lower than 0.05. The implicated genes are involved in Child Development Disorders Pervasive, Myasthenia Gravis, Vitiligo, Sarcoidosis, etc. (Figure 7).
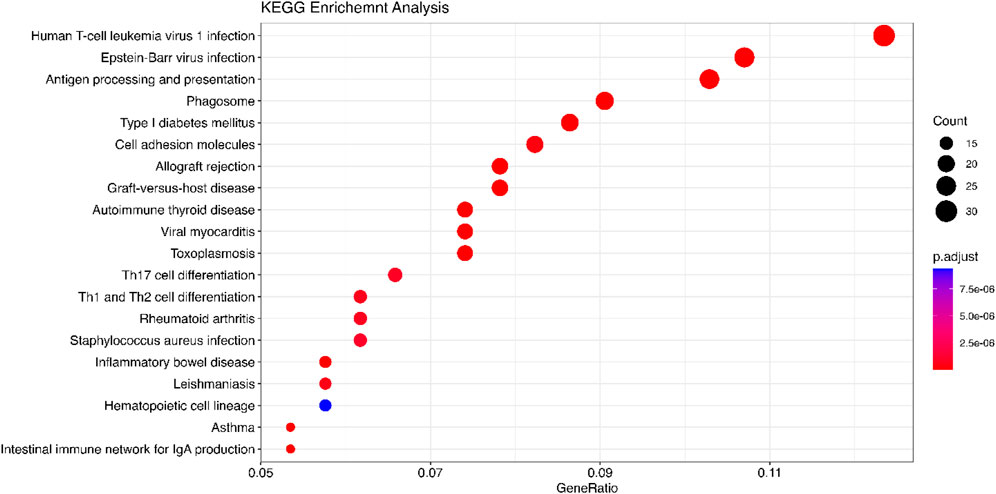
Figure 6. KEGG analysis is performed using the DOSE package. The significant genes are detected by Meta-TOW-S. The size of the circles represents the number of differential genes in a pathway. GeneRatio is the ratio of the number of differentially expressed genes annotated in a pathway to the number of all genes annotated in these pathways.
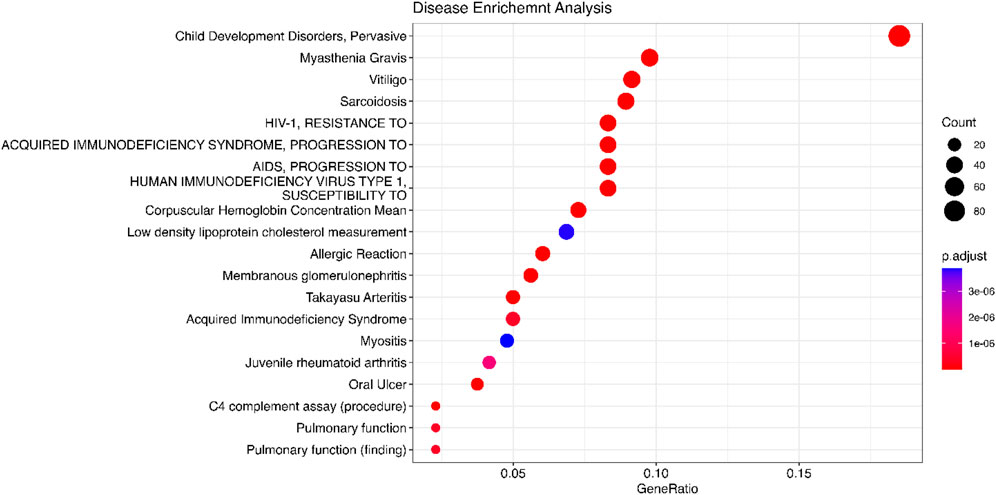
Figure 7. Disease enrichment analysis is performed using DisGeNET. The significant genes are detected by Meta-TOW-S.
5 Discussion
Much research suggests that many genes are associated with multiple correlated or even distinct phenotypes, and such associations have been termed cross-phenotype associations, which is relevant to pleiotropy in complex phenotypes (Li and Zhu, 2017). We propose a new method, Meta-TOW-S, which integrates association evidence of multiple phenotypes from study-specific GWAS summary statistics and thus detects the significant pleiotropic genes. This method Meta-TOW-S is based on the set-based test which uses the weights that maximize the score test statistic to increase power. To combine the test statistics from multiple GWAS cohorts, Meta-TOW-S uses the Cauchy combination by assigning more weight to a large GWAS to account for more biological information. In addition, Meta-TOW-S enables analysis across multiple phenotypes by accommodating overlapping samples from different cohorts.
To mimic real multiple comprehensive study-specific phenotypes, we develop a phenotype simulator that encompasses a simulation scheme capable of modeling multiple phenotypes with multiple underlying genetic loci, intricating noise structures, and different correlation patterns among the phenotypes with overlapped samples across different cohort studies. Our simulations show that the Type I error rates of Meta-TOW-S are well maintained under different conditions of phenotype correlation structures and overlapping samples and are more powerful than the other three comparison methods under most scenarios. We also find that the power of meta-analysis is significantly increased compared to the single phenotype set-based tests. A higher phenotype correlation, larger overlapping samples across multiple cohort studies, and more cohorts can increase power as well. We apply Meta-TOW-S to the summary statistics of four psychiatric disorders provided by the Psychiatric Genomics Consortium (PGC): attention-deficit/hyperactivity disorder (ADHD), autism spectrum disorder (ASD), bipolar disorder (BD), and schizophrenia (SCZ). As a result, 557 significant cross-phenotype associations are identified by Meta-TOW-S which is more than the number of genes identified by the other three methods. In the enrichment analysis, the gene sets of Child Development Disorders Pervasive are more enriched for genes associated with these four psychiatric disorders. In the KEGG pathway analysis, the significant genes identified by Meta-TOW-S showed notable enrichment in immune-related pathways rather than neurological processes. However, it is important to recognize that there is substantial evidence linking immune system involvement to neurological disorders. For instance, research has indicated that developmental disorders, such as Autism Spectrum Disorders (ASDs), can involve significant immune activity, including neuroinflammation, which plays a crucial role in the pathophysiology of these conditions (Vargas et al., 2005; Ashwood and Van de Water, 2004). Additionally, studies have demonstrated that elevated levels of regulatory T cells are associated with an increased risk of Attention-Deficit/Hyperactivity Disorder (ADHD) (Çetin et al., 2022), suggesting that immune dysregulation may contribute to the manifestation of neurological symptoms in certain contexts.
Meta-TOW-S has multiple advantages for identifying cross-phenotype associations. First of all, Meta-TOW-S can integrate information from multiple cohort studies to increase power and has the potential to detect more pleiotropic genes. Secondly, the test statistic has a standard Cauchy distribution under the null hypothesis and greatly reduces the computing time. Thirdly, this method is based on GWAS summary statistics from different cohort studies and GWAS summary statistics are more accessible than individual-level phenotype and genotype data The last point is that Meta-TOW-S gives more weight to the study with a larger sample size. Meanwhile, the developed phenotypes simulator can mimic complex structures in a meta-analysis which can be applied in other cross-phenotype analyses. However, Meta-TOW-S leverages information from correlated phenotypes to enhance its statistical power. Simulation results demonstrate that Meta-TOW-S surpasses other methods in power performance when phenotypic correlations are strong. However, when the correlation between phenotypes is weak, Meta-TOW-S may not outperform other methods, as it does not rely heavily on borrowing information from other phenotypes in such scenarios.
Currently, the framework of Meta-TOW-S needs to estimate the correlation matrix from a reference panel due to the unavailability of individual genotype data. However, the choice of the reference panel may influence the performance of Meta-TOW-S. The second challenge is that we use a correlation pruning procedure to ensure that the correlation matrix is fully ranked, which may drop some correlated variants in a gene.
In summary, the Meta-TOW-S method is a very useful method for detecting gene associations of multiple phenotypes from different GWAS cohorts. Meta-TOW-S has robust power and can handle different scenarios such as diverse phenotype correlation, and intricating cohort studies. The computational efficiency of Meta-TOW-S can also improve genetic discovery for hundreds of phenotypes across multiple GWAS cohorts in compliance with data privacy.
Data availability statement
The original contributions presented in the study are included in the article/Supplementary Material, further inquiries can be directed to the corresponding author.
Ethics statement
Ethical approval was not required for the study involving humans in accordance with the local legislation and institutional requirements. Written informed consent to participate in this study was not required from the participants or the participants’; legal guardians/next of kin in accordance with the national legislation and the institutional requirements.
Author contributions
LZ: Formal Analysis, Methodology, Writing–review and editing, Data curation, Writing–original draft. SZ: Formal Analysis, Methodology, Writing–original draft, Supervision. QS: Formal Analysis, Methodology, Writing–review and editing.
Funding
The author(s) declare that no financial support was received for the research, authorship, and/or publication of this article.
Acknowledgments
Part of this research has been conducted using the UK Biobank Resource under application number 102999 and the NHGRI-EBI GWAS Catalog.
Conflict of interest
The authors declare that the research was conducted in the absence of any commercial or financial relationships that could be construed as a potential conflict of interest.
Publisher’s note
All claims expressed in this article are solely those of the authors and do not necessarily represent those of their affiliated organizations, or those of the publisher, the editors and the reviewers. Any product that may be evaluated in this article, or claim that may be made by its manufacturer, is not guaranteed or endorsed by the publisher.
Supplementary material
The Supplementary Material for this article can be found online at: https://www.frontiersin.org/articles/10.3389/fgene.2024.1359591/full#supplementary-material
References
Ashwood, P., and Van de Water, J. (2004). Is autism an autoimmune disease? Autoimmun. Rev. 3, 557–562. doi:10.1016/j.autrev.2004.07.036
Çetin, F. H., UçaryıLMAZ, H., Uçar, H. N., Artaç, H., Güler, H. A., Duran, S. A., et al. (2022). Regulatory T cells in children with attention deficit hyperactivity disorder: a case-control study. J. Neuroimmunol. 367, 577848. doi:10.1016/j.jneuroim.2022.577848
Cirulli, E. T., White, S., Read, R. W., Elhanan, G., Metcalf, W. J., Tanudjaja, F., et al. (2020). Genome-wide rare variant analysis for thousands of phenotypes in over 70,000 exomes from two cohorts. Nat. Commun. 11, 542. doi:10.1038/s41467-020-14288-y
Conneely, K. N., and Boehnke, M. (2007). So many correlated tests, so little time! Rapid adjustment of P values for multiple correlated tests. Am. J. Hum. Genet. 81, 1158–1168. doi:10.1086/522036
Davies, R. B. (1980). Algorithm AS 155: the distribution of a linear combination of χ 2 random variables. J. R. Stat. Soc. Ser. C Appl. Statistics 29, 323–333. doi:10.2307/2346911
Demontis, D., Walters, R. K., Martin, J., Mattheisen, M., Als, T. D., Agerbo, E., et al. (2019). Discovery of the first genome-wide significant risk loci for attention deficit/hyperactivity disorder. Nat. Genet. 51, 63–75. doi:10.1038/s41588-018-0269-7
Dutta, D., Gagliano Taliun, S. A., Weinstock, J. S., Zawistowski, M., Sidore, C., Fritsche, L. G., et al. (2019a). Meta-MultiSKAT: multiple phenotype meta-analysis for region-based association test. Genet. Epidemiol. 43, 800–814. doi:10.1002/gepi.22248
Dutta, D., Scott, L., Boehnke, M., and Lee, S. (2019b). Multi-SKAT: general framework to test for rare-variant association with multiple phenotypes. Genet. Epidemiol. 43, 4–23. doi:10.1002/gepi.22156
Grove, J., Ripke, S., Als, T. D., Mattheisen, M., Walters, R. K., Won, H., et al. (2019). Identification of common genetic risk variants for autism spectrum disorder. Nat. Genet. 51, 431–444. doi:10.1038/s41588-019-0344-8
He, Z., Xu, B., Lee, S., and Ionita-Laza, I. (2017). Unified sequence-based association tests allowing for multiple functional annotations and meta-analysis of noncoding variation in metabochip data. Am. J. Hum. Genet. 101, 340–352. doi:10.1016/j.ajhg.2017.07.011
Huang, H., Chanda, P., Alonso, A., Bader, J. S., and Arking, D. E. (2011). Gene-based tests of association. PLoS Genet. 7, e1002177. doi:10.1371/journal.pgen.1002177
Kanehisa, M., Sato, Y., Kawashima, M., Furumichi, M., and Tanabe, M. (2016). KEGG as a reference resource for gene and protein annotation. Nucleic acids Res. 44, D457–D462. doi:10.1093/nar/gkv1070
Kim, E. E., Lee, S., Lee, C. H., Oh, H., Song, K., and Han, B. (2017). FOLD: a method to optimize power in meta-analysis of genetic association studies with overlapping subjects. Bioinformatics 33, 3947–3954. doi:10.1093/bioinformatics/btx463
Kuonen, D. (1999). Miscellanea. Saddlepoint approximations for distributions of quadratic forms in normal variables. Biometrika 86, 929–935. doi:10.1093/biomet/86.4.929
Lee, S., Abecasis, G. R., Boehnke, M., and Lin, X. (2014). Rare-variant association analysis: study designs and statistical tests. Am. J. Hum. Genet. 95, 5–23. doi:10.1016/j.ajhg.2014.06.009
Lee, S., Teslovich, T. M., Boehnke, M., and Lin, X. (2013). General framework for meta-analysis of rare variants in sequencing association studies. Am. J. Hum. Genet. 93, 42–53. doi:10.1016/j.ajhg.2013.05.010
Lin, A., Shadrin, A., Van der Meer, D., Hindley, G., Cheng, W., Sønderby, I. E., et al. (2022). Efficient meta-analysis of multivariate genome-wide association studies with Meta-MOSTest. bioRxiv.
Li, Q., Hu, J., Ding, J., and Zheng, G. (2014). Fisher's method of combining dependent statistics using generalizations of the gamma distribution with applications to genetic pleiotropic associations. Biostatistics 15, 284–295. doi:10.1093/biostatistics/kxt045
Liu, D. J., Peloso, G. M., Zhan, X., Holmen, O. L., Zawistowski, M., Feng, S., et al. (2014). Meta-analysis of gene-level tests for rare variant association. Nat. Genet. 46, 200–204. doi:10.1038/ng.2852
Liu, J. Z., Mcrae, A. F., Nyholt, D. R., Medland, S. E., Wray, N. R., Brown, K. M., et al. (2010). A versatile gene-based test for genome-wide association studies. Am. J. Hum. Genet. 87, 139–145. doi:10.1016/j.ajhg.2010.06.009
Liu, H., Tang, Y., and Zhang, H. H. (2009). A new chi-square approximation to the distribution of non-negative definite quadratic forms in non-central normal variables. Comput. Statistics & Data Analysis 53, 853–856. doi:10.1016/j.csda.2008.11.025
Liu, Y., Chen, S., Li, Z., Morrison, A. C., Boerwinkle, E., and Lin, X. (2019). ACAT: a fast and powerful p value combination method for rare-variant analysis in sequencing studies. Am. J. Hum. Genet. 104, 410–421. doi:10.1016/j.ajhg.2019.01.002
Liu, Y., and Xie, J. (2019). Cauchy combination test: a powerful test with analytic p-value calculation under arbitrary dependency structures. J. Am. Stat. Assoc. 115, 393–402. doi:10.1080/01621459.2018.1554485
Liu, Z., and Lin, X. (2018). Multiple phenotype association tests using summary statistics in genome-wide association studies. Biometrics 74, 165–175. doi:10.1111/biom.12735
Li, X., Li, Z., Zhou, H., Gaynor, S. M., Liu, Y., Chen, H., et al. (2020). Dynamic incorporation of multiple in silico functional annotations empowers rare variant association analysis of large whole-genome sequencing studies at scale. Nat. Genet. 52, 969–983. doi:10.1038/s41588-020-0676-4
Li, X., Quick, C., Zhou, H., Gaynor, S. M., Liu, Y., Chen, H., et al. (2023). Powerful, scalable and resource-efficient meta-analysis of rare variant associations in large whole genome sequencing studies. Nat. Genet. 55, 154–164. doi:10.1038/s41588-022-01225-6
Li, X., and Zhu, X. (2017). Cross-phenotype association analysis using summary statistics from GWAS. Stat. Hum. Genet. Methods Protoc. 1666, 455–467. doi:10.1007/978-1-4939-7274-6_22
Li, Z., Li, X., Zhou, H., Gaynor, S. M., Selvaraj, M. S., Arapoglou, T., et al. (2022). A framework for detecting noncoding rare-variant associations of large-scale whole-genome sequencing studies. Nat. methods 19, 1599–1611. doi:10.1038/s41592-022-01640-x
Morris, A. P., and Zeggini, E. (2010). An evaluation of statistical approaches to rare variant analysis in genetic association studies. Genet. Epidemiol. 34, 188–193. doi:10.1002/gepi.20450
Neale, B. M., and Sham, P. C. (2004). The future of association studies: gene-based analysis and replication. Am. J. Hum. Genet. 75, 353–362. doi:10.1086/423901
Panagiotou, O. A., Willer, C. J., Hirschhorn, J. N., and Ioannidis, J. P. (2013). The power of meta-analysis in genome-wide association studies. Annu. Rev. genomics Hum. Genet. 14, 441–465. doi:10.1146/annurev-genom-091212-153520
Pardiñas, A. F., Holmans, P., Pocklington, A. J., Escott-Price, V., Ripke, S., Carrera, N., et al. (2018). Common schizophrenia alleles are enriched in mutation-intolerant genes and in regions under strong background selection. Nat. Genet. 50, 381–389. doi:10.1038/s41588-018-0059-2
Peng, J., Wang, H., Lu, J., Hui, W., Wang, Y., and Shang, X. (2017). Identifying term relations cross different gene ontology categories. BMC Bioinforma. 18, 573–574. doi:10.1186/s12859-017-1959-3
Piñero, J., Queralt-Rosinach, N., Bravo, A., Deu-Pons, J., Bauer-Mehren, A., Baron, M., et al. (2015). DisGeNET: a discovery platform for the dynamical exploration of human diseases and their genes. Database 2015, bav028. doi:10.1093/database/bav028
Ray, D., and Boehnke, M. (2018). Methods for meta-analysis of multiple traits using GWAS summary statistics. Genet. Epidemiol. 42, 134–145. doi:10.1002/gepi.22105
Sha, Q., Wang, X., Wang, X., and Zhang, S. (2012). Detecting association of rare and common variants by testing an optimally weighted combination of variants. Genet. Epidemiol. 36, 561–571. doi:10.1002/gepi.21649
Solomon, O., Huen, K., Yousefi, P., Küpers, L. K., González, J. R., Suderman, M., et al. (2022). Meta-analysis of epigenome-wide association studies in newborns and children show widespread sex differences in blood DNA methylation. Mutat. Research/Reviews Mutat. Res. 789, 108415. doi:10.1016/j.mrrev.2022.108415
Stahl, E. A., Breen, G., Forstner, A. J., Mcquillin, A., Ripke, S., Trubetskoy, V., et al. (2019). Genome-wide association study identifies 30 loci associated with bipolar disorder. Nat. Genet. 51, 793–803. doi:10.1038/s41588-019-0397-8
Subramanian, A., Tamayo, P., Mootha, V. K., Mukherjee, S., Ebert, B. L., Gillette, M. A., et al. 2005. Gene set enrichment analysis: a knowledge-based approach for interpreting genome-wide expression profiles, Proc. Natl. Acad. Sci. U. S. A., 102, 15545–15550. doi:10.1073/pnas.0506580102
Sullivan, P. F., Agrawal, A., Bulik, C. M., Andreassen, O. A., Børglum, A. D., Breen, G., et al. (2018). Psychiatric genomics: an update and an agenda. Am. J. Psychiatry 175, 15–27. doi:10.1176/appi.ajp.2017.17030283
Svishcheva, G. R., Belonogova, N. M., Zorkoltseva, I. V., Kirichenko, A. V., and Axenovich, T. I. (2019). Gene-based association tests using GWAS summary statistics. Bioinformatics 35, 3701–3708. doi:10.1093/bioinformatics/btz172
Vargas, D. L., Nascimbene, C., Krishnan, C., Zimmerman, A. W., and Pardo, C. A. (2005). Neuroglial activation and neuroinflammation in the brain of patients with autism. Ann. Neurology Official J. Am. Neurological Assoc. Child Neurology Soc. 57, 67–81. doi:10.1002/ana.20315
Wu, M. C., Lee, S., Cai, T., Li, Y., Boehnke, M., and Lin, X. (2011). Rare-variant association testing for sequencing data with the sequence kernel association test. Am. J. Hum. Genet. 89, 82–93. doi:10.1016/j.ajhg.2011.05.029
Yan, S. (2022). Statistical methods for controlling population stratification and gene-based association studies. Michigan Technological University.
Yu, G., Wang, L.-G., Yan, G.-R., and He, Q.-Y. (2014). DOSE: an R/Bioconductor package for disease ontology semantic and enrichment analysis. Bioinformatics 31, 608–609. doi:10.1093/bioinformatics/btu684
Zhang, Y., Lu, Q., Ye, Y., Huang, K., Liu, W., Wu, Y., et al. (2021). SUPERGNOVA: local genetic correlation analysis reveals heterogeneous etiologic sharing of complex traits. Genome Biol. 22, 262–330. doi:10.1186/s13059-021-02478-w
Keywords: meta-analysis, joint analyses of multiple phenotypes, set-based association tests, GWAS summary statistics, phenotype simulator, multiple GWAS cohorts
Citation: Zhu L, Zhang S and Sha Q (2024) Meta-analysis of set-based multiple phenotype association test based on GWAS summary statistics from different cohorts. Front. Genet. 15:1359591. doi: 10.3389/fgene.2024.1359591
Received: 21 December 2023; Accepted: 23 August 2024;
Published: 05 September 2024.
Edited by:
Xihao Li, University of North Carolina at Chapel Hill, United StatesReviewed by:
Lin Hou, Tsinghua University, ChinaShibo Wang, University of California, Riverside, United States
Diptavo Dutta, National Cancer Institute (NIH), United States
Copyright © 2024 Zhu, Zhang and Sha. This is an open-access article distributed under the terms of the Creative Commons Attribution License (CC BY). The use, distribution or reproduction in other forums is permitted, provided the original author(s) and the copyright owner(s) are credited and that the original publication in this journal is cited, in accordance with accepted academic practice. No use, distribution or reproduction is permitted which does not comply with these terms.
*Correspondence: Qiuying Sha, cXNoYUBtdHUuZWR1