 Jinesh Patel1*
 Tom W. Allen2
 Blair Buckley3Pengyin Chen4
 Michael Clubb4
 Leandro A. Mozzoni5†Moldir Orazaly5
 Liliana Florez5
 David Moseley5†John C. Rupe6Bishnu K. Shrestha7Paul P. Price III7Brian M. Ward8†
 Jenny Koebernick1
- 1Department of Crop, Soil, and Environmental Sciences, Auburn University, Auburn, AL, United States
- 2Delta Research and Extension Center, Mississippi State University, Stoneville, MS, United States
- 3LSU AgCenter, Red River Research Station, Bossier City, LA, United States
- 4Fisher Delta Research Center, MO University of Missouri, Portageville, MO, United States
- 5Department of Crop, Soil, and Environmental Science, University of Arkansas, Fayetteville, AR, United States
- 6Department of Plant Pathology, University of Arkansas, Fayetteville, AR, United States
- 7LSU AgCenter, Macon Ridge Research Station, Winnsboro, LA, United States
- 8Department of Plant Pathology and Crop Physiology, LSU AgCenter, Baton Rouge, LA, United States
Cercospora leaf blight (CLB), caused by Cercospora cf. flagellaris, C. kikuchii, and C. cf. sigesbeckiae, is a significant soybean [Glycine max (L.) Merr.] disease in regions with hot and humid conditions causing yield loss in the United States and Canada. There is limited information regarding resistant soybean cultivars, and there have been marginal efforts to identify the genomic regions underlying resistance to CLB. A Genome-Wide Association Study was conducted using a diverse panel of 460 soybean accessions from maturity groups III to VII to identify the genomic regions associated to the CLB disease. These accessions were evaluated for CLB in different regions of the southeastern United States over 3 years. In total, the study identified 99 Single Nucleotide Polymorphism (SNPs) associated with the disease severity and 85 SNPs associated with disease incidence. Across multiple environments, 47 disease severity SNPs and 23 incidence SNPs were common. Candidate genes within 10 kb of these SNPs were involved in biotic and abiotic stress pathways. This information will contribute to the development of resistant soybean germplasm. Further research is warranted to study the effect of pyramiding desirable genomic regions and investigate the role of identified genes in soybean CLB resistance.
1 Introduction
Soybean is a major oil-producing crop grown around the world with biotic stresses restricting global production (Hartman et al., 2015). Some major yield reducing diseases in soybean include frogeye leaf spot (caused by Cercospora sojina Hara), Phytophthora root and stem rot (caused by Phytophthora sansomeana E. M. Hansen and P. sojae Kaufm. & Gerd.), Cercospora leaf blight [caused by Cercospora cf. flagellaris Ellis & G. Martin, C. kikuchii (Tak. Matsumoto & Tomoy) M.W. Gardner, C. cf. nicotianae, and C. cf. sigesbeckiae Katsuki], soybean cyst nematode (caused by Heterodera glycines Ichinohe), and charcoal rot [caused by Macrophomina phaseolina (Tassi) Goid.] (Wrather et al., 2010; Allen et al., 2018; Bandara et al., 2020; Bradley et al., 2021). Cercospora leaf blight (CLB) typically develops in the upper canopy, and can be observed on leaves, petioles, stems, and pods, progressing from the upper canopy downward through the plant canopy (Walters, 1980). In addition to CLB producing symptoms on all plant parts, purple seed stain (PSS) can occur on soybean kernels and is caused by the same group of organisms (Alloatti et al., 2015; Albu et al., 2016; Turner et al., 2020). Favorable environmental conditions, such as high relative humidity, prolonged dew period, and warm temperatures, influence the development of CLB (Schuh, 1992, Schuh, 1993). In general, CLB symptoms begin during reproductive stages generally during the beginning seed stage (R5) as purplish bronze-colored necrotic lesions on leaves that vary in size and elongated reddish-purple lesions on petioles (Chanda et al., 2014).
The yield losses that result from CLB are generally related to the severity of disease in the field. Numerous lesions on the leaves can result in heavy premature defoliation, delay soybean plant senescence, and reduce the production, and size of the kernels produced (Walters, 1980). Based on a survey in 2006, global yield losses taken collectively for CLB as well as purple seed stain were approximately 1,912 thousand metric tons (Wrather et al., 2010). In the U.S. at that time, CLB was considered a minor disease due to generally low yield losses. However, more recently it has become more prevalent in the southern U.S. (Cai et al., 2009; Geisler, 2013). From 2015 to 2019, CLB caused estimated yield losses of approximately 969 metric tons from 28 growing states in the U.S. and Ontario, Canada (Bradley et al., 2021).
Multiple fungal species within the genus Cercospora have been associated with CLB (Soares et al., 2015; Albu et al., 2016; Sautua et al., 2020b). Phylogenetic studies have previously been conducted using different molecular markers and DNA sequencing to understand the genetic diversity, variation in pathogenicity, and the presence of different lineages (Imazaki et al., 2006; Cai and Schneider, 2008; Lurá et al., 2011; Soares et al., 2015). A genetic diversity study focusing on 164 C. kikuchii isolates from Louisiana grouped the species in two lineages and observed that isolates in lineage II (older lineage) were more aggressive than the dominating lineage I (newer lineage) (Cai and Schneider, 2008; Cai et al., 2009). Isolates collected from Argentina, Brazil, and the U.S. were observed to contain four lineages with recombination between the second and third lineage and manifesting cryptic speciation of the pathogens associated with CLB (Soares et al., 2015). Understanding the host-pathogen interactions and ecology of these cryptic species makes defining the causal organisms of the disease difficult and adds challenges to the potential development of new monitoring tools aimed at more efficient disease management strategies (Stergiopoulos and Gordon, 2014).
General disease management strategies for CLB include crop rotation, tillage, early planting dates, the use of resistant cultivars, and the application of fungicides during reproductive stages. Fungicide applications have been a primary approach to managing CLB. However, such applications have a chance of producing fungicide-resistant strains and may have negative environmental effects (Price et al., 2015; Sautua et al., 2019; Sautua et al., 2020a). Conversely, planting disease-resistant genotypes is an alternative approach to manage CLB as they reduce fungicide applications and are cost-effective. However, at present CLB-resistant cultivars are not available and as a result soybean producers rely heavily on fungicide products that come from multiple chemical classes to reduce the yield losses associated with CLB (Carmona et al., 2011; Sautua et al., 2020a).
Research has previously been conducted to identify soybean germplasm resistant to CLB and PSS (Orth and Schuh, 1994; Alloatti et al., 2015; Li et al., 2019; Kashiwa et al., 2021; Ward et al., 2021). However, minimal research efforts have been made to identify the genes or the genomic regions that confer resistance to the pathogen causing CLB identified on the vegetative structures of the plant, but the inheritance of PSS resistance and QTLs have been identified for symptoms related to the seed (Jackson et al., 2008; Alloatti et al., 2015). Genome-Wide Association Studies (GWAS) have been used in many pathosystems to identify genomic regions and genes in the surrounding region of associated markers that can contribute to the trait of interest. GWAS leverages the power of natural diversity in germplasm and captures the historical recombinant event, thus having greater resolution than traditional linkage mapping using biparental population (Yu and Buckler, 2006). Research has been conducted to explore genomic regions that contribute to agronomically essential traits in soybean (www.soybase.org, accessed on 12/15/2023). This study reports the first GWAS study to identify genomic regions conferring resistance to CLB and putative genes that play an essential role in plant defense mechanisms. The study aims to identify genomic regions that can be used for marker-assisted selection in soybean breeding programs that focus on developing CLB resistance germplasm.
2 Materials and methods
2.1 Evaluating soybean accessions for CLB
A total of 568 soybean accessions (Supplementary Table S1) with maturity groups ranging from III to VII were obtained from the USDA germplasm collection and evaluated for CLB for 3 years (2016, 2017, and 2018) at different locations in the mid-southern U.S. Soybean accessions were planted in 21 environments: Five locations in 2016 (Fayetteville, Marianna, and Stuttgart, AR; Bossier City, LA; and Stoneville, MS) and eight locations in 2017 and 2018 (Fayetteville, Keiser, Rohwer, and Stuttgart, AR; Alexandria and Bossier City, LA; Portageville, MO; and Stoneville, MS). Planting was done during mid-June, but generally differed at each location to maximize infection and CLB symptom expression. Seed was planted in a plot represented by a single row of each accession measuring approximately 3 m in length, and the distance between each row was approximately 100 cm; however, this varied by location and ranged from 96.5 to 101.6 cm across the study locations. Recommended agronomic practices for irrigation and fertilization were conducted as well as weed and insect management.
We depend on natural inoculum because it was not practical to produce large quantities of conidia for this project. We carefully evaluated the accessions for their response to CLB during seed growth stages, especially between R5 and R6. We assessed each accession about three times during these critical growth stages. In 2016 and 2017, accessions were evaluated for CLB with different rating schemes involving observation of symptom expression from multiple specific plant parts (e.g., leaves and petioles were evaluated separately) and standard symptoms such as purpling/bronzing, blight, and petiole lesions. In 2018, a simplified severity rating scale of 0–6 to evaluate CLB severity on an additive scale based on the presentation of symptoms throughout the canopy whereby 0 for no disease symptoms, 1 for light purple/bronzing, few petiole lesions, no leaf blight, 2 for moderate purple/bronzing and/or petiole lesions, no or minimal leaf blight, 3 for heavy purple/bronzing and/or petiole lesions, light blight, 4 for heavy purple/bronzing and/or petiole lesions, moderate blight, 5 for severe blight and less than 50% defoliation, and 6 for severe blight but more than 50% defoliation. In addition, percent incidence was presented on a 0 to 4 scale to encompass observational incidence as quartiles (Ward et al., 2021). Natural infection was relied on, and several locations with low disease pressure were not used in the final GWAS analysis. Locations with moderate to heavy disease pressure were used for GWAS analysis and included: Bossier City, LA (BLA) and Stoneville, MS (SMS) in 2016; Alexandria, LA (ALA), Bossier City, LA, and Stoneville, MS in 2017; and Alexandria and Bossier City, LA, Stoneville, MS, and Fayetteville, AR (FAR) in 2018.
2.2 Accession and SNP array data for GWAS
As a result of seed scarcity there was variation in the number of accessions planted at each location and genotypic data for all 568 accessions was not available. Therefore, 460 accessions that were planted and evaluated in all the location-years as well as with available genotypic data were used for analyses. A total of 42,080 SNPs that can be assigned to 20 chromosomes within the soybean genome were obtained through the Illumina Infinium SoySNP50 K iSelect SNP Beadchip (Song et al., 2013). Markers with minor allele frequency (MAF) < 5% or had a missing rate greater than 10% were excluded, resulting in 31,491 SNPs for additional analysis.
2.3 Population structure and linkage disequilibrium analysis
Population structure analysis to determine the number of subpopulation and member of each subpopulation was done using STRUCTURE v.2.3.4 software (Pritchard et al., 2000). For structure analysis, the resulting 31,491 SNPs were used with admixture model with five iterations of 50,000 burn-in and 50,000 Monte Carlo Markov Chain (MCMC) replications for k = 1 to k = 10. The number contained within the subpopulation was determined by calculating DeltaK using Structure Harvester (Earl and Vonholdt, 2012). Furthermore, linkage disequilibrium (LD) decay or r2 between pairs of markers was calculated using TASSEL (Bradbury et al., 2007) using sliding windows of 50 SNPs, and visualization was done in R to determine the LD decay rate and distance when the r2 dropped to half of the maximum value (Remington et al., 2001). Linkage disequilibrium between pairs of markers was plotted against the physical distance relying on the r2 values. The red fitting curve estimates the rate of LD decay when the power of maximum r2 was reduced to half, and the blue fitting curve illustrates the model fit to LD decay.
2.4 Assessing phenotypes and statistical analysis
The combined data observations for the years 2016 and 2017 were converted into categorical data and analyzed using a linear model with the “lm” function. The “anova” function was then used to obtain an ANOVA table. For the 2018 data, ANOVA was performed using the “aov” function, considering the severity and incidence. ANOVA was calculated separately for the years 2016-17 and 2018, as different methods and scales were used to rate CLB disease.
The program TASSEL was used to remove markers with minor allele frequency (MAF) < 5% or with a missing rate larger than 10% (Bradbury et al., 2007). The filtered set of markers were used to conduct GWAS using FarmCPU (Fixed and random model Circulating Probability Unification) with one of the tools present in GAPIT version 3 package in R (Liu et al., 2016; Wang and Zhang, 2021). FarmCPU is more effective than the generalized linear model (GLM) and the mixed linear model (MLM) as it controlled with both false positives and false negatives and is a widely used method in soybean GWAS studies (Kaler et al., 2018; Chamarthi et al., 2021). Kinship and PCA analysis were conducted using GAPIT and incorporated in the GWAS analysis. A SNP was declared significantly associated with the trait if it crossed the threshold value, [−Log10 (P) ≥ 3.5] or had a p-value ≤ 0.0003, which is similar to previous soybean GWAS studies (Dhanapal et al., 2015; Kaler et al., 2018; Chamarthi et al., 2021). If a SNP had a significant association to a trait [−Log10 (P) ≥ 3.5] in at least one environment and passed a threshold value of p ≤ 0.05 in additional environments, it was considered to be a common significant associated SNP for multiple environments (Kaler et al., 2017; Kaler et al., 2018; Chamarthi et al., 2021).
Candidate genes were searched for SNPs that were associated with CLB in multiple environments by scanning a ∼20 kb region of the significant SNP. The genome browser at Phytozome (https://phytozome.jgi.doe.gov/jbrowse/) and SoyBase (https://soybase.org) was used to identify putative genes and their functions. The search was targeted to identify any genes that are involved in defense mechanisms against biotic and abiotic stresses.
3 Results
3.1 Assessing CLB disease in soybean accessions
The ANOVA analysis indicated that in 2016 and 2017, the accessions significantly impacted CLB severity more than the locations. In 2018, the locations became the primary cause of variation in plant response to CLB, with the accessions contributing a lesser role (Supplementary Table S3, adapted from Ward et al., 2021). All accessions planted over the 3 years were ranked from most resistant to least resistant based on normalized disease evaluations (Supplementary Table S4, adapted from Ward et al., 2021). Among the 460 accessions evaluated, 17 consistently showed resistance to CLB for all 3 years and appeared in the top 10% of the population with the lowest disease severity (Supplementary Figure S1; Supplementary Table S4, adapted from Ward et al., 2021). Similarly, 17 accessions were identified consistently higher level of the disease severity across the years. These accessions will provide excellent genetic resources for cloning the genes that interact with the pathogen and understanding the interaction between the host and the pathogen.
3.2 Genomic insights: understanding marker distribution, LD decay, and population structure
The filtered SNPs amounted to 31,491 in total, spanning an estimated 948 megabases (Mb), which covers approximately 82% of the soybean genome (1.15 Gb). Across the chromosomes, the number of SNP markers per chromosome exhibited a range from 998 (chromosome 20) to 2,694 (chromosome 18), with an average of 1,575 SNP markers per chromosome (Table 1). The average distance between the two markers for the genome was approximately 30.1 Kb, while the range varied from 21.5 Kb (chromosome 18) to 48 Kb (chromosome 20).
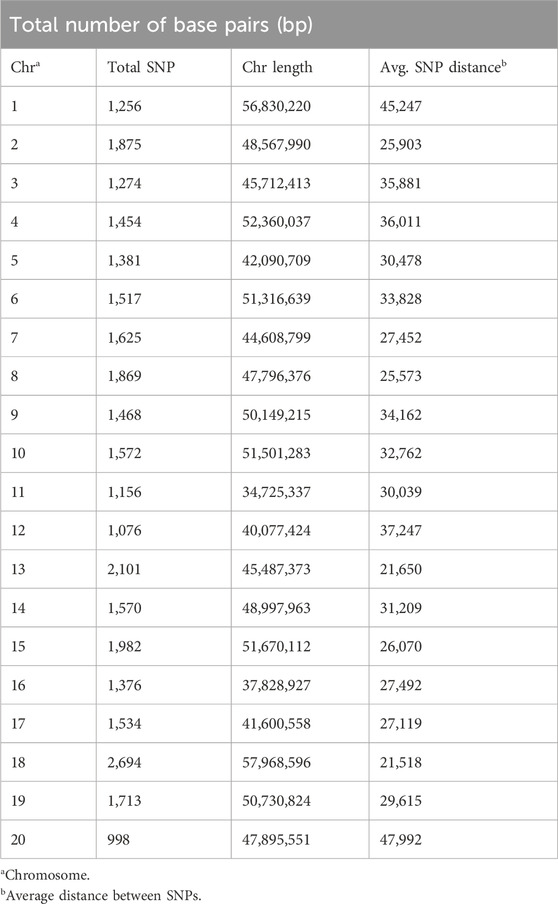
Table 1. Distribution of SNP markers along the soybean genome.
The estimated LD decay rate, measured in the r2, dropped to half at approximately 324 Kb (Figure 1). According to population structure evaluation, optimum subpopulation (k) was determined to be 6, which means that the 460 genotypes can be divided into six populations (Figure 2). The average distance (expected heterozygosity) within a subpopulation was approximately 0.2 while the FST fixation index, which measures the genetic variance in the subpopulation, ranged from 0.34 to 0.98 (Supplementary Table S2). Principal component analysis (PCA) clustering also supported that the accessions group into six different subpopulation (Figure 2).
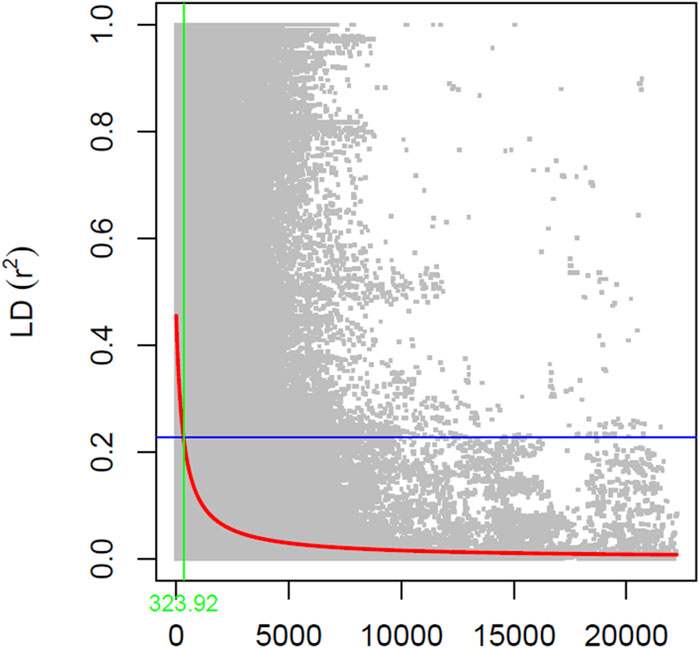
Figure 1. Linkage disequilibrium (LD) patterns on the soybean genome developed using 31,491 SNPs (MAF ≥0.05). The y-axis represents the average r2 value, while the x-axis represents physical distance.
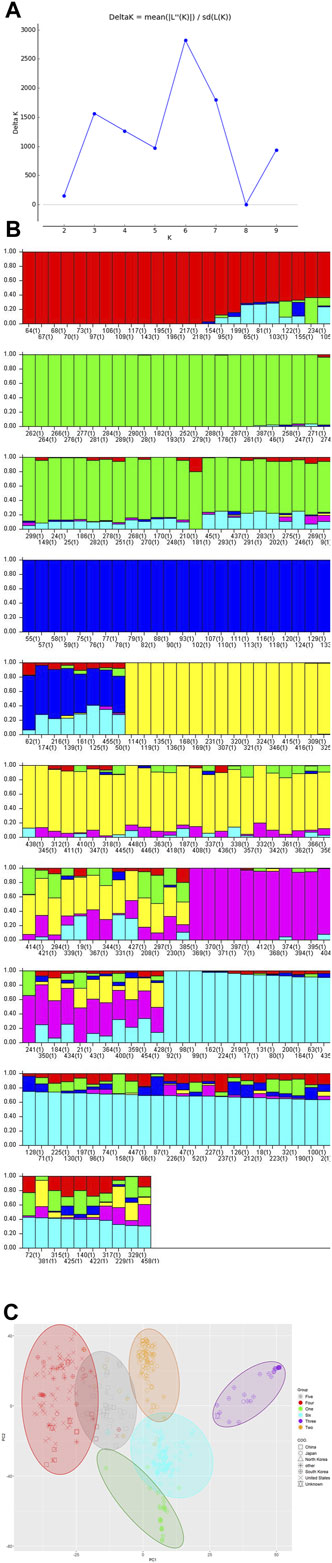
Figure 2. (Continued).
3.3 Identification of genomic regions linked to CLB
A total of 99 SNPs in 18 of 20 chromosomes were identified to be associated with CLB severity, while 47 SNPs that were present in more than two environments were distributed in 13 chromosomes (Figures 3–5; Supplementary Figures S1–S3; Supplementary Table S5). Chromosome 19 had the greatest number of associated SNPs to severity, while chromosome 6 had the greatest number of common SNPs (Table 2). Furthermore, the allele effect for disease severity ranged from −8.68 to 9.18 for these significantly associated SNPs. Here a negative value for allelic effect suggested that minor alleles were favorable, while a positive allele effect suggested that major alleles were favorable for disease resistance. For disease incidence we observed a total of 85 SNPs associated in all 20 chromosomes with chromosome 2 having the greatest number of SNPs (Figures 3–5; Supplementary Figures S2–S4; Supplementary Table S6). A total of 23 SNPs were determined to be associated to disease incidence in more than two environments (Table 3). The allele effect for disease incidence ranged from −5.96 to 10.98 for these significantly associated SNPs.
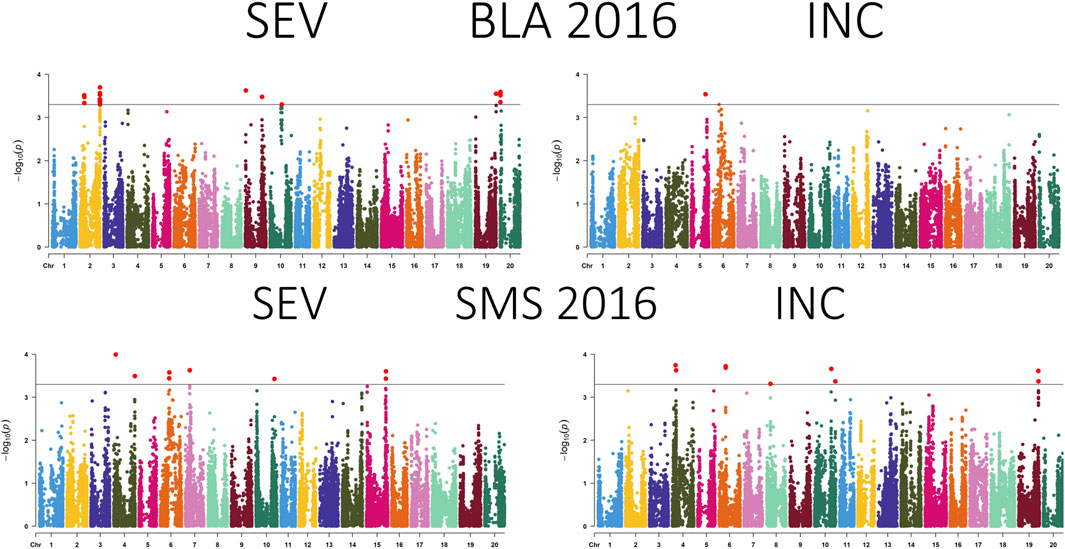
Figure 3. Manhattan plot presenting the association between SNPs, disease severity (SEV), and incidence (INC) of soybean accessions evaluated for Cercospora leaf blight in Bossier City, LA (BLA) and Stoneville, MS (SMS) during 2016. The gray horizontal line indicates the genome-wide significant threshold [−log10 (p-value) = 3.5].
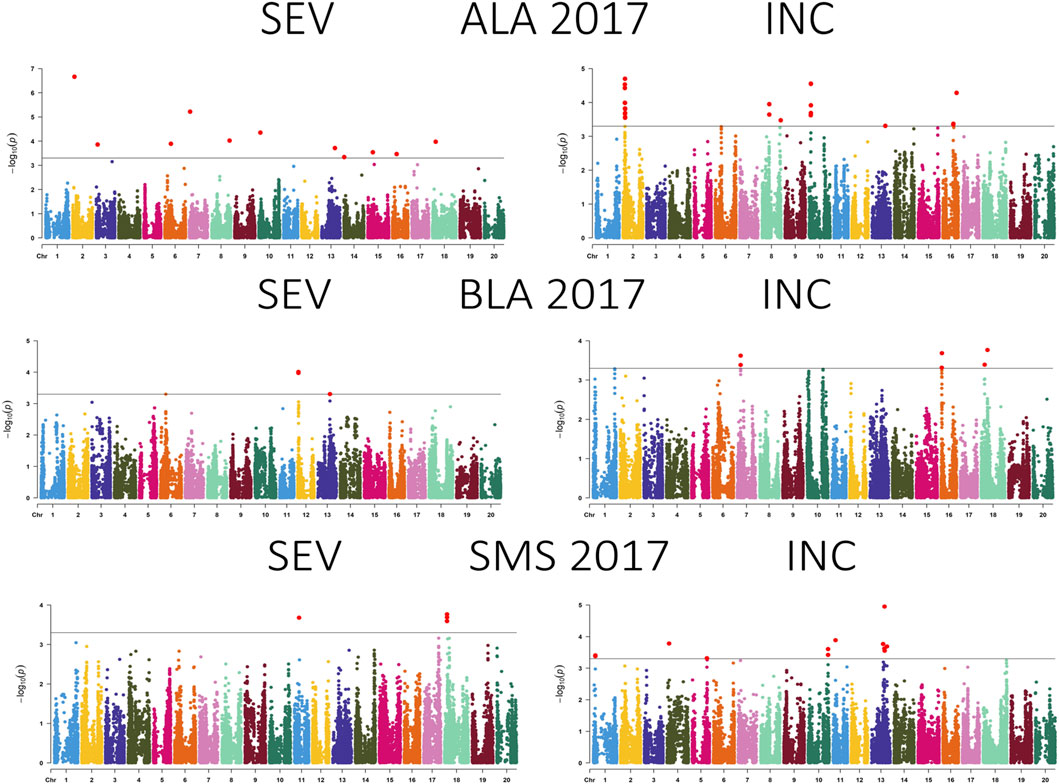
Figure 4. Manhattan plot showing the association between SNPs, disease severity (SEV), and incidence (INC) of soybean accessions evaluated for Cercospora leaf blight in Alexandria, LA (ALA), Bossier City, LA (BLA), and Stoneville, MS (SMS) during 2017. The gray horizontal line indicates the genome-wide significant threshold [−log10 (p-value) = 3.5].
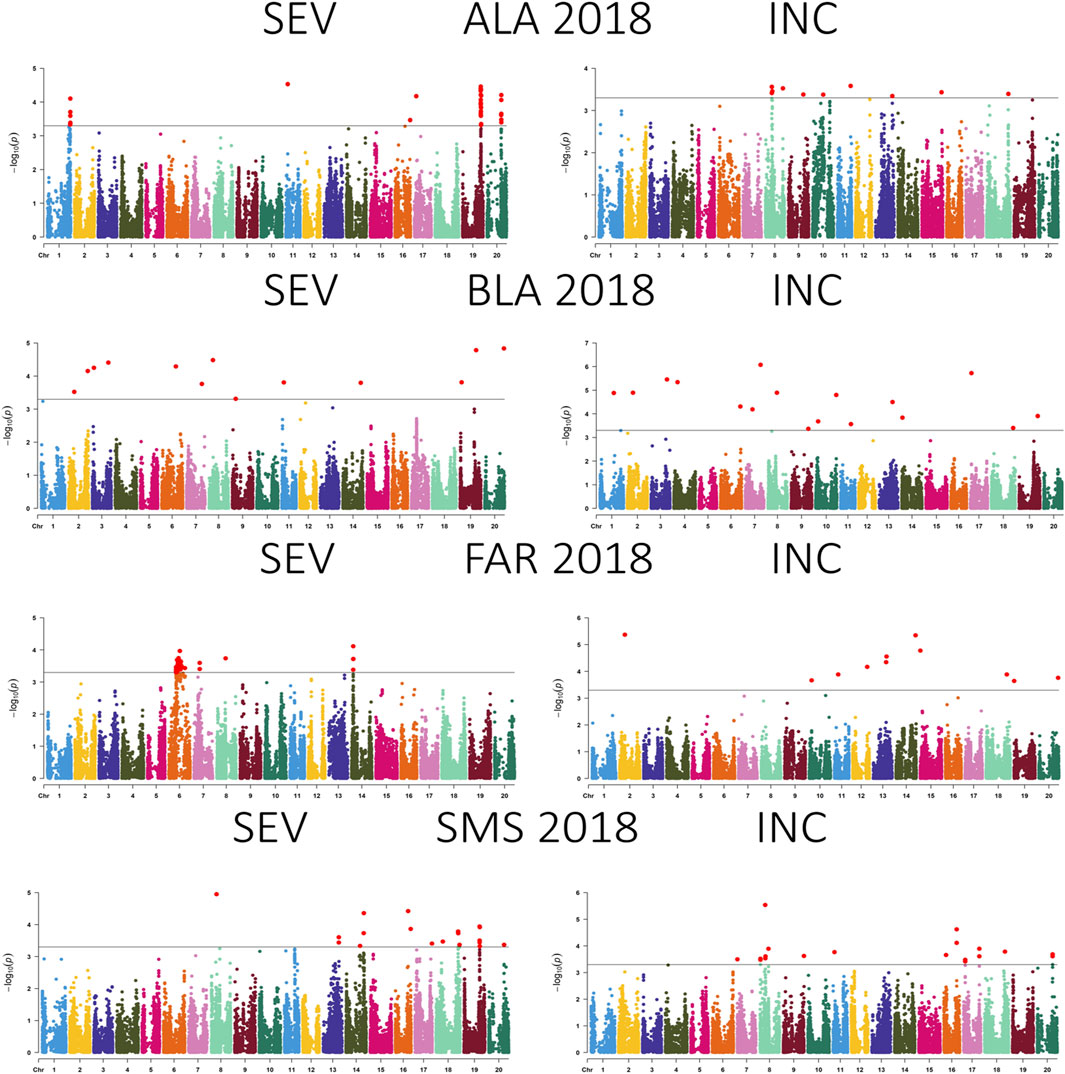
Figure 5. Manhattan plot showing the association between SNPs, disease severity (SEV), and incidence (INC) of soybean accessions evaluated for Cercospora leaf blight in Alexandria, LA (ALA), Bossier City, LA (BLA), Fayetteville, AR (FAR), and Stoneville, MS (SMS) during 2018. The gray horizontal line indicates the genome-wide significant threshold [−log10 (p-value) = 3.5].
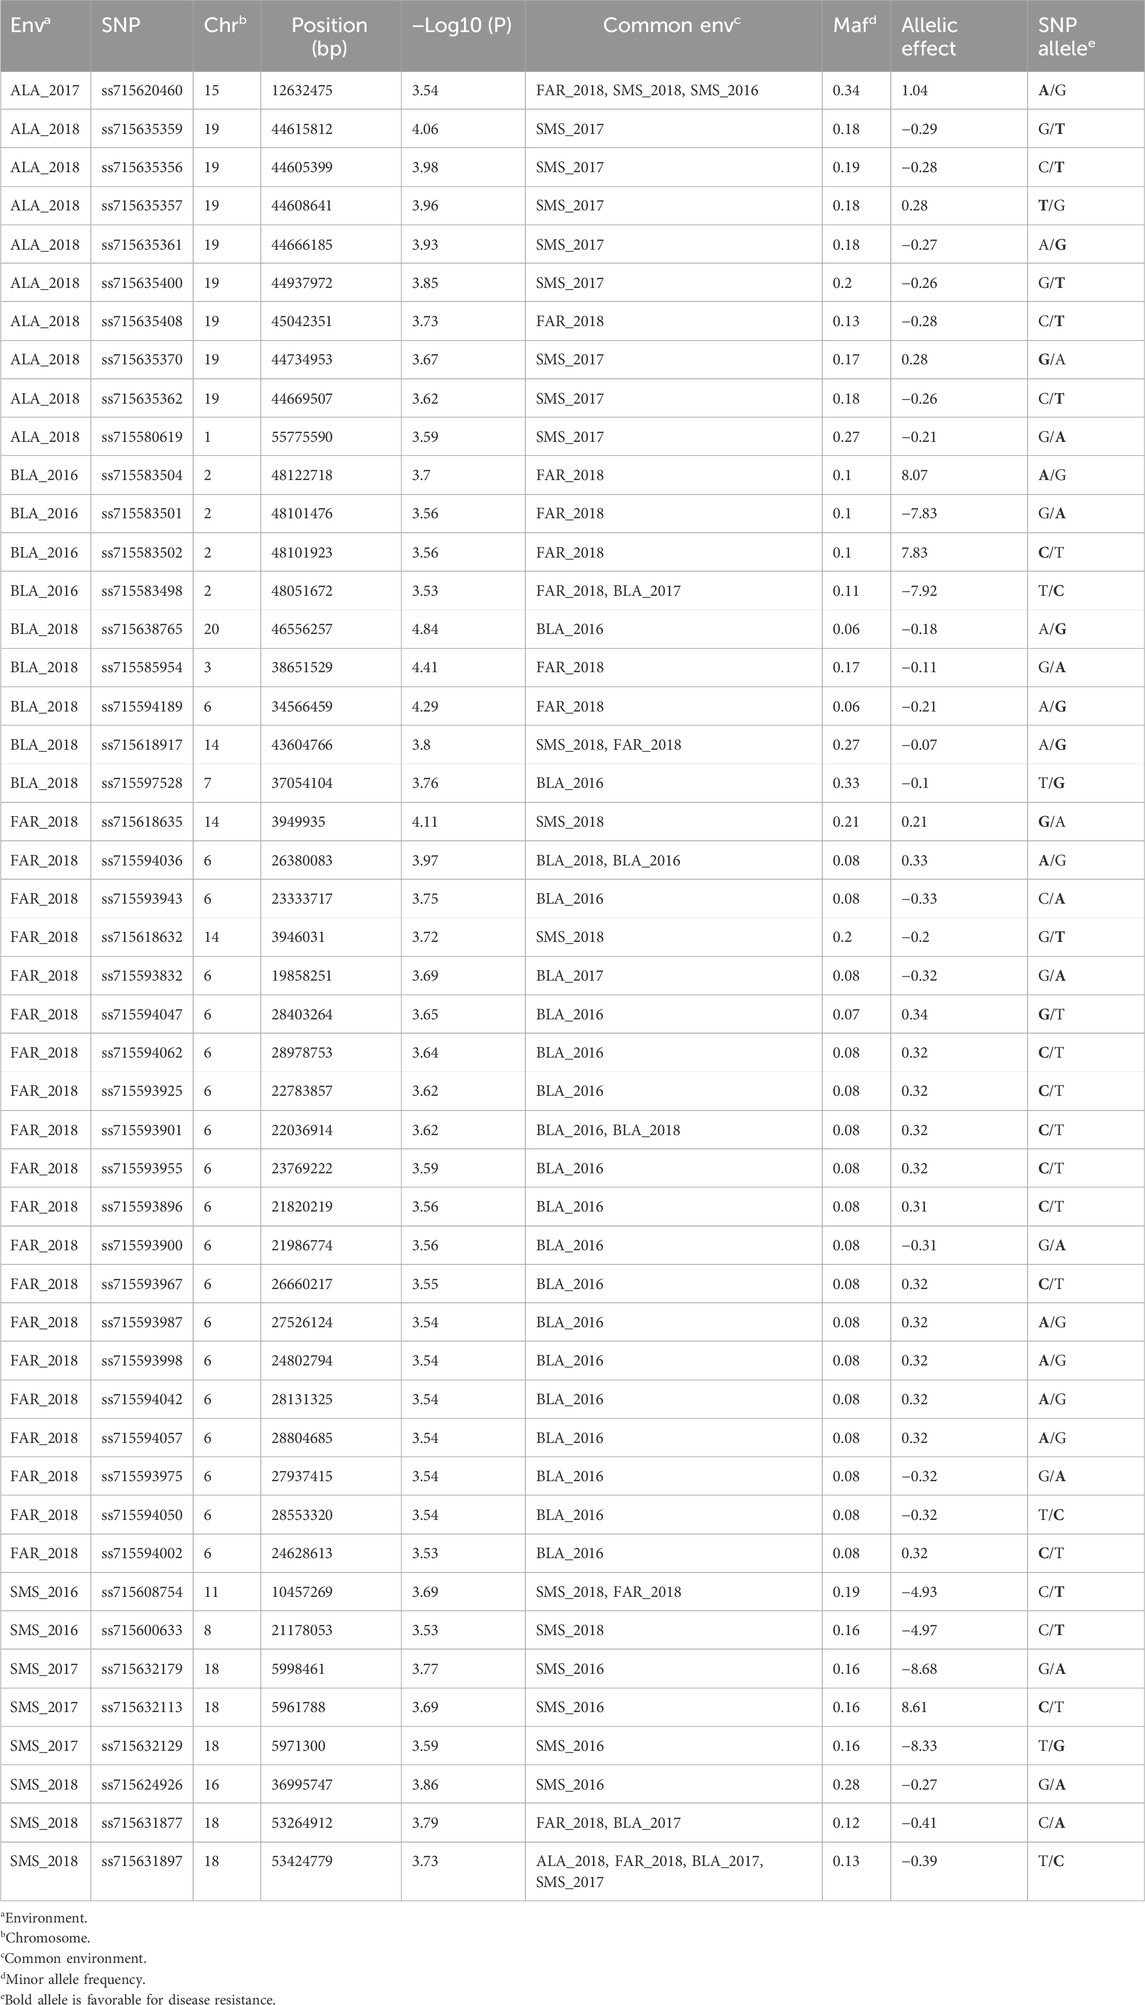
Table 2. SNPs associated with CLB severity identified by a FarmCPU model [threshold: −Log10 (P) ≥ 3.5].
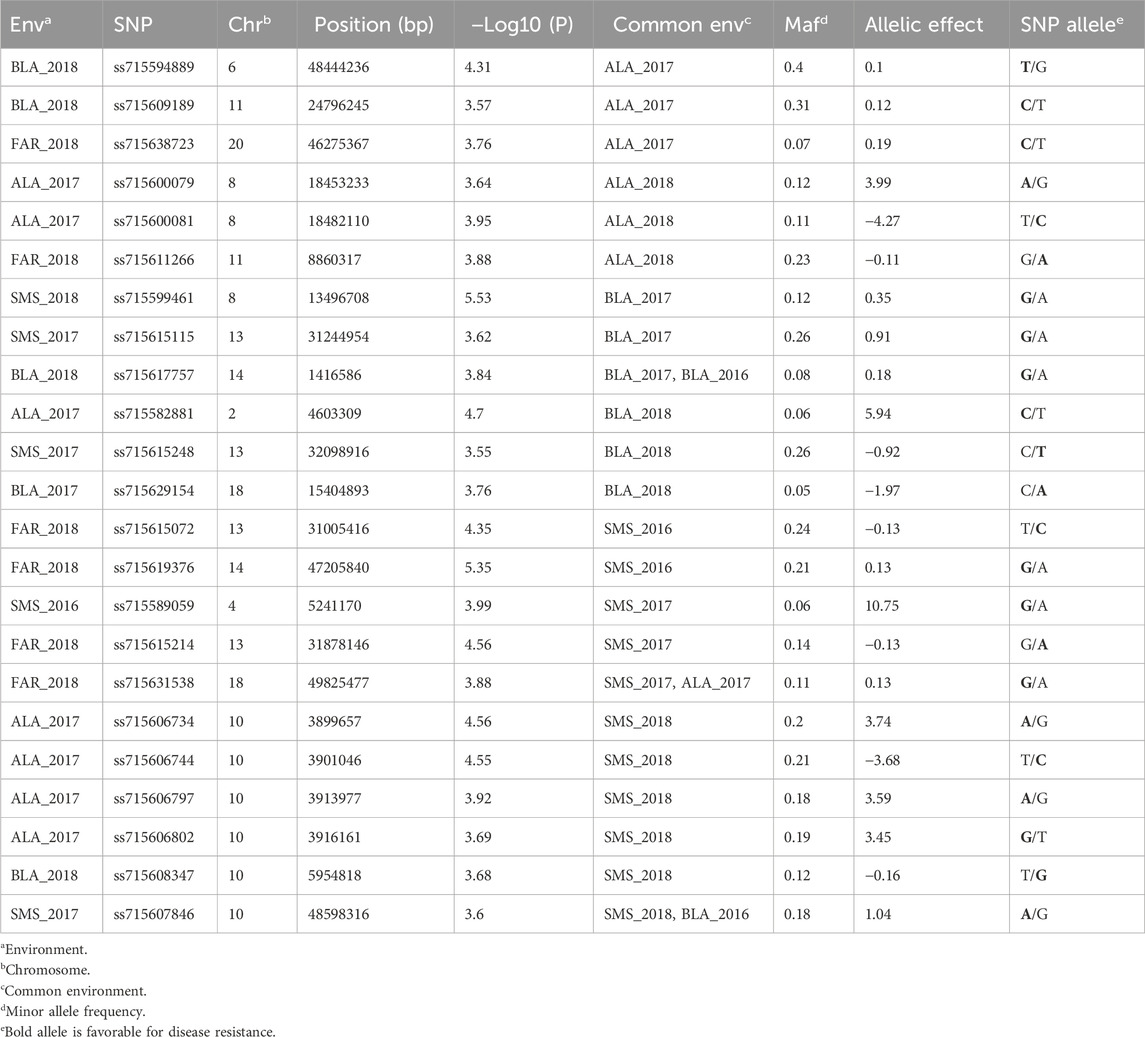
Table 3. SNPs associated with disease incidence identified by a FarmCPU model [threshold: −Log10 (P) ≥ 3.5].
3.4 Candidate genes and ontologies for CLB resistance
A total of 47 and 23 SNPs (Tables 2, 3) showed a significant association and were observed to be associated in multiple environments for disease severity and incidence rating, respectively. The search for candidate genes revealed that 36 out of 47 associated SNPs for disease severity and 19 out of 23 SNPs for disease incidence had genes in the vicinity of the 10 kb region surrounding them. A total of 72 and 57 genes (Supplementary Table S7), respectively, were identified in the vicinity of 36 (disease severity) and 19 (disease incidence) SNPs. GO enrichment analysis (https://www.soybase.org/) of these genes indicate involvement in several biotic and abiotic stress pathways such as regulating hydrogen peroxide; salicylic acid metabolic process; abscisic acid mediated signaling pathway; defense response to pathogens and insects; flavonoid biosynthetic pathway; response to cold and salt stress; as well as wound response signaling.
4 Discussion
To date, a limited number of studies have focused on identifying genomic regions associated with resistance to Cercospora kikuchii causal pathogen of CLB. The QTL resistance of C. kikuchii resistance for PSS was identified in a F2 population with parents, “Agripro 350” and “PI 80837” (Jackson et al., 2008); however, this provided limited information due to the lack of recombination events and genomic composition in a single cross. In GWAS studies, natural variation among a large set of soybean germplasm is used providing greater resolution and increasing the chances of identifying additional genomic regions associated with the trait. This approach has previously been used in soybean to discover genomic regions related to essential attributes like canopy cover, lodging, leaflet area, oil and protein content, plant height, pod shattering, pod number, oil component, protein components, and abiotic and biotic stresses (Leamy et al., 2017; Kaler et al., 2018; Lee et al., 2019; Patel et al., 2023b).
A total of 99 and 85 SNPs were identified associated with disease severity and incidence, respectively, out of which 47 and 23 were confirmed over multiple environments. In total, 14 SNPs were less than 200 kb away from the QTLs that have been identified to bestow resistance to diseases such as soybean cyst nematode (SCN), sudden death syndrome (SDS), Soybean mosaic virus (SMV), and Sclerotinia stem rot (Table 4).
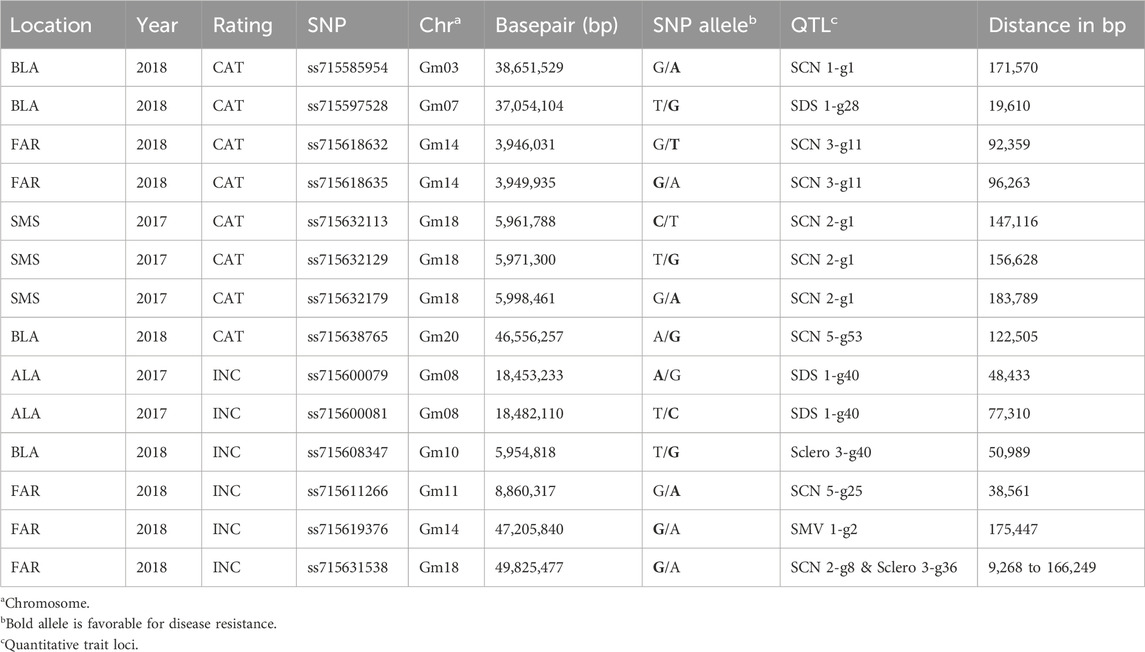
Table 4. Soybean genome region associated for multiple disease resistance.
A SNP (ss715597528) on chromosome 7 was 19 kb away from the QTL (SDS 1-g28) associated with resistance to SDS (Bao et al., 2015). Additionally, within the 10 kb region surrounding ss715597528, two leucine-rich repeat (LRR) receptor-like kinases, namely, Glyma.07g201600 and Glyma.07g201700, were identified (Supplementary Table S4). Several reports have suggested that these genes play crucial roles in providing resistance to multiple diseases (Song et al., 2008; Hok et al., 2011; Pradhan et al., 2018; Thapa et al., 2018). Leucine-rich repeat (LRR) receptor-like kinase genes represent a super family of transmembrane receptor-like kinases that are mainly involved in responding to external biotic and abiotic stress (Dufayard et al., 2017).
A SNP (ss715631538) located on Chr.18 associated with CLB was also detected in the vicinity of QTL SCN 2-g8, and QTL Sclero 3-g36, which provide SCN and SSR resistance, respectively (Zhang et al., 2016; Moellers et al., 2017). Glyma.18g211100 (peroxidase superfamily protein) and Glyma.18g210300 (guanine nucleotide-binding protein) were discovered in the surrounding 220 kb region of the SNP (ss715631538). Peroxidase superfamily protein and guanine nucleotide-binding protein both play roles in regulating stress, hormone biosynthesis, ROS metabolism, signaling pathways, and providing defense against diseases (Assmann, 2005; Brenya et al., 2016; Pandey et al., 2017; Jin et al., 2019). In addition, three SNPs (ss715632113, ss715632129, and ss715632179) distributed in the 35 kb region of chromosome 18 were determined to be associated with CLB and the QTL SCN 2-g1 was discovered less than 150 kb away (Table 4) (Zhang et al., 2016). Genes like leucine-rich repeat receptor-like protein kinase (Glyma.18g064100), RING/U-box superfamily protein (Glyma.18g063500), and ATP-binding cassette transporter (Glyma.18g063400) were found in close proximity of these three SNPs. These genes have been determined to be extensively involved in plant stress, disease response, and defense mechanisms in plants (Campbell et al., 2003; Rea, 2007; Sharma et al., 2013).
Recently, GWAS and RNA-Seq studies were conducted to identify genomic regions and genes linked to the soybean response to target spot, caused by Corynespora cassiicola (Patel et al., 2023a; Patel et al., 2023b). Two associated SNPs from the current study were located within 1 Mb from markers associated with target spot symptoms in soybean: One nestled on chromosome 11 (ss715608754), which demonstrated an association with the incidence of CLB and another residing on chromosome 16 (ss715624926), which was linked to the severity of CLB. The SNP ss715624926 on chromosome 16 is within a 1.86 Mb genomic region, which hosts markers that were linked not only to target spot but also to Sclerotinia stem rot, iron deficiency chlorosis, and SCN. This 1.86 Mb genomic region is home to 35 genes that are crucial in disease resistance including: Family protein/LRR family protein, TIR-NBS-LRR family, receptor-like proteins (RLP), cysteine-rich RLK protein kinase 25, cytochrome P450, LRR-RLK, and LRR transmembrane protein kinase (Bradbury et al., 2007). Further exploration of this region may open exciting possibilities for the cultivation of soybean cultivars with broad-spectrum resistance against multiple pathogens, thereby fortifying the sustainability and resilience of soybean.
5 Conclusion
In summary, this study marks a pioneering effort in identifying genomic regions and genes influencing soybean plant response to CLB. The 17 lines identified in this effort coupled with the identification of key SNPs and candidate genes offer considerable value for developing novel breeding lines fortified with CLB resistance. Moreover, certain genomic regions revealed in our study consistently demonstrated associations with CLB across diverse environments and have previously been linked to additional diseases. These findings present an opportunity to leverage these genomic regions, facilitating the streamlined integration of multiple disease-resistance loci in future breeding programs. To better understand our findings, additional research in controlled environments using specific species of Cercospora is necessary.
Data availability statement
The datasets presented in this study can be found in online repositories. The names of the repository/repositories and accession number(s) can be found in the article/Supplementary Materials.
Author contributions
JP: Data curation, Formal Analysis, Methodology, Software, Writing–original draft, Writing–review and editing, Visualization. TA: Writing–review and editing, Conceptualization, Investigation, Methodology, Supervision, Funding acquisition. BB: Methodology, Writing–review and editing. PC: Methodology, Writing–review and editing. MC: Methodology, Writing–review and editing. LM: Methodology, Writing–review and editing. MO: Methodology, Writing–review and editing. LF: Methodology, Writing–review and editing. DM: Methodology, Writing–review and editing. JR: Methodology, Writing–review and editing. BS: Methodology, Writing–review and editing. PP: Methodology, Writing–review and editing, Conceptualization, Funding acquisition, Investigation, Supervision. BW: Methodology, Writing–review and editing. JK: Methodology, Writing–review and editing, Conceptualization, Funding acquisition, Investigation, Supervision.
Funding
The author(s) declare financial support was received for the research, authorship, and/or publication of this article. The current study was supported by funding from the United Soybean Board, the Mid-South Soybean Board, Alabama Soybean Producers, and individual state commodity boards.
Conflict of interest
The authors declare that the research was conducted in the absence of any commercial or financial relationships that could be construed as a potential conflict of interest.
Publisher’s note
All claims expressed in this article are solely those of the authors and do not necessarily represent those of their affiliated organizations, or those of the publisher, the editors and the reviewers. Any product that may be evaluated in this article, or claim that may be made by its manufacturer, is not guaranteed or endorsed by the publisher.
Supplementary material
The Supplementary Material for this article can be found online at: https://www.frontiersin.org/articles/10.3389/fgene.2024.1377223/full#supplementary-material
References
Albu, S., Schneider, R. W., Price, P. P., and Doyle, V. P. (2016). Cercospora cf. flagellaris and Cercospora cf. sigesbeckiae are associated with cercospora leaf blight and purple seed stain on soybean in north America. Phytopathology 106 (11), 1376–1385. doi:10.1094/PHYTO-12-15-0332-R
Allen, T., Bissonnette, K., Bradley, C., Damicone, J., Dufault, N., Faske, T., et al. (2018). “Southern United States soybean disease loss estimates for 2017,” in Proceedings of the 45th annual meeting of the southern soybean disease workers, Pensacola Beach, Florida, March 7-8, 2018, 7–8.
Alloatti, J., Li, S., Chen, P., Jaureguy, L., Smith, S. F., Florez-Palacios, L., et al. (2015). Screening a diverse soybean germplasm collection for reaction to purple seed stain caused by cercospora kikuchii. Plant Dis. 99 (8), 1140–1146. doi:10.1094/PDIS-09-14-0878-RE
Assmann, S. M. (2005). G protein regulation of disease resistance during infection of rice with rice blast fungus. Sci. STKE 2005 (310), cm13. doi:10.1126/stke.3102005cm13
Bandara, A. Y., Weerasooriya, D. K., Bradley, C. A., Allen, T. W., and Esker, P. D. (2020). Dissecting the economic impact of soybean diseases in the United States over two decades. Plos One 15 (4), e0231141. doi:10.1371/journal.pone.0231141
Bao, Y., Kurle, J. E., Anderson, G., and Young, N. D. (2015). Association mapping and genomic prediction for resistance to sudden death syndrome in early maturing soybean germplasm. Mol. Breed. 35 (6), 128. doi:10.1007/s11032-015-0324-3
Bradbury, P. J., Zhang, Z., Kroon, D. E., Casstevens, T. M., Ramdoss, Y., and Buckler, E. S. (2007). TASSEL: software for association mapping of complex traits in diverse samples. Bioinformatics 23 (19), 2633–2635. doi:10.1093/bioinformatics/btm308
Bradley, C. A., Allen, T. W., Sisson, A. J., Bergstrom, G. C., Bissonnette, K. M., Bond, J., et al. (2021). Soybean yield loss estimates due to diseases in the United States and Ontario, Canada, from 2015 to 2019. Plant Health Prog. 22, 483–495. doi:10.1094/php-01-21-0013-rs
Brenya, E., Trusov, Y., Dietzgen, R. G., and Botella, J. R. (2016). Heterotrimeric G-proteins facilitate resistance to plant pathogenic viruses in Arabidopsis thaliana (L.) Heynh. Plant Signal Behav. 11 (8), e1212798. doi:10.1080/15592324.2016.1212798
Cai, G., and Schneider, R. W. (2008). Population structure of Cercospora kikuchii, the causal agent of Cercospora leaf blight and purple seed stain in soybean. Phytopathology 98 (7), 823–829. doi:10.1094/PHYTO-98-7-0823
Cai, G., Schneider, R. W., and Padgett, G. B. (2009). Assessment of lineages of Cercospora kikuchii in Louisiana for aggressiveness and screening soybean cultivars for resistance to cercospora leaf blight. Plant Dis. 93 (9), 868–874. doi:10.1094/PDIS-93-9-0868
Campbell, E. J., Schenk, P. M., Kazan, K., Penninckx, I. A. M. A., Anderson, J. P., Maclean, D. J., et al. (2003). Pathogen-responsive expression of a putative ATP-binding cassette transporter gene conferring resistance to the diterpenoid sclareol is regulated by multiple defense signaling pathways in Arabidopsis. Plant Physiol. 133 (3), 1272–1284. doi:10.1104/pp.103.024182
Carmona, M., Gally, M., Sautua, F., Abello, A., and Lopez, P. (2011). Uso de mezclas de azoxistrobina y triazoles para controlar enfermedades de fin de ciclo de la soja. Summa Phytopathol. 37, 134–139. doi:10.1590/s0100-54052011000200009
Chamarthi, S. K., Kaler, A. S., Abdel-Haleem, H., Fritschi, F. B., Gillman, J. D., Ray, J. D., et al. (2021). Identification and confirmation of loci associated with canopy wilting in soybean using genome-wide association mapping. Front. Plant Sci. 12 (1371), 698116. doi:10.3389/fpls.2021.698116
Chanda, A. K., Ward, N. A., Robertson, C. L., Chen, Z. Y., and Schneider, R. W. (2014). Development of a quantitative polymerase Chain reaction detection protocol for cercospora kikuchii in soybean leaves and its use for documenting latent infection as affected by fungicide applications. Phytopathology 104 (10), 1118–1124. doi:10.1094/Phyto-07-13-0200-R
Dhanapal, A. P., Ray, J. D., Singh, S. K., Hoyos-Villegas, V., Smith, J. R., Purcell, L. C., et al. (2015). Erratum to: genome-wide association study (GWAS) of carbon isotope ratio (delta(13)C) in diverse soybean [Glycine max (L.) Merr.] genotypes. Theor. Appl. Genet. 128 (2), 375–376. doi:10.1007/s00122-014-2450-4
Dufayard, J. F., Bettembourg, M., Fischer, I., Droc, G., Guiderdoni, E., Périn, C., et al. (2017). New insights on leucine-rich repeats receptor-like kinase orthologous relationships in angiosperms. Front. Plant Sci. 381, 381. doi:10.3389/fpls.2017.00381
Earl, D. A., and Vonholdt, B. M. (2012). STRUCTURE HARVESTER: a website and program for visualizing STRUCTURE output and implementing the Evanno method. Conserv. Genet. Resour. 4 (2), 359–361. doi:10.1007/s12686-011-9548-7
Geisler, L. (2013) Purple seed stain and Cercospora blight. Plant pathology fact sheet. Nebraska: University of Nebraska-Lincoln.
Hartman, G. L., Rupe, J. C., Sikora, E. J., Domier, L. L., Davis, J. A., and Steffey, K. L. (2015). Compendium of soybean diseases and pests. Am. Phytopath Soc.
Hok, S., Danchin, E. G., Allasia, V., Panabieres, F., Attard, A., and Keller, H. (2011). An Arabidopsis (malectin-like) leucine-rich repeat receptor-like kinase contributes to downy mildew disease. Plant Cell Environ. 34 (11), 1944–1957. doi:10.1111/j.1365-3040.2011.02390.x
Imazaki, I., Homma, Y., Kato, M., Vallone, S., Yorinori, J. T., Henning, A. A., et al. (2006). Genetic relationships between cercospora kikuchii populations from south America and Japan. Phytopathology 96 (9), 1000–1008. doi:10.1094/Phyto-96-1000
Jackson, E. W., Feng, C., Fenn, P., and Chen, P. (2008). Genetic mapping of resistance to purple seed stain in PI 80837 soybean. J. Hered. 99 (3), 319–322. doi:10.1093/jhered/esm123
Jin, T., Sun, Y., Zhao, R., Shan, Z., Gai, J., and Li, Y. (2019). Overexpression of peroxidase gene GsPRX9 confers salt tolerance in soybean. Int. J. Mol. Sci. 20 (15), 3745. doi:10.3390/ijms20153745
Kaler, A. S., Ray, J. D., Schapaugh, W. T., Davies, M. K., King, C. A., and Purcell, L. C. (2018). Association mapping identifies loci for canopy coverage in diverse soybean genotypes. Mol. Breed. 38 (5), 50–12. doi:10.1007/s11032-018-0810-5
Kaler, A. S., Ray, J. D., Schapaugh, W. T., King, C. A., and Purcell, L. C. (2017). Genome-wide association mapping of canopy wilting in diverse soybean genotypes. Theor. Appl. Genet. 130 (10), 2203–2217. doi:10.1007/s00122-017-2951-z
Kashiwa, T., Lavilla, M. A., Paleo, A. D., Ivancovich, A. J. G., and Yamanaka, N. (2021). The use of detached leaf inoculation for selecting Cercospora kikuchii resistance in soybean genotypes. PhytoFrontiers™ 1 (4), 250–257. doi:10.1094/phytofr-01-21-0002-ta
Leamy, L. J., Zhang, H., Li, C., Chen, C. Y., and Song, B.-H. (2017). A genome-wide association study of seed composition traits in wild soybean (Glycine soja). BMC genomics 18, 18–15. doi:10.1186/s12864-016-3397-4
Lee, S., Van, K., Sung, M., Nelson, R., LaMantia, J., McHale, L. K., et al. (2019). Genome-wide association study of seed protein, oil and amino acid contents in soybean from maturity groups I to IV. Theor. Appl. Genet. 132, 1639–1659. doi:10.1007/s00122-019-03304-5
Li, S., Sciumbato, G., Boykin, D., Shannon, G., and Chen, P. (2019). Evaluation of soybean genotypes for reaction to natural field infection by Cercospora species causing purple seed stain. PLoS One 14 (10), e0222673. doi:10.1371/journal.pone.0222673
Liu, X., Huang, M., Fan, B., Buckler, E. S., and Zhang, Z. (2016). Iterative usage of fixed and random effect models for powerful and efficient genome-wide association studies. PLOS Genet. 12 (2), e1005767. doi:10.1371/journal.pgen.1005767
Lurá, M. C., Rapela, M. G. L., Vaccari, M. C., Maumary, R., Soldano, A., Mattio, M., et al. (2011). Genetic diversity of Cercospora kikuchii isolates from soybean cultured in Argentina as revealed by molecular markers and cercosporin production. Mycopathologia 171 (5), 361–371. doi:10.1007/s11046-010-9362-x
Moellers, T. C., Singh, A., Zhang, J., Brungardt, J., Kabbage, M., Mueller, D. S., et al. (2017). Main and epistatic loci studies in soybean for Sclerotinia sclerotiorum resistance reveal multiple modes of resistance in multi-environments. Sci. Rep. 7 (1), 3554. doi:10.1038/s41598-017-03695-9
Orth, C. E., and Schuh, W. (1994). Resistance of 17 soybean cultivars to foliar, latent, and seed infection by cercospora-kikuchii. Plant Dis. 78 (7), 661–664. doi:10.1094/Pd-78-0661
Pandey, V. P., Awasthi, M., Singh, S., Tiwari, S., and Dwivedi, U. N. (2017). A comprehensive review on function and application of plant peroxidases. Biochem. Anal. Biochem. 6 (1), 308. doi:10.4172/2161-1009.1000308
Patel, S., Patel, J., Bowen, K., and Koebernick, J. (2023a). Deciphering the genetic architecture of resistance to Corynespora cassiicola in soybean (Glycine max L.) by integrating genome-wide association mapping and RNA-Seq analysis. Front. Plant Sci. 14, 1255763. doi:10.3389/fpls.2023.1255763
Patel, S., Patel, J., Silliman, K., Hall, N., Bowen, K., and Koebernick, J. (2023b). Comparative transcriptome profiling unfolds a complex defense and secondary metabolite networks imparting Corynespora cassiicola resistance in soybean (Glycine max (L.) merrill). Int. J. Mol. Sci. 24 (13), 10563. doi:10.3390/ijms241310563
Pradhan, D., Mathew, D., Mathew, S. K., and Nazeem, P. A. (2018). Identifying the markers and tagging a leucine-rich repeat receptor-like kinase gene for resistance to anthracnose disease in vegetable cowpea [Vigna unguiculata (L.) Walp.]. J. Hortic. Sci. Biotechnol. 93 (3), 225–231. doi:10.1080/14620316.2017.1362962
Price, P. P., Purvis, M. A., Cai, G., Padgett, G. B., Robertson, C. L., Schneider, R. W., et al. (2015). Fungicide resistance in Cercospora kikuchii, a soybean pathogen. Plant Dis. 99 (11), 1596–1603. doi:10.1094/PDIS-07-14-0782-RE
Pritchard, J. K., Stephens, M., and Donnelly, P. (2000). Inference of population structure using multilocus genotype data. Genetics 155 (2), 945–959. doi:10.1093/genetics/155.2.945
Rea, P. A. (2007). Plant ATP-binding cassette transporters. Annu. Rev. Plant Biol. 58 (1), 347–375. doi:10.1146/annurev.arplant.57.032905.105406
Remington, D. L., Thornsberry, J. M., Matsuoka, Y., Wilson, L. M., Whitt, S. R., Doebley, J., et al. (2001). Structure of linkage disequilibrium and phenotypic associations in the maize genome. Proc. Natl. Acad. Sci. U. S. A. 98 (20), 11479–11484. doi:10.1073/pnas.201394398
Sautua, F. J., Doyle, V. P., Price, P. P., Porfiri, A., Fernandez, P., Scandiani, M. M., et al. (2020a). Fungicide resistance in Cercospora species causing cercospora leaf blight and purple seed stain of soybean in Argentina. Plant Pathol. 69 (9), 1678–1694. doi:10.1111/ppa.13261
Sautua, F. J., Searight, J., Doyle, V. P., Price, P. P., Scandiani, M. M., and Carmona, M. A. (2019). The G143A mutation confers azoxystrobin resistance to soybean cercospora leaf blight in Bolivia. Plant Health Prog. 20 (1), 2–3. doi:10.1094/Php-10-18-0060-Br
Sautua, F. J., Searight, J., Doyle, V. P., Scandiani, M. M., and Carmona, M. A. (2020b). Cercospora cf. nicotianae is a causal agent of Cercospora leaf blight of soybean. Eur. J. Plant Pathology 156 (4), 1227–1231. doi:10.1007/s10658-020-01969-z
Schuh, W. (1992). Effect of pod development stage, temperature, and pod wetness duration on the incidence of purple seed stain of soybeans. Phytopathology 82 (4), 446–451. doi:10.1094/Phyto-82-446
Schuh, W. (1993). Influence of interrupted dew periods, relative-humidity, and light on disease severity and latent infections caused by cercospora-kikuchii on soybean. Phytopathology 83 (1), 109–113. doi:10.1094/phyto-83-109
Sharma, M., Pandey, A., and Pandey, G. K. (2013). Role of plant U-BOX (PUB) protein in stress and development. Plant Stress 7 (S1), 1–9.
Soares, A. P. G., Guillin, E. A., Borges, L. L., da Silva, A. C. T., de Almeida, A. M. R., Grijalba, P. E., et al. (2015). More cercospora species infect soybeans across the americas than meets the eye. Plos One 10 (8), e0133495. doi:10.1371/journal.pone.0133495
Song, D., Li, G., Song, F., and Zheng, Z. (2008). Molecular characterization and expression analysis of OsBISERK1, a gene encoding a leucine-rich repeat receptor-like kinase, during disease resistance responses in rice. Mol. Biol. Rep. 35 (2), 275–283. doi:10.1007/s11033-007-9080-8
Song, Q., Hyten, D. L., Jia, G., Quigley, C. V., Fickus, E. W., Nelson, R. L., et al. (2013). Development and evaluation of SoySNP50K, a high-density genotyping array for soybean. PLoS One 8 (1), e54985. doi:10.1371/journal.pone.0054985
Stergiopoulos, I., and Gordon, T. R. (2014). Cryptic fungal infections: the hidden agenda of plant pathogens. Front. Plant Sci. 5, 506. doi:10.3389/fpls.2014.00506
Thapa, G., Gunupuru, L. R., Hehir, J. G., Kahla, A., Mullins, E., and Doohan, F. M. (2018). A pathogen-responsive leucine rich receptor like kinase contributes to Fusarium resistance in cereals. Front. Plant Sci. 9, 867. doi:10.3389/fpls.2018.00867
Turner, R. E., Ebelhar, M. W., Wilkerson, T., Bellaloui, N., Golden, B. R., Irby, J. T., et al. (2020). Effects of purple seed stain on seed quality and composition in soybean. Plants 9 (8), 993. doi:10.3390/plants9080993
Walters, H. (1980). Soybean leaf blight caused by Cercospora kikuchii. Plant Dis. 64 (10), 961–962. doi:10.1094/pd-64-961
Wang, J., and Zhang, Z. (2021). GAPIT version 3: boosting power and accuracy for genomic association and prediction. Genomics Proteomics Bioinforma. 19 (4), 629–640. doi:10.1016/j.gpb.2021.08.005
Ward, B. M., Shrestha, B. K., Allen, T. W., Buckley, B., Chen, P. Y., Clubb, M., et al. (2021). Evaluating Cercospora leaf blight resistance in soybean accessions using an improved categorical disease-evaluation scale. J. Crop Improv. 35 (5), 679–699. doi:10.1080/15427528.2020.1865226
Wrather, A., Shannon, G., Balardin, R., Carregal, L., Escobar, R., Gupta, G., et al. (2010). Effect of diseases on soybean yield in the top eight producing countries in 2006. Plant Health Prog. 11 (1), 29. doi:10.1094/php-2010-0102-01-rs
Yu, J., and Buckler, E. S. (2006). Genetic association mapping and genome organization of maize. Curr. Opin. Biotechnol. 17 (2), 155–160. doi:10.1016/j.copbio.2006.02.003
Keywords: GWAS, soybean, cercospora leaf blight (CLB), SNP, disease resistance
Citation: Patel J, Allen TW, Buckley B, Chen P, Clubb M, Mozzoni LA, Orazaly M, Florez L, Moseley D, Rupe JC, Shrestha BK, Price PP III, Ward BM and Koebernick J (2024) Deciphering genetic factors contributing to enhanced resistance against Cercospora leaf blight in soybean (Glycine max L.) using GWAS analysis. Front. Genet. 15:1377223. doi: 10.3389/fgene.2024.1377223
Received: 27 January 2024; Accepted: 24 April 2024;
Published: 10 May 2024.
Edited by:
Zhongqi Fan, Fujian Agriculture and Forestry University, ChinaReviewed by:
Arvind H. Hirani, Kemin Industries, Inc., United StatesYiwei Zhou, Guangdong Academy of Agricultural Sciences (GDAAS), China
Copyright © 2024 Patel, Allen, Buckley, Chen, Clubb, Mozzoni, Orazaly, Florez, Moseley, Rupe, Shrestha, Price, Ward and Koebernick. This is an open-access article distributed under the terms of the Creative Commons Attribution License (CC BY). The use, distribution or reproduction in other forums is permitted, provided the original author(s) and the copyright owner(s) are credited and that the original publication in this journal is cited, in accordance with accepted academic practice. No use, distribution or reproduction is permitted which does not comply with these terms.
*Correspondence: Jinesh Patel, amRwMDA3OEBhdWJ1cm4uZWR1
†Present addresses: Leandro A. Mozzoni, Bayer, Lincoln, NE, United States
David Moseley, LSU AgCenter, Dean Lee Research and Extension Center, Alexandria, LA, United States
Brian M. Ward, ISK BioSciences, Painesville, OH, United States