 P. Khanal
 J. Johnson
 N. Deeb
- STgenetics, Navasota, TX, United States
Residual feed intake (RFI) is an important trait of feed efficiency that has been increasingly considered in the breeding objectives for dairy cattle. The objectives of this study were to estimate the genetic parameters of RFI and its component traits, namely, dry-matter intake (DMI), body weight (BW), and energy-corrected milk (ECM), in lactating Holstein cows; we thus developed a system for genomic evaluation of RFI in lactating Holstein cows and explored the associations of the RFI of heifers and cows. The RFI values were calculated from 2,538 first (n = 2,118) and second (n = 420) lactation Holsteins cows between 2020 and 2024 as part of the STgenetics EcoFeed® program. Of the animals, 1,516 were heifers from the same research station with previously established RFI values . After quality control, 61,283 single-nucleotide polymorphisms were used for the analyses. Univariate analyses were performed to estimate the heritabilities of RFI and its components in lactating cows; bivariate analyses were then performed to estimate the genetic correlations between the RFI of heifers and lactating cows using the genomic best unbiased linear prediction method. Animals with phenotypes and genotypes were used as the training population, and animals with only genotypes were considered the prediction population. The reliability of breeding values was obtained by approximation based on partitioning a function of the accuracy of the training population’s genomic estimated breeding values (GEBVs) and magnitudes of genomic relationships between the individuals in the training and prediction populations. The heritability estimates (mean ± SE) of the RFI, DMI, ECM, and BW were 0.43 ± 0.07, 0.44 ± 0.04, 0.40 ± 0.05, and 0.46 ± 0.04, respectively. The average reliability of the GEBVs for RFI from the training and prediction populations were 44% and 30%, respectively. The genetic correlations for the RFI were 0.42 ± 0.08 between heifers and first lactation cows and 0.34 ± 0.06 between heifers and first and second lactation cows. Our results show that the genetic components of RFI are not fully carried over from heifers to cows and that there is re-ranking of the individuals at different life stages. Selection of animals for feed efficiency on a lifetime basis thus requires accounting for the efficiencies during animal growth and milk production as a lactating cow.
1 Introduction
Feed efficiency (FE) has a large impact on the profitability of the dairy industry as feed accounts for approximately 50% of the total farm cost (USDA, 2022). Improved FE could reduce the land use and other resources used for feed production (Lovendahl et al., 2018), which would help producers improve the overall production efficiency. In addition, improving FE improves the environmental sustainability of farming as more nutrients are directed toward milk production instead of being lost in manure and methane production (Basarab et al., 2013).
Residual feed intake (RFI) has been identified as one of the suitable traits for use in selection programs to improve FE (Stephansen et al., 2023). RFI is a heritable (Tempelman and Lu, 2020) trait and is defined as the difference between an animal’s actual feed intake and its expected intake calculated from different energy sinks (e.g., milk production, body weight, and changes in body weight) (Tempelman et al., 2015; VandeHaar et al., 2016). Efficient animals are those that consume less than expected and have negative RFI values, whereas inefficient animals consume more than expected and have positive RFI values. The reduced intake of low-RFI dairy cows has important implications for on-farm profitability; given the strong relationship between intake and methane emission (Mills et al., 2003), selection of low-RFI cows has also been described as an opportunity to positively impact methane emission reduction (Knapp et al., 2014).
Improvements in the net FE have been limited by the high costs and difficulties associated with measuring individual feed intake. Recording of individual feed intake is generally restricted to research farms and nucleus breeding herds, for which the available data are limited. Genomic selection allows the inclusion of important economic traits that are difficult to measure in breeding programs that could be cumulative across generations (Pryce et al., 2015; Li et al., 2020). RFI has been included in the lifetime net merit index used to evaluate dairy cows in the United States for total genetic merit in the national genetic evaluation (Li et al., 2020; VanRaden et al., 2021). Although genomic selection is an appealing method to estimate the breeding values of FE, collecting accurate phenotypes to create a large reference population and provide high-accuracy predictions on such a population is challenging (Pryce et al., 2015).
The cost of raising dairy heifers constitutes approximately 25% of the total production expenses on a farm, with the feed costs accounting for roughly 50% of the overall expenditure for heifer rearing (Akins and Science, 2016). Numerous studies have documented that selection for RFI in heifers can persist as they mature into cows (Davis et al., 2014; Macdonald et al., 2014). However, a study by Connor et al. (2019) revealed a modest phenotypic correlation of only 0.37 between the RFI of growing heifers and their subsequent RFI as lactating cows in the United States during the first 100 days of lactation. Furthermore, Pryce et al. (2014a) reported lower accuracy of genomic estimated breeding values (GEBVs) for the dry-matter intake (DMI) of cows when heifers were used as the reference population and higher accuracy when using lactating cows as the reference population.
To develop a comprehensive selection strategy for enhancing the overall FE in dairy farming, it is imperative to obtain accurate genetic and phenotypic correlation estimates between the RFI of growing heifers and lactating cows. Thus, the long-term goal of this study is to improve dairy FE. The main objectives of this study are as follows: i) to estimate the genetic parameters of RFI and its component traits in Holstein cows in the United States, ii) to develop a system for genomic evaluation for RFI in Holstein cows in the United States, and iii) to explore the associations between the RFI values of heifers and cows.
2 Materials and Methods
This study did not require approval from an Animal Care Committee because all required information was obtained from preexisting databases.
2.1 Data and phenotypes for heifers
The animal management, diets, data collection, and data quality control procedures were as described in Khanal et al. (2023). In brief, data were collected from 7,623 growing Holstein heifers across 204 trials conducted between 2014 and 2024 at the STgenetics Ohio Heifer Center (South Charleston, Ohio). Upon reaching 6 to 8 months of age, the heifers were moved to the feed conversion testing facility and placed in warm-up pens, where they began adaptation to a corn-silage-based test ration (Net energy gain; NEG = 0.95 Mcal/kg Dry matter (DM); Crude protein (CP) = 12.0% DM). During adaptation, the heifers were evaluated for health and body size to establish groups of 40–64 animals exhibiting good health and adequate body sizes to freely consume feed from specialized feed bunks in the testing pens. Once a group was established, they were moved to a testing pen equipped with eight electronic feed bunks (GrowSafe Systems Ltd., Airdrie, AB, Canada). Once the heifers consumed the test rations for a minimum of 21 d, the feed intake and performance were measured daily for a minimum of 70 d. Throughout the adaptation and testing periods, the heifers were allowed ad libitum access to feed and clean drinking water. During each trial, the body weight (BW) was recorded using a chute weighing system (Tru-Test Inc., Mineral Wells, TX, United States) either biweekly (every 2 weeks) or twice during the first and last weeks of the testing period. For each animal, the DMI was recorded daily during the testing period. Individual feed intake was then computed using a subroutine of GrowSafe 4000E software, as described by Parsons et al. (2020). A linear regression of the serial BW on the day of the trial was calculated for each animal using JMP (SAS Inst. Inc., Cary, NC, United States) to determine the average daily gain (ADG) (Williams et al., 2011). The average DMI and metabolic BW (MBW) were determined as the averages of all daily DMI and MBWs over the measurement period, respectively. RFI was then computed for each trial as the difference between the actual and predicted DMI values using the following model:
where
2.2 Data and phenotypes for lactating cows
Data were collected from 2,538 first (n = 2,118) and second (n = 420) lactation Holsteins cows between 2020 and 2024 at the STgenetics Ohio Heifer Center. Upon calving, the cows were placed in pens equipped with automatic milking systems (AMS; Lely Astronaut A5). Upon reaching 100 days of lactation, the cows were moved to two pens (225 head capacity per pen) equipped with 84 electronic feed intake bunks (GrowSafe Systems Ltd., Airdrie, AB, Canada). Individual animal records for the DMI, milk yield (MY), milk fat percentage (F%), milk protein percentage (P%), and BW were recorded daily from 100 to 240 days of lactation. Throughout the trials, the cows were fed a corn-silage-based ration (NEl = 1.65 Mcal/kg; CP = 13.7%) and clean drinking water ad libitum. Only those cows that were determined to be ≥90% Holstein through genomic testing were included in this study, and all the cows were housed in free stall barns with no access to pasture.
The individual animal feed intake was computed using a subroutine of the GrowSafe 8000E software (process feed intakes), as described by Parsons et al. (2020). The MY, milk components, and BW data were recorded for each milking and transformed into daily values per cow using the AMS software. Energy-corrected milk (ECM) was then calculated as outlined by Orth (1992):
If more than one lactation record was available for a given animal, only the records from the first lactation were used. The animal records were removed if an animal had less than 30 daily records of BW, DMI, or ECM available between 100 and 240 days of lactation. Then, the daily BW, DMI, and ECM records were included or excluded for individual animals based on residuals from the linear regression of BW, DMI, or ECM on the days of lactation for each animal if the values were more than three standard deviations (SD) above or below the mean residuals with one exception, i.e., the residual was greater or lower than three SDs for both DMI and MY in the same direction. This exception was allowed to include the obvious biological outliers in the data. Less than 5% of the daily BW, DMI, and ECM records were removed as outliers in this study, and these exclusions were random throughout the testing period. When these data were removed, the remaining values were used in the linear regression estimation of trait based on days of lactation using JMP. The average BW, DMI, and ECM values were determined as the mean of all daily BW, DMI, and ECM records, respectively, over the measurement period. Change in the body weight (∆BW) of a cow was calculated as the difference in BW between the start and end of the trial (Pryce et al., 2015). Across both primiparous and multiparous cases, there were a total of 2,538 unique cows. A detailed summary of the average BW, DMI, ECM, F%, and P% values is presented in Table 2. Of the cows analyzed, 1,516 animals also had previous RFI phenotypes as heifers.
The statistical model used to estimate the RFI of a lactating cow was as follows:
where
2.3 Genetic information
Animals from the research and commercial herds were genotyped with the STgenetics 70k customized chip (VM2; proprietary information). Quality control procedures were then applied by removing the sex chromosomes and single-nucleotide polymorphisms (SNPs) that had call rates of less than 95% or minor allele frequencies less than 5% and all animals with SNP call rates less than 95%. As a result, a total of 61,283 SNPs remained for the downstream analyses. Next, the genotypes were prephased using Eagle v2.4.1 (Loh et al., 2016). Then, minimac 4.1.0.2 (Das et al., 2016) was used to impute the missing genotypes. The imputed VCF files were then converted to plink files.
2.4 Estimation of variance components
Univariate analyses were performed to estimate the heritabilities of RFI and its component traits (DMI, BW, and ECM) for the lactating cows using LMT software (Boerner, 2022). The variance components were estimated using the following model:
where
The RFI was modeled only as a function of the genetic effects (a), second residual (e), and overall mean (µ) to estimate the variance components because the other effects are already accounted for in the estimation of the RFI.
2.5 Genomic prediction of lactating cows
Genomic prediction was performed in a two-step approach. The variance components obtained from the pedigree relationship matrix were fixed, and the genomic relationship matrix G was created according to VanRaden (2008) and used to estimate the genomic breeding values. Here, G =
where
To illustrate the validity of the predicted breeding values on other populations with different relatedness to the training population, we selected four groups of prediction populations from commercial partner herds, with 5,000 animals in each group based on genetic relationship with the training population. Here, Group 1 includes animals that share the same sires as those of the training population, Group 2 includes animals that only share the same grandsires but not sires as those of the training population, Group 3 includes animals that only share the same great-grandsires but not sires and grandsires as those of the training population, and Group 4 includes animals that do not share sires, grandsires, or great-grandsires as those of the training population. To investigate the impact of genetic distancing from the training population on the reliabilities of the predicted breeding values, we estimated the number of close relatives in the training population for each animal in the defined groups. We assumed close relatives with genomic relationship values of 0.45 or more, which is equivalent to a first-degree relationship (e.g., 0.5 for parent–offspring or full siblings), by accounting for an estimation error of ±0.05. The associations between reliability and estimated number of close relatives was then evaluated through a non-linear regression analysis.
2.6 Association between RFI of heifers and lactating cows
Bivariate analyses (RFIheifer, RFIcow) were performed among the animals having phenotypes of both RFIheifer and RFIcow to estimate the genetic correlations between i) RFI of heifers and cows with first lactation (n = 1,360) as well as ii) RFI of heifers and cows with both first and second lactations (n = 1,516). The variance components from the bivariate analysis were obtained using the following model:
where
3 Results and discussion
3.1 Phenotypic data
Summary statistics of the RFI of heifers and its component traits averaged over the trial period are summarized in Table 1, and the corresponding data for the lactating cows grouped by parity are presented in Table 2. A histogram of the RFI for all cows (Figure 1) shows that RFI is normally distributed and ranges from −9.75 to 9.67 kg/d. The observed phenotypic SD of RFIcow was 1.85 kg of DM/d (8.5% of average DMI), which is in agreement with the values reported by Connor et al. (2013) (1.63 kg of DM/d or approximately 7% of average DMI) and Cavani et al. (2022) (1.99 kg of DM/d or approximately 7% of average DMI) in US Holstein lactating cows. Notably, the SD of RFI in lactating cows is more than twice the phenotypic SD of RFIheifer (0.86 kg of DM/d, Khanal et al. (2023)).
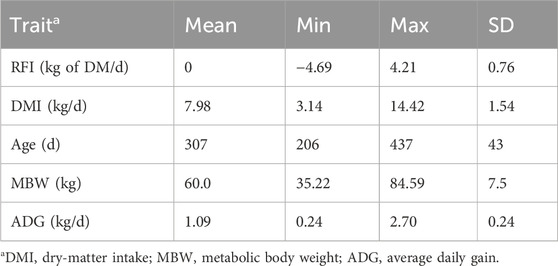
Table 1. Summary statistics of the residual feed intake (RFI) values of heifers and the component traits averaged over the trial period.
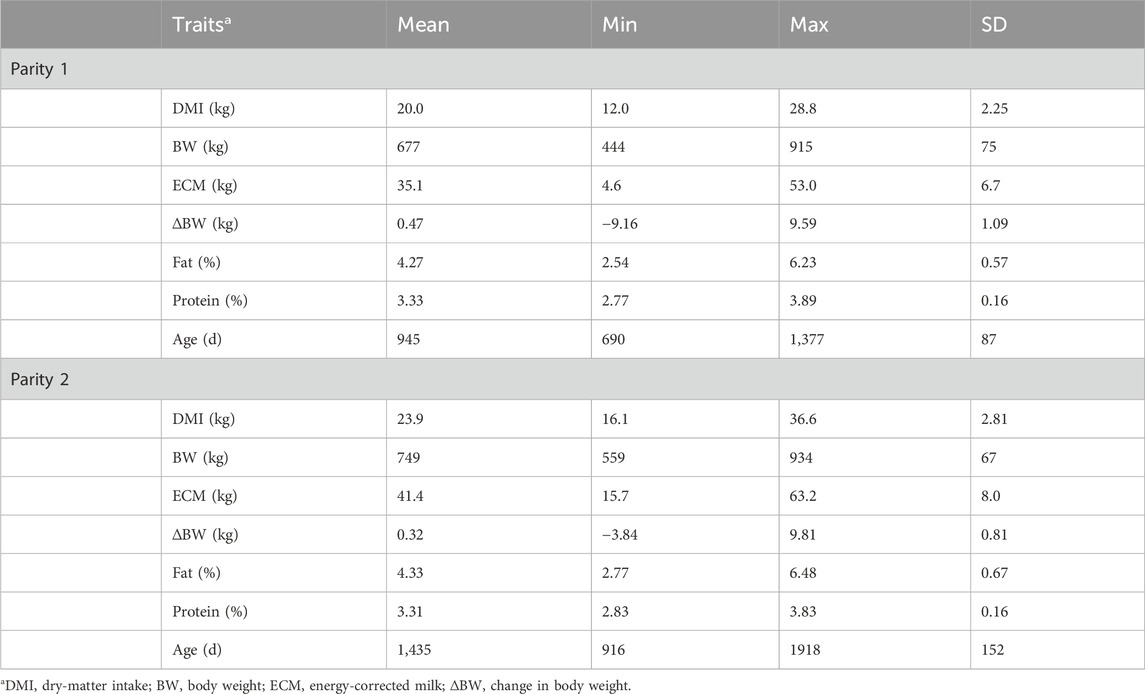
Table 2. Summary statistics by parity of the component traits of residual feed intake of lactating cows averaged over the trial period.
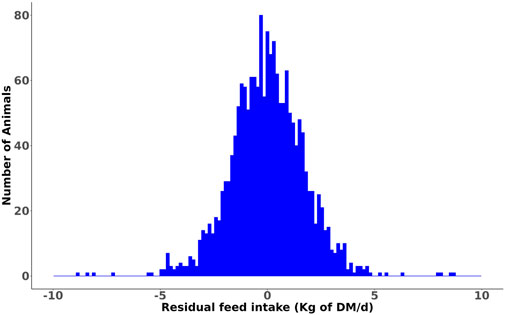
Figure 1. Distribution of the phenotypic residual feed intake (RFI) values of lactating cows.
To illustrate the significant level of variance in the RFI within our cow population and highlight the potential value of selecting high-performing animals, we compared the top and bottom 10% of cows for RFI, as shown in Table 3. The average RFI for the most efficient and least efficient first-parity cows were −2.26 kg and 2.37 kg of DM/d, respectively (difference of 4.6 kg of DMI/d/cow), and those for second-parity cows were −2.43 kg and 2.61 kg of DM/d, respectively (difference of 5.0 kg of DMI/d/cow). These results show the large phenotypic variations in RFI that could be used for genetic selection among Holstein cows. As expected, there was a significant difference (p < 0.001) in DMI between the most and least efficient cows (17.30 vs. 23.30 kg/d for first lactation and 20.40 vs. 27.50 kg/d for second lactation); however, there were no differences in ECM, BW, and ΔBW values between the cows with divergent RFI. This result is attributed to the fact that these variables were already accounted for in the model to estimate the RFI. There were no differences in the MYs, fat and protein concentrations, and ages of first calving between cows with divergent RFI. Similar results have been reported for heifers analyzed at the same research station (Khanal et al., 2023). These results demonstrate the independence of RFI with respect to production, body size, and growth performance as well as the potential ability to select for improved FE independent of all other important production traits. However, it should be noted that the model used to derive RFIcow in this study did not include all the potential energy sinks, such as physiological growth in pregnancy, body condition score, change in the body condition score, or energy spent through locomotion or movement.
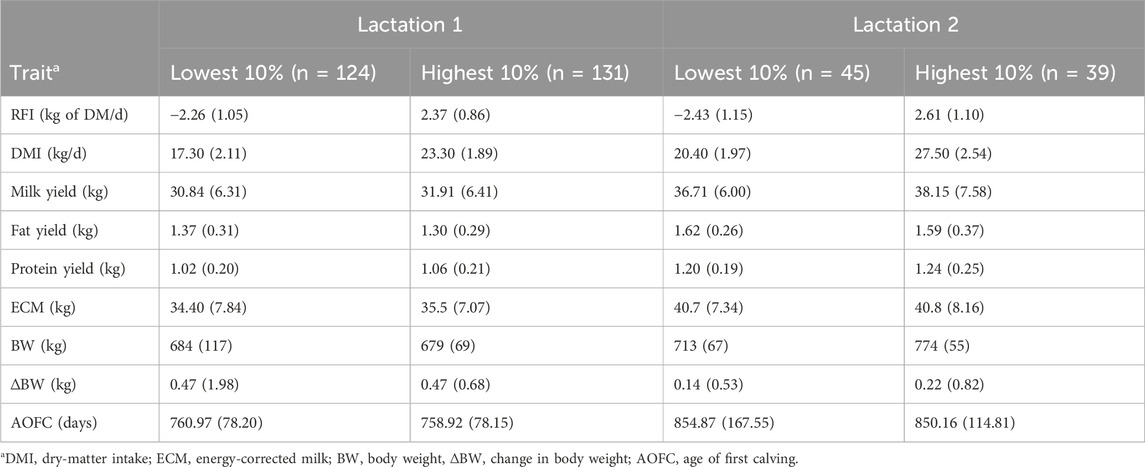
Table 3. . Characteristics in terms of average (SD) of 10% of the lactating cows across lactations with the lowest (most efficient) and highest (less efficient) residual feed intake (RFI) rankings.
3.2 Genetic parameters
The variance components, heritability, and SE estimates from the univariate analyses of RFIcow, DMI, ECM, and BW are presented in Table 4. The estimated heritability of DMI was 0.44 ± 0.04, similar to those of other FE studies that range from 0.28 to 0.57 for different cattle breeds (Manzanilla Pech et al. (2014) for Dutch Holstein; Negussie et al. (2019) for Nordic Red; Khanal et al. (2022) for US Holstein). The estimated heritability of ECM was 0.40 ± 0.04, which was within the range of results reported in the literature for Holstein cows as ranging from 0.2 (Manzanilla Pech et al., 2014) to 0.46 (Khanal et al., 2022). Similarly, the estimated heritability of BW was 0.46 ± 0.04, which was in agreement with previous results reported by Manzanilla Pech et al. (2014) (0.38) and Khanal et al. (2022) (0.67). Lastly, the estimated heritability for RFIcow was 0.43 ± 0.08, which aligns with the result of 0.36 ± 0.06 reported by Connor et al. (2013) across the entire lactation.

Table 4. Heritability estimates (±SE) of the residual feed intake (RFI) and its component traits in lactating Holstein cows.
It should be noted that the RFI in the current study was based on average feed intake from all records collected during the experimental period, which decreased the noise across the testing period and likely yielded a slightly higher heritability. Indeed, weekly heritability estimates of the RFI in US Holstein cows reported in previous studies (Lu et al., 2015; Li et al., 2017, 2020) were lower and ranged from 0.14 to 0.29. Moreover, our data were collected from a single research station, as opposed to multiple research stations in other studies, which could be another reason for having less noise in the data and higher heritability. Heritabilities of the lactation-wise (or averaged) measures should be greater than those of their individual daily or weekly data, especially if the genetic and permanent environmental correlations between different DIMs for the corresponding traits deviate substantially from unity (Khanal et al., 2022). Different studies (Manzanilla Pech et al., 2014; Li et al., 2017; Negussie et al., 2019) have reported that the genetic correlations for DMI, ECM, and RFI across different DIMs deviate substantially from unity. The moderate heritability of RFIcow in our study suggests that the RFI can be used in dairy cattle breeding to improve FE.
3.3 Genomic prediction of lactating cows
The GEBVs and their reliabilities for RFIcow were estimated for different groups of animals with different genetic distances between the training and predicted populations. The distributions of the GEBVs and reliabilities are presented in Figure 2. The SD and range of GEBVs of the training population were higher than those of different groups of the prediction populations (0.68 kg vs. 0.57 kg and −2.14 to 3.14 kg vs. −2.23 to 2.37 kg). The average reliability of the training population was 14% higher than that of the prediction populations. As expected, the average reliability of the prediction populations decreased from Group 1 that shared sires with the training population to Group 4 that was at least four generations removed from the genetic base of the training population. The decrease in reliability from Group 1 to Group 4 was due to the increase in relationship distance with the training population. Lower reliability for animals that were distant from the reference population was also reported by Li et al. (2020) in US Holstein bulls and Khanal et al. (2023) in US Holstein heifers. The reductions in average reliability compared to the training population were 18.2%, 31.8%, 36.4%, and 38.6% for Groups 1–4, respectively (Figure 2). These reductions were explained adequately by genetic distancing with the training population (Figure 3). Despite the small effective population size of the Holstein breed (Makanjuola et al., 2020;
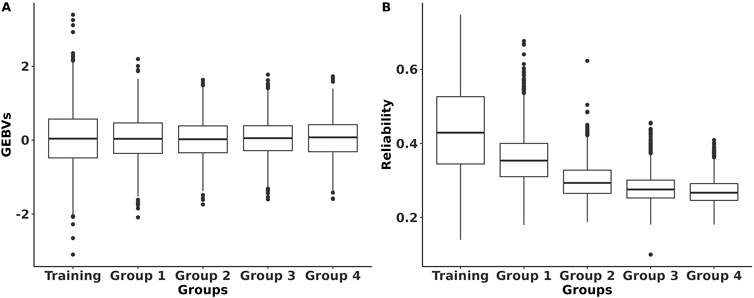
Figure 2. Distribution of the genomic estimated breeding values (GEBVs) and their reliabilities of RFI for Holstein lactating cows for different population groups. Training refers to the population with both genotypes and phenotypes; Panel (A) Group 1 includes animals that share the same sires as those of the training population Panel (B); Group 2 includes animals that only share the same grandsires but not sires as those of the training population; Group 3 includes animals that only share the same great-grandsires but not sires and grandsires as those of the training population; Group 4 includes animals that do not share sires, grandsires, and great-grandsires as those of the training population.
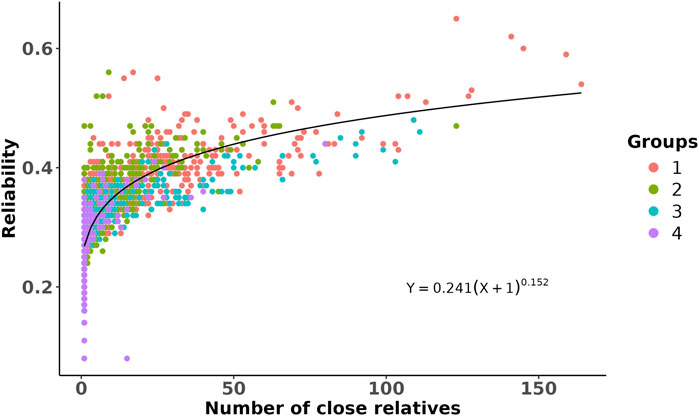
Figure 3. Scatter plot of the reliability of genomic prediction as a function of the number of close relatives that the predicted animals had with the training population. Each dot is an animal from a given prediction group (represented by different colors and as described in Figure 2), and its close relatives were defined on the basis of genomic relationship >0.45. The line shows a non-linear regression fitted to the data by assuming a power curve model.
Owing to the limited data size, the average genomic reliability of RFI for the prediction population in our research was slightly lower (∼30%) than the current traits included in the lifetime net merit (NM$) index for Holstein cattle in the US (VanRaden et al., 2021). Despite the limited data size, the average genomic reliability of RFI in our study was comparable to those reported in Australia (∼40%) and US (∼18%) national genetic evaluations for Holstein cows (Pryce et al., 2014b; Li et al., 2020; Gaddis et al., 2021). The size of the training population and its relationship with the prediction population play significant roles in the reliability estimates. Therefore, efforts should focus on increasing the number of individuals in the training population, i.e., collecting more feed intake data. Collection of feed intake data should be a continual effort to prevent reductions in genomic prediction reliabilities owing to the distant relationships between currently recorded cows and future commercial animals.
3.4 Association between RFI of heifers and lactating cows
To evaluate the potential genetic differences in RFI values among heifers and different lactations of cows, we estimated the genetic correlations between the RFI of heifers and first lactation cows and the RFI of heifers and all cows (both first and second lactations). The estimated genetic correlations for RFI were 0.42 ± 0.08 between heifers and first lactation cows as well as 0.34 ± 0.06 between heifers and all cows. The genetic correlations in our study were lower than those reported by Pryce et al. (2015) and Bolormaa et al. (2022) in Australian cattle populations (0.67 and 0.47). However, both research groups reported high SEs, where the mean value indeed decreased with the addition of more animals in the analysis conducted by Bolormaa et al. (2022). Connor et al. (2019) reported a phenotypic correlation of 0.37 between the RFI values of growing heifers and cows in the US.
Our results show that the underlying genetic components of RFI are not fully carried over across the stages of life and that there is reranking of individuals when comparing the RFI values for heifers and lactating cows. Out of the 1,516 animals that had phenotypes of both RFIheifer and RFIcow, we ranked heifers as the least (upper 10%; n = 155), medium (between 80%; n = 1,210), or most efficient (lower 10%; n = 151) according to the breeding values of RFIheifer. We found that 20.5%, 75%, and 4.5% of the most efficient heifers were ranked as most, medium, and least efficient as lactating cows, respectively. Conversely, 3%, 72%, and 25% of the least efficient heifers were ranked as most, medium, and least efficient as lactating cows, respectively. In essence, when examining the two extreme groups, only 4.5% of the high-performing group as heifers were classified within the bottom 10% as cows, while 3% of the least efficient animals as heifers were identified to be among the top 10% as cows. Similar results of reranking were reported in previous studies (Macdonald et al., 2014; Connor et al., 2019). Our results show that the genetic components of RFI of the heifers were not fully carried over as they matured into lactating cows. This indicates that evaluating the FE over a lifetime requires consideration of the varying energy needs at different life stages. Therefore, to select individuals based on the lifetime feed conversion efficiency, a comprehensive study involving the RFI of growing heifers and lactating cows is necessary.
3.5 Implications
Previous research (Tempelman et al., 2015; VandeHaar et al., 2016) has indicated RFI as a trait for selection as it has a direct impact on two major issues affecting the dairy industry today, namely feed cost and greenhouse gas emissions. The findings from our research support the conclusion that low-genomic-RFI dairy females were found to have reduced DMI with no impacts on other economically relevant traits. Given the strong associations between DMI and CH4 emissions (de Haas et al., 2012; Richardson et al., 2021), reduction of the DMI with no impact on productivity will result in reduced CH4 emissions from the animals. Utilizing equations published by the Intergovernmental Panel on Climate Change (IPCC 2019), improving the RFI of cows and heifers by 1 SD of GEBVs (RFIheifer SD = 0.28 kg/d; RFIcow SD = 0.57 kg/d) could reduce emissions by 422 kg of CO2 across their lifetime. Therefore, selection for RFI has significant implications for helping the industry achieve various emission reduction targets.
Reduced DMI achieved from selection for RFI also aids in driving on-farm profitability as the feed costs account for over 50% of the total input costs (USDA, 2022). By reducing the input costs and maintaining the output revenues, farmers can directly impact their net profits. If a farmer achieves a 1 SD improvement in heifer and cow RFI, they can reduce feed costs by $251.00 per animal based on the ration costs of US$263/ton DM for heifers and US$381/ton DM for cows, assuming a heifer rearing period of 580 d and productive life of 854 d for cows. While the lactating cow period has a higher economic impact on the net profit of a farm, ignoring the feed costs associated with heifer RFI would reduce the lifetime feed cost savings by US$ 38.70 per cow. Accordingly, by combining selection for both heifer and cow RFI, producers can maximize their feed and greenhouse gas savings while continuing to drive selection for output traits, such as MY as well as fat and protein percentages, for sustainable farming.
4 Conclusions
We explored the genetic basis of RFI and estimated its genetic parameters and component traits for Holstein cows in the US. The heritability of RFI of lactating cows was high, which indicated the possibility of selection of efficient animals. The mean reliability of RFI of lactating cows was low; however, we expect that this will improve as we strategically increase the number of RFI phenotypes from the relatives of elite bulls that have greater contribution to the training population. We found a low genetic correlation of RFI between cows and heifers; this indicates that the underlying genetic control of RFI is not fully carried over to different stages of life owing to differing energy requirements. We would recommend considering the RFI of growing heifers in addition to those of lactating cows in the genetic evaluation system to select highly feed-efficient animals on a lifetime basis.
Data availability statement
The datasets presented in this article are not readily available because the feed efficiency databases maintained by STgenetics are not publicly available. Requests to access the datasets should be directed to am9zZXBoLmRlZWJAc3RnZW4uY29t.
Ethics statement
Ethical approval was not required for the study involving animals in accordance with the local legislation and institutional requirements because all required information was obtained from preexisting databases.
Author contributions
PK: writing–review and editing, writing–original draft, visualization, software, project administration, methodology, formal analysis, data curation, and conceptualization. JJ: writing–review and editing, validation, and data curation. GG: writing–review and editing, methodology, and formal analysis. AU: data curation, methodology, validation, and writing–review and editing. PR: writing–review and editing, supervision, investigation, and conceptualization. ND: writing–review and editing, supervision, project administration, investigation, and conceptualization.
Funding
The authors declare that no financial support was received for the research, authorship, and/or publication of this article.
Acknowledgments
This research was conducted as a part of the authors’ employment with STgenetics (Navasota, TX).
Conflict of interest
Authors PK, JJ, GG, AU, PR and ND are employed by STgenetics, Navasota, TX, United States.
Publisher’s note
All claims expressed in this article are solely those of the authors and do not necessarily represent those of their affiliated organizations or those of the publisher, editors, and reviewers. Any product that may be evaluated in this article or claim that may be made by its manufacturer is not guaranteed or endorsed by the publisher.
References
Akins, M. S., and Science, D. (2016). Dairy heifer development and nutrition management. Vet. Clin. North Am. Food Anim. Pract. 32, 303–317. doi:10.1016/j.cvfa.2016.01.004
Basarab, J. A., Beauchemin, K. A., Baron, V. S., Ominski, K. H., Guan, L. L., Miller, S. P., et al. (2013). Reducing GHG emissions through genetic improvement for feed efficiency: effects on economically important traits and enteric methane production. Animal 7, 303–315. doi:10.1017/S1751731113000888
Boerner, V. (2022). “One for all: LMT - the linear models toolbox,” in Proceedings of 12th world congress on genetics applied to livestock production (WCGALP) (Academic Publishers), 1526–1529.
Bolormaa, S., MacLeod, I. M., Khansefid, M., Marett, L. C., Wales, W. J., Nieuwhof, G. J., et al. (2022). Evaluation of updated Feed Saved breeding values developed in Australian Holstein dairy cattle. JDS Commun. 3, 114–119. doi:10.3168/jdsc.2021-0150
Cavani, L., Brown, W. E., Gaddis, K. L. P., Tempelman, R. J., VandeHaar, M. J., White, H. M., et al. (2022). Estimates of genetic parameters for feeding behavior traits and their associations with feed efficiency in Holstein cows. J. Dairy Sci. doi:10.3168/JDS.2022-22066
Connor, E. E., Hutchison, J. L., Norman, H. D., Olson, K. M., Van Tassell, C. P., Leith, J. M., et al. (2013). Use of residual feed intake in Holsteins during early lactation shows potential to improve feed efficiency through genetic selection. J. Animal Sci. 91, 3978–3988. doi:10.2527/JAS.2012-5977
Connor, E. E., Hutchison, J. L., Van Tassell, C. P., and Cole, J. B. (2019). Defining the optimal period length and stage of growth or lactation to estimate residual feed intake in dairy cows. J. Dairy Sci. 102, 6131–6143. doi:10.3168/jds.2018-15407
Das, S., Forer, L., Schönherr, S., Sidore, C., Locke, A. E., Kwong, A., et al. (2016). Next-generation genotype imputation service and methods. Nat. Genet. 48 (10 48), 1284–1287. doi:10.1038/ng.3656
Davis, S. R., Macdonald, K. A., Waghorn, G. C., and Spelman, R. J. (2014). Residual feed intake of lactating Holstein-Friesian cows predicted from high-density genotypes and phenotyping of growing heifers. J. Dairy Sci. 97, 1436–1445. doi:10.3168/jds.2013-7205
de Haas, Y., Calus, M. P. L., Veerkamp, R. F., Wall, E., Coffey, M. P., Daetwyler, H. D., et al. (2012). Improved accuracy of genomic prediction for dry matter intake of dairy cattle from combined European and Australian data sets. J. Dairy Sci. 95, 6103–6112. doi:10.3168/jds.2011-5280
Gaddis, K., VanRaden, P., Tempelman, R., Weigel, K., White, H., Peñagaricano, F., et al. (2021). Implementation of feed saved evaluations in the U.S. Interbull Bull., 147–152.
Khanal, P., Johnson, J., Gouveia, G., Ross, P., and Deeb, N. (2023). Genomic evaluation of feed efficiency in US Holstein heifers. J. Dairy Sci. 106, 6986–6994. doi:10.3168/jds.2023-23258
Khanal, P., Parker Gaddis, K. L., Vandehaar, M. J., Weigel, K. A., White, H. M., Peñagaricano, F., et al. (2022). Multiple-trait random regression modeling of feed efficiency in US Holsteins. J. Dairy Sci. 105, 5954–5971. doi:10.3168/JDS.2021-21739
Knapp, J. R., Laur, G. L., Vadas, P. A., Weiss, W. P., and Tricarico, J. M. (2014). Invited review: enteric methane in dairy cattle production: quantifying the opportunities and impact of reducing emissions. J. Dairy Sci. 97, 3231–3261. doi:10.3168/JDS.2013-7234
Li, B., Berglund, B., Fikse, W. F., Lassen, J., Lidauer, M. H., Mäntysaari, P., et al. (2017). Neglect of lactation stage leads to naive assessment of residual feed intake in dairy cattle. J. Dairy Sci. 100, 9076–9084. doi:10.3168/jds.2017-12775
Li, B., VanRaden, P. M., Guduk, E., O’Connell, J. R., Null, D. J., Connor, E. E., et al. (2020). Genomic prediction of residual feed intake in US Holstein dairy cattle. J. Dairy Sci. 103, 2477–2486. doi:10.3168/jds.2019-17332
Loh, P.-R., Danecek, P., Palamara, P. F., Fuchsberger, C., Reshef, Y. A., Finucane, H. K., et al. (2016). Reference-based phasing using the haplotype reference consortium panel. Nat. Genet. 48, 1443–1448. doi:10.1038/ng.3679
Lovendahll, P., Difford, G. F., Li, B., Chagunda, M. G. G., Huhtanen, P., Lidauer, M. H., et al. (2018). Review: selecting for improved feed efficiency and reduced methane emissions in dairy cattle. Animal 12, s336–s349. doi:10.1017/S1751731118002276
Lu, Y., Vandehaar, M. J., Spurlock, D. M., Weigel, K. A., Armentano, L. E., Staples, C. R., et al. (2015). An alternative approach to modeling genetic merit of feed efficiency in dairy cattle. J. Dairy Sci. 98, 6535–6551. doi:10.3168/jds.2015-9414
Macdonald, K. A., Pryce, J. E., Spelman, R. J., Davis, S. R., Wales, W. J., Waghorn, G. C., et al. (2014). Holstein-Friesian calves selected for divergence in residual feed intake during growth exhibited significant but reduced residual feed intake divergence in their first lactation. J. Dairy Sci. 97, 1427–1435. doi:10.3168/jds.2013-7227
Makanjuola, B. O., Miglior, F., Abdalla, E. A., Maltecca, C., Schenkel, F. S., and Baes, C. F. (2020). Effect of genomic selection on rate of inbreeding and coancestry and effective population size of Holstein and Jersey cattle populations. J. Dairy Sci. 103, 5183–5199. doi:10.3168/JDS.2019-18013
Manzanilla Pech, C. I. V., Veerkamp, R. F., Calus, M. P. L., Zom, R., van Knegsel, A., Pryce, J. E., et al. (2014). Genetic parameters across lactation for feed intake, fat- and protein-corrected milk, and liveweight in first-parity Holstein cattle. J. Dairy Sci. 97, 5851–5862. doi:10.3168/jds.2014-8165
Meyer, K., and Houle, D. (2013) “Sampling based approximation of confidence intervals for functions of genetic covariance matrices,” in Proceedings of the twentieth conference of the association for the advancement of animal breeding and genetics, translating science into action. New Zealand: Napier, 523–526.
Mills, J. A. N., Kebreab, E., Yates, C. M., Crompton, L. A., Cammell, S. B., Dhanoa, M. S., et al. (2003). Alternative approaches to predicting methane emissions from dairy cows. J. Animal Sci. 81, 3141–3150. doi:10.2527/2003.81123141X
Negussie, E., Mehtiö, T., Mäntysaari, P., Løvendahl, P., Mäntysaari, E. A., Lidauer, M. H., et al. (2019). Reliability of breeding values for feed intake and feed efficiency traits in dairy cattle: when dry matter intake recordings are sparse under different scenarios. J. Dairy Sci. 102, 7248–7262. doi:10.3168/jds.2018-16020
Orth, R. (1992). Sample day and lactation report. DHIA 200 FactSheet A-2. Ames, IA: Mid-States Dairy Records Processing Center.
Parsons, I. L., Johnson, J. R., Kayser, W. C., Tedeschi, L. O., and Carstens, G. E. (2020). Characterization of feeding behavior traits in steers with divergent residual feed intake consuming a high-concentrate diet. J. Animal Sci. 98, skaa189. doi:10.1093/JAS/SKAA189
Pryce, J. E., Gonzalez-Recio, O., Nieuwhof, G., Wales, W. J., Coffey, M. P., Hayes, B. J., et al. (2015). Hot topic: definition and implementation of a breeding value for feed efficiency in dairy cows. J. Dairy Sci. 98, 7340–7350. doi:10.3168/jds.2015-9621
Pryce, J. E., Gonzalez-Recio, O., Thornhill, J. B., Marett, L. C., Wales, W. J., Coffey, M. P., et al. (2014a). Short communication: validation of genomic breeding value predictions for feed intake and feed efficiency traits. J. Dairy Sci. 97, 537–542. doi:10.3168/jds.2013-7376
Pryce, J. E., Wales, W. J., De Haas, Y., Veerkamp, R. F., and Hayes, B. J. (2014b). Genomic selection for feed efficiency in dairy cattle. Animal 8, 1–10. doi:10.1017/S1751731113001687
Richardson, C. M., Amer, P. R., Hely, F. S., van den Berg, I., and Pryce, J. E. (2021). Estimating methane coefficients to predict the environmental impact of traits in the Australian dairy breeding program. J. Dairy Sci. 104, 10979–10990. doi:10.3168/jds.2021-20348
Stephansen, R. B., Martin, P., Manzanilla-Pech, C. I. V., Gredler-Grandl, B., Sahana, G., Madsen, P., et al. (2023). Novel genetic parameters for genetic residual feed intake in dairy cattle using time series data from multiple parities and countries in North America and Europe. J. Dairy Sci. 106, 9078–9094. doi:10.3168/jds.2023-23330
Taylor, J. F. (2014). Implementation and accuracy of genomic selection. Aquaculture 420-421, S8–S14. doi:10.1016/J.AQUACULTURE.2013.02.017
Tempelman, R. J., and Lu, Y. (2020). Symposium review: genetic relationships between different measures of feed efficiency and the implications for dairy cattle selection indexes. J. Dairy Sci. 103, 5327–5345. doi:10.3168/jds.2019-17781
Tempelman, R. J., Spurlock, D. M., Coffey, M., Veerkamp, R. F., Armentano, L. E., Weigel, K. A., et al. (2015). Heterogeneity in genetic and nongenetic variation and energy sink relationships for residual feed intake across research stations and countries. J. Dairy Sci. 98, 2013–2026. doi:10.3168/jds.2014.8510
USDA (2022). ERS - milk cost of production estimates. Available at: https://www.ers.usda.gov/data-products/milk-cost-of-production-estimates/milk-cost-of-production-estimates/(Accessed August 24, 2022).
VandeHaar, M. J., Armentano, L. E., Weigel, K., Spurlock, D. M., Tempelman, R. J., and Veerkamp, R. (2016). Harnessing the genetics of the modern dairy cow to continue improvements in feed efficiency. J. Dairy Sci. 99, 4941–4954. doi:10.3168/jds.2015-10352
VanRaden, P. M. (2008). Efficient methods to compute genomic predictions. J. Dairy Sci. 91, 4414–4423. doi:10.3168/jds.2007-0980
VanRaden, P. M., Cole, J. B., Neupane, M., Toghiani, S., Gaddis, K. L., and Tempelman, R. J. (2021). Net merit as a measure of lifetime profit: 2021 revision.
Keywords: residual feed intake, dry-matter intake, energy-corrected milk, body weight, lactating cow, feed efficiency, genomic evaluation
Citation: Khanal P, Johnson J, Gouveia G, Utsunomiya ATH, Ross P and Deeb N (2024) Genomic evaluation of residual feed intake in US Holstein cows: insights into lifetime feed efficiency. Front. Genet. 15:1462306. doi: 10.3389/fgene.2024.1462306
Received: 09 July 2024; Accepted: 11 October 2024;
Published: 11 November 2024.
Edited by:
Sunday O. Peters, Berry College, United StatesReviewed by:
Zhuying Wei, University of Michigan, United StatesJuliana Petrini, Clinica do Leite Ltda, Brazil
Copyright © 2024 Khanal, Johnson, Gouveia, Utsunomiya, Ross and Deeb. This is an open-access article distributed under the terms of the Creative Commons Attribution License (CC BY). The use, distribution or reproduction in other forums is permitted, provided the original author(s) and the copyright owner(s) are credited and that the original publication in this journal is cited, in accordance with accepted academic practice. No use, distribution or reproduction is permitted which does not comply with these terms.
*Correspondence: P. Khanal, cGl1c2gua2hhbmFsQHN0Z2VuLmNvbQ==