 Zhengtao Luo1,2,3
 Qingyong Wang1,2,3
 Yingchun Xia1,2,3Xiaolei Zhu1,2,3
 Shuai Yang1,2,3Zhaochun Xu4,5*Lichuan Gu1,2,3*
- 1School of Information and Artificial Intelligence, Anhui Agricultural University, Hefei, Anhui, China
- 2Anhui Province Key Laboratory of Smart Agricultural Technology and Equipment, Hefei, Anhui, China
- 3Anhui Provincial Engineering Research Center for Agricultural Information Perception and Intelligent Computing, Anhui Agricultural University, Hefei, Anhui, China
- 4Computer Department, Jingdezhen Ceramic University, Jingdezhen, China
- 5School for Interdisciplinary Medicine and Engineering, Harbin Medical University, Harbin, China
Cysteine S-carboxyethylation, a novel post-translational modification (PTM), plays a critical role in the pathogenesis of autoimmune diseases, particularly ankylosing spondylitis. Accurate identification of S-carboxyethylation modification sites is essential for elucidating their functional mechanisms. Unfortunately, there are currently no computational tools that can accurately predict these sites, posing a significant challenge to this area of research. In this study, we developed a new deep learning model, DLBWE-Cys, which integrates CNN, BiLSTM, Bahdanau attention mechanisms, and a fully connected neural network (FNN), using Binary-Weight encoding specifically designed for the accurate identification of cysteine S-carboxyethylation sites. Our experimental results show that our model architecture outperforms other machine learning and deep learning models in 5-fold cross-validation and independent testing. Feature comparison experiments confirmed the superiority of our proposed Binary-Weight encoding method over other encoding techniques. t-SNE visualization further validated the model’s effective classification capabilities. Additionally, we confirmed the similarity between the distribution of positional weights in our Binary-Weight encoding and the allocation of weights in attentional mechanisms. Further experiments proved the effectiveness of our Binary-Weight encoding approach. Thus, this model paves the way for predicting cysteine S-carboxyethylation modification sites in protein sequences. The source code of DLBWE-Cys and experiments data are available at: https://github.com/ztLuo-bioinfo/DLBWE-Cys.
1 Introduction
Cysteine S-carboxyethylation (Zhai et al., 2023) is a unique post-translational modification in which the thiol group (-SH) of cysteine residues is modified by the addition of a carboxyethyl group (-CH2-COOH). This modification is triggered by the metabolic product 3-HPA and represents a novel protein modification mechanism. Researchers such as Zhai et al. (2023) have discovered that carboxyethylated ITGA2B can induce specific autoimmune responses by producing modified neoantigens. They also found carboxylated ITGA2B in peripheral blood mononuclear cells (PBMCs) from patients with rheumatoid arthritis (RA) and systemic lupus erythematosus (SLE). Therefore, investigating the role of cysteine S-carboxyethylation in the aetiology of these diseases, or whether it is merely a concomitant phenomenon, is crucial to understanding and treating these diseases.
Although mass spectrometry and modification-specific antibodies can identify cysteine S-carboxyethylation sites (Bern et al., 2012; Na and Paek, 2015; Yates, 2015), these methods are expensive and time consuming. There is an urgent need to develop computational methods to predict potential S-carboxyethylation sites in proteins. The advancement of machine learning and deep learning technologies has not only made significant strides in disease prediction and diagnosis (Zhang et al., 2023), personalized treatment planning (Chen et al., 2023), medical image analysis (Shen et al., 2017), and drug discovery (Drews, 2000), but also shown tremendous potential in predicting post-translational modification sites. This provides a solid theoretical foundation for constructing efficient models (Dou et al., 2021; Ertelt et al., 2024; Meng et al., 2022). Meanwhile, the use of high-throughput sequencing technologies and specific chemical probes has accumulated a large amount of relevant data, providing a data foundation for building predictive models (House et al., 2017; Rodriguez and Miller, 2014; Vanella et al., 2022). Unfortunately, as the modification of cysteine by S-carboxyethylation has only recently been discovered, there are currently no dedicated models for predicting these sites, which significantly increases the difficulty of the research.
In recent years, significant progress has been made in the field of protein modification site prediction, particularly in the prediction of S-palmitoylation, S-sulfenylation and S-nitrosylation sites. For example, GPS-Palm (Ning et al., 2021) combines CNNs with a novel graph representation system to predict S-palmitoylation sites, fastSulf-DNN (Do et al., 2021) uses word embeddings and deep neural networks to predict S-sulfenylation sites, and Mul-SNO (Zhao et al., 2022) combines BiLSTM and BERT technologies to accurately predict S-nitrosylation sites. These studies have significantly improved the accuracy and efficiency of predicting functional sites in proteins, and also provide a good reference for developing S-carboxyethylation site prediction models.
This study proposes an innovative deep learning model, DLBWE-Cys, which is the first model capable of effectively identifying cysteine S-carboxyethylation modification sites in protein sequences. The model employs a binary encoding method combined with positional weights as a feature representation and uses convolutional neural networks (CNNs), bidirectional long short-term memory networks (BiLSTMs), Bahdanau attention mechanisms, and fully connected networks for final prediction. Through this approach, the model effectively captures local information and enhances the recognition of key features to achieve accurate predictions. In the experimental part, our model, DLBWE-Cys, was compared with various machine learning and deep learning models in 5-fold cross-validation and independent test dataset. At the same time, we tested the impact of different feature extraction methods on model performance and visualised the best results using t-SNE dimensionality reduction techniques. In addition, we investigated the relationship between the weights assigned by the Bahdanau attention mechanism and the positional weights in our proposed Binary-Weight encoding. Finally, we compared the impact of binary encoding with and without positional weights on model performance.
2 Methods
2.1 Benchmark datasets
In the seminal study by Zhai et al. (2023), cysteine S-carboxyethylation was first identified as a novel post-translational modification (PTM) associated with autoimmune arthritis. To further investigate this unique protein modification, we carefully selected 960 sequences containing cysteine S-carboxyethylation as our positive samples for the study. To make our dataset more comprehensive, we also downloaded additional amino acid sequences from the NCBI database (https://www.ncbi.nlm.nih.gov/) to serve as negative samples, centered around cysteine (C). Both the positive and negative sample sequences were standardised to a length of 41 amino acids to ensure uniformity in our dataset. To increase the accuracy of our analysis and reduce data redundancy, we used the CD-HIT-SET (Li and Godzik, 2006) tool to eliminate 45% of duplicate sequences. In addition, to prevent the model from being overly biased towards a particular class, we constructed a balanced training set of 1,204 samples, with an equal number of positive and negative samples. During the fivefold cross-validation, we ensured that there were no overlapping protein types between the validation sets, thereby increasing the model’s ability to generalise. In addition, to better reflect real-world application scenarios, we created an independent test set consisting of a small number of positive samples and a larger number of negative samples, totalling 913 sequences with a ratio of 1:10. This independent test set was used to evaluate the generalisation performance of the model. Further details can be found in Table 1.
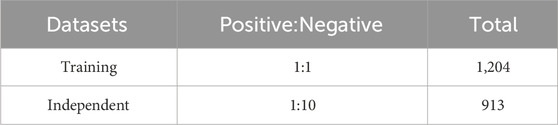
Table 1. Details of the datasets.
2.2 Binary-weight Encoding (BWE)
In this study, we explore the digital representation of protein sequence information, specifically through a binary encoding approach. It has also already been used in different types of PTM site prediction, including malonylation (Chung et al., 2020), acetylation (Basith et al., 2022), succinylation (Ning et al., 2018) and formylation (Sohrawordi and Hossain, 2022), because of its simplicity and effectiveness. Our focus is on protein sequences containing the 20 amino acids ‘ACDEFGHIKLMNPQRSTVWY’, assigning each amino acid a unique 20-dimensional feature vector. For instance, alanine (A) is encoded as ‘10000000000000000000′, cysteine (C) as ‘01000000000000000000′, and tyrosine (Y) as ‘00000000000000000001'.
To further enrich the expression of sequence information, we introduced the concept of positional weighting, inspired by the phenomenon of signal towers transmitting signals in a progressively diminishing manner, akin to 1D Gaussian Noising. Imagining the central position of the protein sequence as the signal source, we observed that the signal strength exponentially decays with increasing distance from the source. Based on this observation, we use the following formula to calculate the signal strength at each position in the sequence, thereby determining the weight of the amino acid at that position
where
Through this method, we not only retain the original information of the protein sequence but also introduce the relative importance of each amino acid position through positional weighting, effectively enhancing the expression of sequence information.
2.3 Framework overview
Here, we propose a novel predictive framework, DLBWE-Cys, based on CNN, BiLSTM, attention mechanisms, and FNN, which fuse protein sequence information to predict cysteine S-carboxyethylation sites. The model architecture consists of five main components, as shown in Figure 1. First, in the feature extraction module, we use the BWE method to convert protein sequences into a digital format recognizable by computers. Next, in the convolutional neural network (CNN) module, the features are fed into a network with two convolutional layers to extract local features of the protein sequence, followed by a max-pooling layer to reduce the dimensionality and computational complexity of the features.
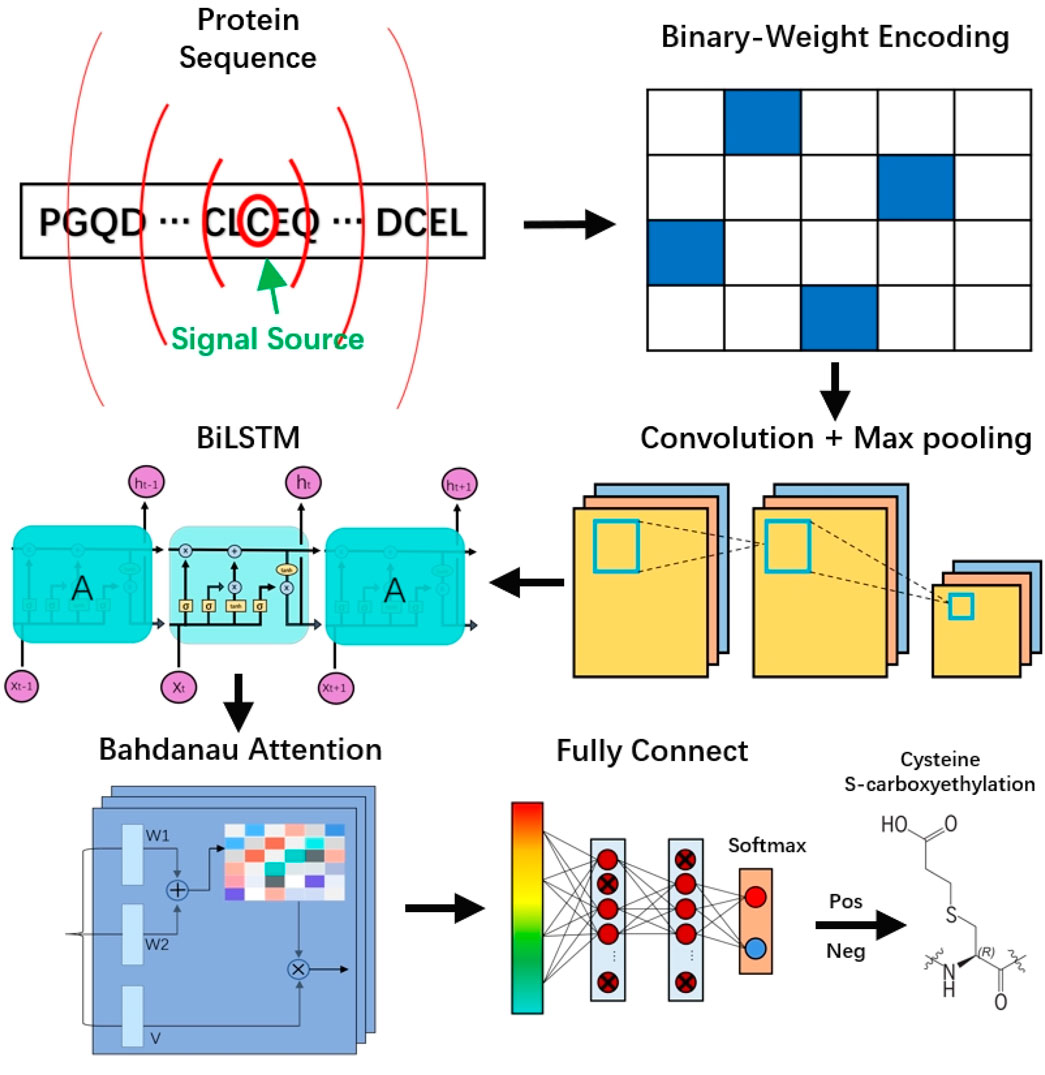
Figure 1. The workflow and architecture of DLBWE-Cys.
Then, in the bidirectional long short-term memory (BiLSTM) module, unlike traditional unidirectional LSTM, BiLSTM can capture the forward and backward contextual relationships, thus providing a more comprehensive understanding of the relationships between features. In addition, in the Bahdanau attention mechanism module, we build an attention layer with three functions (W1, W2, and V) to determine the relative importance of different features. Finally, in the prediction module, the system consists of two fully connected layers and a softmax activation function. Each fully connected layer uses dropout techniques to mitigate overfitting problems, and the softmax function is used to predict whether the target amino acid C undergoes S-carboxyethylation modification.
2.3.1 CNN module
We have configured the convolutional neural network module with two one-dimensional convolutional layers and a max-pooling layer. One-dimensional convolution works by applying filters to local regions of the sequence, capturing local dependencies within the sequence and thereby improving the performance of the network. Additionally, because one-dimensional convolution operates along only one dimension, it uses fewer parameters than two-dimensional convolution, making model training faster. The formula for the convolutional layer in the architecture is:
where
In addition, to further extract key features and reduce feature dimensionality, we have incorporated a max-pooling layer into the network. With this design, we not only retain important feature information but also effectively reduce the complexity of the model.
2.3.2 BiLSTM module
We use a bidirectional long short-term memory (BiLSTM) network layer to form the bidirectional long short-term memory module. BiLSTM is a unique type of recurrent neural network (RNN) that cleverly combines forward LSTM with backward LSTM, enabling it to consider both past and future information simultaneously (Hochreiter and Schmidhuber, 1997; Schuster and Paliwal, 1997). This network processes sequence information using the forward LSTM, while capturing backward temporal sequence information using the backward LSTM for a more complete understanding of context. LSTMs consist of three primary gates: the input gate, the forget gate, and the output gate, which control whether information is forgotten, stored, or passed on to the next time step.
Forget Gate:
Where
Input Gate:
Where
Cell State Update:
Where
Output Gate:
Where
The backward LSTM follows the same computational process as the forward LSTM, but it starts from the last element of the sequence and processes the information in reverse order, up to the first element. The BiLSTM combines the forward and backward hidden states at each time step by concatenating them (i.e.,
2.3.3 Bahdanau attention mechanism module
In our study, we have implemented an enhanced version of the Bahdanau attention mechanism (Bahdanau et al., 2014), which is designed to augment the decoder’s performance through dynamic attention to the input data (Lin and Wang, 2024). This mechanism learns to allocate weights to different encoder output features given the current state of the decoder. Specifically, we first apply linear transformations to the outputs of the BiLSTM at each timestep to obtain the intermediate vectors
Where
To scale down the differences between the weights, we use the softmax function to normalize the scores matrix, thereby obtaining the weights for each encoder output. Finally, by applying the attention scores as weights to the outputs of the BiLSTM, we obtain the final weighted feature matrix
Through this method, the Bahdanau attention mechanism not only deepens the model’s understanding of the input data but also enhances the decoder’s ability to focus on key information during the processing phase (Lee et al., 2020).
2.4 Performance measures
In our past experience we have used Accuracy (ACC), Matthews correlation coefficient (MCC) (Chicco et al., 2021), Sensitivity (SN) and Specificity (SE) to evaluate the performance of different models. These measures are defined as follows:
where TP, FN, TN, and FP stand for the numbers of true positives, false negatives, true negatives, and false positives, respectively. In addition, we often calculate the area under the receiver operating characteristic curve (AUROC) and the area under the precision-recall curve (AUPR) to assess predictive performance. Higher values of AUROC and AUPR indicate better predictive performance.
3 Results
3.1 Comparing different model architectures
To demonstrate the superior performance of our model architecture, we used training dataset from the ‘benchmark datasets’ described in Section 2.1 and employed the same feature representation method, Binary-Encoding, to compare against various model architectures. These comparisons included traditional machine learning models such as Random Forest (RF), Support Vector Machines (SVM), and Extreme Gradient Boosting (XGBoost), as well as deep learning models such as CNN, BiLSTM, and a combined CNN-BiLSTM model. To verify the stability of our models, we performed 10 iterations of 5-fold cross-validation and fine-tuned the parameters. Detailed configurations for each model can be found in Supplementary Note S1. Furthermore, to investigate the impact of the decay coefficient a on our model, we established two comparison groups: one with the decay coefficient applied to the data and another without its application. Our results show that the application of this coefficient consistently leads to superior performance compared to the group without it, as detailed in Supplementary Information S2.
Table 2 shows the aggregated results of the 5-fold cross-validation for each model after applying the decay coefficient, including the precision-recall (PR) curves and the receiver operating characteristic (ROC) curves. The results show that most models have a small standard deviation, indicating good fit and stability. The comparison shows that, on average, deep learning models outperform machine learning models on critical metrics. For example, compared to RF, the CNN model shows an average improvement of 7.54% in ACC, 15.47% in MCC, 7.14% in AUROC and 9.44% in AUPR; the BiLSTM model shows an improvement of 7.31% in ACC, 15.68% in MCC, 7.04% in AUROC and 9.98% in AUPR. Notably, compared to RF, our DLBWE-Cys model improved ACC by 9.58%, MCC by 20.18%, AUROC by 8.7% and AUPR by 10.81%.
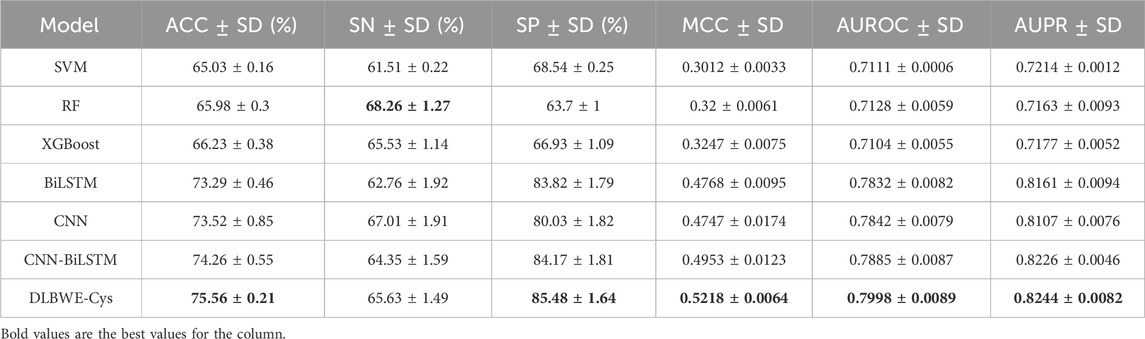
Table 2. Comparison of performance between different model architectures using 5-fold cross-validation on training data.
We also performed a series of ablation tests to confirm the superiority of our model architecture. As shown in Table 2, our proposed model with attention mechanisms significantly outperformed the CNN-BiLSTM embedding architecture without attention, highlighting the ability of the attention mechanism to recognize critical information in sequences, thereby significantly improving model performance. Furthermore, the embedded deep learning models incorporating CNN and BiLSTM outperformed standalone models in terms of SP, ACC, MCC, AUROC and AUPR. This superiority is due to the embedded models combining the strengths of CNN and BiLSTM, which capture both local and long-term dependency information. Meanwhile, our model significantly outperforms single CNN models, showing average increases of 5.45% in SP, 2.04% in ACC, 4.71% in MCC, 1.56% in AUROC, and 1.37% in AUPR.
To visually present the differences in performance between our model and others, we used the Mann-Whitney U test to calculate the statistical significance of these differences, which are marked in Figures 2A–D using the significance levels (NS, *, **, ***). These graphs clearly show the significant differences between DLBWE-Cys and other models.
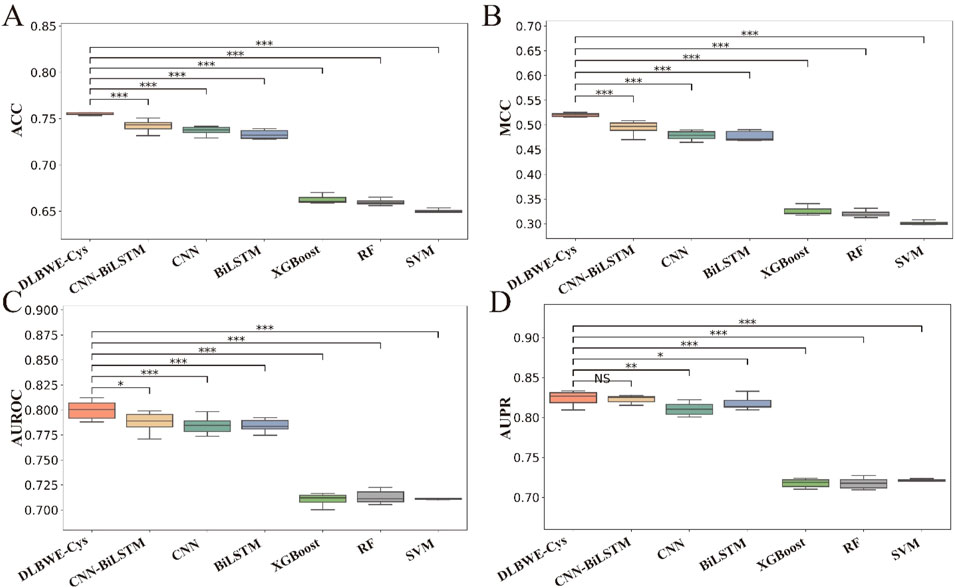
Figure 2. Performance analysis of different m6Am prediction models using five-fold cross-validation on training data. Subgraphs (A–D) represent boxplots of ACC, MCC, AUROC, and AUPR of different models, respectively. The level of significance (NS, *, **, ***) represents non-significant (p > 0.05), low significance (p < 0.05), medium significance (p < 0.01), and high significance (p < 0.001), respectively.
Finally, to further validate the superiority of our proposed model, we evaluated the generalization performance of DLBWE-Cys against six other models using the independent test dataset mentioned in Section 2.1. The results are presented in Supplementary Note S3. To make it easier for readers to observe the results, we have also performed a series of visualizations. Figures 3A–D shows the results for ACC, SN, AUROC, and AUPR. Additionally, Figures 3E, F provides comparisons between different methods based on PR and ROC curves. These results indicate that DLBWE-Cys generally outperforms the other models, confirming the advantages of the deep learning architecture and attention mechanism.
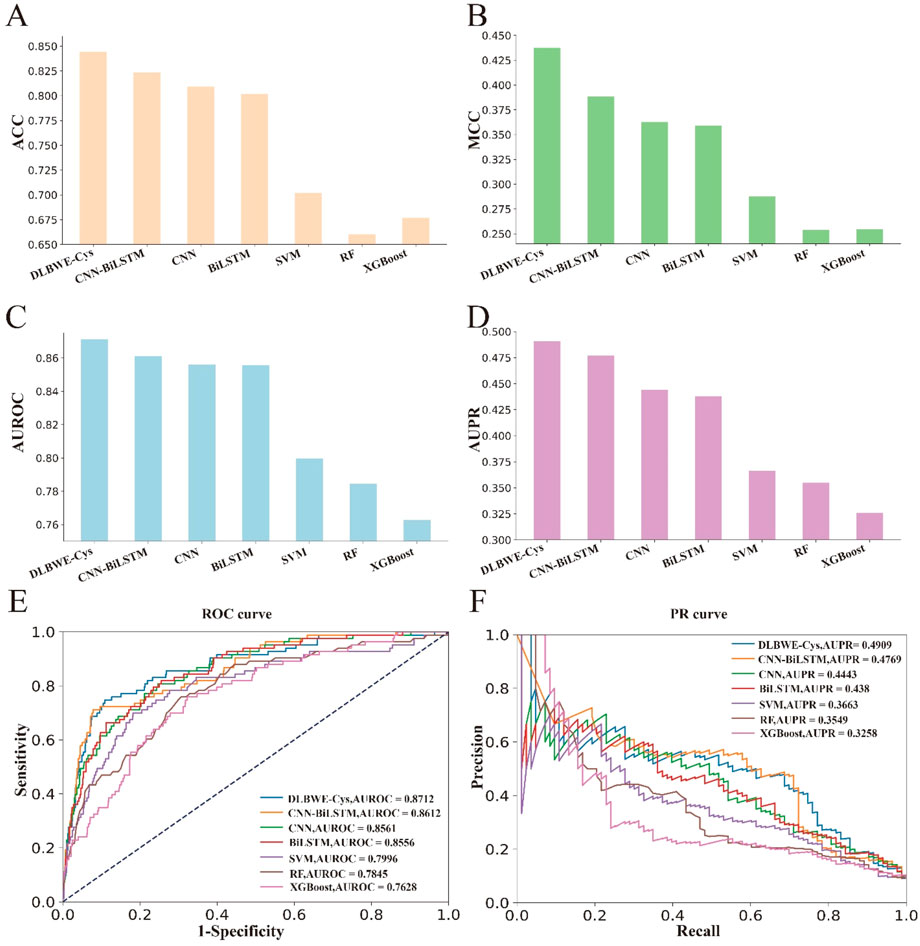
Figure 3. Performance comparison of DLBEW-Cys with various classical machine learning models and deep learning models on an independent test dataset. (A–D) represent the ACC, MCC, AUROC and AUPR values of our proposed DLBEWE-Cys in comparison with other models, including SVM, RF, XGBoost, BiLSTM, CNN and CNN-BiLSTM, respectively. (E, F) depict the receiver operating characteristic (ROC) curves and the precision-recall (PR) curves of the different models, respectively.
3.2 Comparing different feature representation methods
To validate the effectiveness of our BWE method in feature representation, we used the iLearnPlus (Chen et al., 2021; Chen et al., 2018; Chen et al., 2020) to select five different manual feature encoding methods for comparison. These methods include AAindex (Kawashima et al., 2008), Composition, Transition and Distribution (CTD) (Dubchak et al., 1995), Enhanced Amino Acid Composition (EAAC) (Zhou et al., 2018), Dipeptides Composition (DPC) (Bhasin and Raghava, 2004) and Tripeptides Composition (TPC) (Saravanan and Gautham, 2015), with further details available in Supplementary Note S4. We then applied each of these feature encoding methods to our model architecture for training and testing, and evaluated the differences between them using four key performance metrics: ACC, MCC, AUROC and AUPR.
As shown in Figures 4A–D, the BWE method outperformed the other feature encoding methods on all metrics. Specifically, the BWE method showed improvements of 4.3%, 10.1%, 3.8%, and 8.34% in ACC, MCC, AUROC, and AUPR, respectively, compared to the second-best encoding method. Most notably, compared to the DPC encoding, the BWE method demonstrated increases of 15.02%, 31.45%, 16.59%, and 20.28% in ACC, MCC, AUROC, and AUPR, respectively. These results further confirm the significant advantages of our proposed BWE method.
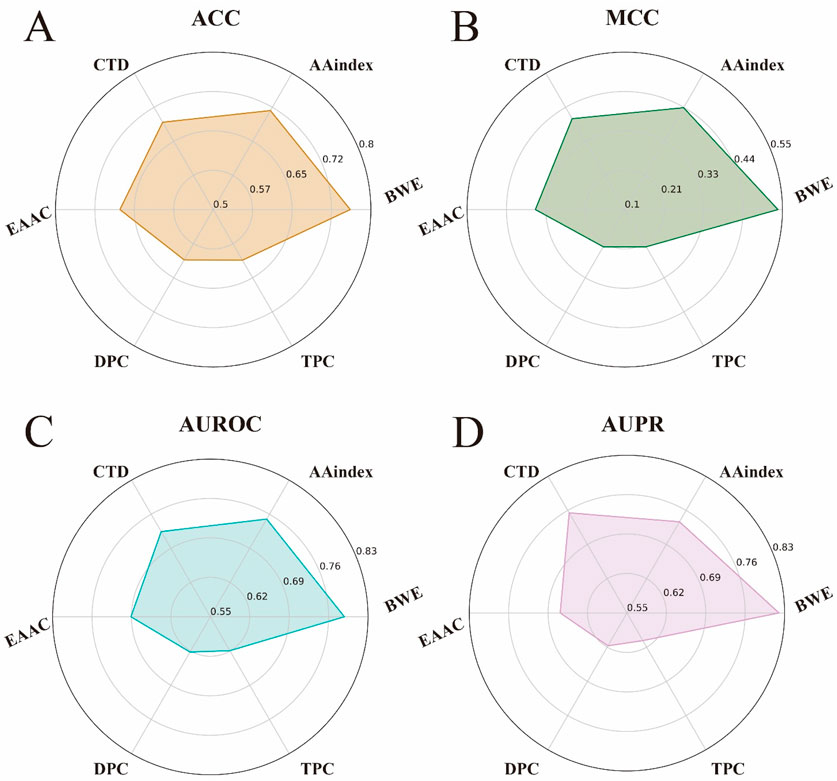
Figure 4. Performance comparison between the feature representation of BWE and other five handcrafted feature encoding methods. (A–D) respectively represent the ACC, MCC, AUROC and AUPR values of the feature representation of BWE and other handcrafted feature encoding methods, including AAindex, EAAC, CTD, DPC and TPC.
3.3 Visualization of feature representation during training
To visually demonstrate how each module in DLBWE-Cys extracts different sequence features, we used the t-distributed stochastic neighbour embedding (t-SNE) (Fang et al., 2023) technique to reduce high-dimensional features to two dimensions for visualization. t-SNE is a nonlinear dimensionality reduction technique that effectively reveals the nonlinear structures of data. Figures 5A–D show the distribution of prediction probabilities in the training and independent test dataset within the feature extraction module, CNN module, BiLSTM module, and attention mechanism module, respectively.
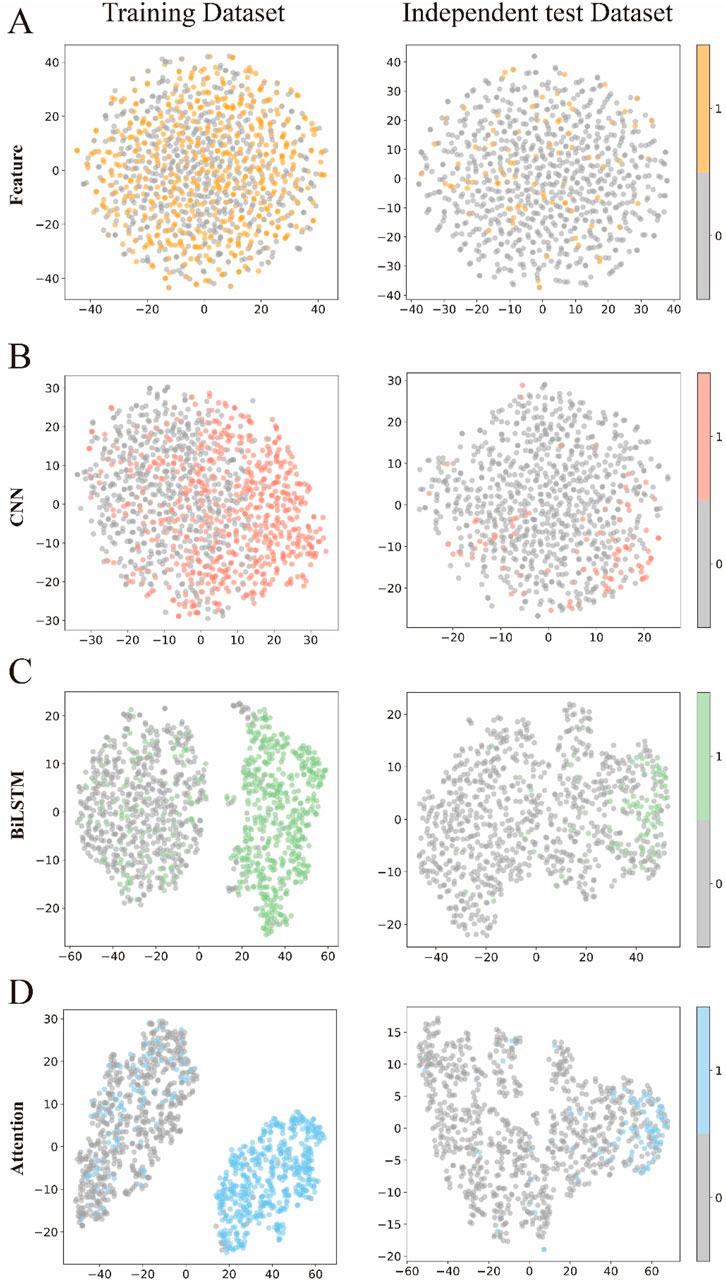
Figure 5. Visualization of the features of the different modules. (A–D) respectively represent the t-SNE visualizations of the original sequence after passing through the feature representation module, CNN module, BiLSTM module, and attention module.
This figure shows t-SNE plots of the data after each module - Feature Extraction, CNN, BiLSTM and Attention - arranged by rows, with each column comparing the training set with the test set. Initially, the points appear intermixed, showing limited class separation. After the CNN module, subtle clustering emerges in the training data, although this pattern is less pronounced in the test data. In contrast, the BiLSTM and attention modules produce clearer clusters during training, indicating stronger class separation. Although class separation is somewhat reduced in the test data, these modules still produce more discernible groupings than the earlier stages.
Overall, these visualisations highlight the importance of each component of the model (Pakhrin et al., 2023a; Pakhrin et al., 2023b; Palacios et al., 2024). Each successive module contributes to the extraction of more informative features, ultimately improving the model’s ability to discriminate between classes and increasing its overall recognition performance.
3.4 Comparison of attention weights and position weights
To gain a deeper understanding of how the attention mechanism assigns weights to sequence features, and to understand the contributions of different sequence positions to the model’s predictive performance, we visualized the attention weights as shown in Figure 6A. The figure shows that the attention mechanism tends to assign higher weights to the central region of the sequence, with the weights gradually decreasing as the distance from the center increases. Surprisingly, this distribution pattern is fully consistent with the concept of our proposed BEW, where weights decrease with increasing distance from the signal source.
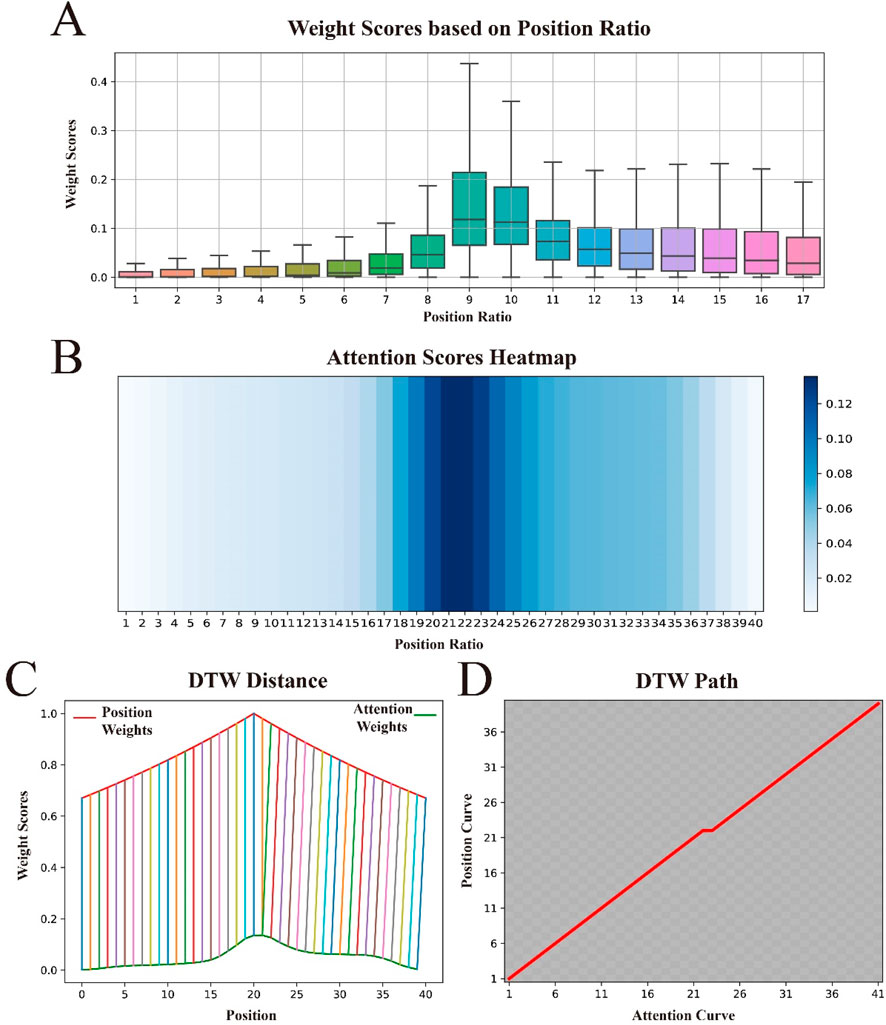
Figure 6. Visualization of attention weights and position weights, and their similarities. (A) shows the distribution of attention weights across the relative positional ratios within the sequence. (B) displays the distribution of attention weights “stretched” to approximate the length of the original sequence. (C) uses Dynamic Time Warping (DTW) to calculate the distance between the attention weight curve and the position weight curve, demonstrating their similarities. (D) presents the optimal alignment path between the two.
In principle, the process of using a decay coefficient
To further explore the relationship between attention weights and BWE, we conducted a series of experiments. First, to better compare their similarities, we “stretched” the attention weight score matrix to match the length of the original sequence, with specific details available in Supplementary Note S5. To observe the effect of this “stretching”, we visualized it again, with darker colors in the heat map indicating higher importance scores, as shown in Figure 6B. We observed that the color gradually lightens from the center to the edges, indicating that the “stretching” operation did not change the distribution pattern of attention weights. We then used Dynamic Time Warping (DTW) (Sakoe and Chiba, 1978) to compare the similarity between the “stretched” attention weight vector and the weight vector in BWE, as shown in Figure 6C. Both curves rise at the beginning of the sequence, continue to rise towards the center and then gradually fall towards the end. Furthermore, these two curves are almost perfectly aligned at all positions and show very similar trends. Finally, to better observe the optimal alignment path of the two curves, we visualized the path matrix of both curves, as shown in Figure 6D. The path is shown as a perfect diagonal, indicating that the changes in the two curves are synchronous, i.e., the optimal alignment path is direct.
These experimental results suggest that the way we assign position weights and the way the attentional mechanism enhances important features are similar, further demonstrating the strong explanatory power of BWE in theory. In addition, it demonstrates high adaptability to complex weighting patterns in practical applications.
3.5 Comparison of binary encoding with and without weights
Here, we compare the effects of binary encoding with and without position weights on model performance across various sequence lengths. To further understand the impact of our proposed BWE method on model performance, we used a controlled variable comparison method, testing binary encoding in models with and without position weights under the same model parameters and other conditions. Meanwhile, since individual test results may be random, we fixed the central position of the original sequences and constructed benchmark datasets of different lengths (21, 31, 41, 51, and 61 amino acids) to achieve an accurate evaluation of model performance, as shown in Figure 7A. We observed that for all sequence lengths tested, the models performed best at a sequence length of 41 amino acids, regardless of whether weights were applied. Furthermore, regardless of sequence length, configurations with position weights generally outperformed those without weights. In particular, at a sequence length of 41 amino acids, we found that the model performed best when the decay coefficient,
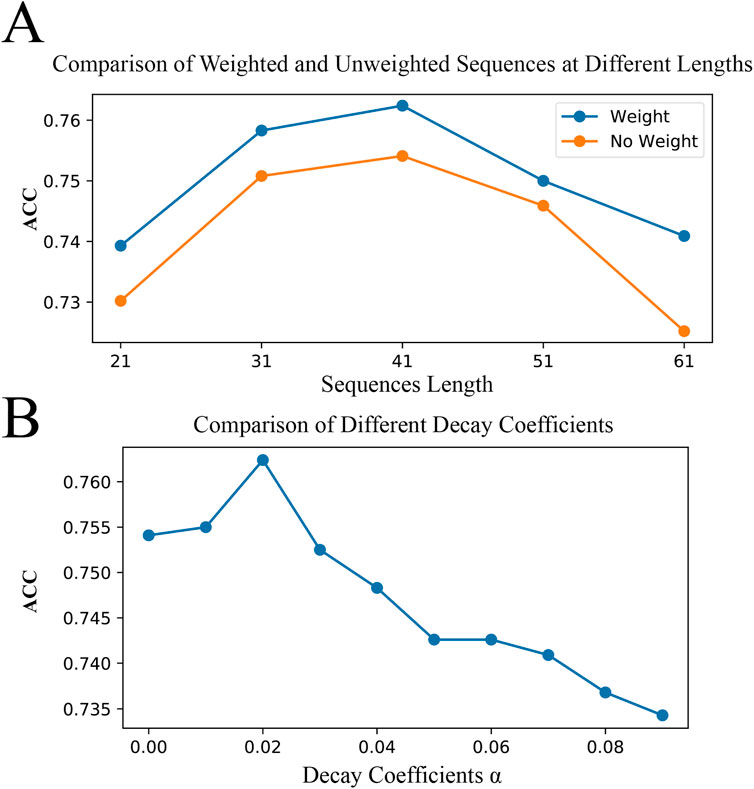
Figure 7. Optimal Sequence Length and Decay Coefficients. (A) demonstrates the impact of binary encoding with and without positional weights on model accuracy across sequence lengths of 21, 31, 41, 51, and 61 amino acids. (B) shows the effect of different decay coefficients on model accuracy at a sequence length of 41 amino acids.
4 Conclusion
In this study, we proposed a deep learning architecture named DLBWE-Cys, which integrates CNN, BiLSTM, Bahdanau attention mechanism, and FNN utilizing a Binary-Weight encoding approach specifically designed for precise identification of cysteine S-carboxyethylation sites. The combination of CNN and BiLSTM effectively captures the local and long-term dependencies of sequences, while the attention mechanism enhances the detection of key features and the FNN is responsible for the final predictions.
Experimental results demonstrate a significant advantage of our model over other machine learning and deep learning models, both in 5-fold cross-validation and on the independent test dataset. Feature comparison experiments also confirmed the superiority of our proposed Binary-Weight encoding method over other encoding techniques. In addition, t-SNE visualization highlighted the model’s strong capability for accurate classification through the effective integration of different architectural components. Furthermore, we found that the distribution of attention weights was very similar to our proposed method of distributing positional weights, further validating the rationality of our approach. Finally, our experiments proved that the model performance using Binary-Weight encoding surpasses that of standard binary encoding at any sequence length, further confirming the effectiveness of our proposed improvements.
Data availability statement
The datasets presented in this study can be found in online repositories. The names of the repository/repositories and accession number(s) can be found in the article/Supplementary Material.
Author contributions
ZL: Data curation, Software, Writing–original draft. QW: Writing–review and editing. YX: Supervision, Writing–review and editing. XZ: Supervision, Writing–review and editing. SY: Validation, Writing–original draft. ZX: Methodology, Validation, Writing–review and editing. LG: Conceptualization, Project administration, Supervision, Writing–review and editing.
Funding
The author(s) declare that financial support was received for the research, authorship, and/or publication of this article. This work has been supported by the National Natural Science Foundation of China (U24A20370, 31771679, 62306008, 62301006, 62062043, 32270789), the Major Scientific and Technological Projects in Anhui Province, China (2023n06020051), the Natural Science Foundation of Anhui, China (2308085MF217), the Natural Science Research Project of the Anhui Provincial Department of Education (KJ2021A1550, 2022AH050889, 2023AH051020), the University Synergy Innovation Program of Anhui Province (GXXT-2022-046, GXXT-2022-055, GXXT-2022-040), the National Key Research and Development Program (2023YFD1802200), the Science and Technology Research Project of the Jiangxi Provincial Department of Education (GJJ2201038), and the Jingdezhen Science and Technology Plan Project (2023GY001-02).
Conflict of interest
The authors declare that the research was conducted in the absence of any commercial or financial relationships that could be construed as a potential conflict of interest.
Publisher’s note
All claims expressed in this article are solely those of the authors and do not necessarily represent those of their affiliated organizations, or those of the publisher, the editors and the reviewers. Any product that may be evaluated in this article, or claim that may be made by its manufacturer, is not guaranteed or endorsed by the publisher.
Supplementary material
The Supplementary Material for this article can be found online at: https://www.frontiersin.org/articles/10.3389/fgene.2024.1464976/full#supplementary-material
References
Bahdanau, D., Cho, K., and Bengio, Y. (2014). Neural machine translation by jointly learning to align and translate. arXiv preprint arXiv:14090473 2014.
Basith, S., Lee, G., and Manavalan, B. (2022). STALLION: a stacking-based ensemble learning framework for prokaryotic lysine acetylation site prediction. Brief. Bioinform 23 (1), bbab412. doi:10.1093/bib/bbab412
Bern, M., Kil, Y. J., and Becker, C. (2012). Byonic: advanced peptide and protein identification software. Curr. Protoc. Bioinforma. 13, 13.20.1–13.20.14. doi:10.1002/0471250953.bi1320s40
Bhasin, M., and Raghava, G. P. (2004). Classification of nuclear receptors based on amino acid composition and dipeptide composition. J. Biol. Chem. 279 (22), 23262–23266. doi:10.1074/jbc.M401932200
Chen, X., Shu, W., Zhao, L., and Wan, J. (2023). Advanced mass spectrometric and spectroscopic methods coupled with machine learning for in vitro diagnosis. View 4 (1), 20220038. doi:10.1002/viw.20220038
Chen, Z., Zhao, P., Li, C., Li, F., Xiang, D., Chen, Y. Z., et al. (2021). iLearnPlus: a comprehensive and automated machine-learning platform for nucleic acid and protein sequence analysis, prediction and visualization. Nucleic Acids Res. 49 (10), e60. doi:10.1093/nar/gkab122
Chen, Z., Zhao, P., Li, F., Leier, A., Marquez-Lago, T. T., Wang, Y., et al. (2018). iFeature: a Python package and web server for features extraction and selection from protein and peptide sequences. Bioinformatics 34 (14), 2499–2502. doi:10.1093/bioinformatics/bty140
Chen, Z., Zhao, P., Li, F., Marquez-Lago, T. T., Leier, A., Revote, J., et al. (2020). iLearn: an integrated platform and meta-learner for feature engineering, machine-learning analysis and modeling of DNA, RNA and protein sequence data. Brief. Bioinform 21 (3), 1047–1057. doi:10.1093/bib/bbz041
Chicco, D., Tötsch, N., and Jurman, G. (2021). The Matthews correlation coefficient (MCC) is more reliable than balanced accuracy, bookmaker informedness, and markedness in two-class confusion matrix evaluation. BioData Min. 14 (1), 13. doi:10.1186/s13040-021-00244-z
Chung, C. R., Chang, Y. P., Hsu, Y. L., Chen, S., Wu, L. C., Horng, J. T., et al. (2020). Incorporating hybrid models into lysine malonylation sites prediction on mammalian and plant proteins. Sci. Rep. 10 (1), 10541. doi:10.1038/s41598-020-67384-w
Do, D. T., Le, T. Q. T., and Le, N. Q. K. (2021). Using deep neural networks and biological subwords to detect protein S-sulfenylation sites. Brief. Bioinform 22 (3), bbaa128. doi:10.1093/bib/bbaa128
Dou, L., Yang, F., Xu, L., and Zou, Q. (2021). A comprehensive review of the imbalance classification of protein post-translational modifications. Brief. Bioinform 22 (5), bbab089. doi:10.1093/bib/bbab089
Drews, J. (2000). Drug discovery: a historical perspective. Science 287 (5460), 1960–1964. doi:10.1126/science.287.5460.1960
Dubchak, I., Muchnik, I., Holbrook, S. R., and Kim, S. H. (1995). Prediction of protein folding class using global description of amino acid sequence. Proc. Natl. Acad. Sci. U. S. A. 92 (19), 8700–8704. doi:10.1073/pnas.92.19.8700
Ertelt, M., Mulligan, V. K., Maguire, J. B., Lyskov, S., Moretti, R., Schiffner, T., et al. (2024). Combining machine learning with structure-based protein design to predict and engineer post-translational modifications of proteins. PLoS Comput. Biol. 20 (3), e1011939. doi:10.1371/journal.pcbi.1011939
Fang, Y., Xu, F., Wei, L., Jiang, Y., Chen, J., Wei, L., et al. (2023). AFP-MFL: accurate identification of antifungal peptides using multi-view feature learning. Brief. Bioinform 24 (1), bbac606. doi:10.1093/bib/bbac606
Hochreiter, S., and Schmidhuber, J. (1997). Long short-term memory. Neural comput. 9 (8), 1735–1780. doi:10.1162/neco.1997.9.8.1735
House, J. S., Grimm, F. A., Jima, D. D., Zhou, Y. H., Rusyn, I., and Wright, F. A. (2017). A pipeline for high-throughput concentration response modeling of gene expression for toxicogenomics. Front. Genet. 8, 168. doi:10.3389/fgene.2017.00168
Kawashima, S., Pokarowski, P., Pokarowska, M., Kolinski, A., Katayama, T., and Kanehisa, M. (2008). AAindex: amino acid index database, progress report 2008. Nucleic Acids Res. 36 (Database issue), D202–D205. doi:10.1093/nar/gkm998
Lee, J., Yoon, W., Kim, S., Kim, D., Kim, S., So, C. H., et al. (2020). BioBERT: a pre-trained biomedical language representation model for biomedical text mining. Bioinformatics 36 (4), 1234–1240. doi:10.1093/bioinformatics/btz682
Li, W., and Godzik, A. (2006). Cd-hit: a fast program for clustering and comparing large sets of protein or nucleotide sequences. Bioinformatics 22 (13), 1658–1659. doi:10.1093/bioinformatics/btl158
Lin, Y., and Wang, Z. (2024). A novel method for linguistic steganography by English translation using attention mechanism and probability distribution theory. PLoS One 19 (1), e0295207. doi:10.1371/journal.pone.0295207
Liu, G., and Guo, J. (2019). Bidirectional LSTM with attention mechanism and convolutional layer for text classification. Neurocomputing 337, 325–338. doi:10.1016/j.neucom.2019.01.078
Meng, L., Chan, W. S., Huang, L., Liu, L., Chen, X., Zhang, W., et al. (2022). Mini-review: recent advances in post-translational modification site prediction based on deep learning. Comput. Struct. Biotechnol. J. 20, 3522–3532. doi:10.1016/j.csbj.2022.06.045
Na, S., and Paek, E. (2015). Software eyes for protein post-translational modifications. Mass Spectrom. Rev. 34 (2), 133–147. doi:10.1002/mas.21425
Ning, Q., Zhao, X., Bao, L., Ma, Z., and Zhao, X. (2018). Detecting Succinylation sites from protein sequences using ensemble support vector machine. BMC Bioinforma. 19 (1), 237. doi:10.1186/s12859-018-2249-4
Ning, W., Jiang, P., Guo, Y., Wang, C., Tan, X., Zhang, W., et al. (2021). GPS-Palm: a deep learning-based graphic presentation system for the prediction of S-palmitoylation sites in proteins. Brief. Bioinform 22 (2), 1836–1847. doi:10.1093/bib/bbaa038
Pakhrin, S. C., Pokharel, S., Aoki-Kinoshita, K. F., Beck, M. R., Dam, T. K., Caragea, D., et al. (2023a). LMNglyPred: prediction of human N-linked glycosylation sites using embeddings from a pre-trained protein language model. Glycobiology 33 (5), 411–422. doi:10.1093/glycob/cwad033
Pakhrin, S. C., Pokharel, S., Pratyush, P., Chaudhari, M., Ismail, H. D., and Kc, D. B. (2023b). LMPhosSite: a deep learning-based approach for general protein phosphorylation site prediction using embeddings from the local window sequence and pretrained protein language model. J. Proteome Res. 22 (8), 2548–2557. doi:10.1021/acs.jproteome.2c00667
Palacios, A. V., Acharya, P., Peidl, A. S., Beck, M. R., Blanco, E., Mishra, A., et al. (2024). SumoPred-PLM: human SUMOylation and SUMO2/3 sites prediction using pre-trained protein language model. Nar. Genom Bioinform 6 (1), lqae011. doi:10.1093/nargab/lqae011
Rodriguez, R., and Miller, K. M. (2014). Unravelling the genomic targets of small molecules using high-throughput sequencing. Nat. Rev. Genet. 15 (12), 783–796. doi:10.1038/nrg3796
Sakoe, H., and Chiba, S. (1978). Dynamic programming algorithm optimization for spoken word recognition. IEEE Trans. Acoust. speech, signal Process. 26 (1), 43–49. doi:10.1109/tassp.1978.1163055
Saravanan, V., and Gautham, N. (2015). Harnessing computational biology for exact linear B-cell epitope prediction: a novel amino acid composition-based feature descriptor. Omics 19 (10), 648–658. doi:10.1089/omi.2015.0095
Schuster, M., and Paliwal, K. K. (1997). Bidirectional recurrent neural networks. IEEE Trans. Signal Process. 45 (11), 2673–2681. doi:10.1109/78.650093
Shen, D., Wu, G., and Suk, H.-I. (2017). Deep learning in medical image analysis. Annu. Rev. Biomed. Eng. 19 (1), 221–248. doi:10.1146/annurev-bioeng-071516-044442
Sohrawordi, M., and Hossain, M. A. (2022). Prediction of lysine formylation sites using support vector machine based on the sample selection from majority classes and synthetic minority over-sampling techniques. Biochimie 192, 125–135. doi:10.1016/j.biochi.2021.10.001
Vanella, R., Kovacevic, G., Doffini, V., Fernández de Santaella, J., and Nash, M. A. (2022). High-throughput screening, next generation sequencing and machine learning: advanced methods in enzyme engineering. Chem. Commun. (Camb) 58 (15), 2455–2467. doi:10.1039/d1cc04635g
Yates, J. R. (2015). Pivotal role of computers and software in mass spectrometry - SEQUEST and 20 years of tandem MS database searching. J. Am. Soc. Mass Spectrom. 26 (11), 1804–1813. doi:10.1007/s13361-015-1220-0
Zhai, Y., Chen, L., Zhao, Q., Zheng, Z. H., Chen, Z. N., Bian, H. J., et al. (2023). Cysteine carboxyethylation generates neoantigens to induce HLA-restricted autoimmunity. Science 379 (6637), eabg2482. doi:10.1126/science.abg2482
Zhang, J., Hu, A., Chen, X., Shen, F., Zhang, L., Lin, Y., et al. (2023). Pan-targeted quantification of deep and comprehensive cancer serum proteome improves cancer detection. View 4 (2), 20220039. doi:10.1002/viw.20220039
Zhao, Q., Ma, J., Wang, Y., Xie, F., Lv, Z., Xu, Y., et al. (2022). Mul-SNO: a novel prediction tool for S-nitrosylation sites based on deep learning methods. IEEE J. Biomed. Health Inf. 26 (5), 2379–2387. doi:10.1109/JBHI.2021.3123503
Keywords: S-carboxyethylation, post-translational modification, bahdanau attention mechanism, binary-weight encoding, deep learning
Citation: Luo Z, Wang Q, Xia Y, Zhu X, Yang S, Xu Z and Gu L (2025) DLBWE-Cys: a deep-learning-based tool for identifying cysteine S-carboxyethylation sites using binary-weight encoding. Front. Genet. 15:1464976. doi: 10.3389/fgene.2024.1464976
Received: 15 July 2024; Accepted: 23 December 2024;
Published: 08 January 2025.
Edited by:
Bin Liu, Jiangsu Ocean Universiity, ChinaReviewed by:
Kun Qian, Shanghai Jiao Tong University, ChinaSubash Pakhrin, University of Houston–Downtown, United States
Copyright © 2025 Luo, Wang, Xia, Zhu, Yang, Xu and Gu. This is an open-access article distributed under the terms of the Creative Commons Attribution License (CC BY). The use, distribution or reproduction in other forums is permitted, provided the original author(s) and the copyright owner(s) are credited and that the original publication in this journal is cited, in accordance with accepted academic practice. No use, distribution or reproduction is permitted which does not comply with these terms.
*Correspondence: Lichuan Gu, Z2xjQGFoYXUuZWR1LmNu; Zhaochun Xu, emhhb2NodW54dUBocmJtdS5lZHUuY24=