 Luis Paulo B. Sousa Junior1,2
 Luis Fernando B. Pinto1,2Valdecy A. R. Cruz1
 Gerson A. Oliveira Junior3
 Hinayah R. Oliveira2,3Tatiane S. Chud3,4
 Victor B. Pedrosa2Filippo Miglior3,5
 Flávio S. Schenkel3†
 Luiz F. Brito2,3*†
- 1Department of Animal Sciences, Federal University of Bahia, Salvador, Brazil
- 2Department of Animal Sciences, Purdue University, West Lafayette, IN, United States
- 3Centre for Genetic Improvement of Livestock (CGIL), Department of Animal Biosciences, University of Guelph, Guelph, ON, Canada
- 4PEAK, Madison, WI, United States
- 5Lactanet Canada, Guelph, ON, Canada
Body conformation traits are directly associated with longevity, fertility, health, and workability in dairy cows and have been under direct genetic selection for many decades in various countries worldwide. The main objectives of this study were to perform genome-wide association studies and functional enrichment analyses for fourteen body conformation traits using imputed high-density single nucleotide polymorphism (SNP) genotypes. The traits analyzed include body condition score (BCS), body depth (BD), bone quality (BQ), chest width (CW), dairy capacity (DC), foot angle (FAN), front legs view (FLV), heel depth (HDe), height at front end (HFE), locomotion (LOC), rear legs rear view (RLRV), rear legs side view (RLSV), stature (ST), and a composite feet and legs score index (FL) of Holstein cows scored in Canada. De-regressed estimated breeding values from a dataset of 39,135 North American Holstein animals were used as pseudo-phenotypes in the genome-wide association analyses. A mixed linear model was used to estimate the SNP effects, which ranged from 239,533 to 242,747 markers depending on the trait analyzed. Genes and quantitative trait loci (QTL) located up to 100 Kb upstream or downstream of the significant SNPs previously cited in the Animal QTLdb were detected, and functional enrichment analyses were performed for the candidate genes identified for each trait. A total of 20, 60, 13, 17, 27, 8, 7, 19, 4, 10, 13, 15, 7, and 13 genome-wide statistically significant SNPs for Bonferroni correction based on independent chromosomal segments were identified for BCS, BD, BQ, CW, DC, FAN, FLV, HDe, HFE, LOC, RLRV, RLSV, ST, and FL, respectively. The significant SNPs were located across the whole genome, except on chromosomes BTA24, BTA27, and BTA29. Four markers (for BCS, BD, HDe, and RLRV) were statistically significant when considering a much stricter threshold for the Bonferroni correction for multiple tests. Moreover, the genomic regions identified overlap with various QTL previously reported for the trait groups of exterior, health, meat and carcass, milk, production, and reproduction. The functional enrichment analyses revealed 27 significant gene ontology terms. These enriched genomic regions harbor various candidate genes previously reported as linked to bone development, metabolism, as well as infectious and immunological diseases.
1 Introduction
Body conformation traits are economically important as they are associated with longevity, fertility, health, and workability in dairy cattle (Miglior et al., 2017; Oliveira Junior et al., 2021). Several dairy cattle breed organizations aim at selecting animals with optimal conformation traits, while improving production and other economically important traits, to maximize profitability (Fang and Pausch, 2019; Alcantara et al., 2022; Khmelnychyi et al., 2022). The Canadian classification system comprises 30 different linear type traits and defective characteristics, which are combined into trait groups (scorecards), i.e., including Mammary System, Feet and Legs, Dairy Strength, and Rump (Canada, 2023a). Moreover, an overall conformation score is calculated based on the importance of each trait group (Alcantara et al., 2022; Canada, 2023b). Body conformation traits in Holstein cattle are heritable, with heritability estimates ranging from 0.05 to 0.46 (Lactanet, 2021; Oliveira Junior et al., 2021).
An approach to detect significant associations between genetic and phenotypic variants is through genome-wide association studies (GWAS) that enables the estimation of the effects of each marker and the identification of the best candidates to discriminate the underlying biology of traits with polygenic traits (Sahana et al., 2023). Many GWAS have been reported for body conformation traits in Holstein cattle. For instance (Čítek et al., 2022), analyzed 25 body conformation traits, including angularity (ANG), body condition score (BCS), body depth (BD), bone quality (BQ), foot angle (FAN), chest width (CW), locomotion (LOC), rear legs rear view (RLRV), rear legs side view (RLSV), stature (ST), and composite feet and leg score (FL) and reported two candidate genes (CAMK2D, RANBP17) for BD and ANG in Czech Holsteins. In Chinese Holstein cattle, 105 genes within 200 kb up/downstream of the significant SNPs for heel depth (HDe), BQ, RLRV, and RLSV have also been reported (Abdalla et al., 2021). Moreover, another study reported 24 SNPs associated with 24 conformation traits in Korean Holstein cattle, including the RYBP gene associated with height at front end (HFE) (Haque et al., 2023; Ma et al., 2023) also performed a GWAS for monthly-recorded body weight (BW), hip height (HH), body length (BL), and chest girth (CG), followed by a multi-trait meta-analysis to detect pleiotropic markers in Chinese Holstein cattle. The authors reported 170 SNPs associated with the studied traits, including 17 SNPs with pleiotropic effects across body conformation traits, and various important candidate genes such as HMGA2, HNF4G, MED13L, BHLHE40, FRZB, DMP1, TRIB3, and GATAD2A.
Most GWAS for conformation traits in Holstein cattle, such as those mentioned previously, were performed using medium-density (MD; i.e., ∼50 K) SNP panels. One procedure for using more markers at lower costs is through genotype imputation, which adds missing genotypes based on a reference population (Calus et al., 2014). Genotype imputation from MD to high-density (HD) SNP panels can enable more accurate identification of quantitative trait loci (QTL) (Abo-Ismail et al., 2017; VanRaden et al., 2017). Thus, this study aimed at performing GWAS univariate analyses for 14 body conformation traits split into four groups: composite feet and legs score index (FL), foot score traits (FAN and HDe), dairy strength score traits (DC, BCS, BD, CW, HFE, and ST), and mobility score traits (BQ, LOC, FLV, RLRV, and RLSV) in North American Holstein cattle using imputed HD SNP data.
2 Materials and methods
2.1 Ethics statement
Phenotypic, pedigree, and genomic information were provided by Lactanet (www.lactanet.ca; Guelph, ON, Canada). Therefore, no animal experiments were carried out and the approval of the animal care committee was not needed.
2.2 Animals and phenotypes
The trait names, abbreviations, definitions, and heritability estimates are presented in Table 1. Between 15,269 and 24,893 Holstein cattle with de-regressed estimated breeding values (dEBVs) for BCS, BD, BQ, CW, DC, FL, FAN, FLV, HDe, HFE, LOC, RLRV, RLSV, and ST were included in this study (Table 2). The dEBVs were calculated according to VanRaden et al. (2009), and only dEBVs with reliability higher than 0.30 were kept for further analyses. Thirteen traits were measured individually on a 1–9 score system while the composite feet and legs score index (FL) was calculated as:
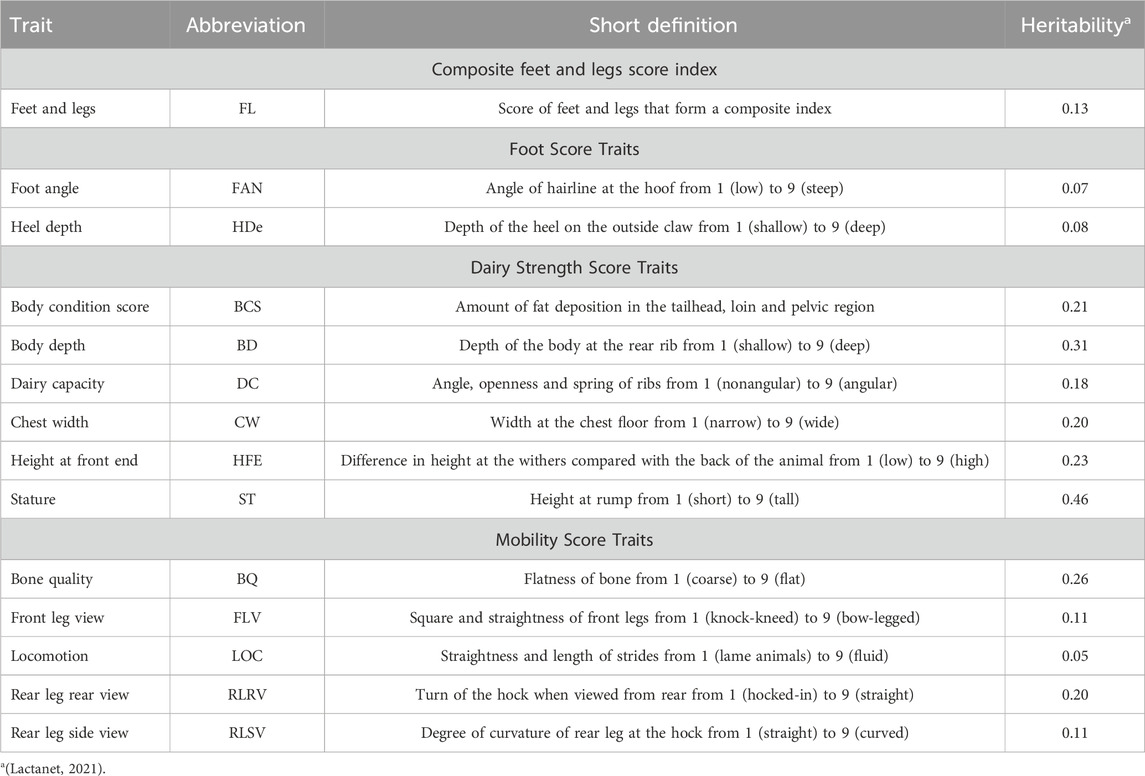
Table 1. Trait, abbreviations names, their short definitions, and heritability estimated.
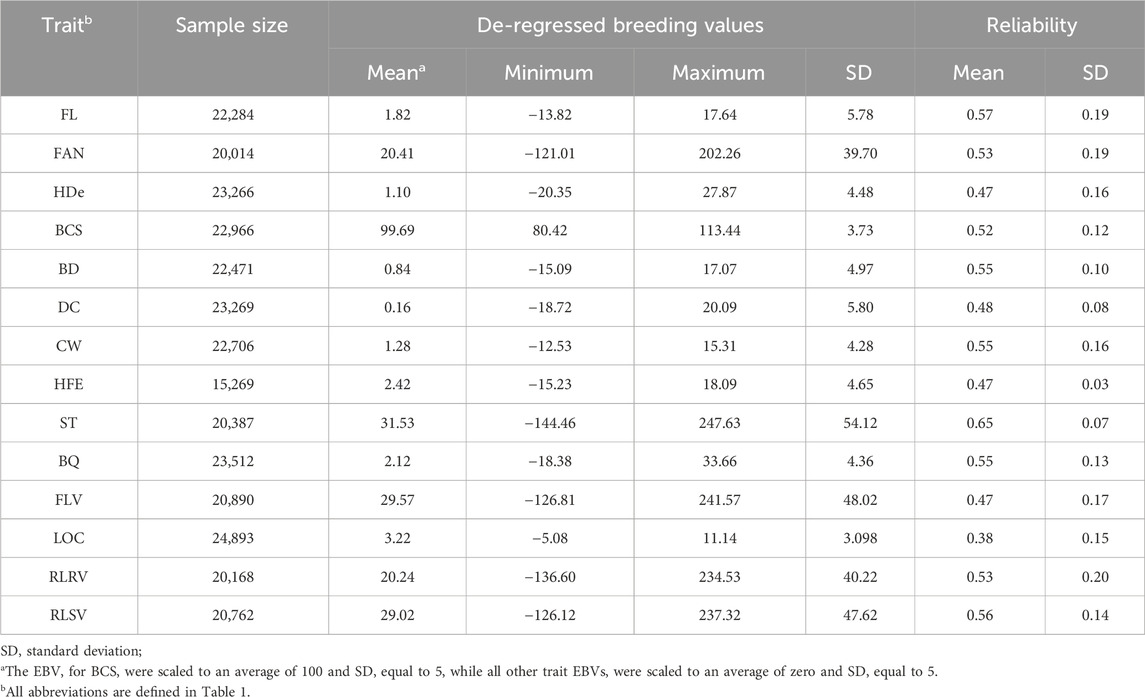
Table 2. Descriptive statistics of the pseudo-phenotypes used for the genome-wide association analyses of conformation traits in Canadian Holstein cattle.
2.3 Genotype imputation and quality control
Genotype imputation was performed from a MD SNP panel containing 44,315 SNPs to a HD SNP panel containing 311,725 SNPs [after a preliminary quality control (Chen et al., 2022)]. The accuracy of genotype imputation for this population was >0.93 (Larmer et al., 2017). In the study, MD genotypes were available for 39,135 animals, comprising 24,721 females and 14,414 males. Meanwhile, the reference population with HD data consisted of 2,507 Holstein animals, which included 562 females and 1,945 males. Before genotype imputation, the SNPs present only in the MD SNP panel were excluded from further analyses. Moreover, a quality control (QC) was performed using the PLINK 1.9 software (Purcell et al., 2007) to remove SNPs: 1) with call rate <0.95; 2) with an extreme deviation from Hardy-Weinberg equilibrium (p < 10–8) as an indication of genotyping errors; 3) located in non-autosomal chromosomes; and 4) with unknown genomic position based on the ARS-UCD1.2 reference genome assembly. After QC, 40,442 and 2,94,671 SNPs remained in the MD and HD panels, respectively. The genotype phasing was performed using the Eagle 2.4.1 software (Loh et al., 2016), while genotype imputation was done using the Minimac4 software (Das et al., 2016). After genotype imputation, an additional QC was performed to exclude individuals or SNPs with call rate <0.90, SNPs with minor allele frequency (MAF) < 0.01, and SNPs with extreme deviation from Hardy-Weinberg equilibrium (p < 10–8). Finally, the number of SNPs that remained for the GWAS analyses ranged between 2,84,289 for HDe and 2,87,048 for RLSV.
2.4 Genome-wide association analyses
Mixed linear model (MLM) analyses were performed to estimate the SNP effects using the GCTA package (Yang et al., 2011). The univariate model used can be described as follows:
where
We used the MLMA-LOCO (mixed linear model association–leave-one-chromosome-out) to avoid the tested marker being adjusted twice in the model as a fixed effect (target SNP) and random effect (in the GRM) (Fraslin et al., 2022). In the MLMA-LOCO method the chromosome in which the SNP being tested is located was excluded when calculating the GRM (Yang et al., 2014). This approach has been increasingly used in livestock studies (e.g., Uzzaman et al., 2018; Sölzer et al., 2022; Kim et al., 2024) to improve the statistical power of the studies. Therefore, 29 GRMs were alternatively constructed by randomly sampling 50,000 SNPs homogeneously distributed across the genome (after QC). The SNPs from the MD SNP panels were not used for the GRM because the HD panel had a more homogeneous distribution of SNPs across the genome. After the GWAS analyses, all SNPs were ranked based on their p-values and clumped according to their linkage disequilibrium (LD) level (
2.5 Correction for multiple tests
As many variants were tested, the traditional Bonferroni correction would be highly conservative as not all tests are independent due to LD among markers (Johnson et al., 2010). Thus, to avoid excessive false-negative results, a modified Bonferroni correction was applied by using the number of independent chromosomal segments (Me) at the genome-wide level (Li et al., 2015) instead of the total number of SNPs. The Me is a function of both effective population size (Ne) and genome length (L) in Morgans and it was calculated as
2.6 Functional genomic analyses
The SNP coordinates were based on the ARS-UCD1.2 assembly of the cattle reference genome available in the GenBank accession (GCA_002263795.2). The GALLO R package (Fonseca et al., 2020) was used to detect positional genes and quantitative trait loci (QTL) located 100 Kb upstream or downstream of each significant SNPs (threshold defined based on the linkage disequilibrium level in the studied population (Sargolzaei et al., 2008). The QTL database used was the Animal QTLdb Release 49 (Hu et al., 2019). Subsequently, functional enrichment analyses were performed for the genes found for each trait separately, using the DAVID platform (Huang et al., 2009). A False Discovery Rate (FDR) of 0.05 was used in the functional enrichment analyses to control false discoveries over the multiple tests, it is an option for filtering the results provided by the DAVID platform that requests p-values adjusted by adaptive linear increment for approximate control of the FDR (Benjamini and Hochberg, 2000).
3 Results
3.1 Association analyses
After QC and LD-based clumping, the remaining number of informative SNPs (and animals) were 241,552 (22,966) for BCS; 242,222 (22,471) for BD; 240,263 (23,512) for BQ; 241,290 (23,269) for DC; 242,163 (22,706) for CW; 242,419 (22,284) for FL; 240,781 (20,014) for FAN; 239,533 (20,890) for FLV; 240,140 (23,266) for HDe; 242,264 (15,269) for HFE; 241,443 (24,893) for LOC; 240,305 (20,168) for RLRV; 242,747 (20,762) for RLSV, and 242,512 (20,387) for ST. The λ values ranged from 1.01 to 1.05 and the Q-Q plots for all traits are shown in Supplementary File S1 (dx.doi.org/10.6084/m9.figshare.27160302).
Detailed information about the GWAS, including p-values, SNP effects, MAF, QTL, and candidate genes found within an interval of 100 Kb upstream and downstream from the significant SNPs are provided in Supplementary File S2 (dx.doi.org/10.6084/m9.figshare.27160302). Table 3 shows a summary of the main significant findings of SNPs and genes. A total of 20, 60, 13, 17, 27, 13, 8, 7, 19, 4, 10, 13, 15, and 7 significant SNPs were identified for BCS, BD, BQ, CW, DC, FL, FAN, FLV, HDe, HFE, LOC, RLRV, RLSV, and ST, respectively. No significant SNPs were found on BTA24, BTA27, and BTA29 for any trait evaluated. On the other hand, BTA20 had the highest number of significant SNPs (n = 64). The BTA9 and BTA11 harbored significant SNPs for the highest number (n = 6) of traits. The SNP rs137570291 (BTA11) was the only SNP associated with more than one trait (BD and LOC). Only markers rs41936372 (BTA20: 11,927,432 bp) for HDe, rs110434046(BTA6: 87,184,768 bp) for BCS and rs108938667 (BTA11: 76,875,084 bp) for BD were significant when considering a stricter threshold for the Bonferroni correction for multiple tests. Table 4 presents the summary of the main positional genes associated with significant markers. Supplementary Figures S1–S6 present the Manhattan plots for all traits and the Supplementary Tables S1–S9, with significative SNPs and genes, are shown in Supplementary File S3 (dx.doi.org/10.6084/m9.figshare.27160302).
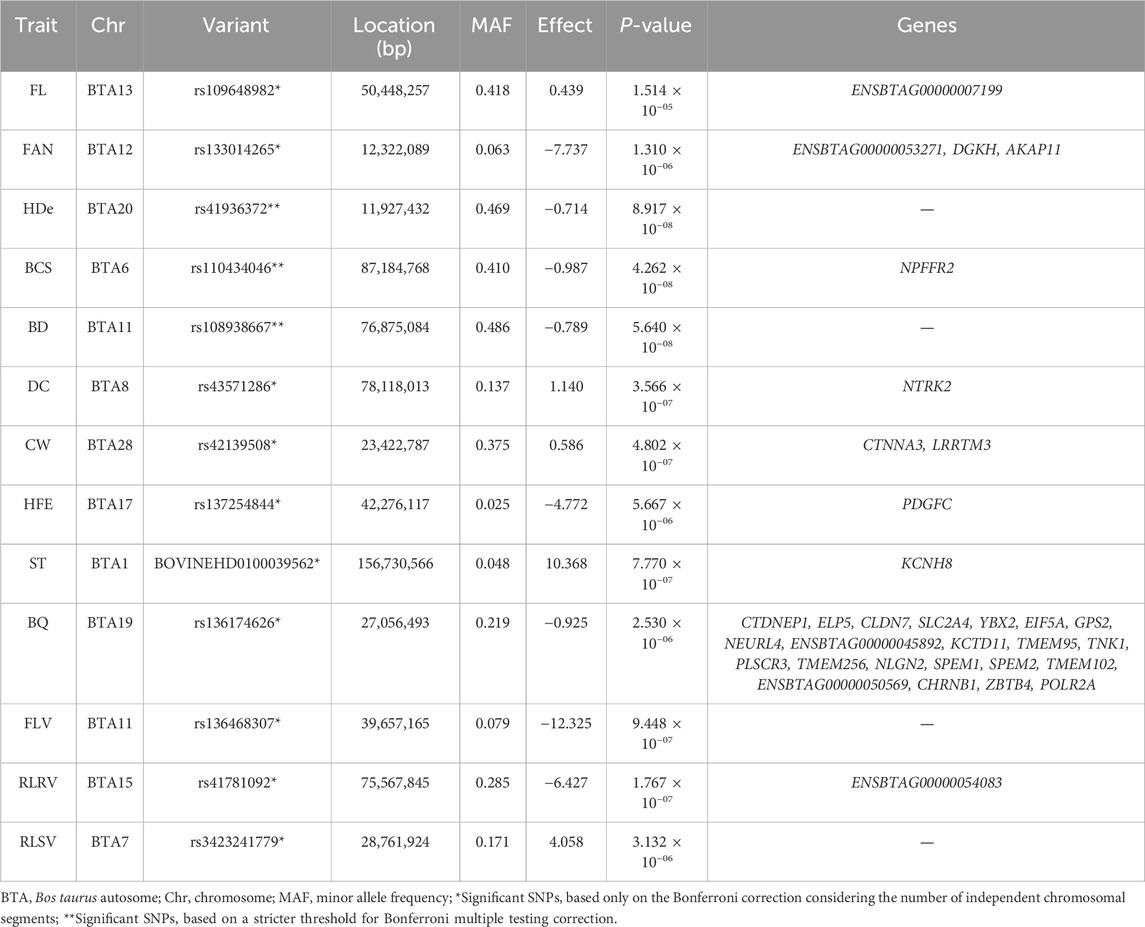
Table 3. Summary of the most significant Single Nucleotide Polymorphisms (SNPs) associated with each body conformation trait in Canadian Holstein cattle. The full list is presented in the Supplementary File S2.

Table 4. Summary of the main positional genes associated with significant markers.
3.2 Composite feet and legs score index
Thirteen SNPs distributed across the chromosomes BTA11, BTA13, BTA17, BTA18, and BTA26 (Supplementary Tables S1, in Supplementary File S3; (dx.doi.org/10.6084/m9.figshare.27160302) were significantly associated with FL. The most statistically significant SNP (rs41661000) for FL is located on BTA13: 50,453,781 bp. Fifty-two candidate genes with known biological functions (Supplementary Tables S1 in Supplementary File S3; dx.doi.org/10.6084/m9.figshare.27160302) were found near the significant SNPs, but no genes were identified close to the significant SNPs on BTA26. Moreover, various QTL for FL, FAN, RLSV, ST, abomasum displacement, body weight, feed conversion ratio, residual feed intake, and udder depth were previously reported in the same genomic regions of the SNPs associated with FL. Three significant gene ontology (GO) terms were associated with FL (Supplementary Tables S2 in Supplementary File S3; dx.doi.org/10.6084/m9.figshare.27160302), and three genes associated with FL are involved with these GO terms.
3.3 Foot score traits
Twenty-seven SNPs were found to be associated with foot score composition traits (Supplementary File S3; dx.doi.org/10.6084/m9.figshare.27160302). These SNPs are located on BTA1, BTA2, BTA4, BTA7, BTA9, BTA10, BTA11, BTA12, BTA15, BTA19, and BTA20. The most statistically significant SNPs for FAN and HDe were rs133014265
3.4 Mobility score traits
Fifty-eight SNPs located across 19 chromosomes were found to be significantly associated with mobility composition score traits (Supplementary File S2; dx.doi.org/10.6084/m9.figshare.27160302). The most statistically significant SNPs for BQ, FLV, LOC, RLRV, and RLSV were: rs136174626
3.5 Dairy strength score traits
A total of 135 SNPs located on 21 chromosomes were found to be associated with dairy strength traits (Supplementary File S2; dx.doi.org/10.6084/m9.figshare.27160302). The most statistically significant SNPs for BCS, BD, CW, DC, HFE, and ST were rs110434046
4 Discussion
4.1 Composite feet and legs score index
The composite Feet and Leg score index is a weighted linear combination of foot and leg conformation traits used as a selection sub-index for genetically improving these traits in Canadian Holstein cattle. Fifty-two positional candidate genes were harboring or near the 13 SNPs associated with this index. In the significant regions, BTA13 harbors the genes DIP2C (disco-interacting protein 2 homolog C), BIRC7 (Baculoviral IAP repeat-containing 7), COL20A1 (Collagen Type XX Alpha 1 Chain), and YTHDF1 (YTH N6-Methyladenosine RNA Binding Protein F1). The DIP2C gene has been reported to be associated with sole ulcers, white line disease, and non-infectious claw lesions in Holstein cattle (Lai et al., 2021). Ring et al. (2018) reported that hoof diseases were genetically correlated to lameness and conformation in Irish cows. Moreover, the BIRC7 gene is associated with the osteogenic differentiation of human cells (Liu et al., 2017), while COL20A1 is associated with human collagen formation (Rajasekaran et al., 2023). Liu et al. (2021) reported that YTHDF1 is related to osteoporosis, and its expression increases human bone marrow mesenchymal stem cells during osteogenic differentiation. Furthermore, YTHDF1 knockout mice result in decreased bone mass in vivo. Factors that affect bone density, such as diseases or their differentiation processes, may be related to FL in cows, as an association has already been found between bone ratio and visual conformation assessments (Kempster et al., 1982) in different dairy cattle breeds.
The MN1 (MN1 Proto-Oncogene, Transcriptional Regulator) gene, located on BTA17, has been linked to craniofacial development in mice and humans (Breckpot et al., 2016; Hoebel et al., 2017). On BTA18, the genes FGF21 (Fibroblast Growth Factor 21), PPP1R15A (Protein Phosphatase 1 Regulatory Subunit 15A), BAX (BCL2 Associated X, Apoptosis Regulator), and EMC10 (ER Membrane Protein Complex Subunit 10) were identified as associated with FL. Wei et al. (2012) identified FGF21 as a physiologically and pharmacologically significant negative regulator of bone mass. The PPP1R15A and BAX genes were also previously associated with bone development in mice and humans (Zaman et al., 2012; Ding et al., 2024), while Wang et al. (2022) reported that EMC10 serum levels are correlated to body mass index (BMI) and insulin resistance in humans and as a potential biomarker of adiposity, in mice and humans. Onyiro and Brotherstone (2008) reported an association of bone mass with leg problems in Holstein-Friesian dairy cows. Therefore, bone mass can potentially affect FL and other conformation traits.
Various QTL (Supplementary File S2; dx.doi.org/10.6084/m9.figshare.27160302) were previously reported to be located on the genomic regions around the SNPs significantly associated with FL. Cole et al. (2011) identified the SNPs rs134739530 (BTA3:55,365,713 bp) and rs134119868 (BTA3:55,513,275 bp) associated with QTL for FL, FAN, RLSV, ST, and udder depth in the same regions where SNP associated with FL in Holstein cows in the current study. Moreover, some production QTL were found in these genomic regions (body weight, feed conversion ratio, residual feed intake). Pérez-Cabal and Charfeddine (2016) indicated that high body weight was linked to a higher probability of disorders in the conformation of feet and legs in Spanish Holstein cows.
4.2 Foot score traits
Two foot score traits (FAN and HDe) were included in this study, and 40 positional candidate genes (Supplementary Table S3 in Supplementary File S3; dx.doi.org/10.6084/m9.figshare.27160302) were found to be associated with these traits. Yogarajah et al. (2018) reported that increased expression of the RSAD2 (Radical S-Adenosyl Methionine Domain Containing 2) gene, located on BTA11, was correlated to reduced viral replication of Coxsackievirus A16 (CV-A16). This enterovirus causes diseases in the human hand, foot, and mouth. The DGKH (Diacylglycerol Kinase Eta) gene, located on BTA12, was reported as a candidate gene expressed in the pituitary gland for regulating the growth of Yunling and Leiqiong cattle through the secretion of growth-related hormones (Lu et al., 2020). The LRP4 (LDL Receptor Related Protein 4) gene, located on BTA15, has been associated with congenital syndactyly in Holstein cattle (Drögemüller et al., 2007). This is an autosomal recessive abnormality characterized by the fusion of the functional digits (Duchesne et al., 2006).
QTL for bone percentage and carcass weight, milk yield, body weight, and conception rate were previously reported (Supplementary File S2; dx.doi.org/10.6084/m9.figshare.27160302) to overlap with the genomic region identified for foot score traits. These QTL may be influenced by injuries to the foot regions that lead to reduced milk yield, lack of weight gain, poor fertility, and, consequently, animal culling rates (Garvey, 2022). Cole et al. (2011) identified a SNP (rs41628909, BTA1:67,619,208 bp) associated with a QTL for FAN, which was identified to be associated with HDe in the present study. Boichard et al. (2003) identified a SNP (rs137103653, BTA7:28,218,213 bp) associated with HDe, which in this study was identified for FAN. According to Pérez-Cabal and Charfeddine (2016), a high score for FAN means that cows have a steep angle and require less frequent hoof trimming. However, the extremely steep foot angle can interfere with the adequate cushioning effect on the coronary band and can place undue stress on the junction between the wall and the sole of the claw. Furthermore, HDe is the depth of the heel on the outside claw and when its measurement is extremely shallow it was associated with a much higher than average incidence of horn lesions (Chapinal et al., 2013).
Eleven GO terms identified are related to olfactory transducers or receptors. Olfaction is an ancient sensory system that allows organisms to detect chemicals in their environment, and the first step in odor transduction is mediated by binding odorants to olfactory receptors (Gaillard et al., 2004). According to Padodara and Jacob (2014), cattle use the sense of smell to complement their visual information, and social group organization to recognize individual animals and create bonds between mother and offspring. The olfactory communication between animals and reproduction is based mainly on released pheromones, in addition to the fact that in the food search, the odor can condition the animal’s appetite (Padodara and Jacob, 2014).
4.3 Mobility score traits
Ninety positional candidate genes were identified for the five mobility score traits (BQ, FLV, LOC, RLRV, and RLSV) included in this study (Supplementary Tables S9, S10 in Supplementary File S3; dx.doi.org/10.6084/m9.figshare.27160302). Noteworthy genes include RYK (Receiver Like Tyrosine Kinase), EXOC4 (Exocyst Complex Component 4), FGF23 (Fibroblast Growth Factor 23), STMN2 (Stathmin 2), and MAP2K6 (Mitogen-Activated Protein Kinase Kinase 6), located on BTA1, BTA4, BTA5, BTA14, and BTA19, respectively. The RYK gene was previously associated with shortened long bones in the limbs in mice (Andre et al., 2012), while FGF23 was associated with subclinical hypocalcemia in dairy cows and 1,25-Dihydroxyvitamin D synthesis (Simic and Babitt, 2021; Ma et al., 2022). The STMN2 gene was associated with muscle atrophy and impaired motor behavior in mouse (Guerra San Juan et al., 2022) and it is a candidate gene for classical Bovine Spongiform Encephalopathy (Thomson et al., 2012). The EXOC4 gene was identified as a candidate gene for meat quality in Simmental cattle (Bordbar et al., 2019) and for temperament traits in Brahman cattle (Ruiz-De-La-Cruz et al., 2023). The MAP2K6 gene was associated with adaptive thermogenesis in cattle (Ryu et al., 2012). These associations may indicate factors that affect cattle mobility because they are related to muscle, bone, neural, and behavioral development.
Nine QTL for conformation traits (ANG, BD, BQ, FL, FAN, HDe, RLRV, RLSV, and ST) were previously identified in the same region found in the present study for mobility score traits. Cole et al. (2011) identified a SNP (rs132818385, BTA20:18,725,426 bp) associated with QTL regions for RLRV, FL, FAN, and ST, which, in the present study, was identified for BQ, a second SNP (rs109011936, BTA11:78,444,403 bp) associated with RLRV, which was associated with LOC in the current study, and a third SNP (rs41627857, BTA12:8,747,286 bp) associated with RLRV, which was also associated with RLRV in the present study. BQ is assessed by the flatness and cleanness of bone in the shank, hock, and thigh regions (Onyiro and Brotherstone, 2008). According to Atkins and Shannon (2002), a high score of BQ reflects bone that is extremely flat with cleanness throughout and tendons well defined. A good score for this trait may indicate that the animal does not present excessive swelling in the joints, having a good fitness and good circulation in the legs. RLSV assesses the degree of curvature of the hock when viewed from the side. Extremely curved legs were associated with a higher-than-average incidence of horn lesions (Chapinal et al., 2013). The RLRV trait evaluates the straightness of the rear legs when viewed from behind and is measured by the degree of inward deviation of the hocks and the corresponding degree to which the toes point outward (Atkins and Shannon, 2002). Sole ulcer is a hoof problem that can potentially reduce mobility in cattle. This is generally the second leading cause of reported hoof-related lameness in Canadian Holstein cattle (Malchiodi et al., 2020) and is one of the most persistent and costly hoof lesion type (Whay et al., 1998; Cha et al., 2010).
4.4 Dairy strength score traits
This study included six composite dairy strength traits (BCS, BD, CW, DC, HFE, and ST) and identified 128 positional candidate genes (Supplementary Tables S11–S13 in Supplementary File S3; dx.doi.org/10.6084/m9.figshare.27160302). The ALDH9A1 (Aldehyde Dehydrogenase 9 Family Member A1) and PDE4B (Phosphodiesterase 4B) genes on BTA3, are related to fat metabolism. The ALDH9A1 gene is involved in carnitine synthesis and carnitine uptake in the liver of dairy cows in the transition period and at different stages of lactation (Schlegel et al., 2012), and fat metabolism in bovine fetal fibroblasts (Li et al., 2022). In addition to being involved with fat yield, PDE4B is associated with milk yield and protein content in Holstein cows (Lee et al., 2015; Kim et al., 2021). Accordingly, Oliveira Junior et al. (2021) found a positive correlation between DC and milk yield (0.54 ±0.01), DC and protein yield (0.52 ± 0.01), and DC and fat yield (0.45 ± 0.01).
Other positional candidate genes were located on BTA5 (ABCC9 - ATP Binding Cassette Subfamily C Member 9; LGALS1 - Galectin 1), BTA6 (GC - GC Vitamin D Binding Protein; CSN1S1 - Casein Alpha S1), BTA11 (MRPS5 - Mitochondrial Ribosomal Protein S5) and in BTA20 (GHR - Growth Hormone Receptor; OXCT1 - 3-Oxoacid CoA-Transferase 1; RPL37 - Ribosomal Protein L37). Some of these genes were previously associated with milk yield and fertility traits. ABCC9 was associated with udder depth and fore udder attachment (Tribout et al., 2020) and GHR with calf birth weight (Hartati et al., 2019). The ABCC9 gene was also associated with fertility of dairy cows (Nayeri et al., 2016). MRPS5 is a candidate gene for the first postpartum anoestrus interval in Nellore and Brahman cattle (Melo et al., 2019). ABCC9, GHR, and OXCT1 were associated with fat yield and synthesis of milk fatty acids in Holstein cattle (Li et al., 2014; Jiang et al., 2019) CSN1S1 and RPL37 were associated with protein content in German Black Pied (Korkuć et al., 2023) and Ayrshire and Jersey cattle (Oliveira et al., 2019). The LGALS1 and GC genes were previously associated with confer mechanisms of maternal-conceptus immune tolerance (Chaney et al., 2022) and clinical mastitis resistance (Lee et al., 2021) in dairy cattle. In addition to milk yield, already mentioned above, Oliveira Junior et al. (2021) also found correlation with fertility traits, being positive between DC and days open (0.48 ± 0.01) and a negative correlation between BCS and calving to first service (−0.39 ± 0.01).
Previous QTL for conformation traits were reported in the same region where SNPs associated with dairy strength score traits were found. Lee et al. (2021) identified a SNP (rs110310151, BTA6:86,996,470 bp) that was associated with a QTL region for ECC, as also identified in the present study (Supplementary File S2; dx.doi.org/10.6084/m9.figshare.27160302). BCS is a tool to assess dairy cows’ fat reserves, an important factor in dairy cattle management (Roche et al., 2009; Martins et al., 2020). BD was associated with a profitability index (Alcantara et al., 2022), longevity (Zavadilová and Štípková, 2012), feed efficiency (Manafiazar et al., 2016) and fertility (Jagusiak et al., 2014). Ashwell et al. (2005) also identified a SNP (rs29013890, BTA20:34,800,041) associated with a QTL region for BD (Supplementary File S2; dx.doi.org/10.6084/m9.figshare.27160302). An et al. (2020) identified a SNP (rs42848657, BTA11:24,408,850) associated with chest girth, which was associated with CW in the present study. Chest width is measured from the width of chest floor (Canada, 2021). Ashwell et al. (2005) identified a SNP (rs137532092, BTA20:27,329,790 bp) associated with a QTL region for the composite milk capacity index, while in this study it was associated with DC (Supplementary File S2; dx.doi.org/10.6084/m9.figshare.27160302). The classification of DC is done by evaluating the angle of the ribs (direction of the ribs). It is preferable cows with a high spring, angle, and openness of ribs (Canada, 2021). Oliveira Junior et al. (2021) found a negative genetic correlation between ST and age at first service (−0.45 ± 0.01) and a positive genetic correlation with calf size (0.52 ± 0.01). Cole et al. (2011) identified a SNP (rs43345563, BTA3:77,599,781 bp) associated with BD and ST, which in this study was associated with HFE (Supplementary File S2; dx.doi.org/10.6084/m9.figshare.27160302). Significant SNPs associated with ST were also identified in the current study, which overlapped with QTL reported in the literature for the composite milking capacity index (rs110111160, BTA21:60,066,050 bp) (Kolbehdari et al., 2008), PC (BOVINEHD0100039562, BTA1:156730566 bp) (McClure et al., 2010), and chest depth (rs136729009, BTA5:109,344,409 bp) (Boichard et al., 2003).
4.5 Limitations, implications, and next steps
This study identified various SNPs, genomic regions, and positional candidate genes associated with conformation traits in Canadian Holstein cattle. The identified SNPs that are not in the MD panels (Supplementary File S4; dx.doi.org/10.6084/m9.figshare.27160302) could be added to MD panels to potentially increase the accuracy of genomic prediction for the traits evaluated. In this study, we first performed multiple testing correction based on the number of independent chromosomal segments, which depends on the effective population size and genome length in Morgans (Goddard et al., 2011). This strategy has been used in various studies in the literature (Ricard et al., 2017; van den Berg et al., 2019; Jin et al., 2023). However, for completeness, we also performed a much stricter Bonferroni multiple testing correction based on the total number of genome-wide markers for each trait (dependent on QC and LD-based clumping and ranged from 239,533 to 242,747 SNPs). This approach considers that all the tests performed are independent, which is not the case as SNPs are in linkage disequilibrium. The Bonferroni method is also well known for being less tolerant with type I errors (false positive associations), and therefore, it could reduce the ability to identify biologically important genomic regions (false negatives). Therefore, we have focused on the most significant SNPs, but also presented the other suggestive SNPs as Supplementary Material. Additional GWAS analyses based on imputed whole-genome sequence data will be performed subsequently as it could enable the identification of additional associations, as has already been done in previous works (Pedrosa et al., 2021; Chen et al., 2022). Furthermore, as there are more SNPs located on the X chromosome when using whole-genome sequence data, adding these SNPs to the analyses would be another important next step, especially in light of recently-published studies (Sanchez et al., 2023). Application of other omics approaches, such as transcriptomics, is recommended to validate the role of identified SNPs and candidate genes.
5 Conclusion
The genome-wide association analyses performed in this study enabled the identification of numerous SNPs, located across most of the chromosomes, which are significantly associated with body conformation traits in Holstein cattle. The genomic regions around the significant SNPs overlapped with previously reported QTL for classes of exterior, health, meat and carcass, milk production, and reproduction traits. The candidate genes identified are involved with biological pathways associated with bone development, metabolism, diseases, reproduction, and milk production. These results illustrate the genetic complexity of conformation traits in dairy cattle and contribute to the understanding of the molecular mechanisms underlying the phenotypic expression of body conformation traits in Holstein cattle.
Data availability statement
The original contributions presented in the study are included in the article/Supplementary Material, further inquiries can be directed to the corresponding author.
Author contributions
LS: Writing–review and editing, Writing–original draft, Software, Methodology, Formal Analysis, Data curation, Conceptualization. LP: Writing–review and editing, Methodology, Formal Analysis, Conceptualization. VC: Writing–review and editing, Software, Methodology, Formal Analysis, Conceptualization. GO: Writing–review and editing, Software, Methodology, Formal Analysis, Data curation, Conceptualization. HO: Writing–review and editing, Visualization, Methodology, Investigation, Formal Analysis. TC: Writing–review and editing, Resources, Methodology, Investigation. VP: Writing–review and editing, Software, Methodology, Investigation, Data curation. FM: Writing–review and editing, Resources, Project administration, Funding acquisition, Data curation. FS: Writing–review and editing, Validation, Supervision, Resources, Project administration, Methodology, Investigation, Funding acquisition, Formal Analysis, Data curation, Conceptualization. LB: Writing–review and editing, Writing–original draft, Visualization, Validation, Supervision, Software, Resources, Project administration, Methodology, Investigation, Funding acquisition, Formal Analysis, Data curation, Conceptualization.
Funding
The author(s) declare that financial support was received for the research, authorship, and/or publication of this article. Financial support provided by the Agriculture and Agri-Food Canada (Ottawa, ON, Canada), and by additional contributions from Dairy Farmers of Canada (Ottawa, ON Canada), Lactanet (Guelph, ON, Canada), and the Canadian Dairy Commission (Ottawa, ON, Canada) under the Agri-Science Clusters Initiative. The first author also acknowledges the scholarship from FAPESB, process number: BL0459/2020). Luis Fernando Batista Pinto is recipient of CNPq productivity grants in research.
Acknowledgments
The authors thankfully acknowledge the financial support and contributions provided by the Agriculture and Agri-Food Canada (Ottawa, ON, Canada), Dairy Farmers of Canada (Ottawa, ON Canada), Lactanet (Guelph, ON, Canada), Canadian Dairy Commission (Ottawa, ON, Canada), Fundação de Amparo à Pesquisa do Estado da Bahia (FAPESB) and Conselho Nacional de Desenvolvimento Científico e Tecnológico (CNPq). As per the research agreement, researchers maintain independence in conducting their studies, own their data, and report the outcomes regardless of the results. The decision to publish the findings rests solely with the researchers.
Conflict of interest
Author TC was employed by the company PEAK. FM was employed by the company Lactanet Canada.
The remaining authors declare that the research was conducted in the absence of any commercial or financial relationships that could be construed as a potential conflict of interest.
The author(s) declared that they were an editorial board member of Frontiers, at the time of submission. This had no impact on the peer review process and the final decision.
Publisher’s note
All claims expressed in this article are solely those of the authors and do not necessarily represent those of their affiliated organizations, or those of the publisher, the editors and the reviewers. Any product that may be evaluated in this article, or claim that may be made by its manufacturer, is not guaranteed or endorsed by the publisher.
Supplementary material
The Supplementary Material for this article can be found online at: https://www.frontiersin.org/articles/10.3389/fgene.2024.1478788/full#supplementary-material
References
Abdalla, I. M., Lu, X., Nazar, M., Arbab, A. A. I., Xu, T., Yousif, M. H., et al. (2021). Genome-wide association study identifies candidate genes associated with feet and leg conformation traits in Chinese Holstein cattle. Animals 11, 2259. doi:10.3390/ani11082259
Abo-Ismail, M. K., Brito, L. F., Miller, S. P., Sargolzaei, M., Grossi, D. A., Moore, S. S., et al. (2017). Genome-wide association studies and genomic prediction of breeding values for calving performance and body conformation traits in Holstein cattle. Genet. Sel. Evol. 49, 82. doi:10.1186/s12711-017-0356-8
Alcantara, L. M., Baes, C. F., de Oliveira Junior, G. A., and Schenkel, F. S. (2022). Conformation traits of Holstein cows and their association with a Canadian economic selection index. Can. J. Anim. Sci. 102, 490–500. doi:10.1139/cjas-2022-0013
An, B., Xu, L., Xia, J., Wang, X., Miao, J., Chang, T., et al. (2020). Multiple association analysis of loci and candidate genes that regulate body size at three growth stages in Simmental beef cattle. BMC Genet. 21, 32. doi:10.1186/s12863-020-0837-6
Andre, P., Wang, Q., Wang, N., Gao, B., Schilit, A., Halford, M. M., et al. (2012). The wnt coreceptor ryk regulates wnt/planar cell polarity by modulating the degradation of the core planar cell polarity component Vangl2. J. Biol. Chem. 287, 44518–44525. doi:10.1074/jbc.M112.414441
Ashwell, M. S., Heyen, D. W., Weller, J. I., Ron, M., Sonstegard, T. S., Van Tassell, C. P., et al. (2005). Detection of quantitative trait loci influencing conformation traits and calving ease in holstein-friesian cattle. J. Dairy Sci. 88, 4111–4119. doi:10.3168/jds.S0022-0302(05)73095-2
Atkins, G., and Shannon, J. (2002). Minimizing lameness through genetic selection take home messages. Adv. Dairy Technol. 14, 93.
Bacanu, S.-A., Devlin, B., and Roeder, K. (2000). The power of genomic control. Am. J. Hum. Genet. 66, 1933–1944. doi:10.1086/302929
Benjamini, Y., and Hochberg, Y. (2000). On the adaptive control of the false Discovery rate in multiple testing with independent statistics. J. Educ. Behav. Stat. 25, 60–83. doi:10.3102/10769986025001060
Boichard, D., Grohs, C., Bourgeois, F., Cerqueira, F., Faugeras, R., Neau, A., et al. (2003). Detection of genes influencing economic traits in three French dairy cattle breeds. Genet. Sel. Evol. 35, 77–101. doi:10.1186/1297-9686-35-1-77
Bordbar, F., Jensen, J., Zhu, B., Wang, Z., Xu, L., Chang, T., et al. (2019). Identification of muscle-specific candidate genes in Simmental beef cattle using imputed next generation sequencing. PLoS One 14, e0223671. doi:10.1371/journal.pone.0223671
Breckpot, J., Anderlid, B.-M., Alanay, Y., Blyth, M., Brahimi, A., Duban-Bedu, B., et al. (2016). Chromosome 22q12.1 microdeletions: confirmation of the MN1 gene as a candidate gene for cleft palate. Eur. J. Hum. Genet. 24, 51–58. doi:10.1038/ejhg.2015.65
Calus, M. P. L., Bouwman, A. C., Hickey, J. M., Veerkamp, R. F., and Mulder, H. A. (2014). Evaluation of measures of correctness of genotype imputation in the context of genomic prediction: a review of livestock applications. Animal 8, 1743–1753. doi:10.1017/S1751731114001803
Canada, H. (2021). Function conformation traits breakdown. Available at: https://www.holstein.ca/PublicContent/PDFS/2021_CFS_Poster_Web_EN.pdf (Accessed June 1, 2023).
Canada, H. (2023a). Holstein Canada conformation analysis – female. Available at: https://www.holstein.ca/PublicContent/PDFS/Holstein_Female_ScoreCard_Worksheet_EN_June2023.pdf (Accessed October 18, 2023).
Canada, H. (2023b). Breakdown of traits. Available at: https://www.holstein.ca/Public/en/Services/Classification/Breakdown_of_Traits (Accessed October 18, 2023).
Cha, E., Hertl, J. A., Bar, D., and Gröhn, Y. T. (2010). The cost of different types of lameness in dairy cows calculated by dynamic programming. Prev. Vet. Med. 97, 1–8. doi:10.1016/j.prevetmed.2010.07.011
Chaney, H. L., Grose, L. F., LaBarbara, J. M., Sirk, A. W., Blancke, A. M., Sánchez, J. M., et al. (2022). Galectin-1 induces gene and protein expression related to maternal-conceptus immune tolerance in bovine endometrium. Biol. Reprod. 106, 487–502. doi:10.1093/biolre/ioab215
Chapinal, N., Koeck, A., Sewalem, A., Kelton, D. F., Mason, S., Cramer, G., et al. (2013). Genetic parameters for hoof lesions and their relationship with feet and leg traits in Canadian Holstein cows. J. Dairy Sci. 96, 2596–2604. doi:10.3168/jds.2012-6071
Chen, S.-Y., Schenkel, F. S., Melo, A. L. P., Oliveira, H. R., Pedrosa, V. B., Araujo, A. C., et al. (2022). Identifying pleiotropic variants and candidate genes for fertility and reproduction traits in Holstein cattle via association studies based on imputed whole-genome sequence genotypes. BMC Genomics 23, 331. doi:10.1186/s12864-022-08555-z
Čítek, J., Brzáková, M., Bauer, J., Tichý, L., Sztankóová, Z., Vostrý, L., et al. (2022). Genome-wide association study for body conformation traits and fitness in Czech holsteins. Animals 12, 3522. doi:10.3390/ani12243522
Cole, J. B., Wiggans, G. R., Ma, L., Sonstegard, T. S., Lawlor, T. J., Crooker, B. A., et al. (2011). Genome-wide association analysis of thirty one production, health, reproduction and body conformation traits in contemporary U.S. Holstein cows. BMC Genomics 12, 408. doi:10.1186/1471-2164-12-408
Das, S., Forer, L., Schönherr, S., Sidore, C., Locke, A. E., Kwong, A., et al. (2016). Next-generation genotype imputation service and methods. Nat. Genet. 48, 1284–1287. doi:10.1038/ng.3656
Ding, Z.-B., Chen, Y., Zheng, Y.-R., Wang, Y.-Y., Deng, W., Zheng, J.-H., et al. (2024). Inhibition of PPP1R15A alleviates osteoporosis via suppressing RANKL-induced osteoclastogenesis. Acta Pharmacol. Sin. 45, 790–802. doi:10.1038/s41401-023-01209-0
Drögemüller, C., Leeb, T., Harlizius, B., Tammen, I., Distl, O., Höltershinken, M., et al. (2007). Congenital syndactyly in cattle: four novel mutations in the low density lipoprotein receptor-related protein 4 gene (LRP4). BMC Genet. 8, 5. doi:10.1186/1471-2156-8-5
Duchesne, A., Gautier, M., Chadi, S., Grohs, C., Floriot, S., Gallard, Y., et al. (2006). Identification of a doublet missense substitution in the bovine LRP4 gene as a candidate causal mutation for syndactyly in Holstein cattle. Genomics 88, 610–621. doi:10.1016/j.ygeno.2006.05.007
Fang, Z.-H., and Pausch, H. (2019). Multi-trait meta-analyses reveal 25 quantitative trait loci for economically important traits in Brown Swiss cattle. BMC Genomics 20, 695. doi:10.1186/s12864-019-6066-6
Fonseca, P. A. S., Suárez-Vega, A., Marras, G., and Cánovas, Á. (2020). GALLO: an R package for genomic annotation and integration of multiple data sources in livestock for positional candidate loci. Gigascience 9. doi:10.1093/gigascience/giaa149
Fraslin, C., Houston, R. D., and Robledo, D. (2022). Methods for mapping genomic variants associated with production traits in aquaculture species, in Cellular and molecular approaches in fish biology (Elsevier), 193–220. doi:10.1016/B978-0-12-822273-7.00007-0
Gaillard, I., Rouquier, S., and Giorgi, D. (2004). Olfactory receptors. Cell. Mol. Life Sci. 61, 456–469. doi:10.1007/s00018-003-3273-7
Garvey, M. (2022). Lameness in dairy cow herds: disease aetiology, prevention and management. Dairy 3, 199–210. doi:10.3390/dairy3010016
Goddard, M. E., Hayes, B. J., and Meuwissen, T. H. E. (2011). Using the genomic relationship matrix to predict the accuracy of genomic selection. J. Anim. Breed. Genet. 128, 409–421. doi:10.1111/j.1439-0388.2011.00964.x
Guerra San Juan, I., Nash, L. A., Smith, K. S., Leyton-Jaimes, M. F., Qian, M., Klim, J. R., et al. (2022). Loss of mouse Stmn2 function causes motor neuropathy. Neuron 110, 1671–1688.e6. doi:10.1016/j.neuron.2022.02.011
Haque, M. A., Alam, M. Z., Iqbal, A., Lee, Y.-M., Dang, C.-G., and Kim, J.-J. (2023). Genome-wide association studies for body conformation traits in Korean Holstein population. Animals 13, 2964. doi:10.3390/ani13182964
Hartati, H., Soewandi, B., Hapsari, A., Anwar, S., and Pamungkas, D. (2019). Identification of GH|MspI and GHR|AluI gene polymorphism and its association with calf birth weight of grati-PO cattle. J. Ilmu Ternak Dan. Vet. 24, 49. doi:10.14334/jitv.v24i2.1939
Hoebel, A. K., Drichel, D., van de Vorst, M., Böhmer, A. C., Sivalingam, S., Ishorst, N., et al. (2017). Candidate genes for nonsyndromic cleft palate detected by exome sequencing. J. Dent. Res. 96, 1314–1321. doi:10.1177/0022034517722761
Hu, Z.-L., Park, C. A., and Reecy, J. M. (2019). Building a livestock genetic and genomic information knowledgebase through integrative developments of Animal QTLdb and CorrDB. Nucleic Acids Res. 47, D701–D710. doi:10.1093/nar/gky1084
Huang, D. W., Sherman, B. T., Zheng, X., Yang, J., Imamichi, T., Stephens, R., et al. (2009). Extracting biological meaning from large gene lists with DAVID. Curr. Protoc. Bioinforma. 27, Unit 13.11. doi:10.1002/0471250953.bi1311s27
Jagusiak, W., Ptak, E., Żarnecki, A., and Satoła, A. (2014). The relationship between fertility and intermediate optimum type traits in Polish Holstein-Friesian cows. J. Anim. Feed Sci. 23, 23–28. doi:10.22358/jafs/65712/2014
Jiang, J., Ma, L., Prakapenka, D., VanRaden, P. M., Cole, J. B., and Da, Y. (2019). A large-scale genome-wide association study in U.S. Holstein cattle. Front. Genet. 10, 412. doi:10.3389/fgene.2019.00412
Jin, M., Liu, H., Liu, X., Guo, T., Guo, J., Yin, Y., et al. (2023). Complex genetic architecture underlying the plasticity of maize agronomic traits. Plant Commun. 4, 100473. doi:10.1016/j.xplc.2022.100473
Johnson, R. C., Nelson, G. W., Troyer, J. L., Lautenberger, J. A., Kessing, B. D., Winkler, C. A., et al. (2010). Accounting for multiple comparisons in a genome-wide association study (GWAS). BMC Genomics 11, 724. doi:10.1186/1471-2164-11-724
Kempster, A. J., Cuthbertson, A., and Harrington, G. (1982). The relationship between conformation and the yield and distribution of lean meat in the carcasses of British pigs, cattle and sheep: a review. Meat Sci. 6, 37–53. doi:10.1016/0309-1740(82)90049-3
Khmelnychyi, L. M., Vechorka, V. V., and Khmelnychyi, S. L. (2022). Dependence of the milk yield of dairy cows on linear estimation by type. Anim. Husb. Steppe Ukr. 1, 29–35. doi:10.31867/2786-6750.1.1.2022.29-35
Kim, M., Munyaneza, J. P., Cho, E., Jang, A., Jo, C., Nam, K.-C., et al. (2024). Genome-wide association studies of anserine and carnosine contents in the breast meat of Korean native chickens. Poult. Sci. 103, 103590. doi:10.1016/j.psj.2024.103590
Kim, S., Lim, B., Cho, J., Lee, S., Dang, C.-G., Jeon, J.-H., et al. (2021). Genome-wide identification of candidate genes for milk production traits in Korean Holstein cattle. Animals 11, 1392. doi:10.3390/ani11051392
Kolbehdari, D., Wang, Z., Grant, J. R., Murdoch, B., Prasad, A., Xiu, Z., et al. (2008). A whole-genome scan to map quantitative trait loci for conformation and functional traits in Canadian Holstein bulls. J. Dairy Sci. 91, 2844–2856. doi:10.3168/jds.2007-0585
Korkuć, P., Neumann, G. B., Hesse, D., Arends, D., Reißmann, M., Rahmatalla, S., et al. (2023). Whole-genome sequencing data reveal new loci affecting milk production in German Black pied cattle (DSN). Genes. (Basel) 14, 581. doi:10.3390/genes14030581
Lactanet (2021). Heritability estimates used for genetic evaluation in Canada. Available at: https://lactanet.ca/en/heritability-estimates-used-for-genetic-evaluation-in-canada/ (Accessed June 1, 2023).
Lai, E., Danner, A. L., Famula, T. R., and Oberbauer, A. M. (2021). Genome-wide association studies reveal susceptibility loci for noninfectious claw lesions in Holstein dairy cattle. Front. Genet. 12, 657375. doi:10.3389/fgene.2021.657375
Larmer, S. G., Sargolzaei, M., Brito, L. F., Ventura, R. V., and Schenkel, F. S. (2017). Novel methods for genotype imputation to whole-genome sequence and a simple linear model to predict imputation accuracy. BMC Genet. 18, 120. doi:10.1186/s12863-017-0588-1
Lee, Y.-L., Takeda, H., Costa Monteiro Moreira, G., Karim, L., Mullaart, E., Coppieters, W., et al. (2021). A 12 kb multi-allelic copy number variation encompassing a GC gene enhancer is associated with mastitis resistance in dairy cattle. PLOS Genet. 17, e1009331. doi:10.1371/journal.pgen.1009331
Lee, Y.-S., Shin, D., Lee, W., Taye, M., Cho, K., Park, K.-D., et al. (2015). The prediction of the expected current selection coefficient of single nucleotide polymorphism associated with Holstein milk yield, fat and protein contents. Asian-Australasian J. Anim. Sci. 29, 36–42. doi:10.5713/ajas.15.0476
Li, C., Sun, D., Zhang, S., Wang, S., Wu, X., Zhang, Q., et al. (2014). Genome wide association study identifies 20 novel promising genes associated with milk fatty acid traits in Chinese Holstein. PLoS One 9, e96186. doi:10.1371/journal.pone.0096186
Li, G., Yang, R., Lu, X., Liu, Y., He, W., Li, Y., et al. (2022). RNA-seq analysis identifies differentially expressed genes in the longissimus dorsi of wagyu and Chinese red steppe cattle. Int. J. Mol. Sci. 24, 387. doi:10.3390/ijms24010387
Li, X., Buitenhuis, A. J., Lund, M. S., Li, C., Sun, D., Zhang, Q., et al. (2015). Joint genome-wide association study for milk fatty acid traits in Chinese and Danish Holstein populations. J. Dairy Sci. 98, 8152–8163. doi:10.3168/jds.2015-9383
Liu, J., Li, Y., Luo, M., Yuan, Z., and Liu, J. (2017). MicroRNA-214 inhibits the osteogenic differentiation of human osteoblasts through the direct regulation of baculoviral IAP repeat-containing 7. Exp. Cell. Res. 351, 157–162. doi:10.1016/j.yexcr.2017.01.006
Liu, T., Zheng, X., Wang, C., Wang, C., Jiang, S., Li, B., et al. (2021). The m6A “reader” YTHDF1 promotes osteogenesis of bone marrow mesenchymal stem cells through translational control of ZNF839. Cell. Death Dis. 12, 1078. doi:10.1038/s41419-021-04312-4
Loh, P.-R., Danecek, P., Palamara, P. F., Fuchsberger, C., A Reshef, Y., K Finucane, H., et al. (2016). Reference-based phasing using the haplotype reference consortium panel. Nat. Genet. 48, 1443–1448. doi:10.1038/ng.3679
Lu, X., Arbab, A. A. I., Zhang, Z., Fan, Y., Han, Z., Gao, Q., et al. (2020). Comparative transcriptomic analysis of the pituitary gland between cattle breeds differing in growth: yunling cattle and Leiqiong cattle. Animals 10, 1271. doi:10.3390/ani10081271
Ma, X., Gao, C., Yang, M., Zhang, B., Xu, C., and Yang, W. (2022). Characteristics and prediction of subclinical hypocalcemia in dairy cows during the transition period using blood analytes. Med. Weter. 78, 6607–2022. doi:10.21521/mw.6607
Ma, Z., Chang, Y., Brito, L. F., Li, Y., Yang, T., Wang, Y., et al. (2023). Multitrait meta-analyses identify potential candidate genes for growth-related traits in Holstein heifers. J. Dairy Sci. 106, 9055–9070. doi:10.3168/jds.2023-23462
Makanjuola, B. O., Miglior, F., Abdalla, E. A., Maltecca, C., Schenkel, F. S., and Baes, C. F. (2020). Effect of genomic selection on rate of inbreeding and coancestry and effective population size of Holstein and Jersey cattle populations. J. Dairy Sci. 103, 5183–5199. doi:10.3168/jds.2019-18013
Malchiodi, F., Jamrozik, J., Christen, A.-M., Fleming, A., Kistemaker, G. J., Richardson, C., et al. (2020). Symposium review: multiple-trait single-step genomic evaluation for hoof health. J. Dairy Sci. 103, 5346–5353. doi:10.3168/jds.2019-17755
Manafiazar, G., Goonewardene, L., Miglior, F., Crews, D. H., Basarab, J. A., Okine, E., et al. (2016). Genetic and phenotypic correlations among feed efficiency, production and selected conformation traits in dairy cows. Animal 10, 381–389. doi:10.1017/S1751731115002281
Martins, B. M., Mendes, A. L. C., Silva, L. F., Moreira, T. R., Costa, J. H. C., Rotta, P. P., et al. (2020). Estimating body weight, body condition score, and type traits in dairy cows using three dimensional cameras and manual body measurements. Livest. Sci. 236, 104054. doi:10.1016/j.livsci.2020.104054
McClure, M. C., Morsci, N. S., Schnabel, R. D., Kim, J. W., Yao, P., Rolf, M. M., et al. (2010). A genome scan for quantitative trait loci influencing carcass, post-natal growth and reproductive traits in commercial Angus cattle. Anim. Genet. 41, 597–607. doi:10.1111/j.1365-2052.2010.02063.x
Melo, T. P., Fortes, M. R. S., Fernandes Junior, G. A., Albuquerque, L. G., and Carvalheiro, R. (2019). Rapid communication: multi-breed validation study unraveled genomic regions associated with puberty traits segregating across tropically adapted breeds1. J. Anim. Sci. 97, 3027–3033. doi:10.1093/jas/skz121
Miglior, F., Fleming, A., Malchiodi, F., Brito, L. F., Martin, P., and Baes, C. F. (2017). A 100-Year Review: identification and genetic selection of economically important traits in dairy cattle. J. Dairy Sci. 100, 10251–10271. doi:10.3168/jds.2017-12968
Nayeri, S., Sargolzaei, M., Abo-Ismail, M. K., May, N., Miller, S. P., Schenkel, F., et al. (2016). Genome-wide association for milk production and female fertility traits in Canadian dairy Holstein cattle. BMC Genet. 17, 75. doi:10.1186/s12863-016-0386-1
Oliveira, H. R., Lourenco, D. A. L., Masuda, Y., Misztal, I., Tsuruta, S., Jamrozik, J., et al. (2019). Single-step genome-wide association for longitudinal traits of Canadian Ayrshire, Holstein, and Jersey dairy cattle. J. Dairy Sci. 102, 9995–10011. doi:10.3168/jds.2019-16821
Oliveira Junior, G. A., Schenkel, F. S., Alcantara, L., Houlahan, K., Lynch, C., and Baes, C. F. (2021). Estimated genetic parameters for all genetically evaluated traits in Canadian Holsteins. J. Dairy Sci. 104, 9002–9015. doi:10.3168/jds.2021-20227
Onyiro, O. M., and Brotherstone, S. (2008). Genetic analysis of locomotion and associated conformation traits of holstein-friesian dairy cows managed in different housing systems. J. Dairy Sci. 91, 322–328. doi:10.3168/jds.2007-0514
Padodara, R. J., and Jacob, N. (2014). Olfactory sense in different animals. Indian J. Vet. Sci. 2, 1–14.
Pedrosa, V. B., Schenkel, F. S., Chen, S.-Y., Oliveira, H. R., Casey, T. M., Melka, M. G., et al. (2021). Genomewide association analyses of lactation persistency and milk production traits in Holstein cattle based on imputed whole-genome sequence data. Genes. (Basel) 12, 1830. doi:10.3390/genes12111830
Pérez-Cabal, M. A., and Charfeddine, N. (2016). Short communication: association of foot and leg conformation and body weight with claw disorders in Spanish Holstein cows. J. Dairy Sci. 99, 9104–9108. doi:10.3168/jds.2016-11331
Privé, F., Aschard, H., Ziyatdinov, A., and Blum, M. G. B. (2018). Efficient analysis of large-scale genome-wide data with two R packages: bigstatsr and bigsnpr. Bioinformatics 34, 2781–2787. doi:10.1093/bioinformatics/bty185
Purcell, S., Neale, B., Todd-Brown, K., Thomas, L., Ferreira, M. A. R., Bender, D., et al. (2007). PLINK: a tool set for whole-genome association and population-based linkage analyses. Am. J. Hum. Genet. 81, 559–575. doi:10.1086/519795
Rajasekaran, S., Soundararajan, D. C. R., Nayagam, S. M., Tangavel, C., Raveendran, M., K S, S. V. A., et al. (2023). Novel biomarkers of health and degeneration in human intervertebral discs: in-depth proteomic analysis of collagen framework of fetal, healthy, scoliotic, degenerate, and herniated discs. Asian Spine J. 17, 17–29. doi:10.31616/asj.2021.0535
Ricard, A., Robert, C., Blouin, C., Baste, F., Torquet, G., Morgenthaler, C., et al. (2017). Endurance exercise ability in the horse: a trait with complex polygenic determinism. Front. Genet. 8, 89. doi:10.3389/fgene.2017.00089
Ring, S. C., Twomey, A. J., Byrne, N., Kelleher, M. M., Pabiou, T., Doherty, M. L., et al. (2018). Genetic selection for hoof health traits and cow mobility scores can accelerate the rate of genetic gain in producer-scored lameness in dairy cows. J. Dairy Sci. 101, 10034–10047. doi:10.3168/jds.2018-15009
Roche, J. R., Friggens, N. C., Kay, J. K., Fisher, M. W., Stafford, K. J., and Berry, D. P. (2009). Invited review: body condition score and its association with dairy cow productivity, health, and welfare. J. Dairy Sci. 92, 5769–5801. doi:10.3168/jds.2009-2431
Ruiz-De-La-Cruz, G., Sifuentes-Rincón, A. M., Paredes-Sánchez, F. A., Parra-Bracamonte, G. M., Casas, E., Welsh, T. H., et al. (2023). Characterization of intronic SNP located in candidate genes influencing cattle temperament. Rev. Bras. Zootec. 52. doi:10.37496/rbz5220220057
Ryu, J., Kim, Y., Kim, C., Kim, J., and Lee, C. (2012). Association of bovine carcass phenotypes with genes in an adaptive thermogenesis pathway. Mol. Biol. Rep. 39, 1441–1445. doi:10.1007/s11033-011-0880-5
Sahana, G., Cai, Z., Sanchez, M. P., Bouwman, A. C., and Boichard, D. (2023). Invited review: good practices in genome-wide association studies to identify candidate sequence variants in dairy cattle. J. Dairy Sci. 106, 5218–5241. doi:10.3168/jds.2022-22694
Sanchez, M.-P., Escouflaire, C., Baur, A., Bottin, F., Hozé, C., Boussaha, M., et al. (2023). X-linked genes influence various complex traits in dairy cattle. BMC Genomics 24, 338. doi:10.1186/s12864-023-09438-7
Sargolzaei, M., Schenkel, F. S., Jansen, G. B., and Schaeffer, L. R. (2008). Extent of linkage disequilibrium in Holstein cattle in North America. J. Dairy Sci. 91, 2106–2117. doi:10.3168/jds.2007-0553
Schlegel, G., Keller, J., Hirche, F., Geißler, S., Schwarz, F. J., Ringseis, R., et al. (2012). Expression of genes involved in hepatic carnitine synthesis and uptake in dairy cows in the transition period and at different stages of lactation. BMC Vet. Res. 8, 28. doi:10.1186/1746-6148-8-28
Simic, P., and Babitt, J. L. (2021). Regulation of FGF23: beyond bone. Curr. Osteoporos. Rep. 19, 563–573. doi:10.1007/s11914-021-00703-w
Sölzer, N., May, K., Yin, T., and König, S. (2022). Genomic analyses of claw disorders in Holstein cows: genetic parameters, trait associations, and genome-wide associations considering interactions of SNP and heat stress. J. Dairy Sci. 105, 8218–8236. doi:10.3168/jds.2022-22087
Thomson, J. M., Bowles, V., Choi, J.-W., Basu, U., Meng, Y., Stothard, P., et al. (2012). The identification of candidate genes and SNP markers for classical bovine spongiform encephalopathy susceptibility. Prion 6, 461–469. doi:10.4161/pri.21866
Tribout, T., Croiseau, P., Lefebvre, R., Barbat, A., Boussaha, M., Fritz, S., et al. (2020). Confirmed effects of candidate variants for milk production, udder health, and udder morphology in dairy cattle. Genet. Sel. Evol. 52, 55. doi:10.1186/s12711-020-00575-1
Uzzaman, M. R., Park, J.-E., Lee, K.-T., Cho, E.-S., Choi, B.-H., and Kim, T.-H. (2018). Whole-genome association and genome partitioning revealed variants and explained heritability for total number of teats in a Yorkshire pig population. Asian-Australasian J. Anim. Sci. 31, 473–479. doi:10.5713/ajas.17.0178
van den Berg, S., Vandenplas, J., van Eeuwijk, F. A., Bouwman, A. C., Lopes, M. S., and Veerkamp, R. F. (2019). Imputation to whole-genome sequence using multiple pig populations and its use in genome-wide association studies. Genet. Sel. Evol. 51, 2. doi:10.1186/s12711-019-0445-y
VanRaden, P. M. (2008). Efficient methods to compute genomic predictions. J. Dairy Sci. 91, 4414–4423. doi:10.3168/jds.2007-0980
VanRaden, P. M., Tooker, M. E., O’Connell, J. R., Cole, J. B., and Bickhart, D. M. (2017). Selecting sequence variants to improve genomic predictions for dairy cattle. Genet. Sel. Evol. 49, 32. doi:10.1186/s12711-017-0307-4
VanRaden, P. M., Van Tassell, C. P., Wiggans, G. R., Sonstegard, T. S., Schnabel, R. D., Taylor, J. F., et al. (2009). Invited review: reliability of genomic predictions for North American Holstein bulls. J. Dairy Sci. 92, 16–24. doi:10.3168/jds.2008-1514
Wang, X., Li, Y., Qiang, G., Wang, K., Dai, J., McCann, M., et al. (2022). Secreted EMC10 is upregulated in human obesity and its neutralizing antibody prevents diet-induced obesity in mice. Nat. Commun. 13, 7323. doi:10.1038/s41467-022-34259-9
Wang, Z., Shen, B., Jiang, J., Li, J., and Ma, L. (2016). Effect of sex, age and genetics on crossover interference in cattle. Sci. Rep. 6, 37698. doi:10.1038/srep37698
Wei, W., Dutchak, P. A., Wang, X., Ding, X., Wang, X., Bookout, A. L., et al. (2012). Fibroblast growth factor 21 promotes bone loss by potentiating the effects of peroxisome proliferator-activated receptor γ. Proc. Natl. Acad. Sci. 109, 3143–3148. doi:10.1073/pnas.1200797109
Whay, H. R., Waterman, A. E., Webster, A. J. F., and O’Brien, J. K. (1998). The influence of lesion type on the duration ofhyperalgesia associated with hindlimb lameness in dairy cattle. Vet. J. 156, 23–29. doi:10.1016/S1090-0233(98)80058-0
Yang, J., Lee, S. H., Goddard, M. E., and Visscher, P. M. (2011). GCTA: a tool for genome-wide complex trait analysis. Am. J. Hum. Genet. 88, 76–82. doi:10.1016/j.ajhg.2010.11.011
Yang, J., Zaitlen, N. A., Goddard, M. E., Visscher, P. M., and Price, A. L. (2014). Advantages and pitfalls in the application of mixed-model association methods. Nat. Genet. 46, 100–106. doi:10.1038/ng.2876
Yogarajah, T., Ong, K. C., Perera, D., and Wong, K. T. (2018). RSAD2 and AIM2 modulate Coxsackievirus A16 and enterovirus A71 replication in neuronal cells in different ways that may Be associated with their 5′ nontranslated regions. J. Virol. 92, e01914–e01917. doi:10.1128/JVI.01914-17
Zaman, F., Chrysis, D., Huntjens, K., Fadeel, B., and Sävendahl, L. (2012). Ablation of the pro-apoptotic protein bax protects mice from glucocorticoid-induced bone growth impairment. PLoS One 7, e33168. doi:10.1371/journal.pone.0033168
Keywords: dairy cattle, high density genotypes, GWAS, type traits, imputation
Citation: Sousa Junior LPB, Pinto LFB, Cruz VAR, Oliveira Junior GA, Oliveira HR, Chud TS, Pedrosa VB, Miglior F, Schenkel FS and Brito LF (2024) Genome-wide association and functional genomic analyses for body conformation traits in North American Holstein cattle. Front. Genet. 15:1478788. doi: 10.3389/fgene.2024.1478788
Received: 10 August 2024; Accepted: 10 October 2024;
Published: 24 October 2024.
Edited by:
Fernando Baldi, São Paulo State University, BrazilReviewed by:
Thiruvenkadan Aranganoor Kannan, Tamil Nadu Veterinary and Animal Sciences University, IndiaCamila Urbano Braz, University of Illinois at Urbana-Champaign, United States
Copyright © 2024 Sousa Junior, Pinto, Cruz, Oliveira Junior, Oliveira, Chud, Pedrosa, Miglior, Schenkel and Brito. This is an open-access article distributed under the terms of the Creative Commons Attribution License (CC BY). The use, distribution or reproduction in other forums is permitted, provided the original author(s) and the copyright owner(s) are credited and that the original publication in this journal is cited, in accordance with accepted academic practice. No use, distribution or reproduction is permitted which does not comply with these terms.
*Correspondence: Luiz F. Brito, YnJpdG9sQHB1cmR1ZS5lZHU=
†These authors share the last authorship