 João B. Silva Neto
 Luiz F. Brito
 Lucio Flavio M. Mota
 Claudio U. Magnabosco3
 Fernando Baldi
- 1Department of Animal Science, School of Agricultural and Veterinarian Sciences (FCAV), São Paulo State University (UNESP), Jaboticabal, Brazil
- 2Department of Animal Sciences, Purdue University, West Lafayette, IN, United States
- 3Cerrados Agricultural Research Center, Embrapa Rice and Beans, Santo Antônio de Goiás, Brazil
Introduction: Feed efficiency is a key factor in animal production sustainability, directly affecting production costs, environmental efficiency, and farmer profitability. The inclusion of feeding efficiency traits in cattle breeding programs has occurred later than other species due to longer life cycles and the high costs associated with measuring feed intake. However, genomic selection has facilitated the inclusion of difficult-to-measure traits in selection schemes. Thus, understanding the genetic basis of feed efficiency, particularly under varying environmental conditions, is essential.
Methods: This study aimed to identify genomic regions associated with dry matter intake (DMI) and residual feed intake (RFI) in Nellore cattle by performing a genome-wide association study (GWAS) based on single-step genomic reaction norm models that account for genotype-by-environment interactions (G×E). Phenotypic data from 23,170 young bulls and heifers were collected across 301 feed efficiency trials. Genomic windows explaining more than 1% of the total direct additive genetic variance were identified for both the intercept and slope components of the reaction norm for each trait.
Results: For RFI, ten and eleven genomic windows explained more than 1% of the genetic variance for the intercept and slope, respectively. For DMI, 12 windows were identified for the intercept and 17 for the slope. Within these regions, Multiple protein-coding genes were annotated (RFI: 66 for intercept and 47 for slope; DMI: 107 for intercept and 109 for slope), which are involved in key biological processes such as insulin, leptin, glucose, protein, and lipid metabolism; energy balance; heat stress response; feeding behavior; digestion; and nutrient absorption.
Discussion: The results highlight the functional diversity of genes involved in feed efficiency and their dynamic response to environmental variation. While certain genes remained central across environments, others were specifically important under more challenging conditions, emphasizing the role of G×E in regulating these traits. Furthermore, the magnitude and direction of SNP effects varied across environmental gradients, reinforcing the relevance of G×E. Consequently, genomic estimated breeding values for DMI and RFI also differed between environmental extremes. These findings underscore the adaptability of genetic networks to environmental changes and are essential for refining strategies to improve feed efficiency in Nellore cattle.
1 Introduction
In animal production, the feed efficiency of individuals is one of the main determinants of production costs, environmental impact, and farm profitability (Nahm, 2002; Kenny et al., 2018). However, despite the strong influence of feed efficiency on the financial return of animal production (Herd and Arthur, 2009; Patience et al., 2015; McLoughlin et al., 2020), in cattle, its measurement and incorporation into selection indices began later compared to poultry and swine (Bottje and Carstens, 2009). This delay can be attributed to several factors unique to poultry and swine farming systems, including shorter life cycles (Tokach et al., 2016; Mottet and Tempio, 2017), easier management, and greater control over environmental and feeding conditions (Kyriazakis, 2011; Gilbert et al., 2015), facilitating standardization and measurement of feed efficiency with greater precision. Furthermore, these species tend to experience greater response to genetic improvement due to the shorter generation intervals and higher selection intensities due to the larger number of offspring per generation.
Given the diversity in cattle production systems and the high costs of accurately measuring individual feed intake, genomic selection (Meuwissen et al., 2001) represents a great opportunity for genetically improving difficult or expensive-to-measure traits such as feed efficiency (Pryce et al., 2014). The wide availability of genomic information has also contributed to a better understanding of the genetic architecture of complex traits, improving the accuracy of selection, particularly for traits with low heritability and more difficult or expensive to measure (Hayes et al., 2007; da Silva Neto et al., 2023), such as feed efficiency traits.
Feed efficiency is influenced by multiple underlying biological mechanisms, such as age, sex, locomotor activity, caloric increment, body composition, feeding behavior, and others (Basarab et al., 2003; Herd et al., 2004; Herd and Arthur, 2009; Haskell et al., 2019). A particularity when considering feed efficiency in ruminants is their ability to convert plant biomass into volatile fatty acids (VFA), proteins, and vitamins due to the presence of microorganisms in the rumen that ferment and transform their feed (McLoughlin et al., 2020; Fregulia et al., 2021; Zhao et al., 2024). These microorganisms are responsible for producing most of the VFAs that serve as metabolizable energy sources for the host (Enjalbert et al., 2017; Zeineldin et al., 2018; McLoughlin et al., 2020; Zhao et al., 2024). Mechanisms related to ruminal function contribute to 23% of the variation in feed efficiency in cattle (Herd et al., 2004). Furthermore, the variability in ruminal microbiota has been associated with feed efficiency, with diet being one of the main components influencing the composition, diversity, and functionality of the rumen microbiome (Krause et al., 2013; Shabat et al., 2016; Ellison et al., 2017; 2019).
Metabolizable energy (ME) is another crucial determinant of feed efficiency in cattle, as it provides the energy needed for vital functions such as maintenance, growth and production (Reynolds et al., 2011; Marcondes et al., 2013; Arndt et al., 2015). Differences in ME utilization efficiency arise from interactions between diet composition, rumen activity and the animal’s physiological processes (Moe, 1981; Reynolds et al., 2011; Hales, 2019). Diets with high energy density, such as those rich in grain, increase ME availability, improving feed efficiency by reducing losses associated with digestion and increasing nutrient assimilation (Reynolds et al., 2011; Hales et al., 2017). In contrast, fiber-rich diets often result in lower ME availability, which poses challenges for animals with higher genetic potential for growth (Nkrumah et al., 2006; Reynolds et al., 2011). Variations in microbiota, driven by diet or environmental factors and management practices, can significantly influence the efficiency of ME utilization (Shabat et al., 2016; Ellison et al., 2017; 2019). These complex interactions between ME, diet, and animal physiology highlight the challenges and opportunities in selecting cattle for greater feed efficiency in diverse production systems.
We have previously assessed genotype-by-environment interactions (G × E) for dry matter intake (DMI) and residual feed intake (RFI) in Nellore cattle using bivariate reaction norm models (RN) (Silva Neto et al., 2023). The environmental gradient (EG) was defined based on the Best Linear Unbiased Estimation (BLUE) solutions of the contemporary groups (CG) for ADG, which captures differences in nutritional, environmental, and management practices during the feed efficiency trials. Heritability estimates for DMI and RFI ranging from 0.26 to 0.54 and 0.07 to 0.41 across EG levels were obtained, respectively, with average genetic correlations for the same trait at different EG of 0.83 and 0.81. The lowest correlations were observed between extreme levels of EG (i.e., 0.22 for RFI and 0.26 for DMI). These results indicated the presence of G × E interactions, particularly under extreme environmental conditions (low and high EG values), resulting in significant reranking of selected animals. These findings underscore the complexities involved in selecting for feed efficiency across varying environments.
Genome-wide association studies have been extensively conducted for traits related to feed efficiency traits in cattle, including DMI and RFI (de Oliveira et al., 2014; Olivieri et al., 2018; Seabury et al., 2017; Brunes et al., 2020). These studies have identified important genetic loci that influence these economically important traits in livestock (Brito et al., 2020). However, there is a notable gap in the literature regarding the inclusion of G × E interactions in these analyses, especially for beef cattle raised under varying environmental conditions, such as in the Nellore breed (Silva Neto et al., 2024). The lack of studies addressing this interaction for traits like DMI and RFI highlights the need for future research that incorporates environmental variation, enabling more precise and effective selection of animals adapted to diverse environmental scenarios.
Therefore, the primary objectives of this study were to: 1) conduct a genome-wide association study (GWAS) using a single-step genomic reaction norm model to identify specific genomic regions associated with dry matter intake and residual feed intake in Nellore cattle (Bos taurus indicus) considering G × E interactions; and 2) identify biological processes and metabolic pathways that regulate the expression of DMI and RFI across EG levels. The findings from this study have the potential to provide valuable information into the genetic mechanisms underlying feed efficiency in Nellore cattle, offering a deeper understanding of how environmental conditions modulate the expression of feed efficiency in Nellore cattle.
2 Methods
2.1 Field data
Individual feed intake was measured on 23,170 Nellore animals (16,430 males and 6,740 females) from 2011 to 2023. The National Association of Breeders and Researchers (ANCP, Ribeirão Preto, SP, Brazil; www.ancp.org.br) provided the data. Animals were recorded during 301 feeding trials and belonged to 25 farms. The dataset used includes phenotypic information for ADG, DMI, and RFI, following the procedures for measuring individual feed intake in beef cattle (Mendes et al., 2020). The herds involved are highly connected due to the use of common sires through artificial insemination (AI), with at least five genetic links across the feeding trials, which were evaluated using the AMC program (Roso and Schenkel, 2006). The animals were raised on pasture-based systems (Urochloa brizantha cv). The commercial herds adopted different nutritional practices with some farms providing protein and mineral supplementation, especially during the dry season, while others provided only urea supplementation.
2.2 Phenotypic information
The feeding trial was performed in group pens with animals grouped by sex. Feed intake was recorded automatically based using the GrowSafe (www.vytelle.com) and Intergado (www.intergado.com) feeding systems. Detailed information on diet composition, management, and the description of the evaluated traits, i.e., ADG, DMI, and RFI, is provided in Silva Neto et al. (2023). Performance evaluations and feed intake measurements followed the recommended protocols for beef cattle, as described by Mendes et al. (2020). To ensure consistency across trials, it is recommended that the diet be provided ad libitum as a total mixed ration (TMR), with a homogeneous blend of forage and concentrate to prevent ingredient selection by the animals. The same standardized dietary formulation should be maintained across all trials conducted at the same facility, with only minimal adjustments in ingredient quantities. Feed refusals should be monitored and maintained between 5% and 10% of the total amount offered. The nutritional value of the diet should reflect that of high-quality pasture, with total digestible nutrient (TDN) levels aligned with the expected average daily weight gain for the animal category under evaluation. The dietary energy concentration should range from 2.4 to 2.8 Mcal of metabolizable energy per kilogram of dry matter, and the average daily gain of the group should not exceed 2.0 kg/day.
Across the feed efficiency trials, variations in dietary composition were observed among different farms, and in some cases, within the same farm across different years. In general, the forage fraction accounted for 70%–80% of the total diet, consisting predominantly of corn or sorghum silage, although some farms used silage from Brachiaria grass species. The concentrate fraction primarily consisted of ground corn and ground sorghum, with the addition of protein sources in some trials, such as soybean meal, soybean hulls, and urea.
The dietary effect was indirectly accounted for by including the contemporary group (CG) as a fixed effect in the statistical model (see Section 2.4.1). Information on geographic regions, climate conditions, and the number of animals per farm is available in Supplementary File 1 (Supplementary Table S1). The descriptive statistics for these traits are reported in Table 1.
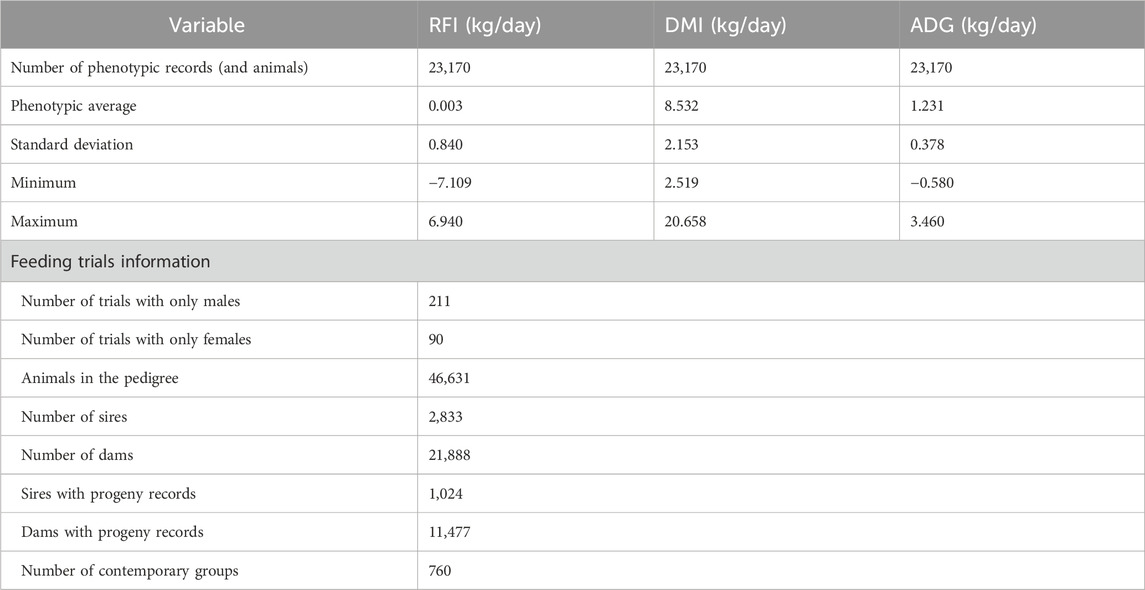
Table 1. Descriptive statistics for dry matter intake (DMI), residual feed intake (RFI), and average daily liveweight gain (ADG) during feeding trials in Nellore cattle.
2.3 Genomic data
A total of 18,567 animals born between 2014 and 2022 were genotyped with a SNP panel containing 65,414 markers (Clarifide® Nelore 3.0). The genotypes were imputed to a SNP panel containing 735,964 markers using the Fimpute 3.0 software (Sargolzaei et al., 2014). The reference population for genotype imputation consisted of 963 representative sires of the main Nellore lineages (i.e., Karvadi, Golias, Godhavari, Taj Mahal, Akasamu, and Nagpur). These reference sires were born between 1995 and 2015 and genotyped with the Illumina BovineHD BeadChip (Illumina Inc., San Diego, CA, USA). Before imputation, we removed non-autosomal markers and autosomal SNPs with GenCall <0.6 to remove genotyping problems. We evaluated imputation accuracy by splitting the reference population into three folds, simulating the medium-density panel density (Mota et al., 2024), resulting in an accuracy of 0.98 like da Silva Neto et al. (2023). The quality control of genotypes after the imputation was performed using the QCF90 software (Misztal et al., 2014). Samples and SNPs with a call rate lower than 0.90 were removed from the dataset. Markers with more than 1% of Mendelian conflicts, with unknown or redundant genomic positions, MAF lower than 0.05, and those located in non-autosomal chromosomes were also removed. After quality control, 18,567 genotyped animals and 452,283 SNPs were retained for further analyses.
2.4 Statistical Modelling
2.4.1 Reaction norm models
A two-step reaction norm model (Mota et al., 2020a; Silva Neto et al., 2023) was considered in the present study. In the first step, the ADG during the feeding trials was used to define the EG levels, given that the actual ADG shows significant variation from the recommended ADG of 1.0 kg per day (Mendes et al., 2020). The best linear unbiased estimates (BLUE) solutions of the CG for ADG were used to quantify potential differences between the management, nutritional, and environmental conditions during the feeding trials. Thus, differences in ADG among CG were used as an indirect indicator of better or worse environmental conditions, as higher ADG values were interpreted as being associated with more favorable environments. The CG was defined by year and season of the feeding trial, farm, sex (males and females were allocated to different batches). Age at the beginning of trials (415 ± 116 days of age) was considered a linear covariate in the model. The CG solutions were obtained with an animal model using the best linear unbiased predictions (BLUP) as follows:
where
In the second step, to estimate the GEBV for DMI and RFI across the EG levels, a single step bi-trait genomic reaction norm model (ssBRN) was used as follows:
where
The additive and residual genetic effects were considered normally distributed:
where,
Posterior distribution samples of the (co)variance components were obtained through Bayesian inference using the Gibbs sampling algorithm, implemented in the GIBBSF90 software (Misztal et al., 2014). The Bayesian analyses consisted of a single chain of 500,000 cycles, a burn-in of 50,000 iterations, and storage of values every ten cycles. The convergence was evaluated through visual inspection using the Bayesian Output Analysis (Smith, 2007) and Geweke test (Geweke, 1992).
2.4.2 Estimates of SNPs effects in different environments
The SNP effects for the intercept and slope were obtained using weighted single-step GWAS (WssGWAS) (Wang et al., 2012). The breeding value of the genotyped animals (
where
where D represents the diagonal matrix of the weights for the SNP variances (D = I for GBLUP),
where, λ is a ratio of variances
In this way, the best predictor of the SNPs effects given by the genetic effect can be estimated. Estimates of the SNP effects can be used to estimate the individual variance of each SNP effect (
In summary, the SNP effects and weights for the WssGWAS were derived as follows (Wang et al., 2012):
1. Let D = I in the first step.
2. Calculate G =
3. Calculate GEBVs for the entire data set using the ssGBLUP.
4. Convert GEBVs to SNP effects (û): û =
5. Calculate the weight for each SNP: di = û2i2pi(1−pi), where i is the i-th SNP.
6. Normalize SNP weights to remain the total genetic variance constant.
The SNP weights were calculated iteratively through two iterations. The proportion of the genetic variance explained by moving genomic windows of 100 adjacent SNP were computed according to Wang et al. (2012):
where
2.5 Gene enrichment analyses
The proportion of the total direct additive genetic variance explained by each genomic window containing 100 SNPs was visualized using Manhattan plots, generated with the CMplot v4.3.0 package in R (Yin et al., 2021). The identified relevant genomic regions were annotated using the Bos taurus ARS-UCD1.2 assembly as the reference genome (Rosen et al., 2020). Candidate genes were identified based on the BioMart tool in the ENSEMBL platform (www.ensembl.org/biomart/martview/).
Gene Ontology (GO) and KEGG pathway enrichment analyses (p < 0.05) were conducted using the Database for Annotation, Visualization, and Integrated Discovery (DAVID; version 6.8) (Dennis et al., 2003). This was done to identify biological processes, molecular functions, cellular components, and metabolic pathways associated with positional candidate genes. Interactions between protein-coding genes were predicted using the STRING database with default settings (Szklarczyk et al., 2015).
3 Results and discussion
3.1 Phenotypic means of RFI, DMI, and ADG across EG levels
The phenotypic means and standard deviations by EG for the studied traits are presented in Table 2. For DMI and ADG, the mean values displayed an increasing trend as the environment became more favorable (or less restrictive), with DMI ranging from 7.14 ± 1.40 (EG 2) to 12.80 ± 3.00 (EG 17) kg of DM/day and ADG from 0.696 (EG 1) to 2.050 (EG 17) kg/day. RFI, an indicator of feed efficiency, remained relatively low and stable across the EG levels, ranging from 0.00 ± 0.687 (EG 2) to 0.30 ± 1.450 (EG 17) kg DM/day. This suggests that, in general, animals consumed more feed and grew faster in better environments, while their efficiency in converting feed to body mass remained largely consistent across EG levels. However, small fluctuations in RFI among EG levels might indicate a slight reduction in feed efficiency under highly favorable environmental conditions. This finding suggests that the animals might consume more feed than needed for growth and maintenance in highly favorable conditions, which could result in less efficient nutrient utilization. Furthermore, the phenotypic expression of RFI can also be influenced by genetic differences in feed utilization, management practices, or dietary composition across farms.
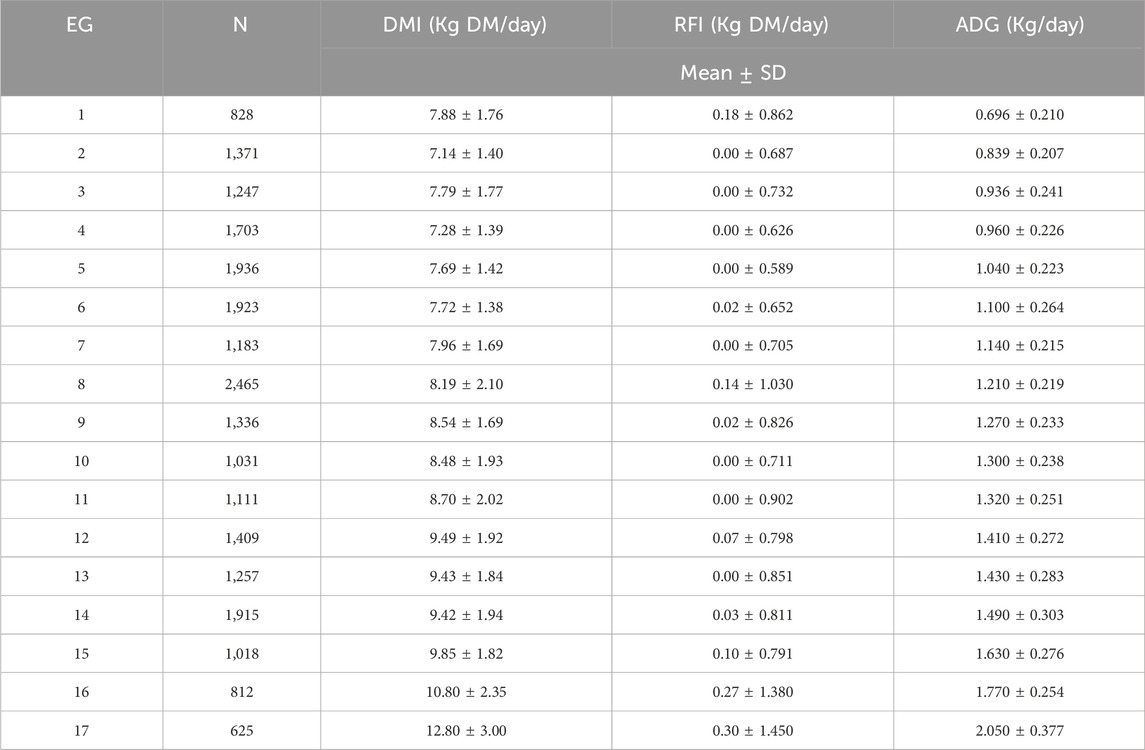
Table 2. Number of records (N) and descriptive statistics for dry matter intake (DMI), residual feed intake (RFI), and average daily liveweight gain (ADG) by environmental gradient level (EG) in Nellore cattle.
Considering the recommendation to provide a diet that supports an ADG of around 1.0 kg/day during feeding trials (Mendes et al., 2020), there was significant variability in ADG across the different EGs (Table 2). This variation may be attributed to the physicochemical differences in dietary ingredients, which likely resulted from the wide climatic and geographic diversity across the regions where the trials were held. Another important aspect is that differences in management practices (for example, individual or collective feed distribution systems and different animal densities in the pen), the genetic background of herds, and the genetic selection strategies employed by various farms also play a crucial role in ADG variability. The combination of all these factors underscores the complexity of GxE on feed efficiency traits measured in Nellore cattle (Silva Neto et al., 2023).
3.2 Genome-wide association study and functional genomic enrichment
In this study, we performed a GWAS that considered GxE interactions for DMI and RFI, an approach not yet explored in previously published work for these traits. The results are presented in terms of intercept and slope, providing a more detailed assessment of GxE interactions for these feed efficiency traits. The intercept represents the adjusted mean value of the trait, excluding environmental temporal influences (Mota et al., 2020a; b; Silva Neto et al., 2023; 2024). This can be interpreted as the genetic baseline of the trait under idealized conditions, where environmental effects are considered standard. In practice, the intercept captures the genetic variation of the trait before considering interactions with the environment or over time. On the other hand, the slope quantifies the rate of change in the trait as environmental or temporal factors vary (Oliveira et al., 2018; Mota et al., 2020a; b; Silva Neto et al., 2024). The slope measures how the trait responds to these changes, offering insight into the GxE interaction. This model allows for a deeper understanding of the dynamics between genetic and environmental factors in animal performance, aiding in the selection of genetically more adaptable individuals to diverse environmental conditions (Silva Neto et al., 2024).
3.2.1 Intercept for RFI
In this study, ten genomic windows explained more than 1% of the intercept’s total direct additive genetic variance for RFI (Table 3; Figure 1). These genomic windows are located on seven chromosomes: BTA1 (94.24–95.04 Mb and 95.05–95.90 Mb), BTA3 (79.33–80.65 Mb), BTA4 (71.07–72.11 Mb and 110.35–110.80 Mb), BTA5 (66.72–67.21 Mb), BTA12 (15.05–15.49 Mb and 42.95–43.49 Mb), BTA14 (10.43–10.64 Mb), and BTA18 (34.60–35.22 Mb). Within these genomic regions, a total of 71 genes were identified, including 2 miRNAs, 66 protein-coding genes, 1 snoRNA, and 2 snRNAs. These results highlight the polygenic architecture of RFI, a trait influenced by multiple genomic regions exerting additive effects on its phenotypic expression.

Table 3. List of the top genomic windows that explained more than 1% of the total direct additive genetic variance (
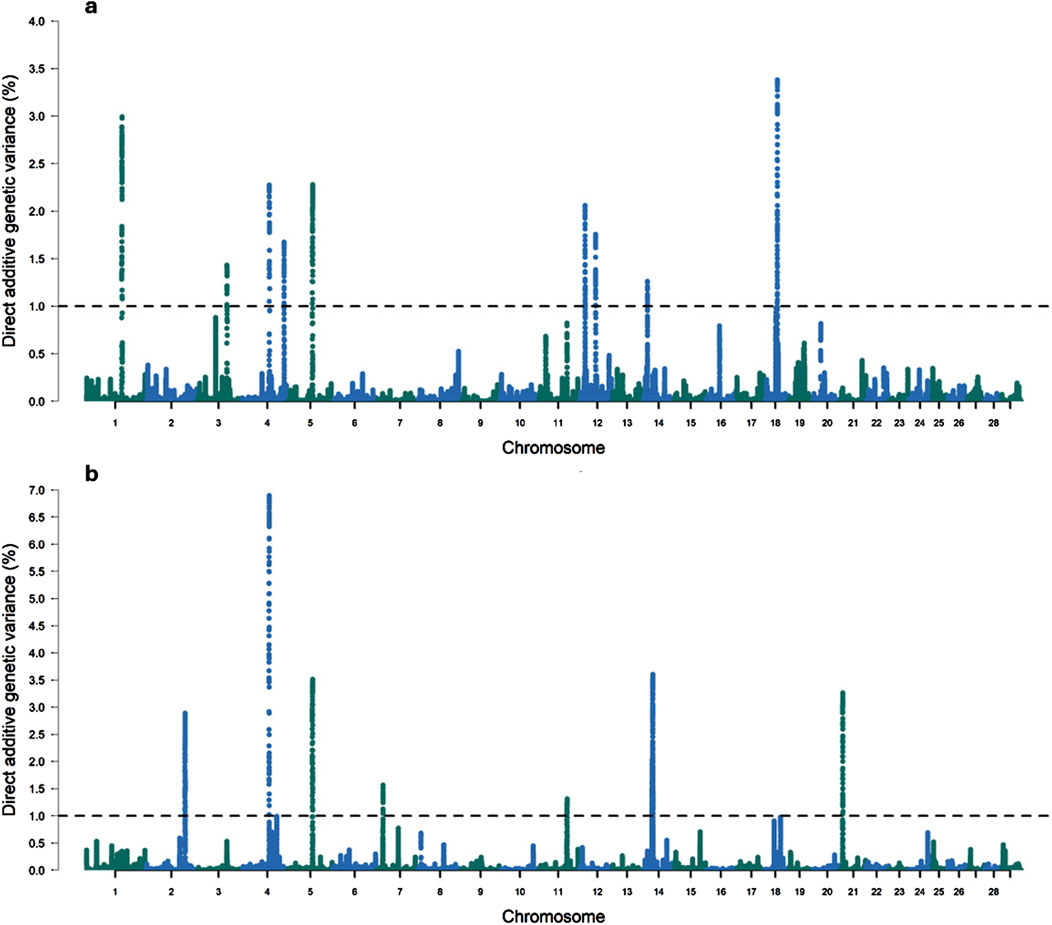
Figure 1. Manhattan plots for the proportion of the total additive genetic variance explained by each genomic window for the intercept (a) and slope (b) coefficients of the reaction norm model for residual feed intake (RFI) in Nellore cattle. The horizontal line represents the relevance threshold of 1% of the total additive genetic variance explained by each genomic window.
Brunes et al. (2020) also identified genomic windows that explained more than 0.5% of the total additive genetic variance for RFI on BTA3 (54.02–54.06 Mb) and BTA5 (70.28–71.12 Mb) in Nellore cattle. Similarly, Olivieri et al. (2016) found regions that explained more than 1.0% of the total additive genetic variance for RFI on BTA1 (100.01–100.02 Mb and 121.63–121.67 Mb), BTA4 (105.90–105.91 Mb and 118.56–118.60 Mb), and BTA18 (11.03–11.06 Mb). Additionally, Bolormaa et al. (2011) identified SNPs significantly associated with RFI on BTA3 (105–106 Mb), BTA4 (41–42Mb and 91–92 Mb), BTA5 (51–52 Mb, 75–76 Mb, 85–86 Mb and 110–111 Mb), BTA12 (55–56 Mb) and BTA18 (3–4 Mb) across seven different cattle breeds (Angus, Murray Grey, Shorthorn, Hereford, Brahman, Santa Gertrudis, and Belmont Red).
Considering the genetic variance explained by the regions that accounted for at least 1% of the direct additive genetic variance, 20.63% of the total direct additive genetic variance was captured. The genomic window on BTA18 (34.60–35.22 Mb) explained the largest proportion of the total additive genetic variance for RFI, accounting for 3.41%, with 36 annotated genes identified within this region (Table 3). The genes located in this genomic window have important functions related to animal performance across different environmental conditions. For instance, the Cadherin 16 (CDH16) gene is a protein primarily expressed in kidney epithelial cells (Lennartz et al., 2023). Cadherins are crucial for cell-cell adhesion, and in the kidney, CDH16 influences nutrient reabsorption (Igarashi, 2003; Cali et al., 2012; Lennartz et al., 2023). This role is particularly relevant for RFI, as efficient nutrient utilization directly affects the energy balance and intake in cattle (Swanson and Miller, 2008). The Ras-related glycolysis inhibitor and calcium channel regulator (RRAD) gene is involved in glucose and fatty acid metabolism, which are essential for energy homeostasis (Wang et al., 2014; Lin et al., 2018; Astrain et al., 2022). Its role in regulating glucose levels and insulin signaling could affect how efficiently cattle utilize energy from feed.
Another important set of genes includes carboxylesterase 2 (CES2), carboxylesterase 3 (CES3), and carboxylesterase 4A (CES4A), which belong to the carboxylesterase family (Hosokawa et al., 2007; Lamego et al., 2013; Liu et al., 2021). These genes are involved in lipid metabolism and detoxification of xenobiotics (Lamego et al., 2013; Liu et al., 2021). The ability of animals to efficiently process and metabolize lipids and other dietary components is particularly important in environments with great variability in feed composition. Differences in carboxylesterase activity could influence how effectively nutrients are converted into energy, thereby affecting feed efficiency (Nawaz et al., 2024). The heat shock factor 4 (HSF4) gene plays a crucial role in cellular responses to heat stress (Lang et al., 2021; Singh et al., 2024). HSF4 regulates the expression of heat shock proteins, which are important for maintaining protein stability and cellular function under conditions of heat stress (Abbas et al., 2020; Hu et al., 2024; Lang et al., 2021; Tian et al., 2021). In tropical environments, where Nellore cattle are commonly raised, efficient heat shock protein response can preserve metabolic efficiency during hotter conditions. Therefore, genetic variations in the HSF4 gene may account for differences in cattle responses to heat stress, potentially affecting their feed efficiency and overall energy expenditure.
In the functional enrichment analysis for the intercept of RFI, 17 processes were significantly associated (p-value <0.05) with this trait (Table 4). These processes provide valuable information into the polygenic regulation of RFI and biological mechanisms influencing this trait. One of the biological annotated was the adult feeding behavior (GO:0008343), with the involvement of growth hormone secretagogue receptor (GHSR), neuropeptide Y (NPY), and agouti-related peptide (AGRP) genes. This process directly relates to the regulation of feeding behavior, which is crucial for determining how efficiently an individual converts feed into body mass (Muhammad et al., 2018; Chen et al., 2019). GHSR regulates energy balance by mediating the effects of ghrelin, a hormone that stimulates appetite (Klok et al., 2007; Muhammad et al., 2018). NPY and AGRP are also key regulators of hunger and energy homeostasis (Cansell et al., 2012; Chen et al., 2019). Variations in these genes could result in differences in feed intake and consequently, RFI. Furthermore, positive regulation of appetite (GO:0032100), with the genes GHSR and NPY (Chen et al., 2019; Zhang et al., 2019), further underscores the relationship between hunger regulation, energy intake, and RFI. In tropical environments, where feed availability and quality may vary, the ability to regulate appetite and energy expenditure becomes critical for maintaining efficient growth and production.
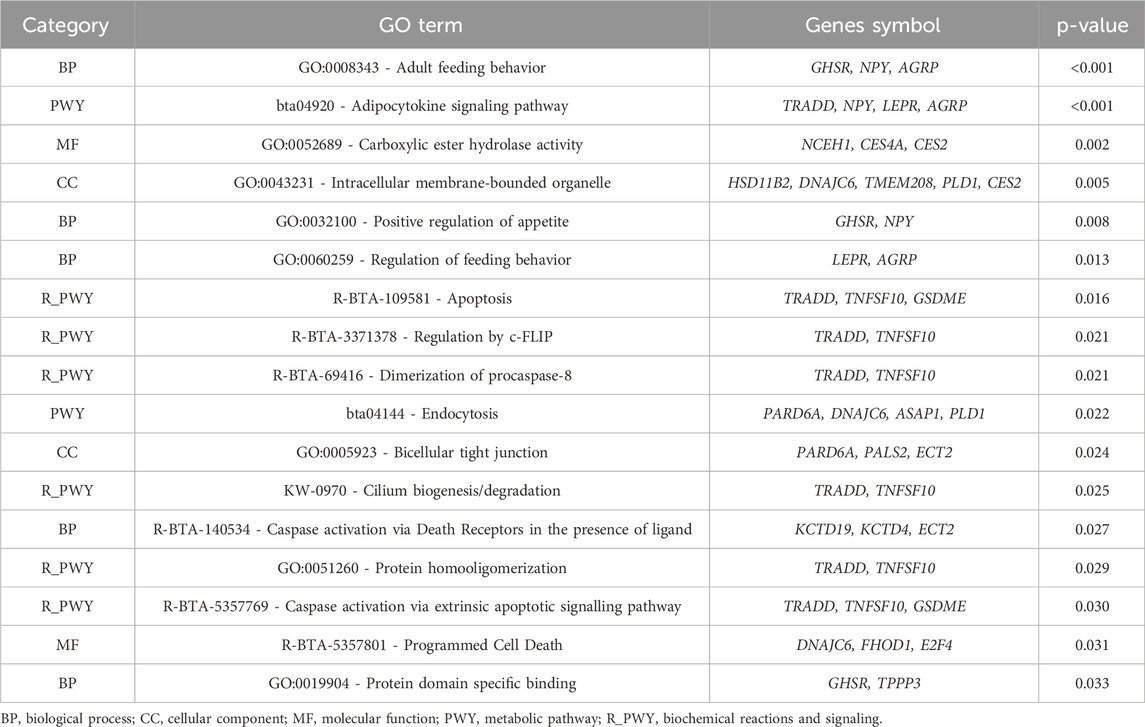
Table 4. Significant Gene Ontology (GO) terms and Kyoto Encyclopedia of Genes and Genomes (KEGG) pathway analyses for residual feed intake (RFI - intercept).
The endocytosis (bta04144) was also annotated in the enrichment analyses, involving par-6 family cell polarity regulator alpha (PARD6A), dnaj Heat Shock Protein Family (HSP40) Member C6 (DNAJC6), ankyrin repeat and PH domain 1 (ASAP1), and Phospholipase D1 (PLD1) genes. This pathway plays a role in cellular nutrient uptake and signaling (Watts and Marsh, 1992; Scita and Fiore, 2010). Endocytosis is essential for internalizing nutrients and cellular receptors (Grant and Donaldson, 2009), which may influence how cattle absorb and process nutrients from their feed, thus impacting feed efficiency. Another important pathway is the adipocytokine signaling pathway (bta04920), involving TNFRSF1A-Associated via Death Domain (TRADD), NPY, leptin receptor (LEPR), and AGRP genes. This pathway plays a major role in energy metabolism and the regulation of fat storage (Jiang et al., 2019; Ahmad et al., 2020). LEPR mediates the effects of leptin, a hormone that signals satiety and regulates energy expenditure and fat storage (Meier and Gressner, 2004; Gan et al., 2012; SuárezMesa et al., 2024). Disruptions or variations in this pathway could alter how efficiently cattle utilize energy from feed, influencing their feed efficiency and overall growth (Prihandini et al., 2024).
At the molecular function level, carboxylesterase hydrolase activity (GO:0052689) was also found as a significant process, with genes such as Neutral cholesterol ester hydrolase 1 (NCEH1), CES4A, and CES2 being annotated. Carboxylesterases are enzymes that catalyze the hydrolysis of ester bonds, involved in lipid metabolism and the detoxification of xenobiotics (Lamego et al., 2013; Liu et al., 2021). Efficient lipid metabolism is essential for optimizing energy use, especially under varying environmental conditions where feed quality may differ. This process directly impacts how efficiently cattle convert feed into usable energy, which influences RFI.
3.2.2 Slope for RFI
Eleven relevant genomic windows were identified for the slope of RFI (Table 5; Figure 1). These genomic regions were distributed across seven chromosomes, with four windows located on BTA14 (22.61–22.99 Mb, 22.99–23.45 Mb, 24.39–24.91 Mb, and 24.91–25.43 Mb), two on BTA2 (104.16–104.55 Mb and 104.65–105.41 Mb), and one genomic window each on BTA4 (70.83–71.85 Mb), BTA5 (66.51–67.03 Mb), BTA7 (16.07–16.44 Mb), BTA11 (74.02–74.67 Mb), and BTA21 (7.35–8.15 Mb). These regions overlap with genomic regions previously associated with RFI in Nellore cattle (Mota et al., 2022). These eleven genomic windows accounted for 29.65% of the total direct additive genetic variance for the slope of RFI. In total, 49 genes were mapped within these regions, of which 47 are protein-coding genes and 2 are snRNA genes.
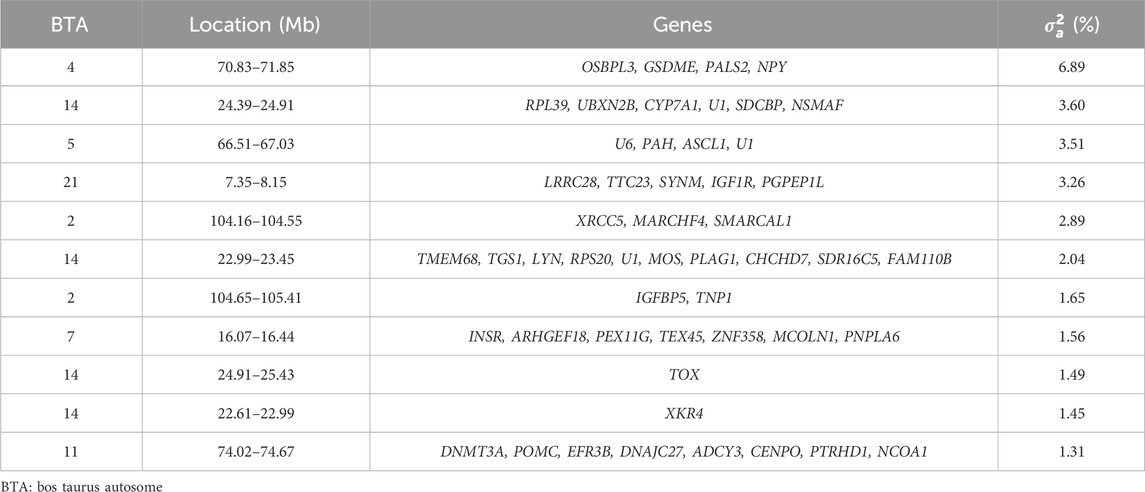
Table 5. List of the top genomic windows that explained more than 1% of the total direct additive genetic variance (
The genomic window located on BTA4 (70.83–71.85 Mb) explained the largest proportion of the total additive genetic variance for the slope of RFI (6.89%), and the Oxysterol Binding Protein-Like 3 (OSBPL3), Gasdermin E (GSDME), Protein Associated with Lin Seven 2 (PALS2), and NPY genes were identified within this window. OSBPL3 is involved in lipid metabolism and intracellular lipid transport, suggesting a potential effect in energy homeostasis and efficiency (Song et al., 2012), which are processes that have an influence in RFI. GSDME is known for its role in programmed cell death (pyroptosis), which could influence energy expenditure through tissue turnover and inflammatory responses, thereby impacting metabolic efficiency (Zhu et al., 2024). NPY is a key regulator of appetite and energy balance, making it a direct candidate for influencing feed intake and energy utilization (Cansell et al., 2012; Chen et al., 2019). The involvement of these genes in some metabolic pathways related to energy balance and tissue homeostasis could explain their contribution to the genetic variance in the slope of RFI. This suggests that variations in the expression or function of these genes might modulate how Nellore cattle adjust their feed intake and energy expenditure in response to environmental or nutritional changes, thereby affecting the slope of the reaction norm for RFI.
The functional enrichment analyses of genes found in the genomic windows that explained the largest proportion of the genetic variance of the slope of RFI in Nellore cattle are displayed in Table 6. Twenty-nine mechanisms were significantly associated with the slope of RFI (p-value <0.05), including the positive regulation of the MAPK cascade (GO:0043410), which plays a crucial role in mediating cellular responses to environmental stimuli (Bardwell, 2006; Meng and Zhang, 2013). The MAPK signaling pathway influences growth, cell proliferation, and stress response, essential for maintaining metabolic balance in varying environmental conditions (Bardwell, 2006; Meng and Zhang, 2013; Yue and López, 2020). The v-mos Moloney murine sarcoma viral oncogene homolog (MOS), LYN proto-oncogene, Src family tyrosine kinase (LYN), Insulin receptor (INSR), Gasdermin E (GSDME), and Insulin-like growth factor 1 receptor (IGF1R) genes were annotated and involved in the positive regulation of the MAPK cascade (Gonzalez-Garcia et al., 2014; Werner, 2023). MOS is a key regulator of the MAPK pathway, primarily known for its role in cellular proliferation and differentiation (Gonzalez-Garcia et al., 2014). Changes in the regulation of the MAPK pathway by MOS could alter energy balance and metabolic rate (Okazaki and Sagata, 1995; Adhikari and Cullen, 2014), which are critical for feed efficiency. LYN plays a significant role in the activation of the MAPK pathway (Avila et al., 2012), and variations in the expression of LYN may influence how cattle respond to feeding under different environmental conditions, possibly by affecting energy expenditure and metabolic adjustments. The LYN gene was also found in a GWAS study for growth traits in Nellore cattle (Terakado et al., 2018). The INSR gene is associated with the insulin signaling pathway, closely interacting with the MAPK cascade (Zhang et al., 2011; Werner, 2023). Insulin is a key regulator of glucose metabolism and energy homeostasis (Payankaulam et al., 2019). Genetic variation in INSR may influence how cattle manage nutrient absorption, storage, and overall energy balance. Given the importance of glucose metabolism on efficient feed use, INSR variants could impact feed efficiency by modulating energy use under different environmental conditions, thus influencing RFI. Alongside INSR, the IGF1R gene also plays a pivotal role in growth, development, and nutrient partitioning, all of which are integral to feed efficiency (Yang et al., 2019; Mota et al., 2022). The interaction of IGF1R with the MAPK pathway underlines its importance in mediating growth and metabolic responses, particularly in response to environmental changes (Yang et al., 2019). Mutations in IGF1R may alter the cattle’s ability to utilize feed for efficient growth, affecting how well animals adapt their nutrient use in response to varying environmental conditions.
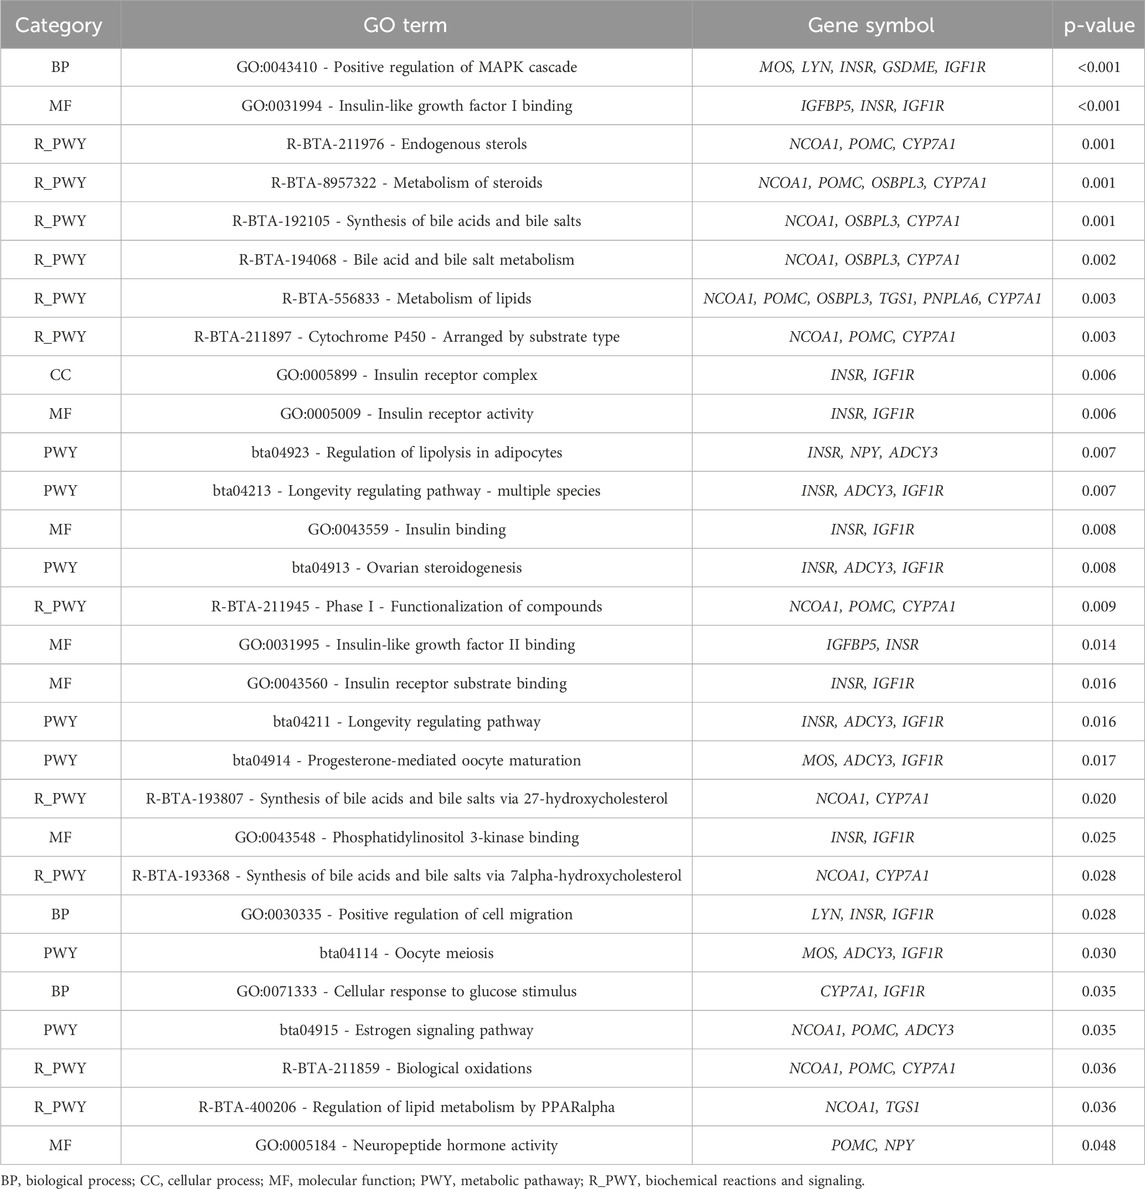
Table 6. Significant Gene Ontology (GO) terms and Kyoto Encyclopedia of Genes and Genomes (KEGG) pathway analyses for residual feed intake (RFI - slope).
Other biological processes associated with IGF1R and INSR, including insulin-like growth factor I binding (GO:0031994), insulin receptor activity (GO:0005158), and insulin receptor complex (GO:0005899) were found in the enrichment analysis for the slope of RFI. These processes are crucial for regulating energy balance and nutrient partitioning. Insulin-like growth factor I (IGF-I) is critical for growth and metabolic regulation, with its binding modulating activity in pathways central to nutrient efficiency (Pereira et al., 2016; Rieger and O’Connor, 2021; Díaz Del Moral et al., 2022). More efficient insulin receptor activity could allow cattle to optimize energy use, particularly in response to environmental challenges, ensuring consistent feed efficiency. This pathway may be important in determining how well animals adapt their nutrient utilization strategies in response to GxE interactions. The slope of RFI, which reflects the animal’s efficiency in utilizing feed under different conditions, could thus be significantly influenced by the genetic variation within the insulin and IGF signaling pathways.
Enriching pathways related to bile acid and salt metabolism (R-BTA-194068) further emphasizes the importance of lipid homeostasis in determining feed efficiency. Bile acids are essential for fat digestion and absorption, and the cytochrome P450 family 7 subfamily A member 1 (CYP7A1) and nuclear receptor coactivator 1 (NCOA1) genes are key regulators of bile acid metabolism (Jia et al., 2024). Variations in the efficiency of bile acid metabolism could influence the absorption of nutrients (Jia et al., 2021), particularly lipids, which are critical for energy balance. Animals with optimized bile acid metabolism may be better able to maintain feed efficiency under fluctuating environmental conditions, contributing to differences in the RFI slope.
The neuropeptide hormone activity (GO:0005184) was also one of the processes significatively associated with RFI. The ability of animals to regulate feed intake through neuroendocrine mechanisms may be a key determinant of how efficiently they convert feed into body mass, particularly when facing environmental variability. The pro-opiomelanocortin (POMC) and adrenocorticotropic hormone (ACTH) genes play fundamental roles in appetite regulation and energy balance (Millington, 2007; Hasenmajer et al., 2021). This regulation could explain variations in feed efficiency as environmental conditions change, influencing the slope of RFI.
The regulation of lipid metabolism by PPARalpha (R-BTA-400206) pathway, which includes Nuclear Receptor Coactivator 1 (NCOA1) and Trimethylguanosine Synthase (TGS1), highlights the role of lipid metabolism in RFI expression. PPARalpha (peroxisome proliferator-activated receptor alpha) is a critical regulator of lipid metabolism, particularly in response to fasting or limited nutrient availability (Lefebvre et al., 2006; Bougarne et al., 2018; Fuior et al., 2023). This pathway may influence how animals utilize lipids for energy under stressful or nutrient-limited conditions, which could affect the slope of RFI by enabling animals to maintain energy balance and feed efficiency across different environments.
3.2.3 Intercept for DMI
Twelve genomic windows explaining more than 1% of the total direct additive genetic variance of the intercept for DMI were identified as shown in Table 7 and Figure 2. These genomic regions are located on seven chromosomes: BTA1 (95.09–95.95), BTA4 (70.88–71.88 Mb), BTA6 (36.02–36.57 Mb and 37.15–37.95 Mb), BTA8 (67.24–67.72 Mb), BTA14 (22.90–23.31 Mb and 23.33–23.89 Mb), BTA18 (34.83–35.42 Mb), BTA20 (9.15–9.83 Mb), BTA21 (68.47–68.77 Mb) and BTA29 (46.18–47.10 Mb and 48.54–50.15 Mb). Some regions in these chromosomes were also identified as associated with DMI in other GWAS studies with cattle (Serão et al., 2013; de Oliveira et al., 2014; Brunes et al., 2020; Mota et al., 2022). A total of 112 genes were identified within these genomic windows, including 107 protein-coding genes, three miRNAs, and two snRNAs. These findings highlight the polygenic nature of DMI, a trait influenced by numerous genomic regions that collectively contribute to its phenotypic expression, as RFI.
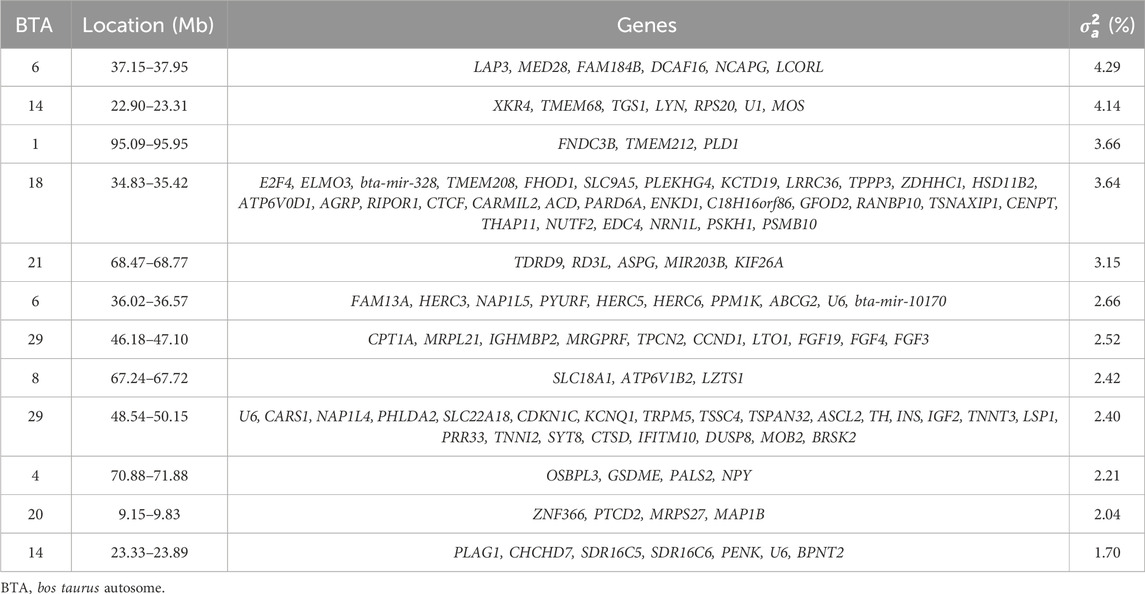
Table 7. List of the top genomic windows that explained more than 1% of the total direct additive genetic variance (
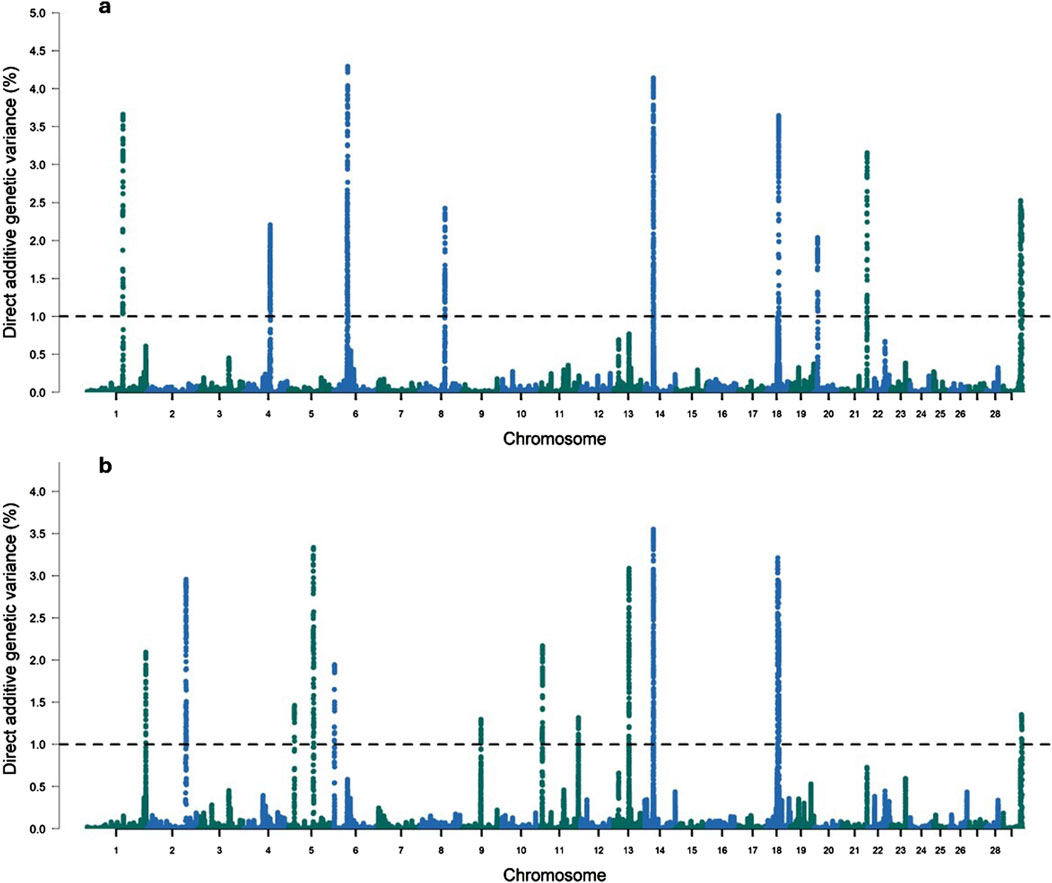
Figure 2. Manhattan plots for the proportion of the total additive genetic variance explained by each genomic window for the intercept (a) and slope (b) coefficients of the reaction norm model for dry matter intake (DMI) in Nellore cattle. The horizontal line represents the relevance threshold of 1% of the total additive genetic variance explained by each genomic window.
The relevant genomic regions for DMI explained 34.83% of the overall direct additive genetic variance. The genomic window located on BTA6 (37.15–37.95 Mb) explained the largest portion of additive genetic variance, accounting for 4.29%, with six annotated genes identified within this region (Table 7). The Leucine Aminopeptidase 3 (LAP3) is involved in protein degradation, processing and regulating peptide breakdown (Yao et al., 2021; Wang et al., 2024). It has been associated with growth traits in Holstein cattle and Yak (Bos grunniens) (Yao et al., 2019; Wang et al., 2024). Given its role in protein metabolism, LAP3 may influence the efficiency of cattle utilizing nutrients, which is directly related to DMI. Therefore, efficient protein metabolism could enable animals to optimize their intake for growth and maintenance under varying environmental conditions. Another important gene widely associated with growth traits and feed intake in cattle is Non-SMC Condensin I Complex Subunit G (NCAPG) (Hoshiba et al., 2013; Lindholm-Perry et al., 2013). Studies have shown that polymorphisms in NCAPG are linked to ADG and DMI in cattle (Angus, Hereford, Simmental, Limousin, Cha rolais, Gelbvieh and Red Angus) (Lindholm-Perry et al., 2011; Lindholm-Perry et al., 2013; Seabury et al., 2017). This gene is involved in cell cycle regulation and it has been associated with growth rate and body size in several cattle breeds (Setoguchi et al., 2011; Zhang et al., 2016). NCAPG influences feed intake by modulating growth demands, where larger or faster-growing animals require more feed to meet their energy needs. This makes it a strong candidate gene for influencing DMI in response to average environmental conditions.
The Ligand Dependent Nuclear Receptor Corepressor Like (LCORL) is a transcription factor associated with skeletal growth and body size in humans, horses, and cattle (Utsunomiya et al., 2013; Al-Mamun et al., 2015). LCORL has been linked to growth traits and feed efficiency in cattle, often acting in concert with NCAPG (La et al., 2019). Polymorphisms in LCORL have been correlated with feed intake and gain, particularly in beef cattle (Angus, Hereford, Simmental, Limousin, Cha rolais, Gelbvieh and Red Angus) (Lindholm-Perry et al., 2013). Its role in skeletal growth may be crucial for determining body size and the corresponding feed requirements, thereby influencing DMI. The DDB1 and CUL4 Associated Factor 16 (DCAF16) is part of the ubiquitin-proteasome pathway, essential for protein degradation and cellular homeostasis (Zhang et al., 2021). By influencing protein degradation, it indirectly impacts growth rate and metabolic efficiency (Mistry et al., 2020; Zhang et al., 2021), potentially altering the energy requirements and feed intake of cattle. Since protein metabolism is energy-intensive, variations in this gene may affect how animals convert feed into growth.
In the functional enrichment analysis, 53 processes were found to be significantly associated (p-value <0.05) with the intercept of DMI (Table 8). These processes offer important insights into the polygenic control of DMI and the biological pathways affecting its regulation. In comparison to the significant processes identified for RFI, DMI had a greater number of associated processes. This can be attributed to the larger number of relevant genomic windows identified for DMI, which also reflected in a higher number of genes found and involved in regulating this trait.
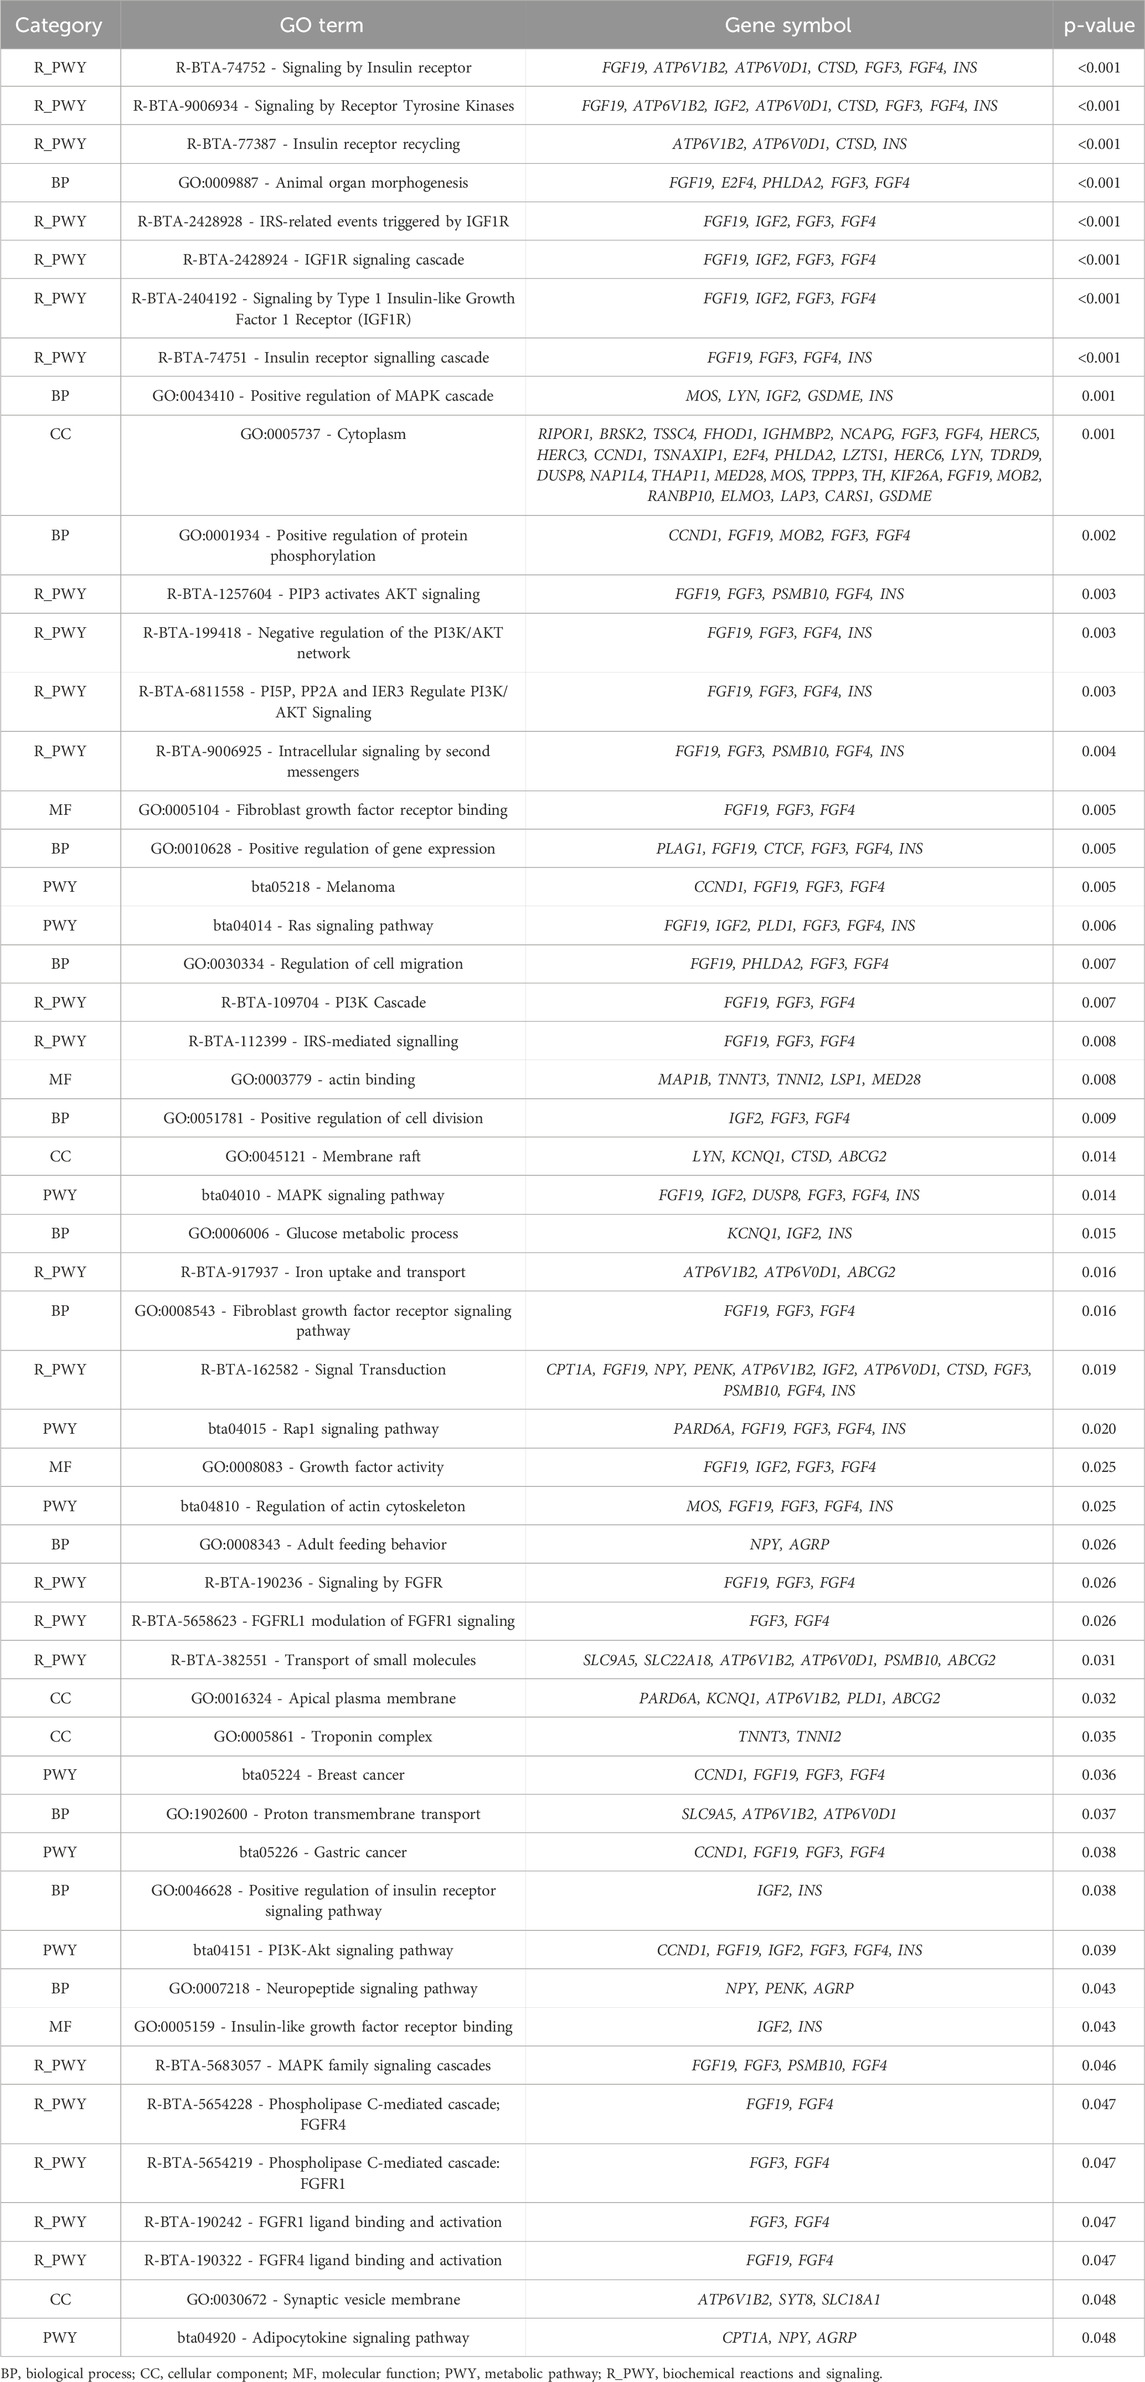
Table 8. Significant Gene Ontology (GO) terms and Kyoto Encyclopedia of Genes and Genomes (KEGG) pathway analyses for dry matter intake (DMI - intercept).
One of the biological annotated was the Insulin Signaling and Pathways IGF1 (R_BTA-74752, R_BTA-77387, R_BTA-2428924), with the involvement of Fibroblast Growth Factor 19 (FGF19), ATPase H+ Transporting V0 Subunit D1 (ATP6V0D1), ATPase H+ Transporting V1 Subunit B2 (ATP6V1B2), Insulin-like Growth Factor 2 (IGF2), Fibroblast Growth Factor 3 (FGF3) and Insulin (INS). These pathways are linked to insulin receptor signaling and IGF1 receptor activation, both of which are critical for energy metabolism and growth (Hakuno and Takahashi, 2018; Al-Massadi et al., 2022; Werner, 2023). The insulin pathway regulates glucose uptake, energy storage, and lipid metabolism (Hakuno and Takahashi, 2018), directly influencing feed efficiency and body weight gain. In cattle, variations in these processes can lead to differences in nutrient utilization, thereby affecting DMI and, consequently, feed efficiency.
The Cascata MAPK (GO:0043410, GO:0030334) was also annotated in the enrichment analyses, involving Moloney Murine Sarcoma Viral Oncogene (MOS), LYN Proto-Oncogene, Src Family Tyrosine Kinase (LYN), Insulin-like Growth Factor 2 (IGF2) and Gasdermin E (GSDME) genes. Processes such as growth, differentiation, and response to environmental stress are regulated by this pathway (Avila et al., 2012; Adhikari and Cullen, 2014; Gonzalez-Garcia et al., 2014; Werner, 2023). The influence of these processes on DMI may be related to how animals respond to their environment, impacting their nutritional requirements and feed intake. Genes such as LYN and IGF2, which are associated with growth and development (Avila et al., 2012; Pereira et al., 2016; Terakado et al., 2018; Rieger and O’Connor, 2021), further highlight the importance of this pathway in managing energy demands. Another crucial pathway is the PI3K-AKT signaling pathway (R_BTA-1257604, R_BTA-6811558), involving the FGF19, FGF3, and Fibroblast Growth Factor 4 (FGF4), as well as INS genes. The PI3K-AKT pathway is central to cell survival, growth, and metabolism, particularly in insulin response (Hardy et al., 2011; Toschi and Baratta, 2021; Yang et al., 2022). In cattle, this pathway is closely linked to feed efficiency and nutrient metabolism, influencing how animals efficiently convert feed into body mass (Cantalapiedra-Hijar et al., 2018; Toschi and Baratta, 2021; Yang et al., 2022). Variations in genes related to this pathway could alter how energy is allocated for growth, maintenance, and reproduction, thereby affecting DMI.
The Ras signaling pathway (bta04114, bta04015) was also identified, with genes such as FGF19, IGF2, FGF3, and FGF4 involved in this process. This pathway regulates cell proliferation, differentiation, and survival (Huang et al., 2014; Nies et al., 2016). It can influence growth and metabolism in response to environmental stressors, directly impacting DMI. For instance, cattle exposed to adverse conditions may experience altered metabolic demands, and genes such as FGF19 and IGF2 can modulate these responses, leading to changes in feed intake (Mota et al., 2022). The regulation of the actin cytoskeleton (GO:0005824, GO:0008543) was also annotated in the enrichment analyses, involving genes such as MOS, FGF3, FGF4, IGF2. This process includes alterations in cellular structure, which are essential for various cellular functions such as growth and mobility (Illescas et al., 2021; Gao and Nakamura, 2022; Dehghanian Reyhan et al., 2023). It may affect muscle development and maintenance, key factors in determining the energy demands of cattle (Dehghanian Reyhan et al., 2023; Arikawa et al., 2024; Sacarrao-Birrento et al., 2024), and consequently, could influence DMI. In the context of DMI, this process may influence how animals metabolize nutrients and convert feed into body mass efficiently, affecting feed intake requirements. The genes and pathways identified for the DMI intercept are central to metabolic processes that regulate growth, energy balance, and nutrient utilization. These biological processes are particularly important for animals raised under variable environmental conditions, such as Nellore cattle, which may impact feed intake and efficiency.
3.2.4 Slope for DMI
For the DMI slope across EG levels, 17 relevant genomic windows were identified (Table 9; Figure 2). These genomic windows are located on ten chromosomes: BTA1 (155.72–156.03 Mb), BTA2 (104.16–104.55 Mb and 104.58–105.27 Mb), BTA5 (15.53–15.88 Mb and 65.97–66.93 Mb), BTA6 (2.32–2.80 Mb), BTA9 (49.80–50.31 Mb), BTA11 (4.85–5.21 Mb, 5.55–5.92 Mb and 100.94–101.52 Mb), BTA13 (41.40–41.97 Mb), BTA14 (22.90–23.31 Mb and 23.33–23.89 Mb), BTA18 (32.19–32.54 Mb and 35.62–36.07 Mb) and BTA29 (48.74–50.54 Mb). In other GWAS studies with Nellore cattle, some of these regions were also associated with DMI (Brunes et al., 2020; Mota et al., 2022). A total of 111 genes were identified within these genomic windows, including 109 protein-coding genes and two snRNAs.
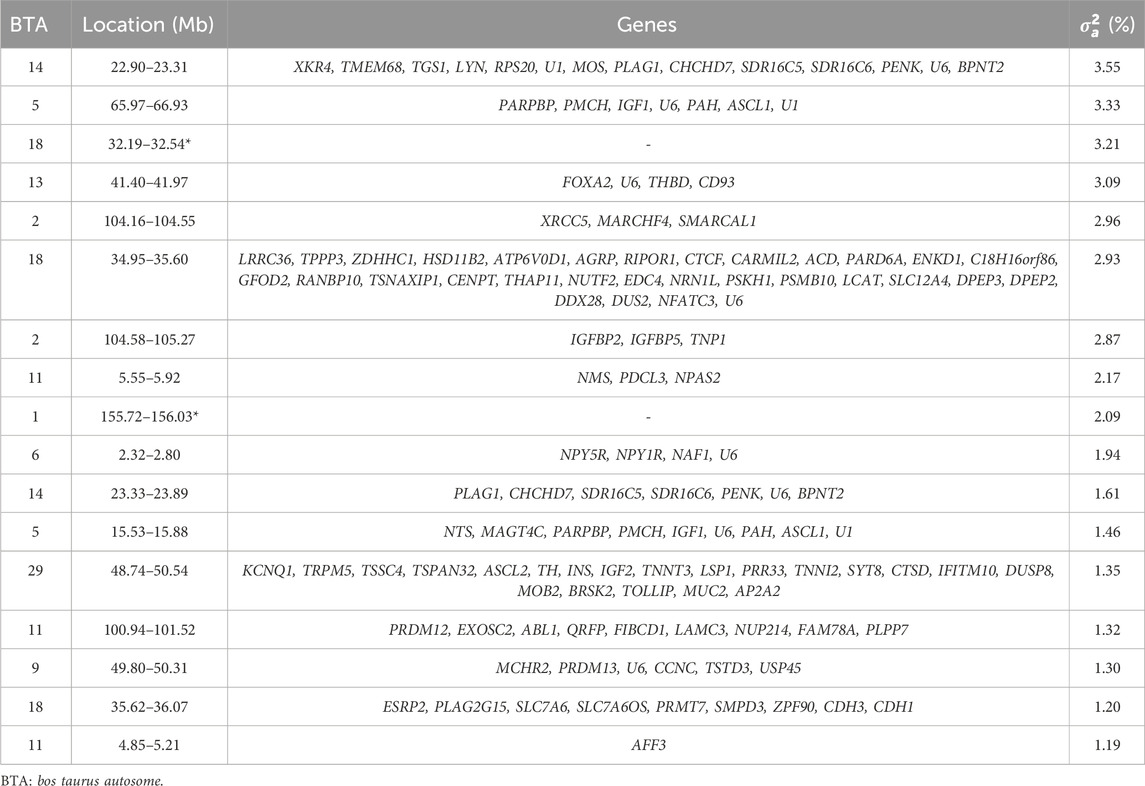
Table 9. List of the top genomic windows that explained more than 1% of the total direct additive genetic variance (
A total of 37.57% of the overall direct additive genetic variance was captured by the relevant genomic regions identified. The genomic window located on BTA14 (22.90–23.31 Mb) explained the largest portion of additive genetic variance, accounting for 3.55%, with 14 annotated genes identified within this window (Table 9). The XK Related 4 (XKR4) gene encodes a protein involved in apoptosis and membrane remodeling (Chakraborty et al., 2024; Song et al., 2024). XKR4 is expressed in a wide range of tissues, including the nervous system and muscles (Xu P. et al., 2020; Yu et al., 2024). Given that DMI influences muscle growth and energy balance, the role of XKR4 in muscle-related processes (Edea et al., 2020) may render it significant for energy metabolism, and consequently, for feed intake and utilization under varying environmental conditions. Another relevant gene, Transmembrane Protein 68 (TMEM68), is implicated in lipid metabolism (Edea et al., 2020; Wang et al., 2023; Zeng et al., 2024). Genes involved in lipid metabolism are generally critical for energy storage and utilization (Srivastava et al., 2020). Lipid metabolism plays a pivotal role in feed efficiency by regulating how energy is stored, mobilized, and used by the animal. In more feed-efficient cattle, enhanced lipid oxidation pathways and more effective lipid transport have been observed, leading to greater energy availability for growth and maintenance (Artegoitia et al., 2019; Yang et al., 2023). Additionally, these animals tend to exhibit reduced hepatic lipid synthesis and accumulation, further supporting the association between lipid metabolism and improved nutrient utilization (Taiwo et al., 2022). Altogether, these findings highlight the importance of lipid metabolic pathways in promoting feed efficiency in beef cattle. As lipid metabolism is closely linked to feed efficiency, TMEM68 may influence the conversion rate of feed into energy, particularly under diverse environmental conditions, thereby influencing total feed intake. Another gene identified was Pleomorphic Adenoma Gene 1 (PLAG1). Its role is involved in regulating growth and development, particularly influencing body size and stature (Hou et al., 2019; Zhang et al., 2022; Pan et al., 2022). The effect of PLAG1 on growth potentially makes it a critical gene for feed efficiency. Cattle with variants of this gene that promote more efficient growth may exhibit different patterns of DMI, particularly under variable environmental conditions.
The Coiled-Coil-Helix-Coiled-Coil-Helix Domain Containing 7 (CHCHD7) gene is involved in mitochondrial function, specifically in maintaining mitochondrial integrity (Li et al., 2020; Yan et al., 2024). This gene is also associated with growth and stature in several species, including cattle (Li et al., 2020; Xu H. et al., 2020; Pan et al., 2022; Kolpakov et al., 2024). Mitochondria are central to energy production, and variations in genes affecting mitochondrial efficiency can influence energy metabolism, thereby impacting how much feed is required to maintain or support growth under different environmental conditions. Another gene, Proenkephalin (PENK), encodes a precursor for enkephalins, which are neuropeptides involved in pain regulation and stress responses (Adhikari et al., 2022; Pierzchała-Koziec and Scanes, 2023). Stress responses can influence appetite and metabolism in cattle (Fernandez-Novo et al., 2020; Sammad et al., 2020; Meneses et al., 2021). Variations in PENK may affect how cattle respond to environmental stressors, thereby influencing their feeding behavior and metabolic efficiency.
A total of 42 processes were found to be significantly linked (p-value <0.05) with the slope of DMI (Table 10). One of the key processes identified is signaling by the Insulin Receptor (R-BTA-74752), which is critical for glucose metabolism and overall energy homeostasis. The insulin receptor pathway controls how cells take up glucose from the bloodstream, a process essential for energy production (Pereira et al., 2016; Rieger and O’Connor, 2021; Díaz Del Moral et al., 2022). Genes like FGF19, ATP6V1B2, and INS are involved in this pathway, with INS directly regulating nutrient uptake and metabolism (Payankaulam et al., 2019). In the context of DMI slope, these genes may influence how cattle adjust their feed intake in response to energy needs, impacting their efficiency in converting feed into energy under variable environmental conditions.
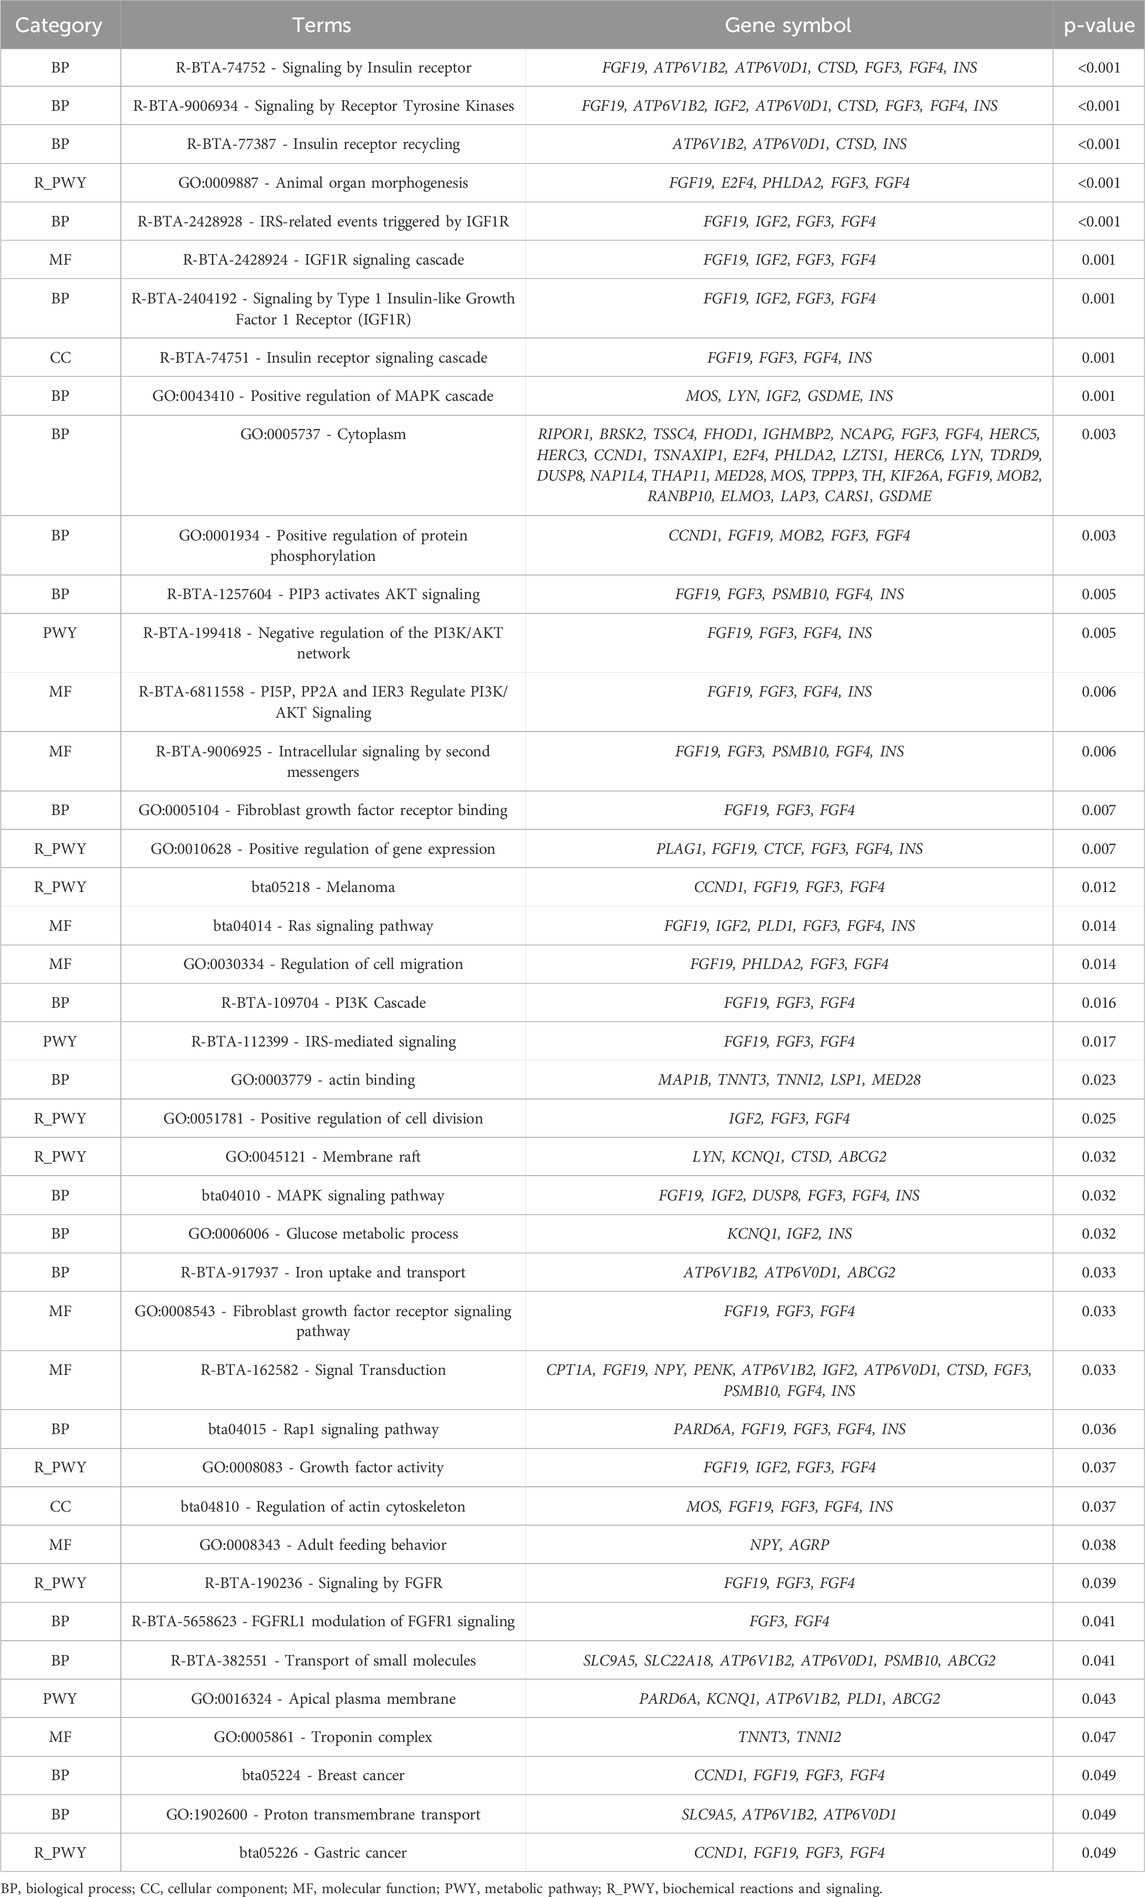
Table 10. Significant Gene Ontology (GO) terms and Kyoto Encyclopedia of Genes and Genomes (KEGG) pathway analyses for dry matter intake (DMI - slope).
Similarly, the Receptor Tyrosine Kinases (RTK) signaling pathway (R-BTA-9006943), which includes genes such as FGF19, FGF3, and INS, is involved in cellular growth, proliferation, and metabolism (Schlessinger, 2000). RTKs play a pivotal role in transmitting extracellular signals to the cell’s interior, regulating growth and development processes (Schlessinger, 2000). Variations in these genes could affect how cattle respond to growth-related signals, potentially altering their feed intake based on growth demands in different environments, which could explain variation in the DMI slope.
The Insulin-like Growth Factor 1 Receptor (IGF1R) signaling pathway (R-BTA-2428924) also emerged as significant. This pathway is crucial for growth and development, influencing cell growth, differentiation, and survival (Pereira et al., 2016; Rieger and O’Connor, 2021; Díaz Del Moral et al., 2022). Genes like FGFR3, FGFR4, and INS are associated with this process. Given that IGF1R signaling regulates anabolic processes and energy usage, it is plausible that variations in this pathway could influence how efficiently cattle manage their energy resources when environmental conditions fluctuate, thus impacting the slope of DMI.
The PI3K/AKT signaling pathway (R-BTA-1257044) is another important metabolic pathway linked to the regulation of growth and survival, particularly under conditions of nutrient stress (Edinger, 2007). This pathway includes genes like PI3K, AKT1, and PSMB10, which are involved in cell survival, proliferation, and glucose metabolism (Edinger and Thompson, 2004; Edinger, 2007; Wu et al., 2016). As this pathway integrates signals related to nutrient availability, it likely plays a role in determining how cattle adjust their intake to optimize growth and energy storage under variable conditions, affecting the slope of DMI.
Additionally, pathways related to Fibroblast Growth Factor Receptor (FGFR) signaling (GO-0005104) and Ras signaling (GO-0043404) were highlighted. These pathways involve genes like FGFR1, FGFR3, and FGF19, which are critical for cell proliferation, differentiation, and metabolism (Itoh and Ornitz, 2004; Itoh, 2007). The Ras pathway is central in transmitting signals that regulate cellular growth and energy use (Huang et al., 2014; Nies et al., 2016). Variations in these genes might influence how cattle balance their growth and metabolic processes in response to environmental changes, impacting their feed efficiency and DMI slope.
Moreover, cytoplasmic processes (GO:0005737) and positive regulation of protein phosphorylation (GO:0001934) are involved in cellular signaling and metabolic regulation (Hüttemann et al., 2007; Hermann et al., 2008; Humphrey et al., 2015; Zhu and Thompson, 2019). Genes such as INS, FGFR4, and PSMB10 play crucial roles in modulating these processes (Hüttemann et al., 2007; Zhu and Thompson, 2019). These pathways could influence the efficiency of nutrient metabolism and energy utilization, thereby affecting how animals adapt their feed intake to varying environmental conditions, which in turn affects the DMI slope.
In summary, the processes identified in the enrichment analysis, particularly those involved in insulin signaling, growth factor signaling, and cellular metabolism, suggest a strong connection between the regulation of energy balance and the slope of DMI in Nellore cattle. The genes involved in these pathways, such as FGF19, FGFR3, and INS, are likely to affect the cattle’s ability to adjust their feed intake in response to changing environmental conditions, influencing their overall efficiency and adaptability. This genomic information can provide a foundation for improving feed efficiency and productivity in livestock through targeted breeding strategies.
3.3 Functional networks for RFI
The functional networks of the candidate genes identified for RFI in Nellore cattle showed significant changes in connectivity and the central role of certain genes between the intercept and slope. These results illustrate the GxE interaction, highlighting how different gene networks are mobilized depending on the environmental influence on the phenotype. In the network related to the intercept (Figure 3), genes such as LEPR, LEPROT, NPY, GHSR, and AGRP exhibited high connectivity, forming a functional core with several interactions. These genes are closely associated with appetite regulation and energy metabolism, such as GHSR and LEPR, which are known for their roles in regulating feeding behavior and energy efficiency, suggesting that central metabolic pathways are key determinants in the baseline genetic variation of RFI. Additionally, several smaller sub-networks with fewer connections were identified, indicating that these genes may be linked to more specific processes or sub-functions within the regulation of RFI.
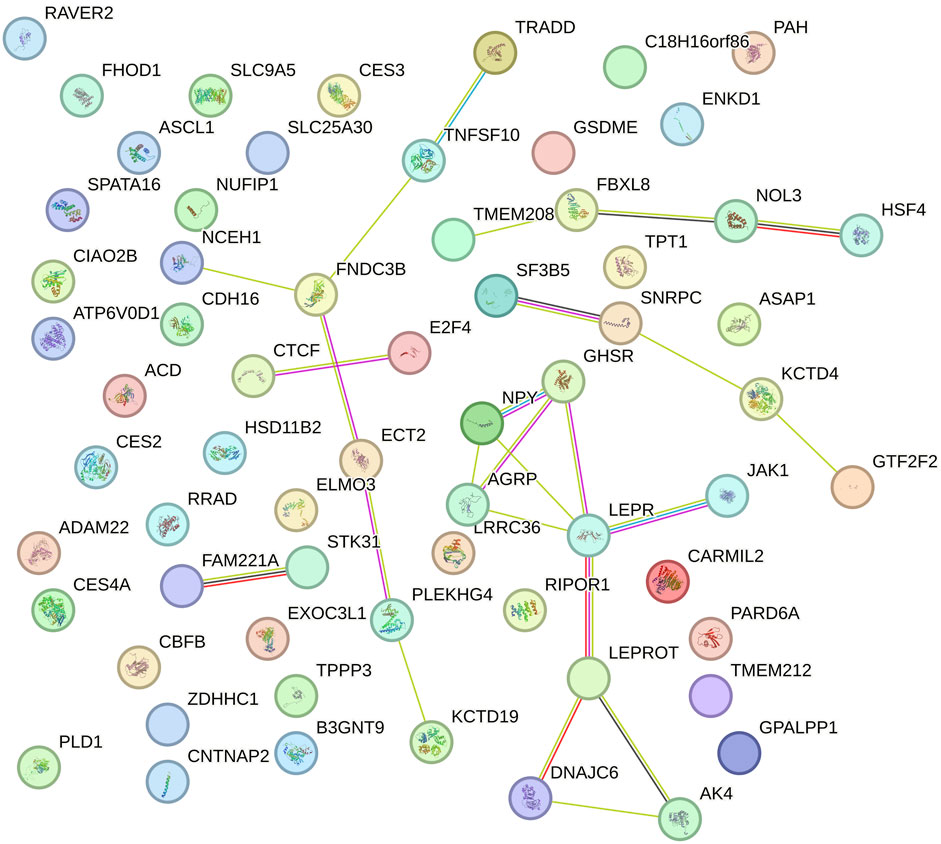
Figure 3. Functional network of genes identified in the genomic windows that explained more than 1% of the total direct additive genetic variance of the intercept for residual feed intake (RFI) in Nellore cattle. Each node represents a gene, while the lines connecting the nodes indicate known functional interactions or associations between these genes. The different colors of the nodes and lines indicate distinct types of interactions or classifications of biological functions, based on the network analysis.
In contrast, in the network related to the slope of RFI (Figure 4), there was a shift in the most connected genes. Genes such as TMEM68, XKR4, CHCHD7, RPS20, PLAG1, and FAM110B emerged as central, exhibiting multiple interactions with other genes. This indicates that distinct genetic mechanisms may be involved in the variation of RFI over time, with feed intake regulation being mediated by different genetic pathways. The interaction between genes related to energy metabolism and growth is evidenced by the connection of INSR with IGF1R and IGFBP5, which are fundamental to insulin signaling. Additionally, NPY and POMC indicate the influence of appetite control pathways on feed efficiency. The network also includes genes such as CYP7A1 and SDR16C5, involved in lipid metabolism, that interact with CHCHD7 and UBXN2B, suggesting a role in lipid metabolism in the variation of the slope of RFI. Genes associated with mitochondrial function, such as TMEM68 and CHCHD7, emphasize the importance of cellular health in feed efficiency. Finally, small subnetworks formed by genes like PTRH1, DNMT3A, and MOS indicate potential more specific functions, such as epigenetic regulation and response to stressors. This complex network highlights the interconnection of multiple biological processes that influence feed efficiency under different environmental conditions.
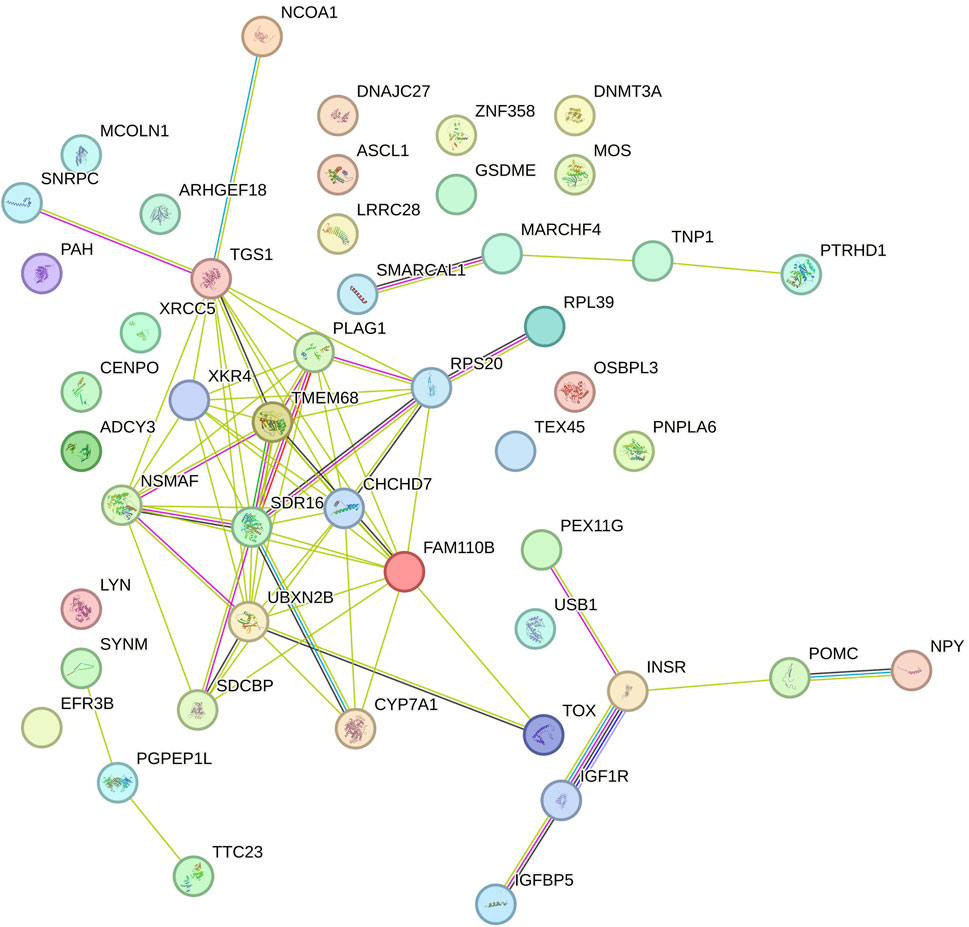
Figure 4. Functional network of genes identified in the genomic windows that explained more than 1% of the total direct additive genetic variance of the slope for residual feed intake (RFI) in Nellore cattle. Each node represents a gene, while the lines connecting the nodes indicate known functional interactions or associations between these genes. The different colors of the nodes and lines indicate distinct types of interactions or classifications of biological functions, based on the network analysis.
3.4 Functional gene networks for DMI
Figures 5 (intercept), Figure 6 (slope) present the functional gene networks identified based on the candidate genes identified for DMI in Nellore cattle. In Figure 5, the functional network consists of a dense web of interactions among genes, suggesting strong basal genetic regulation for DMI under controlled environments. Genes such as PLAG1, IGF2, CHCHD7, CCND1, and NCAPG show centrality, with several direct and indirect connections, indicating their crucial role in regulating this trait. The interactions among these genes stand out as responsible for the genetic architecture of the phenotype in an average environment, with particular emphasis on NCAPG, a gene known for its association with growth traits and feed efficiency in cattle (Takasuga, 2015).
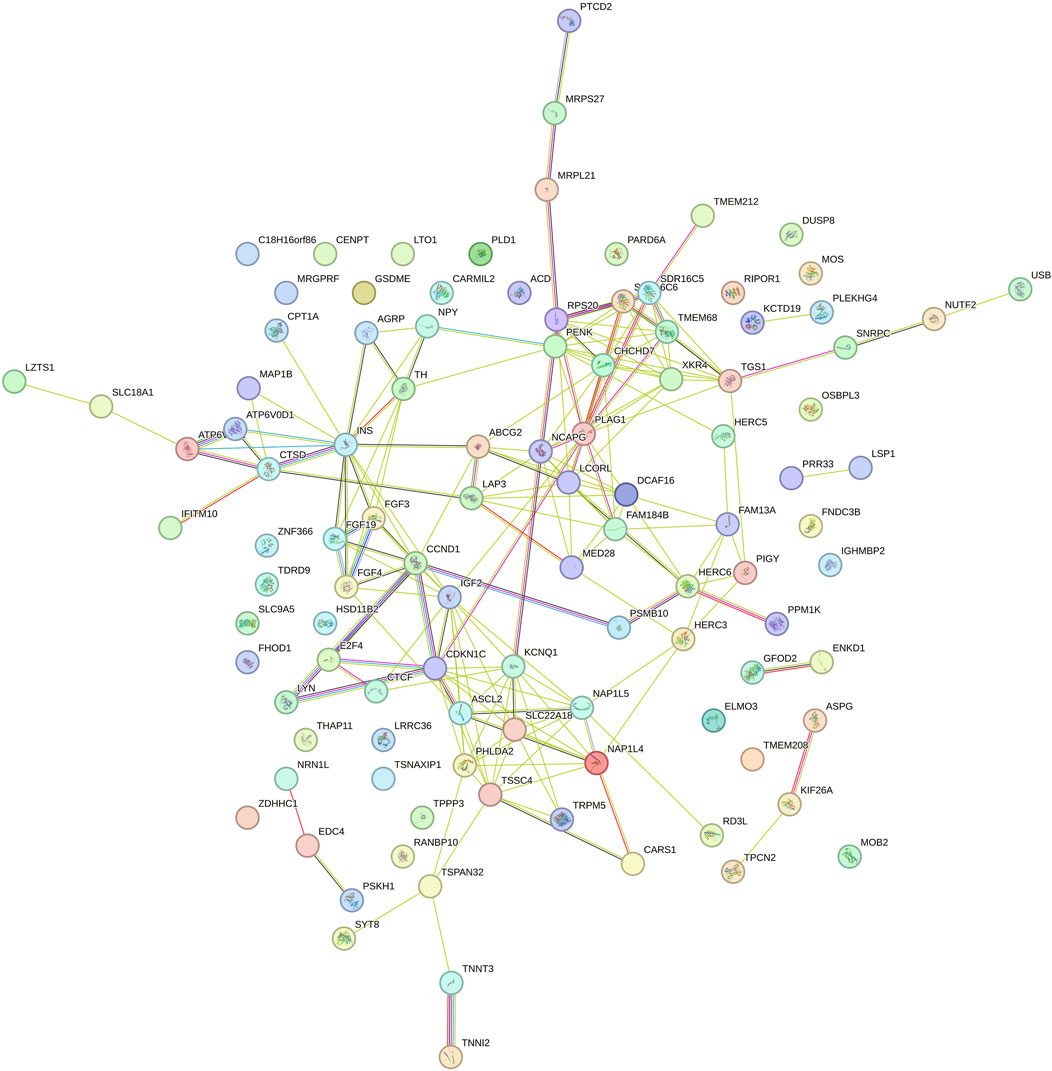
Figure 5. Functional network of genes identified in the genomic windows that explained more than 1% of the total direct additive genetic variance of the intercept for dry matter intake (DMI) in Nellore cattle. Each node represents a gene, while the lines connecting the nodes indicate known functional interactions or associations between these genes. The different colors of the nodes and lines indicate distinct types of interactions or classifications of biological functions, based on the network analysis.
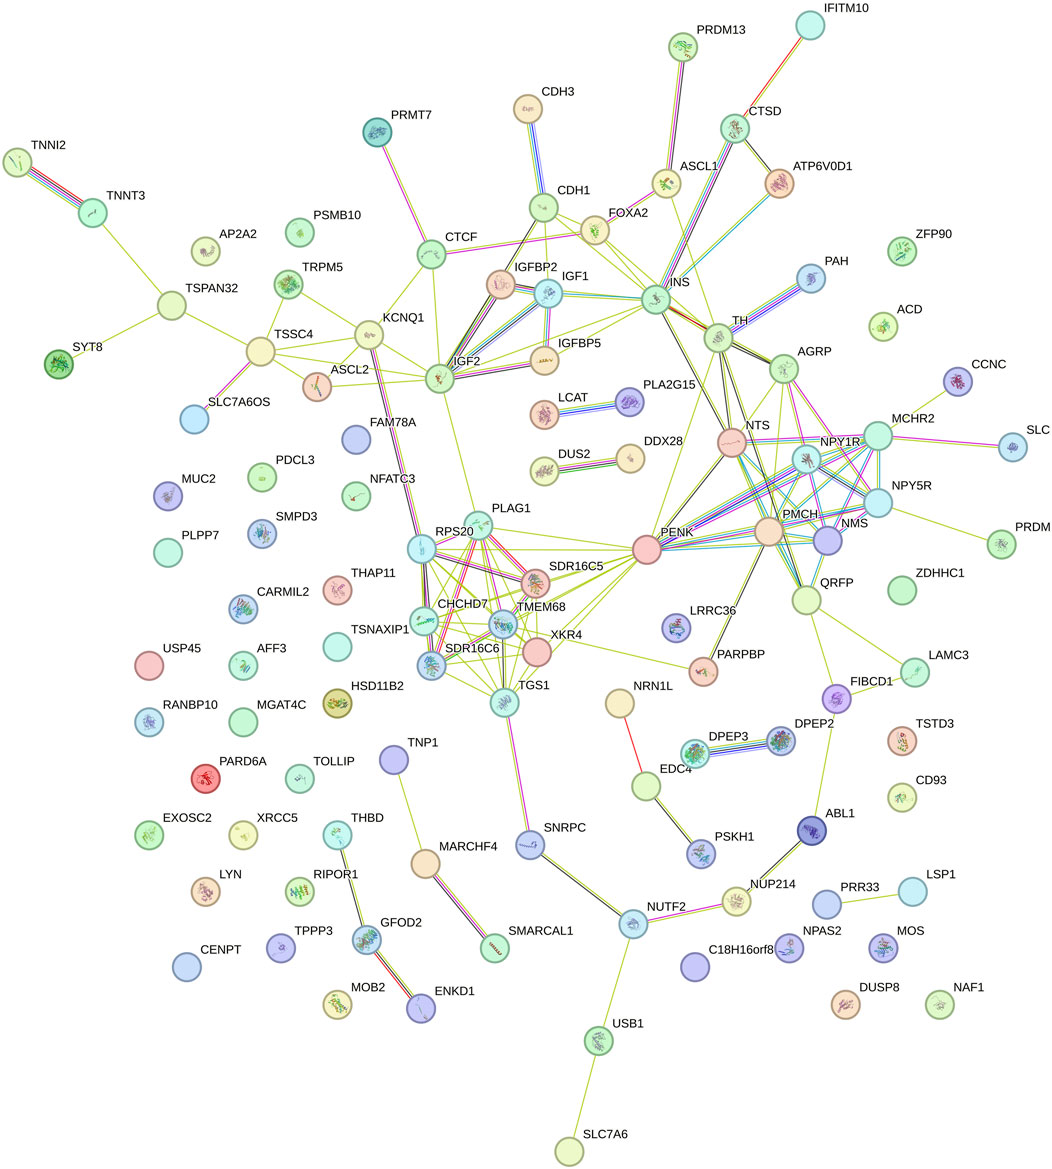
Figure 6. Functional network of genes identified in the genomic windows that explained more than 1% of the total direct additive genetic variance of the slope for dry matter intake (DMI) in Nellore cattle. Each node represents a gene, while the lines connecting the nodes indicate known functional interactions or associations between these genes. The different colors of the nodes and lines indicate distinct types of interactions or classifications of biological functions, based on the network analysis.
Figure 6 represents the genetic modulation in response to the environment in which a complex interaction between central and peripheral genes is observed, highlighting pathways associated with appetite regulation and energy metabolism. Genes such as IGF2, INS, PLAG1, and PMCH are strongly connected to other genes related to energy homeostasis, such as IGFBP5 and ASCL2, suggesting their involvement in growth regulation and response to changes in feed intake over time. The gene NPY1R, centralized in the network, reinforces its function in appetite regulation and variation of DMI, while less connected sub-networks, such as those involving the TNNI2 and SYT8 genes, may indicate specialized functions. The different colors in the connections between genes suggest varied gene interactions, potentially correlated with environmental and dietary factors. The gene PENK, which encodes precursors of enkephalins, stands out for its influence on neural signaling and appetite control, suggesting a crucial role in modulating feed intake and feeding behavior, thereby forming, along with the other genes, a complex regulatory network that affects the slope of DMI. Therefore, the differences observed between Figures 5, 6 clearly demonstrate the plasticity of the genetic network in response to environmental changes. While some genes maintain central importance in both contexts, others emerge as key players in genetic modulation in the face of environmental variations, highlighting the role of GxE in regulating DMI in Nellore cattle.
3.5 SNP effects by environmental gradient
The graphs presented in Figure 7 demonstrate the reaction norms of 100 SNPs within the relevant genomic windows (panels “a” to “k”) associated with RFI in Nellore cattle. The effects of the SNPs are plotted across low, medium, and high EG, allowing for the visualization of GxE interactions. The genomic windows are ordered according to their relevance, providing a comparative view of the environmental sensitivity of the SNPs within each genomic window.
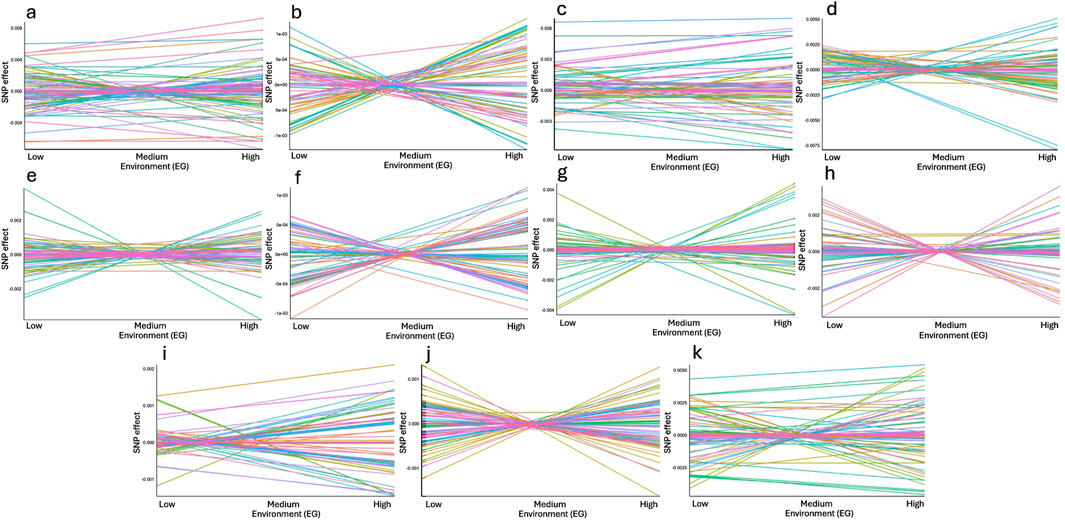
Figure 7. Reaction norms for the effects of all 100 Single Nucleotide Polymorphisms (SNP) comprising the genomic windows (a-k) that explained at least 1% of the total additive genetic variance associated with residual feed intake (RFI) in Nellore cattle across low, medium, and high environmental gradients (EG). The graphs are presented in order of the magnitude of additive genetic variance explained by each genomic window, as shown in Table 5, allowing for comparison of SNP impacts under different environmental conditions (EG). Each color of the lines represents a different SNP. Chromosomes and regions: (a) BTA4: 70.83–71.85 Mb; (b) BTA14: 24.39–24.91 Mb; (c) BTA5: 66.51–67.03 Mb; (d) BTA21: 7.35–8.15 Mb; (e) BTA2: 104.16–104.55 Mb; (f) BTA14: 22.99–23.45 Mb; (g) BTA2: 104.65–105.41 Mb; (h) BTA7: 16.07–16.44 Mb; (i) BTA14: 24.91–25.43 Mb; (j) BTA14: 22.61–22.99 Mb; (k) BTA11: 74.02–74.67 Mb.
SNP-environment interactions are evident in certain genomic windows. Panels such as “b”, “d”, “e”, “f”, “g”, “h” and “j” (BTA14: 24.39–24.91 Mb; BTA21: 7.35–8.15 Mb; BTA2: 104.16–104.55 Mb; BTA14: 22.99–23.45 Mb; BTA2: 104.65–105.41 Mb; BTA7: 16.07–16.44 Mb and BTA14: 22.61–22.99 Mb, respectively) reveal variability in SNP effects as the environment shifts from low to high environmental conditions (extremes), highlighting the presence of GxE interactions (Figure 7). In these cases, the SNPs show differentiated effects depending on environmental conditions, with some alleles exhibiting higher or lower effects as the environmental gradient changes. This suggests that these genomic regions may harbor genes that are particularly sensitive to environmental factors affecting RFI. On the other hand, some genomic windows, such as those located in BTA4: 70.83–71.85 Mb; BTA5: 66.51–67.03 Mb; BTA14: 24.91–25.43 Mb and BTA11: 74.02–74.67 Mb illustrated in panels “a”, “c”, “i”, and “k”, respectively, show relatively more stable SNP effects across the EG (Figure 7). These SNPs appear to be less affected by environmental variation, indicating they may play a more consistent role in RFI across different environments. The greater stability observed in these windows may make them valuable targets for selection when a robust genetic response across environments is desired.
An important pattern observed in several graphs is the crossing of reaction norms, where the effects of SNPs change not only in magnitude but also in direction as the environmental conditions shifts. This highlights the complexity of GxE interactions. The crossed reaction norms underscore the need to consider the environmental context when selecting animals for traits related to RFI, as certain alleles may be beneficial only under specific conditions. Genomic windows with more pronounced changes in SNP effects likely capture a larger share of the genetic variability linked to environmental response. These windows are of particular interest for future research, as they may contain key genes that influence the adaptability of feed efficiency to environmental changes. Identifying these SNPs could lead to more precise genetic selection strategies, improving cattle resilience and performance across different environments.
The effects of SNPs located in the genomic regions associated with DMI in Nellore cattle are shown in Figure 8. Similar to what was observed for RFI, certain genomic regions exhibited interactions between SNPs and the environment. Panels such as “b” (BTA5: 65.97–66.93 Mb), “e” (BTA2: 104.16–104.55 Mb), “g” (BTA2: 104.58–105.27 Mb), “j” (BTA6: 2.32–2.80 Mb), “l” (BTA5: 15.53–15.88 Mb), “n” (BTA11: 100.94–101.52 Mb) and “o” (BTA9: 49.80–50.31 Mb) highlight the variation in SNP effects as the EG shifts from low to high (Figure 8). Furthermore, the crossing of reaction norms was also observed, indicating that the effects of SNPs not only vary in magnitude but also change direction with environmental alterations, suggesting that these genomic regions may harbor genes that are highly sensitive to environmental factors. In contrast, some genomic windows, such as those represented in panels “a” (BTA14: 22.90–23.31 Mb), “c” (BTA18: 32.19–32.54 Mb), “d” (BTA13: 41.40–41.97 Mb), “f” (BTA18: 34.95–35.60 Mb), “i” (BTA11: 155.72–156.03 Mb), “k” (BTA14: 23.33–23.89 Mb), “m” (BTA29: 48.74–50.54 Mb) and “p” (BTA18: 35.62–36.07 Mb) show more consistent SNP effects across EG (Figure 8), indicating that these SNPs are less influenced by environmental variations and may play a more stable role in DMI across different environments.
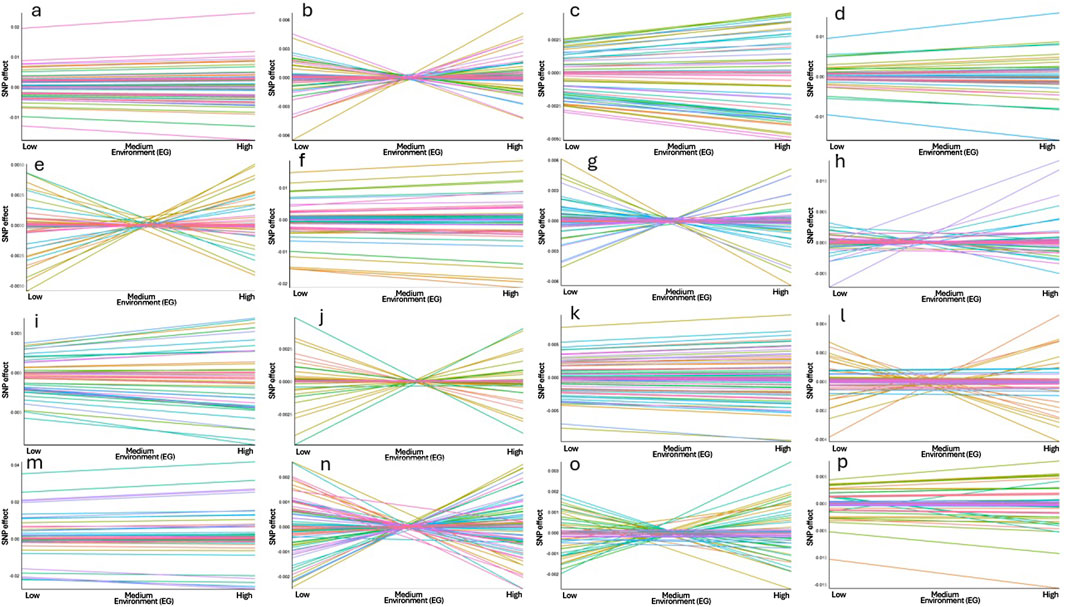
Figure 8. Reaction norms for the effects of all 100 Single Nucleotide Polymorphisms (SNP) comprising each genomic window (a-p) that explain at least 1% of the additive genetic variance associated with dry matter intake (DMI) in Nellore cattle across low, medium, and high environmental gradients (EG). The graphs are presented in order of the magnitude of additive genetic variance explained by each genomic window, as shown in Table 9, allowing for comparison of SNP impacts under different environmental conditions (EG). Each color of the lines represents a different SNP. Chromosomes and regions: (a) BTA14: 22.90–23.31 Mb; (b) BTA5: 65.97–66.93 Mb; (c) BTA18: 32.19–32.54 Mb; (d) BTA13: 41.40–41.97 Mb; (e) BTA2: 104.16–104.55 Mb; (f) BTA18: 34.95–35.60 Mb; (g) BTA2: 104.58–105.27 Mb; (H) BTA11: 5.55–5.92 Mb; (i) BTA11: 155.72–156.03 Mb; (j) BTA6: 2.32–2.80 Mb; (k) BTA14: 23.33–23.89 Mb; (l) BTA5: 15.53–15.88 Mb; (m) BTA29: 48.74–50.54 Mb; (n) BTA11: 100.94–101.52 Mb; (o) BTA9: 49.80–50.31 Mb; (p) BTA18: 35.62–36.07 Mb.
The variation in SNP effects across EG suggests that breeding programs to improve RFI and DMI should consider GxE interactions. SNPs that exhibit significant positive effects in low environmental gradients may not perform similarly in high gradients, which could impact the genomic selection efficiency of cattle in diverse environments. By identifying SNPs that maintain stable effects across different environments or that are advantageous under specific conditions, breeding strategies can be tailored to optimize feed efficiency. Understanding the genetic architecture of these traits in relation to environmental variation will be crucial for enhancing feed efficiency and sustainability in cattle production, especially considering the increasing challenges posed by climatic variability.
3.6 Reaction norms to GEBV for RFI
Figure 9 provides a comprehensive analysis of RFI, revealing the complexity of the interaction between GEBVs and EG. In panel “a”, the reaction norms for RFI indicate considerable variation in GEBVs across the EG. Different inclinations suggest that some individuals respond more to environmental variations, while others maintain stable performance, reflecting genetic plasticity. This suggests that the phenotypic response to feed efficiency depends on environmental conditions, emphasizing the importance of considering phenotypic plasticity in genetic improvement strategies.
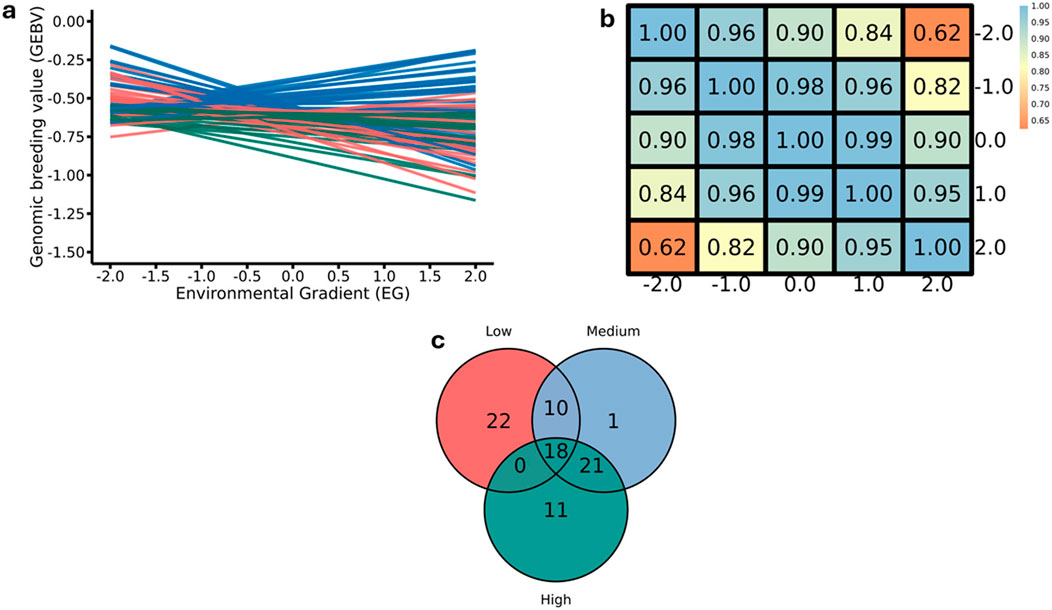
Figure 9. Reaction norms for residual feed intake (RFI) (a) Pearson correlation for genomic estimated breeding values (GEBVs) (b) and the number of common and specific sires with offspring in the environmental classes for RFI (c) considering the 50 sires with the highest number of progeny and top-ranked by GEBV in the moderate environmental gradient (EG = 0.0). The colors of the lines in panel “a” represent the EG, green for medium, red for high and blue for low.
In panel “b”, Pearson’s correlation analysis highlights the similarity between GEBV values in different EGs, with most correlations exceeding 0.80 (Figure 9). This finding suggests that, while variations exist, sires with high GEBVs tend to maintain their ranking across environments, indicating consistency in the expression of the RFI. However, the lowest correlation (0.62) at the extremes (low and high) of the EG implies that environmental factors may more intensely influence feed efficiency under more divergent environmental conditions, which warrants attention in future selection programs.
Panel “c” illustrates the intersection of sires classified into different EG levels (Figure 9). The presence of 18 sires that stand out across all EG indicates that these individuals possess a robust genetic profile that translates into stable performance across varying environmental conditions. However, the significant number of sires exclusive to one environment (22 in the low EG and 11 in the high EG) suggests reduced precision in selection when contrasting environments are considered. These results provide a foundation for implementing genetic improvement programs aimed at sustainability and productivity, where GxE is considered crucial for optimizing sire selection and maximizing feed performance under diverse environmental conditions.
3.7 Reaction norm to GEBV for DMI
Figure 10 presents the results of the relationships between GEBVs and EG for DMI. In panel “a”, the reaction norms illustrate the variation in GEBVs across the environmental gradient. The sires show different response patterns to environmental changes, with some animals exhibiting increasing GEBVs along the EG (upward lines), while others show a decrease (downward lines). Like for RFI, this indicates heterogeneity in the genetic response to the environment for DMI, highlighting the presence of GxE, as different sires perform variably across different EG.
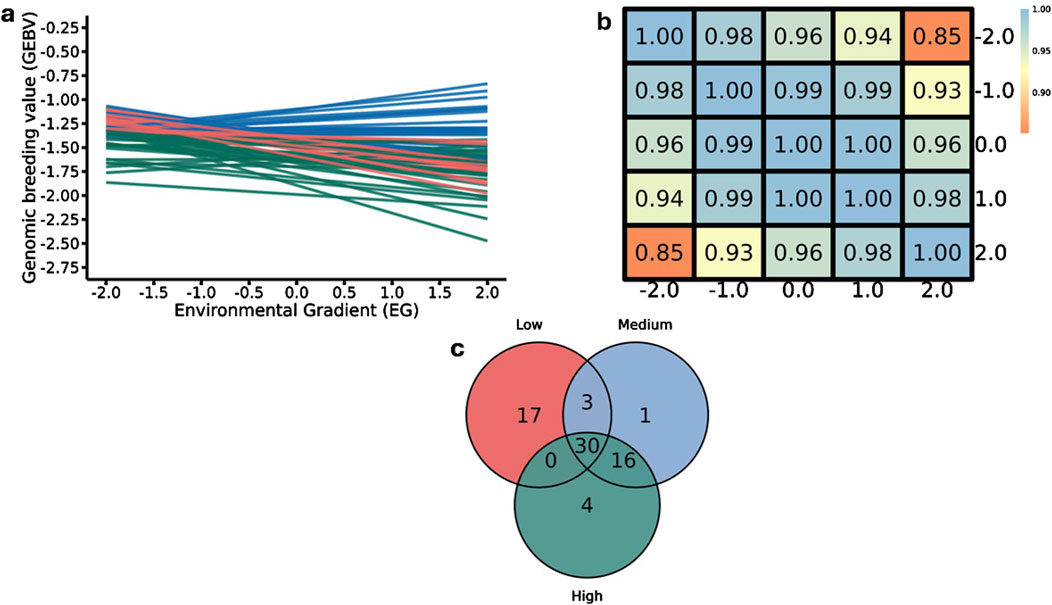
Figure 10. Reaction norms for dry matter intake (DMI) (a) Pearson correlation for genomic estimated breeding values (GEBVs) (b) and the number of common and specific sires with offspring in the environmental classes for DMI (c) considering the 50 sires with the highest number of progeny and top-ranked by GEBV in the moderate environmental gradient (EG = 0.0). The colors of the lines in panel “a” represent the EG, green for medium, red for high and blue for low.
The Pearson correlation matrix of GEBVs across different EGs for DMI (Figure 10, panel “b”) presents correlations that exceed 0.90, demonstrating a strong consistency in the sires’ GEBV rankings across EG levels. The decrease in the correlation (0.85) at the most different EGs (low and high) underscores a potential variability in DMI responses among sires, even if that is low. Higher Pearson correlations for DMI compared to RFI can be explained by the greater relative stability of the SNPs’ effects present in the genomic windows that explain more additive genetic variance (Figure 8), thus reflecting the observed behavior in the GEBVs. The intersection of sires classified across low, medium, and high EG levels is shown in Figure 10, panel “c”. The presence of 30 sires consistently ranked high across all environments, demonstrating genetic robustness under different EG. However, 17 sires were exclusive to the low EG, and four sires were unique to the high EG, suggesting that these animals may be better adapted to specific environmental conditions. Only three sires stood out in both low and medium EG, while one sire was shared between medium and high EG.
4 Conclusion
This study identified key genomic regions associated with RFI and DMI in Nellore cattle, providing significant insights into the genetic background of feed efficiency traits across environmental gradients. For RFI, the intercept network pointed to biological processes crucial for appetite regulation and energy metabolism, emphasizing their role in the genetic variation of RFI in the average environment. The slope network shifted focus to distinct genetic mechanisms influencing RFI variation across EG, including lipid metabolism and mitochondrial function. In the context of DMI, the intercept network featured processes involved in growth regulation, cellular proliferation, and energy metabolism, while the slope network emphasized pathways associated with appetite regulation and energy homeostasis. These findings underscore the adaptability of genetic networks in response to EG influences and highlight the importance of understanding these biological processes, which will be crucial for developing targeted breeding strategies to enhance feed efficiency in Nellore cattle, contributing to improved livestock production and sustainability.
Data availability statement
The data analyzed in this study were obtained from the National Association of Breeders and Researchers (ANCP). The phenotypic and genotypic information was provided to the authors for academic research purposes only. The following restrictions apply: the dataset is not publicly available and its use requires formal authorization. Requests to access these datasets should be directed to Dr. João Carlos G. Giffoni Filho, President of ANCP (email: cHJlc2lkZW5jaWFAYW5jcC5vcmcuYnI=).
Ethics statement
Ethical review and approval were not required for this study involving animals, in accordance with local legislation and institutional requirements, because the data was obtained from an existing database and no new animal procedures were performed.
Author contributions
JS: Conceptualization, Data curation, Formal Analysis, Investigation, Methodology, Resources, Visualization, Writing – original draft, Writing – review and editing. LB: Methodology, Supervision, Visualization, Writing – review and editing. LM: Methodology, Supervision, Visualization, Writing – review and editing. CM: Writing – review and editing. FB: Data curation, Funding acquisition, Methodology, Project administration, Resources, Supervision, Writing – review and editing.
Funding
The author(s) declare that financial support was received for the research and/or publication of this article. The authors thank the São Paulo Research Foundation (FAPESP, Brazil) for financial support through a PhD scholarship in Brazil and an international research internship (BEPE), both granted to the first author (grant numbers #2022/15385-4 and #2023/13417-9). This study was also partially financed by the Coordination for the Improvement of Higher Education Personnel (CAPES, Brazil) - Finance Code 001.
Acknowledgments
The authors thank the National Association of Breeders and Researchers (ANCP, Ribeirão Preto, SP, Brazil) for providing the datasets for the research.
Conflict of interest
The authors declare that the research was conducted in the absence of any commercial or financial relationships that could be construed as a potential conflict of interest.
The author(s) declared that they were an editorial board member of Frontiers, at the time of submission. This had no impact on the peer review process and the final decision.
Generative AI statement
The author(s) declare that no Generative AI was used in the creation of this manuscript.
Publisher’s note
All claims expressed in this article are solely those of the authors and do not necessarily represent those of their affiliated organizations, or those of the publisher, the editors and the reviewers. Any product that may be evaluated in this article, or claim that may be made by its manufacturer, is not guaranteed or endorsed by the publisher.
Supplementary material
The Supplementary Material for this article can be found online at: https://www.frontiersin.org/articles/10.3389/fgene.2025.1539056/full#supplementary-material
References
Abbas, Z., Hu, L., Fang, H., Sammad, A., Kang, L., Brito, L. F., et al. (2020). Association analysis of polymorphisms in the 5′ flanking region of the HSP70 gene with blood biochemical parameters of lactating Holstein cows under heat and cold stress. Animals 10, 2016. doi:10.3390/ani10112016
Adhikari, B., Lee, C. N., Khadka, V. S., Deng, Y., Fukumoto, G., Thorne, M., et al. (2022). RNA-Sequencing based analysis of bovine endometrium during the maternal recognition of pregnancy. BMC Genomics 23, 494. doi:10.1186/s12864-022-08720-4
Adhikari, H., and Cullen, P. J. (2014). Metabolic respiration induces AMPK- and ire1p-dependent activation of the p38-type HOG MAPK pathway. PLoS Genet. 10, e1004734. doi:10.1371/journal.pgen.1004734
Aguilar, I., Misztal, I., Johnson, D. L., Legarra, A., Tsuruta, S., and Lawlor, T. J. (2010). Hot topic: a unified approach to utilize phenotypic, full pedigree, and genomic information for genetic evaluation of Holstein final score. J. Dairy Sci. 93, 743–752. doi:10.3168/jds.2009-2730
Ahmad, B., Serpell, C. J., Fong, I. L., and Wong, E. H. (2020). Molecular mechanisms of adipogenesis: the anti-adipogenic role of AMP-activated protein kinase. Front. Mol. Biosci. 7, 76. doi:10.3389/fmolb.2020.00076
Al-Mamun, H. A., Kwan, P., Clark, S. A., Ferdosi, M. H., Tellam, R., and Gondro, C. (2015). Genome-wide association study of body weight in Australian Merino sheep reveals an orthologous region on OAR6 to human and bovine genomic regions affecting height and weight. Genet. Sel. Evol. 47, 66–11. doi:10.1186/s12711-015-0142-4
Al-Massadi, O., Parini, P., Fernø, J., Luquet, S., and Quiñones, M. (2022). Metabolic actions of the growth hormone-insulin growth factor-1 axis and its interaction with the central nervous system. Rev. Endocr. Metabolic Disord. 23, 919–930. doi:10.1007/s11154-022-09732-x
Arikawa, L. M., Mota, L. F. M., Schmidt, P. I., Frezarim, G. B., Fonseca, L. F. S., Magalhães, A. F. B., et al. (2024). Genome-wide scans identify biological and metabolic pathways regulating carcass and meat quality traits in beef cattle. Meat Sci. 209, 109402. doi:10.1016/j.meatsci.2023.109402
Arndt, C., Powell, J. M., Aguerre, M. J., Crump, P. M., and Wattiaux, M. A. (2015). Feed conversion efficiency in dairy cows: repeatability, variation in digestion and metabolism of energy and nitrogen, and ruminal methanogens. J. Dairy Sci. 98, 3938–3950. doi:10.3168/jds.2014-8449
Artegoitia, V. M., Foote, A. P., Lewis, R. M., and Freetly, H. C. (2019). Metabolomics profile and targeted lipidomics in multiple tissues associated with feed efficiency in beef steers. ACS omega 4, 3973–3982. doi:10.1021/acsomega.8b02494
Astrain, G. B., Nikolova, M., and Smith, M. J. (2022). Functional diversity in the RAS subfamily of small GTPases. Biochem. Soc. Trans. 50, 921–933. doi:10.1042/BST20211166
Avila, M., Martinez-Juarez, A., Ibarra-Sanchez, A., and Gonzalez-Espinosa, C. (2012). Lyn kinase controls TLR4-dependent IKK and MAPK activation modulating the activity of TRAF-6/TAK-1 protein complex in mast cells. Innate Immun. 18, 648–660. doi:10.1177/1753425911435265
Bardwell, L. (2006). Mechanisms of MAPK signalling specificity. Biochem. Soc. Trans. 34, 837–841. doi:10.1042/BST0340837
Basarab, J. A., Price, M. A., Aalhus, J. L., Okine, E. K., Snelling, W. M., and Lyle, K. L. (2003). Residual feed intake and body composition in young growing cattle. Can. J. Animal Sci. 83, 189–204. doi:10.4141/A02-065
Bolormaa, S., Hayes, B. J., Savin, K., Hawken, R., Barendse, W., Arthur, P. F., et al. (2011). Genome-wide association studies for feedlot and growth traits in cattle. J. Animal Sci. 89, 1684–1697. doi:10.2527/jas.2010-3079
Bottje, W. G., and Carstens, G. E. (2009). Association of mitochondrial function and feed efficiency in poultry and livestock species. J. Animal Sci. 87, 48–63. doi:10.2527/jas.2008-1379
Bougarne, N., Weyers, B., Desmet, S. J., Deckers, J., Ray, D. W., Staels, B., et al. (2018). Molecular actions of PPARα in lipid metabolism and inflammation. Endocr. Rev. 39, 760–802. doi:10.1210/er.2018-00064
Brito, L. F., Oliveira, H. R., Houlahan, K., Fonseca, P. A., Lam, S., Butty, A. M., et al. (2020). Genetic mechanisms underlying feed utilization and implementation of genomic selection for improved feed efficiency in dairy cattle. Can. J. Animal Sci. 100, 587–604. doi:10.1139/cjas-2019-0193
Brunes, L. C., Baldi, F., Lopes, F. B., Lôbo, R. B., Espigolan, R., Costa, M. F. O., et al. (2020). Weighted single-step genome-wide association study and pathway analyses for feed efficiency traits in Nellore cattle. J. Animal Breed. Genet. 138, 23–44. doi:10.1111/jbg.12496
Calì, G., Gentile, F., Mogavero, S., Pallante, P., Nitsch, R., Ciancia, G., et al. (2012). CDH16/Ksp-cadherin is expressed in the developing thyroid gland and is strongly down-regulated in thyroid carcinomas. Endocrinology 153, 522–534. doi:10.1210/en.2011-1572
Cansell, C., Denis, R. G. P., Joly-Amado, A., Castel, J., and Luquet, S. (2012). Arcuate AgRP neurons and the regulation of energy balance. Front. Endocrinol. 3, 169. doi:10.3389/fendo.2012.00169
Cantalapiedra-Hijar, G., Abo-Ismail, M., Carstens, G. E., Guan, L. L., Hegarty, R., Kenny, D. A., et al. (2018). Review: biological determinants of between-animal variation in feed efficiency of growing beef cattle. Animal 12, S321–S335. doi:10.1017/S1751731118001489
Chakraborty, S., Feng, Z., Lee, S., Alvarenga, O. E., Panda, A., Bruni, R., et al. (2024). Structure and function of the human apoptotic scramblase Xkr4. bioRxiv 8. doi:10.1101/2024.08.07.607004
Chen, Y., Essner, R. A., Kosar, S., Miller, O. H., Lin, Y. C., Mesgarzadeh, S., et al. (2019). Sustained NPY signaling enables AgRP neurons to drive feeding. Elife 8, e46348. doi:10.7554/eLife.46348
da Silva Neto, J. B., Peripoli, E., Pereira, A. S. C., Stafuzza, N. B., Lôbo, R. B., Fukumasu, H., et al. (2023). Weighted genomic prediction for growth and carcass-related traits in Nelore cattle. Anim. Genet. 54, 271–283. doi:10.1111/age.13310
Dehghanian Reyhan, V., Ghafouri, F., Sadeghi, M., Miraei-Ashtiani, S. R., Kastelic, J. P., Barkema, H. W., et al. (2023). Integrated comparative transcriptome and circRNA-lncRNA-miRNA-mRNA ceRNA regulatory network analyses identify molecular mechanisms associated with intramuscular fat content in beef cattle. Animals 13, 2598. doi:10.3390/ani13162598
Dennis, G., Sherman, B. T., Hosack, D. A., Yang, J., Gao, W., Lane, H. C., et al. (2003). DAVID: database for annotation, visualization, and integrated Discovery. Genome Biol. 4, R60–R11. doi:10.1186/gb-2003-4-9-r60
de Oliveira, P. S. N., Cesar, A. S. M., do Nascimento, M. L., Chaves, A. S., Tizioto, P. C., Tullio, R. R., et al. (2014). Identification of genomic regions associated with feed efficiency in Nelore cattle. BMC Genet. 15, 100–110. doi:10.1186/s12863-014-0100-0
Díaz Del Moral, S., Benaouicha, M., Muñoz-Chápuli, R., and Carmona, R. (2022). The insulin-like growth factor signalling pathway in cardiac development and regeneration. Int. J. Mol. Sci. 23, 234. doi:10.3390/ijms23010234
Edea, Z., Jung, K. S., Shin, S. S., Yoo, S. W., Choi, J. W., and Kim, K. S. (2020). Signatures of positive selection underlying beef production traits in Korean cattle breeds. J. Animal Sci. Technol. 62, 293–305. doi:10.5187/JAST.2020.62.3.293
Edinger, A. L. (2007). Controlling cell growth and survival through regulated nutrient transporter expression. Biochem. J. 406, 1–12. doi:10.1042/BJ20070490
Edinger, A. L., and Thompson, C. B. (2004). An activated mTOR mutant supports growth factor-independent, nutrient-dependent cell survival. Oncogene 23, 5654–5663. doi:10.1038/sj.onc.1207738
Ellison, M. J., Conant, G. C., Lamberson, W. R., Austin, K. J., Van Kirk, E., Cunningham, H. C., et al. (2019). Predicting residual feed intake status using rumen microbial profiles in Ewe lambs. J. Animal Sci. 97, 2878–2888. doi:10.1093/jas/skz170
Ellison, M. J., Conant, G. C., Lamberson, W. R., Cockrum, R. R., Austin, K. J., Rule, D. C., et al. (2017). Diet and feed efficiency status affect rumen microbial profiles of sheep. Small Ruminant Res. 156, 12–19. doi:10.1016/j.smallrumres.2017.08.009
Enjalbert, F., Combes, S., Zened, A., and Meynadier, A. (2017). Rumen microbiota and dietary fat: a mutual shaping. J. Appl. Microbiol. 123, 782–797. doi:10.1111/jam.13501
Fernandes Júnior, G. A., Costa, R. B., De Camargo, G. M. F., Carvalheiro, R., Rosa, † G. J. M., Baldi, F., et al. (2016). Genome scan for postmortem carcass traits in Nellore cattle 1. J. animal Sci. 94, 4087–4095. doi:10.2527/jas2016-0632
Fernandez-Novo, A., Pérez-Garnelo, S. S., Villagrá, A., Pérez-Villalobos, N., and Astiz, S. (2020). The effect of stress on reproduction and reproductive technologies in beef cattle—a review. Animals 10, 1–23. doi:10.3390/ani10112096
Fregulia, P., Neves, A. L. A., Dias, R. J. P., and Campos, M. M. (2021). A review of rumen parameters in bovines with divergent feed efficiencies: what do these parameters tell us about improving animal productivity and sustainability? Livest. Sci. 254, 104761. doi:10.1016/j.livsci.2021.104761
Fuior, E. V., Zvintzou, E., Filippatos, T., Giannatou, K., Mparnia, V., Simionescu, M., et al. (2023). Peroxisome proliferator-activated receptor α in lipoprotein metabolism and atherosclerotic cardiovascular disease. Biomedicines 11, 2696. doi:10.3390/biomedicines11102696
Gan, L., Guo, K., Cremona, M. L., McGraw, T. E., Leibel, R. L., and Zhang, Y. (2012). TNF-α up-regulates protein level and cell surface expression of the leptin receptor by stimulating its export via a PKC-dependent mechanism. Endocrinology 153, 5821–5833. doi:10.1210/en.2012-1510
Gao, J., and Nakamura, F. (2022). Actin-associated proteins and small molecules targeting the actin cytoskeleton. Int. J. Mol. Sci. 23, 2118. doi:10.3390/ijms23042118
Garcia, A. L., Bosworth, B., Waldbieser, G., Misztal, I., Tsuruta, S., and Lourenco, D. A. (2018). Development of genomic predictions for harvest and carcass weight in channel catfish. Genet. Sel. Evol. 50, 66–12. doi:10.1186/s12711-018-0435-5
Geweke, J. (1992). Evaluating the accuracy of sampling-based approaches to the calculation of posterior moments, 148, 1–8. Minneapolis, MN: Federal Reserve Bank of Minneapolis.
Gilbert, M., Conchedda, G., Van Boeckel, T. P., Cinardi, G., Linard, C., Nicolas, G., et al. (2015). Income disparities and the global distribution of intensively farmed chicken and pigs. PLoS ONE 10, e0133381. doi:10.1371/journal.pone.0133381
Gonzalez-Garcia, J. R., Bradley, J., Nomikos, M., Paul, L., Machaty, Z., Anthony Lai, F., et al. (2014). The dynamics of MAPK inactivation at fertilization in mouse eggs. J. Cell Sci. 127, 2749–2760. doi:10.1242/jcs.145045
Grant, B. D., and Donaldson, J. G. (2009). Pathways and mechanisms of endocytic recycling. Nat. Rev. Mol. Cell Biol. 10, 597–608. doi:10.1038/nrm2755
Hakuno, F., and Takahashi, S. I. (2018). 40 years of IGF1: IGF1 receptor signaling pathways. J. Mol. Endocrinol. 61, T69–T86. doi:10.1530/JME-17-0311
Hales, K. E. (2019). Relationships between digestible energy and metabolizable energy in current feedlot diets. Transl. Animal Sci. 3, 945–952. doi:10.1093/tas/txz073
Hales, K. E., Foote, A. P., Brown-Brandl, T. M., and Freetly, H. C. (2017). The effects of feeding increasing concentrations of corn oil on energy metabolism and nutrient balance in finishing beef steers. J. Animal Sci. 95, 939–948. doi:10.2527/jas.2016.0902
Hardy, K. M., Yatskievych, T. A., Konieczka, J., Bobbs, A. S., and Antin, P. B. (2011). FGF signalling through RAS/MAPK and PI3K pathways regulates cell movement and gene expression in the chicken primitive streak without affecting E-cadherin expression. BMC Dev. Biol. 11, 20–17. doi:10.1186/1471-213X-11-20
Hasenmajer, V., Bonaventura, I., Minnetti, M., Sada, V., Sbardella, E., and Isidori, A. M. (2021). Non-canonical effects of ACTH: insights into adrenal insufficiency. Front. Endocrinol. 12, 701263. doi:10.3389/fendo.2021.701263
Haskell, M. J., Rooke, J. A., Roehe, R., Turner, S. P., Hyslop, J. J., Waterhouse, A., et al. (2019). Relationships between feeding behaviour, activity, dominance and feed efficiency in finishing beef steers. Appl. Animal Behav. Sci. 210, 9–15. doi:10.1016/j.applanim.2018.10.012
Hayes, B. J., Chamberlain, A. J., McPartlan, H., Macleod, I., Sethuraman, L., and Goddard, M. E. (2007). Accuracy of marker-assisted selection with single markers and marker haplotypes in cattle. Genet. Res. 89, 215–220. doi:10.1017/S0016672307008865
Herd, R. M., and Arthur, P. F. (2009). Physiological basis for residual feed intake. J. Animal Sci. 87, 64–71. doi:10.2527/jas.2008-1345
Herd, R. M., Oddy, V. H., and Richardson, E. C. (2004). Biological basis for variation in residual feed intake in beef cattle. 1. Review of potential mechanisms. Aust. J. Exp. Agric. 44, 423–430. doi:10.1071/EA02220
Hermann, M., Kuznetsov, A., Maglione, M., Smigelskaite, J., Margreiter, R., and Troppmair, J. (2008). Cytoplasmic signaling in the control of mitochondrial uproar? Cell Commun. Signal. 6, 4–8. doi:10.1186/1478-811X-6-4
Hoshiba, H., Setoguchi, K., Watanabe, T., Kinoshita, A., Mizoshita, K., Sugimoto, Y., et al. (2013). Comparison of the effects explained by variations in the bovine PLAG1 and NCAPG genes on daily body weight gain, linear skeletal measurements and carcass traits in Japanese Black steers from a progeny testing program. Animal Sci. J. 84, 529–534. doi:10.1111/asj.12033
Hosokawa, M., Furihata, T., Yaginuma, Y., Yamamoto, N., Koyano, N., Fujii, A., et al. (2007). Genomic structure and transcriptional regulation of the rat, mouse, and human carboxylesterase genes. Drug Metab. Rev. 39, 1–15. doi:10.1080/03602530600952164
Hou, J., Qu, K., Jia, P., Hanif, Q., Zhang, J., Chen, N., et al. (2019). A SNP in PLAG1 is associated with body height trait in Chinese cattle. Anim. Genet. 51, 87–90. doi:10.1111/age.12872
Hu, L., Fang, H., Abbas, Z., Luo, H., Brito, L. F., Wang, Y., et al. (2024). The HSP90AA1 gene is involved in heat stress responses and its functional genetic polymorphisms are associated with heat tolerance in Holstein cows. J. Dairy Sci. 107, 5132–5149. doi:10.3168/jds.2023-24007
Huang, Y. Z., Zhan, Z. Y., Li, X. Y., Wu, S. R., Sun, Y. J., Xue, J., et al. (2014). SNP and haplotype analysis reveal IGF2 variants associated with growth traits in Chinese Qinchuan cattle. Mol. Biol. Rep. 41, 591–598. doi:10.1007/s11033-013-2896-5
Humphrey, S. J., James, D. E., and Mann, M. (2015). Protein phosphorylation: a major switch mechanism for metabolic regulation. Trends Endocrinol. Metabolism 26, 676–687. doi:10.1016/j.tem.2015.09.013
Hüttemann, M., Lee, I., Samavati, L., Yu, H., and Doan, J. W. (2007). Regulation of mitochondrial oxidative phosphorylation through cell signaling. Biochimica Biophysica Acta - Mol. Cell Res. 1773, 1701–1720. doi:10.1016/j.bbamcr.2007.10.001
Igarashi, P. (2003). Following the expression of a kidney-specific gene from early development to adulthood. Nephron Exp. Nephrol. 94, 1–6. doi:10.1159/000070812
Illescas, M., Peñas, A., Arenas, J., Martín, M. A., and Ugalde, C. (2021). Regulation of mitochondrial function by the actin cytoskeleton. Front. Cell Dev. Biol. 9, 795838. doi:10.3389/fcell.2021.795838
Itoh, N. (2007). The fgf families in humans, mice, and zebrafish: their evolutional processes and roles in development, metabolism, and disease. Biol. Pharm. Bull. 30, 1819–1825. doi:10.1248/bpb.30.1819
Itoh, N., and Ornitz, D. M. (2004). Evolution of the fgf and fgfr gene families. Trends Genet. 20, 563–569. doi:10.1016/j.tig.2004.08.007
Jia, W., Li, Y., Cheung, K. C. P., and Zheng, X. (2024). Bile acid signaling in the regulation of whole body metabolic and immunological homeostasis. Sci. China Life Sci. 67, 865–878. doi:10.1007/s11427-023-2353-0
Jia, W., Wei, M., Rajani, C., and Zheng, X. (2021). Targeting the alternative bile acid synthetic pathway for metabolic diseases. Protein Cell 12, 411–425. doi:10.1007/s13238-020-00804-9
Jiang, N., Li, Y., Shu, T., and Wang, J. (2019). Cytokines and inflammation in adipogenesis: an updated review. Front. Med. 13, 314–329. doi:10.1007/s11684-018-0625-0
Kenny, D. A., Fitzsimons, C., Waters, S. M., and McGee, M. (2018). Invited review: improving feed efficiency of beef cattle - the current state of the art and future challenges. Animal 12, 1815–1826. doi:10.1017/S1751731118000976
Klok, M. D., Jakobsdottir, S., and Drent, M. L. (2007). The role of leptin and ghrelin in the regulation of food intake and body weight in humans: a review. Obes. Rev. 8, 21–34. doi:10.1111/j.1467-789X.2006.00270.x
Kolpakov, V., Ruchay, A., Kosyan, D., and Bukareva, E. (2024). Analysis of runs of homozygosity in aberdeen Angus cattle. Animals 14, 2153. doi:10.3390/ani14152153
Krause, D. O., Nagaraja, T. G., Wright, A. D. G., and Callaway, T. R. (2013). Board-invited review: rumen microbiology: leading the way in microbial ecology. J. Animal Sci. 91, 331–341. doi:10.2527/jas.2012-5567
Kyriazakis, I. (2011). Opportunities to improve nutrient efficiency in pigs and poultry through breeding. Animal 5, 821–832. doi:10.1017/S1751731110002545
La, Y., Zhang, X., Li, F., Zhang, D., Li, C., Mo, F., et al. (2019). Molecular characterization and expression of SPP1, LAP3 and LCORL and their association with growth traits in sheep. Genes 10, 616. doi:10.3390/genes10080616
Lamego, J., Cunha, B., Peixoto, C., Sousa, M. F., Alves, P. M., Simplício, A. L., et al. (2013). Carboxylesterase 2 production and characterization in human cells: new insights into enzyme oligomerization and activity. Appl. Microbiol. Biotechnol. 97, 1161–1173. doi:10.1007/s00253-012-3994-3
Lang, B. J., Guerrero, M. E., Prince, T. L., Okusha, Y., Bonorino, C., and Calderwood, S. K. (2021). The functions and regulation of heat shock proteins; key orchestrators of proteostasis and the heat shock response. Archives Toxicol. 95, 1943–1970. doi:10.1007/s00204-021-03070-8
Lefebvre, P., Chinetti, G., Fruchart, J. C., and Staels, B. (2006). Sorting out the roles of PPARα in energy metabolism and vascular homeostasis. J. Clin. Investigation 116, 571–580. doi:10.1172/JCI27989
Lennartz, M., Csomós, H., Chirico, V., Weidemann, S., Gorbokon, N., Menz, A., et al. (2023). Cadherin-16 (CDH16) immunohistochemistry: a useful diagnostic tool for renal cell carcinoma and papillary carcinomas of the thyroid. Sci. Rep. 13, 12917. doi:10.1038/s41598-023-39945-2
Li, H., Wang, X., Chen, H., Qu, L., and Lan, X. (2020). A 17-bp InDel (rs668420586) within goat CHCHD7 gene located in growth-related QTL affecting body measurement traits. 3 Biotech. 10, 441. doi:10.1007/s13205-020-02434-8
Lin, I. H., Chang, J. L., Hua, K., Huang, W. C., Hsu, M. T., and Chen, Y. F. (2018). Skeletal muscle in aged mice reveals extensive transformation of muscle gene expression. BMC Genet. 19, 55–13. doi:10.1186/s12863-018-0660-5
Lindholm-Perry, A. K., Kuehn, L. A., Oliver, W. T., Sexten, A. K., Miles, J. R., Rempel, L. A., et al. (2013). Adipose and muscle tissue gene expression of two genes (NCAPG and LCORL) located in a chromosomal region associated with cattle feed intake and gain. PLoS ONE 8, e80882. doi:10.1371/journal.pone.0080882
Lindholm-Perry, A. K., Sexten, A. K., Kuehn, L. A., Smith, T. P. L., King, D. A., Shackelford, S. D., et al. (2011). Association, effects and validation of polymorphisms within the NCAPG - LCORL locus located on BTA6 with feed intake, gain, meat and carcass traits in beef cattle. BMC Genet. 12, 103–113. doi:10.1186/1471-2156-12-103
Liu, J., Shang, X., Huang, S., Xu, Y., Lu, J., Zhang, Y., et al. (2021). Construction and characterization of CRISPR/Cas9 knockout rat model of carboxylesterase 2a gene. Mol. Pharmacol. 100, 480–490. doi:10.1124/molpharm.121.000357
Marcondes, M. I., Tedeschi, L. O., Valadares Filho, S. C., and Gionbelli, M. P. (2013). Predicting efficiency of use of metabolizable energy to net energy for gain and maintenance of Nellore cattle. J. Animal Sci. 91, 4887–4898. doi:10.2527/jas2011-4051
Marín-Garzón, N. A., Magalhães, A. F. B., Schmidt, P. I., Serna, M., Fonseca, L. F. S., Salatta, B. M., et al. (2021). Genome-wide scan reveals genomic regions and candidate genes underlying direct and maternal effects of preweaning calf mortality in Nellore cattle. Genomics 113, 1386–1395. doi:10.1016/j.ygeno.2021.02.021
McLoughlin, S., Spillane, C., Claffey, N., Smith, P. E., O’Rourke, T., Diskin, M. G., et al. (2020). Rumen microbiome composition is altered in sheep divergent in feed efficiency. Front. Microbiol. 11, 1981. doi:10.3389/fmicb.2020.01981
Meier, U., and Gressner, A. M. (2004). Endocrine regulation of energy metabolism: review of pathobiochemical and clinical chemical aspects of leptin, ghrelin, adiponectin, and resistin. Clin. Chem. 50, 1511–1525. doi:10.1373/clinchem.2004.032482
Mendes, E. D. M., Faria, C. U. de, Sainz, R. D., Silveira, A. C. L., Magnabosco, C. U., Eifert, E. da C., et al. (2020). Procedimentos para mensuração de consumo individual de alimento em bovinos de corte. 2nd ed. Ribeirão Preto, SP: Associação Nacional de Criadores e Pesquisadores ANCP.
Meneses, J. A. M., de Sá, O. A. A. L., Coelho, C. F., Pereira, R. N., Batista, E. D., Ladeira, M. M., et al. (2021). Effect of heat stress on ingestive, digestive, ruminal and physiological parameters of Nellore cattle feeding low- or high-energy diets. Livest. Sci. 252, 104676. doi:10.1016/j.livsci.2021.104676
Meng, X., and Zhang, S. (2013). MAPK cascades in plant disease resistance signaling. Annu. Rev. Phytopathology 51, 245–266. doi:10.1146/annurev-phyto-082712-102314
Meuwissen, T. H. E., Hayes, B. J., and Goddard, M. E. (2001). Prediction of total genetic value using genome-wide dense marker maps. Genetics 157, 1819–1829. doi:10.1093/genetics/157.4.1819
Millington, G. W. M. (2007). The role of proopiomelanocortin (POMC) neurones in feeding behaviour. Nutr. Metabolism 4, 18–16. doi:10.1186/1743-7075-4-18
Mistry, B. V., Alanazi, M., Fitwi, H., Al-Harazi, O., Rajab, M., Altorbag, A., et al. (2020). Expression profiling of WD40 family genes including DDB1- A nd CUL4- A ssociated factor (DCAF) genes in mice and human suggests important regulatory roles in testicular development and spermatogenesis. BMC Genomics 21, 602–621. doi:10.1186/s12864-020-07016-9
Misztal, I., Tsuruta, S., Lourenco, D. A. L., Aguilar, I., Legarra, A., and Z, V. (2014). Manual for BLUPF90 family of programs. Athens: University of Georgia. Manual for BLUPF90 family of programs.
Moe, P. W. (1981). Energy metabolism of dairy cattle. J. Dairy Sci. 64, 1120–1139. doi:10.3168/jds.S0022-0302(81)82692-6
Mota, L. F. M., Fernandes, G. A., Herrera, A. C., Scalez, D. C. B., Espigolan, R., Magalhães, A. F. B., et al. (2020a). Genomic reaction norm models exploiting genotype × environment interaction on sexual precocity indicator traits in Nellore cattle. Anim. Genet. 51, 210–223. doi:10.1111/age.12902
Mota, L. F. M., Lopes, F. B., Fernandes Júnior, G. A., Rosa, G. J. M., Magalhães, A. F. B., Carvalheiro, R., et al. (2020b). Genome-wide scan highlights the role of candidate genes on phenotypic plasticity for age at first calving in Nellore heifers. Sci. Rep. 10, 6481. doi:10.1038/s41598-020-63516-4
Mota, L. F. M., Santos, S. W. B., Júnior, G. A. F., Bresolin, T., Mercadante, M. E. Z., Silva, J. A. V., et al. (2022). Meta-analysis across Nellore cattle populations identifies common metabolic mechanisms that regulate feed efficiency-related traits. BMC Genomics 23, 424. doi:10.1186/s12864-022-08671-w
Mota, L. F. M., Carvajal, A.B., Silva Neto, J.B., et al. (2024). Assessment of inbreeding coefficients and inbreeding depression on complex traits from genomic and pedigree data in Nelore cattle. BMC Genomics 25, 944. doi:10.1186/s12864-024-10842-w
Mottet, A., and Tempio, G. (2017). Global poultry production: current state and future outlook and challenges. World’s Poult. Sci. J. 73, 245–256. doi:10.1017/S0043933917000071
Muhammad, H. F. L., Freitag, H., and Muhammad, L. (2018). Obesity as the sequel of childhood stunting: ghrelin and GHSR gene polymorphism explained. Acta Medica Indones. 50, 159–164. Available online at: https://actamedindones.org/index.php/ijim/article/view/493
Nahm, K. H. (2002). Efficient feed nutrient utilization to reduce pollutants in poultry and swine manure. Crit. Rev. Environ. Sci. Technol. 32, 1–16. doi:10.1080/10643380290813435
Nawaz, A., Zhang, J., Meng, Y., Sun, L., Zhou, H., Geng, C., et al. (2024). Fatty acid profiles unveiled: gene expression in Yanbian yellow cattle adipose tissues offers new insights into lipid metabolism. Arch. Anim. Breed. 67, 469–480. doi:10.5194/aab-67-469-2024
Nies, V. J. M., Sancar, G., Liu, W., Van Zutphen, T., Struik, D., Yu, R. T., et al. (2016). Fibroblast growth factor signaling in metabolic regulation. Front. Endocrinol. 6, 193. doi:10.3389/fendo.2015.00193
Nkrumah, J. D., Okine, E. K., Mathison, G. W., Schmid, K., Li, C., Basarab, J. A., et al. (2006). Relationships of feedlot feed efficiency, performance, and feeding behavior with metabolic rate, methane production, and energy partitioning in beef cattle. J. Animal Sci. 84, 145–153. doi:10.2527/2006.841145x
Okazaki, K., and Sagata, N. (1995). The Mos/MAP kinase pathway stabilizes c-Fos by phosphorylation and augments its transforming activity in NIH 3T3 cells. EMBO J. 14, 5048–5059. doi:10.1002/j.1460-2075.1995.tb00187.x
Oliveira, D. P., Lourenco, D. A. L., Tsuruta, S., Misztal, I., Santos, D. J. A., De Araújo Neto, F. R., et al. (2018). Reaction norm for yearling weight in beef cattle using single-step genomic evaluation. J. Animal Sci. 96, 27–34. doi:10.1093/jas/skx006
Olivieri, B. F., Mercadante, M. E. Z., Cyrillo, J. N. D. S. G., Branco, R. H., Bonilha, S. F. M., De Albuquerque, L. G., et al. (2016). Genomic regions associated with feed efficiency indicator traits in an experimental nellore cattle population. PLoS ONE 11, e0164390. doi:10.1371/journal.pone.0164390
Pan, Y., Wang, M., Wu, H., Akhatayeva, Z., Lan, X., Fei, P., et al. (2022). Indel mutations of sheep PLAG1 gene and their associations with growth traits. Anim. Biotechnol. 33, 1459–1465. doi:10.1080/10495398.2021.1906265
Patience, J. F., Rossoni-Serão, M. C., and Gutiérrez, N. A. (2015). A review of feed efficiency in swine: biology and application. J. Animal Sci. Biotechnol. 6, 1–9. doi:10.1186/s40104-015-0031-2
Payankaulam, S., Raicu, A. M., and Arnosti, D. N. (2019). Transcriptional regulation of INSR, the insulin receptor gene. Genes 10, 984. doi:10.3390/genes10120984
Pereira, A. G. T., Utsunomiya, Y. T., Milanesi, M., Torrecilha, R. B. P., Carmo, A. S., Neves, H. H. R., et al. (2016). Pleiotropic genes affecting carcass traits in bos indicus (Nellore) cattle are modulators of growth. PLoS ONE 11, e0158165. doi:10.1371/journal.pone.0158165
Pierzchała-Koziec, K., and Scanes, C. G. (2023). Avian opioid peptides: evolutionary considerations, functional roles and a challenge to address critical questions. Front. Physiology 14, 1164031. doi:10.3389/fphys.2023.1164031
Prihandini, P. W., Sari, A. P. Z. N. L., Tribudi, Y. A., Robba, D. K., and Wibowo, T. B. (2024). Polymorphisms of the leptin gene in jabres cattle. IOP Conf. Ser. Earth Environ. Sci. 1341, 012008. doi:10.1088/1755-1315/1341/1/012008
Pryce, J. E., Wales, W. J., De Haas, Y., Veerkamp, R. F., and Hayes, B. J. (2014). Genomic selection for feed efficiency in dairy cattle. Animal 8, 1–10. doi:10.1017/S1751731113001687
Reynolds, C. K., Crompton, L. A., and Mills, J. A. N. (2011). Improving the efficiency of energy utilisation in cattle. Animal Prod. Sci. 51, 6–12. doi:10.1071/AN10160
Rieger, L., and O’Connor, R. (2021). Controlled signaling—insulin-like growth factor receptor endocytosis and presence at intracellular compartments. Front. Endocrinol. 11, 620013. doi:10.3389/fendo.2020.620013
Rosen, B. D., Bickhart, D. M., Schnabel, R. D., Koren, S., Elsik, C. G., Tseng, E., et al. (2020). De novo assembly of the cattle reference genome with single-molecule sequencing. Gigascience 9, giaa021–9. doi:10.1093/gigascience/giaa021
Roso, V. M., and Schenkel, F. S. (2006). “AMC - a computer program to assess the degree of connectedness among contemporary groups,” in Proceedings of the 8th world congress on genetics applied to livestock production: 13–18 august 2006 (Belo Horizonte).
Sacarrão-Birrento, L., Ribeiro, D. M., Dittmann, A., Alves, S. P., Kunz, L., Silva, S., et al. (2024). The effect of the production system on the proteomics profiles of the Longissimus thoracis muscle in Arouquesa cattle. J. Proteomics 307, 105265. doi:10.1016/j.jprot.2024.105265
Sammad, A., Wang, Y. J., Umer, S., Lirong, H., Khan, I., Khan, A., et al. (2020). Nutritional physiology and biochemistry of dairy cattle under the influence of heat stress: consequences and opportunities. Animals 10, 793. doi:10.3390/ani10050793
Sargolzaei, M., Chesnais, J. P., and Schenkel, F. S. (2014). A new approach for efficient genotype imputation using information from relatives. BMC Genomics 15, 478. doi:10.1186/1471-2164-15-478
Schlessinger, J. (2000). Cell signaling by receptor tyrosine kinases. Cell 103, 211–225. doi:10.1016/s0092-8674(00)00114-8
Scita, G., and Di Fiore, P. P. (2010). The endocytic matrix. Nature 463, 464–473. doi:10.1038/nature08910
Seabury, C. M., Oldeschulte, D. L., Saatchi, M., Beever, J. E., Decker, J. E., Halley, Y. A., et al. (2017). Genome-wide association study for feed efficiency and growth traits in U.S. beef cattle. BMC Genomics 18, 386. doi:10.1186/s12864-017-3754-y
Serão, N. V. L., González-Peña, D., Beever, J. E., Bollero, G. A., Southey, B. R., Faulkner, D. B., et al. (2013). Bivariate genome-wide association analysis of the growth and intake components of feed efficiency. PloS One 8, e78530. doi:10.1371/journal.pone.0078530
Setoguchi, K., Watanabe, T., Weikard, R., Albrecht, E., Kühn, C., Kinoshita, A., et al. (2011). The SNP c.1326T>G in the non-SMC condensin i complex, subunit G (NCAPG) gene encoding a p.Ile442Met variant is associated with an increase in body frame size at puberty in cattle. Anim. Genet. 42, 650–655. doi:10.1111/j.1365-2052.2011.02196.x
Shabat, S. K. B., Sasson, G., Doron-Faigenboim, A., Durman, T., Yaacoby, S., Berg Miller, M. E., et al. (2016). Specific microbiome-dependent mechanisms underlie the energy harvest efficiency of ruminants. ISME J. 10, 2958–2972. doi:10.1038/ismej.2016.62
Silva, D. O., Fernandes, G. A., Fonseca, L. F. S., Mota, L. F. M., Bresolin, T., Carvalheiro, R., et al. (2024). Genome-wide association study for stayability at different calvings in Nellore beef cattle. BMC Genomics 25, 93. doi:10.1186/s12864-024-10020-y
Silva Neto, J. B., Mota, L. F. M., Amorim, S. T., Peripolli, E., Brito, L. F., Magnabosco, C. U., et al. (2023). Genotype-by-environment interactions for feed efficiency traits in Nellore cattle based on bi-trait reaction norm models. Genet. Sel. Evol. 55, 93–12. doi:10.1186/s12711-023-00867-2
Silva Neto, J. B., Mota, L. F. M., Londoño-Gil, M., Schmidt, P. I., Rodrigues, G. R. D., Ligori, V. A., et al. (2024). Genotype-by-environment interactions in beef and dairy cattle populations: a review of methodologies and perspectives on research and applications. Anim. Genet. 55, 871–892. doi:10.1111/age.13483
Singh, M. K., Shin, Y., Ju, S., Han, S., Choe, W., Yoon, K. S., et al. (2024). Heat shock response and heat shock proteins: current understanding and future opportunities in human diseases. Int. J. Mol. Sci. 25, 4209. doi:10.3390/ijms25084209
Smith, B. J. (2007). boa: an R package for MCMC Output convergence assessment and posterior inference. J. Stat. Softw. 21, 1–37. doi:10.18637/jss.v021.i11
Song, H., Dong, T., Wang, W., Yan, X., Geng, C., Bai, S., et al. (2024). GWAS enhances genomic prediction accuracy of caviar yield, caviar color and body weight traits in sturgeons using whole-genome sequencing data. Int. J. Mol. Sci. 25, 9756. doi:10.3390/ijms25179756
Song, Y. B., An, Y. R., Kim, S. J., Park, H. W., Jung, J. W., Kyung, J. S., et al. (2012). Lipid metabolic effect of Korean red ginseng extract in mice fed on a high-fat diet. J. Sci. Food Agric. 92, 388–396. doi:10.1002/jsfa.4589
Srivastava, S., Srikanth, K., Won, S., Son, J. H., Park, J. E., Park, W., et al. (2020). Haplotype-based genome-wide association study and identification of candidate genes associated with carcass traits in Hanwoo cattle. Genes 11, 551. doi:10.3390/genes11050551
Strandén, I., and Garrick, D. J. (2009). Technical note: derivation of equivalent computing algorithms for genomic predictions and reliabilities of animal merit. J. Dairy Sci. 92, 2971–2975. doi:10.3168/jds.2008-1929
Suárez-Mesa, R., Ros-Freixedes, R., Pena, R. N., Reixach, J., and Estany, J. (2024). Impact of the leptin receptor gene on pig performance and quality traits. Sci. Rep. 14, 10652. doi:10.1038/s41598-024-61509-1
Swanson, K., and Miller, S. (2008). Factors regulating feed efficiency and nutrient utilization in beef cattle. 419–441. doi:10.1079/9781845933548.0419
Szklarczyk, D., Franceschini, A., Wyder, S., Forslund, K., Heller, D., Huerta-Cepas, J., et al. (2015). STRING v10: protein-protein interaction networks, integrated over the tree of life. Nucleic Acids Res. 43, 447–452. doi:10.1093/nar/gku1003
Taiwo, G., Idowu, M. D., Wilson, M., Pech-Cervantes, A., Estrada-Reyes, Z. M., and Ogunade, I. M. (2022). Residual feed intake in beef cattle is associated with differences in hepatic mRNA expression of fatty acid, amino acid, and mitochondrial energy metabolism genes. Front. Animal Sci. 3, 828591. doi:10.3389/fanim.2022.828591
Takasuga, A. (2015). PLAG1 and NCAPG-LCORL in livestock. Animal Sci. J. 87, 159–167. doi:10.1111/asj.12417
Terakado, A. P. N., Costa, R. B., De Camargo, G. M. F., Irano, N., Bresolin, T., Takada, L., et al. (2018). Genome-wide association study for growth traits in Nelore cattle. Animal 12, 1358–1362. doi:10.1017/S1751731117003068
Tian, F., Hu, X. L., Yao, T., Yang, X., Chen, J. G., Lu, M. Z., et al. (2021). Recent advances in the roles of HSFs and HSPs in heat stress response in woody plants. Front. Plant Sci. 12, 704905. doi:10.3389/fpls.2021.704905
Tokach, M. D., Goodband, B. D., and O’Quinn, T. G. (2016). Performance-enhancing technologies in swine production. Anim. Front. 6, 15–21. doi:10.2527/af.2016-0039
Toschi, P., and Baratta, M. (2021). Ruminant placental adaptation in early maternal undernutrition: an overview. Front. Veterinary Sci. 8, 755034. doi:10.3389/fvets.2021.755034
Utsunomiya, Y. T., do Carmo, A. S., Carvalheiro, R., Neves, H. H. R., Matos, M. C., Zavarez, L. B., et al. (2013). Genome-wide association study for birth weight in Nellore cattle points to previously described orthologous genes affecting human and bovine height. BMC Genet. 14, 52–12. doi:10.1186/1471-2156-14-52
VanRaden, P. M. (2008). Efficient methods to compute genomic predictions. J. dairy Sci. 91, 4414–4423. doi:10.3168/jds.2007-0980
VanRaden, P. M., Van Tassell, C. P., Wiggans, G. R., Sonstegard, T. S., Schnabel, R. D., Taylor, J. F., et al. (2009). Invited review: reliability of genomic predictions for north American Holstein bulls. J. Dairy Sci. 92, 16–24. doi:10.3168/jds.2008-1514
Wang, H., Misztal, I., Aguilar, I., Legarra, A., and Muir, W. M. (2012). Genome-wide association mapping including phenotypes from relatives without genotypes. Genet. Res. 94, 73–83. doi:10.1017/S0016672312000274
Wang, T., Ma, X., Feng, F., Zheng, F., Zheng, Q., Zhang, J., et al. (2024). Study on single Nucleotide polymorphism of LAP3 gene and its correlation with dairy quality traits of gannan Yak. Foods 13, 2953. doi:10.3390/foods13182953
Wang, Y., Li, G., Mao, F., Li, X., Liu, Q., Chen, L., et al. (2014). Ras-induced epigenetic inactivation of the RRAD (Ras-related associated with diabetes) gene promotes glucose uptake in a human ovarian cancer model. J. Biol. Chem. 289, 14225–14238. doi:10.1074/jbc.M113.527671
Wang, Y., Zeng, F., Zhao, Z., He, L., He, X., Pang, H., et al. (2023). Transmembrane protein 68 functions as an MGAT and DGAT enzyme for triacylglycerol biosynthesis. Int. J. Mol. Sci. 24, 2012. doi:10.3390/ijms24032012
Watts, C., and Marsh, M. (1992). Endocytosis: what goes in and how? J. Cell Sci. 103, 1–8. doi:10.1242/jcs.103.1.1a
Werner, H. (2023). The IGF1 signaling pathway: from basic concepts to therapeutic opportunities. Int. J. Mol. Sci. 24, 14882. doi:10.3390/ijms241914882
Wu, Y., Zhang, S., Xu, Q., Zou, H., Zhou, W., Cai, F., et al. (2016). Regulation of global gene expression and cell proliferation by APP. Sci. Rep. 6, 22460. doi:10.1038/srep22460
Xu, H., Li, H., Wang, Z., Abudureyimu, A., Yang, J., Cao, X., et al. (2020b). A deletion downstream of the CHCHD7 gene is associated with growth traits in sheep. Animals 10, 1472. doi:10.3390/ani10091472
Xu, P., Ni, L., Tao, Y., Ma, Z., Hu, T., Zhao, X., et al. (2020a). Genome-wide association study for growth and fatness traits in Chinese Sujiang pigs. Anim. Genet. 51, 314–318. doi:10.1111/age.12899
Yan, Q., Du, Y., Huang, F., Zhang, Q., Zhan, M., Wu, J., et al. (2024). Identification of mitochondria-related genes as diagnostic biomarkers for diabetic nephropathy and their correlation with immune infiltration: new insights from bioinformatics analysis. Int. Immunopharmacol. 142, 113114. doi:10.1016/j.intimp.2024.113114
Yang, C., Huang, Z., Pan, C., and Wang, S. (2023). Characterization of feed efficiency-related key signatures molecular in different cattle breeds. PLOS ONE 18, e0289939. doi:10.1371/journal.pone.0289939
Yang, C., Zhang, J., Ahmad, A. A., Bao, P., Guo, X., Long, R., et al. (2019). Dietary energy levels affect growth performance through growth hormone and insulin-like growth factor 1 in Yak (Bos grunniens). Animals 9, 39. doi:10.3390/ani9020039
Yang, C., Zhu, Y., Ding, Y., Huang, Z., Dan, X., Shi, Y., et al. (2022). Identifying the key genes and functional enrichment pathways associated with feed efficiency in cattle. Gene 807, 145934. doi:10.1016/j.gene.2021.145934
Yao, H., Liu, C., Lin, D., Liu, S., Lin, Z., and Dong, Y. (2019). Polymorphisms of LAP3 gene and their association with the growth traits in the razor clam Sinonovacula constricta. Mol. Biol. Rep. 47, 1257–1264. doi:10.1007/s11033-019-05231-6
Yao, H., Ren, F., Bao, Y., Dong, Y., and Lin, Z. (2021). Molecular characterization and expression of the lap3 gene and its association with growth traits in the blood clam tegillarca granosa. Fishes 6, 54. doi:10.3390/fishes6040054
Yin, L., Zhang, H., Tang, Z., Xu, J., Yin, D., Zhang, Z., et al. (2021). rMVP: a memory-efficient, visualization-enhanced, and parallel-accelerated tool for genome-wide association study. Genomics Proteomics Bioinforma. 19, 619–628. doi:10.1016/j.gpb.2020.10.007
Yu, J. Z., Zhou, J., Yang, F. X., Hao, J. P., Hou, Z. C., and Zhu, F. (2024). Genome-wide association analysis identifies candidate genes for carcass yields in Peking ducks. Anim. Genet. 55, 833–837. doi:10.1111/age.13480
Yue, J., and López, J. M. (2020). Understanding MAPK signaling pathways in apoptosis. Int. J. Mol. Sci. 21, 2346. doi:10.3390/ijms21072346
Zeineldin, M., Barakat, R., Elolimy, A., Salem, A. Z. M., Elghandour, M. M. Y., and Monroy, J. C. (2018). Synergetic action between the rumen microbiota and bovine health. Microb. Pathog. 124 (May), 106–115. doi:10.1016/j.micpath.2018.08.038
Zeng, F., Heier, C., Yu, Q., Peng, H., Huang, F., Zhao, Z., et al. (2024). Human transmembrane protein 68 links triacylglycerol synthesis to membrane lipid homeostasis. bioRxiv. doi:10.1101/2024.04.14.589399
Zhang, L., Hernandez-Sanchez, D., and Herzog, H. (2019). Regulation of feeding-related behaviors by arcuate neuropeptide Y neurons. Endocrinology 160, 1411–1420. doi:10.1210/en.2019-00056
Zhang, W., Li, J., Guo, Y., Zhang, L., Xu, L., Gao, X., et al. (2016). Multi-strategy genome-wide association studies identify the DCAF16-NCAPG region as a susceptibility locus for average daily gain in cattle. Sci. Rep. 6, 38073. doi:10.1038/srep38073
Zhang, W., Thompson, B. J., Hietakangas, V., and Cohen, S. M. (2011). MAPK/ERK signaling regulates insulin sensitivity to control glucose metabolism in Drosophila. PLoS Genet. 7, e1002429. doi:10.1371/journal.pgen.1002429
Zhang, Y., Yu, H., Zhang, J., Gao, H., Wang, S., Li, S., et al. (2021). Cul4A-DDB1–mediated monoubiquitination of phosphoglycerate dehydrogenase promotes colorectal cancer metastasis via increased S-adenosylmethionine. J. Clin. Investigation 131, e146187. doi:10.1172/JCI146187
Zhang, Z., Yang, P., He, P., Xu, J., Lyu, S., Liu, X., et al. (2022). Distribution and association study of PLAG1 gene between copy number variation and Chinese cattle populations. Anim. Biotechnol. 33, 273–278. doi:10.1080/10495398.2020.1793769
Zhao, X., Zhang, Y., Rahman, A., Chen, M., Li, N., Wu, T., et al. (2024). Rumen microbiota succession throughout the perinatal period and its association with postpartum production traits in dairy cows: a review. Anim. Nutr. 18, 17–26. doi:10.1016/j.aninu.2024.04.013
Zhu, J., and Thompson, C. B. (2019). Metabolic regulation of cell growth and proliferation. Nat. Rev. Mol. Cell Biol. 20, 436–450. doi:10.1038/s41580-019-0123-5
Keywords: Bos indicus, beef cattle, dry matter intake, GWAS, residual feed intake, regulatory pathways
Citation: Silva Neto JB, Brito LF, Mota LFM, Magnabosco CU and Baldi F (2025) Genome-wide association study for feed efficiency indicator traits in Nellore cattle considering genotype-by-environment interactions. Front. Genet. 16:1539056. doi: 10.3389/fgene.2025.1539056
Received: 03 December 2024; Accepted: 05 May 2025;
Published: 02 June 2025.
Edited by:
Xiao-Lin Wu, Council on Dairy Cattle Breeding, United StatesReviewed by:
Tara G. McDaneld, Agricultural Research Service (USDA), United StatesJuliana Petrini, Clinica do Leite Ltda, Brazil
Copyright © 2025 Silva Neto, Brito, Mota, Magnabosco and Baldi. This is an open-access article distributed under the terms of the Creative Commons Attribution License (CC BY). The use, distribution or reproduction in other forums is permitted, provided the original author(s) and the copyright owner(s) are credited and that the original publication in this journal is cited, in accordance with accepted academic practice. No use, distribution or reproduction is permitted which does not comply with these terms.
*Correspondence: João B. Silva Neto, amIuc2lsdmEtbmV0b0B1bmVzcC5icg==