 Wei Zhang
 Yifu Zeng1
 Bihai Zhao
 Lei Wang
- 1College of Computer Science and Engineering, Changsha University, Changsha, Hunan, China
- 2Department of Information and Computing Science, College of Mathematics, Changsha University, Changsha, China
Long noncoding RNAs (lncRNAs) regulate physiological processes via interactions with macromolecules such as miRNAs, proteins, and genes, forming disease-associated regulatory networks. However, predicting lncRNA-disease associations remains challenging due to network complexity and isolated entities. Here, we propose MVIGCN, a graph convolutional network (GCN)-based method integrating multimodal data to predict these associations. Our framework constructs a heterogeneous network combining disease semantics, lncRNA similarity, and miRNA-lncRNA-disease interactions to address isolation issues. By modeling topological features and multiscale relationships through deep learning with attention mechanisms, MVIGCN prioritizes critical nodes and edges, enhancing prediction accuracy. Cross-validation demonstrated improved reliability over single-view methods, highlighting its potential to identify disease-related lncRNA biomarkers. This work advances network-based computational strategies for decoding lncRNA functions in disease biology and provides a scalable tool for prioritizing therapeutic targets.
1 Introduction
Recently, the rapid evolution of artificial intelligence has led to the widespread implementation of deep learning algorithms across various fields, such as computer vision, recommendation systems, and interdisciplinary areas such as bioinformatics (Guzman-Pando et al., 2024; Piroozmand et al., 2020; Zhou et al., 2023). In contrast to conventional machine learning techniques, deep learning frameworks are capable of constructing complex information propagation architectures that facilitate the effective interpretation of diverse data types, demonstrating superior learning and representation abilities. In the domain of relation prediction between lncRNAs and diseases, deep learning methodologies have been shown to surpass conventional approaches by more accurately extracting intricate and nuanced features. Recently, many deep learning-based methods, including autoencoders (AEs), CNNs, graph convolutional networks (GCNs), and GANs, have been extensively utilized for predicting relationships between lncRNAs and diseases (Jin et al., 2021; Ha et al., 2020; Chen et al., 2021).
Wu et al. introduced an algorithm termed GAMCLDA, which is based on the principles of graph encoder matrix completion (Wu et al., 2020). This model effectively incorporates a wide range of biological data. The initial feature vectors for lncRNAs and diseases are derived from association data linking lncRNAs to diseases, genes, and microRNAs (miRNAs). A multilayer perceptron (MLP) is subsequently employed to reduce the dimensionality of these initial input features. To obtain the relevant structural characteristics of the lncRNA‒disease association network, a GCN is utilized, yielding feature vectors for both diseases and lncRNAs. The inner product of these two vectors serves as the predictive value for lncRNA‒disease associations. This approach constitutes a supervised deep learning model, with its efficacy largely contingent on the formulation of the loss function. To address the imbalance in two kinds of samples in lncRNA‒disease associations, the authors incorporate a learnable weight parameter into the loss function.
Zhao et al. also proposed an algorithm called MHRWR based on RWR. This method first constructs a three-layer heterogeneous network of lncRNA-disease-gene, then uses random walk to extract network structural features, and finally predicts associations (Zhao et al., 2021). In addition, Lu et al. also proposed a method called SIMCLDA based on inductive matrix completion (Lu et al., 2018). This method uses the association vectors of lncRNA diseases to calculate the GIP similarity between vectors, calculates the functional similarity of diseases based on the association data of disease genes, and then constructs the feature vectors. PCA was then used to reduce the lncRNA and disease feature vector dimensions. Finally, the incidence matrix was reconstructed based on the induction matrix. In order to make full use of the structural information between lncRNAs disease association matrices, Lu et al. proposed a lncRNAs disease association prediction algorithm called GMCLDA (Lu et al., 2020). The algorithm first calculated the semantic similarity of diseases, the GIP similarity of lncRNAs and diseases, and the gene sequence similarity of lncRNAs. Then, the K-nearest neighbor (KNN) algorithm based on the sequence similarity of lncRNAs updates its correlation matrix, and finally, matrix completion is used to reconstruct its correlation matrix.
Xuan et al. constructed a lncRNA‒disease association prediction model that employs a two-way CNN with an attention mechanism, referred to as cnnlda (Xuan et al., 2019a). This network integrates various data types, including similarity data for lncRNAs and diseases, lncRNA‒disease association data, and their relationships with miRNAs. The model is bifurcated into two components: the first component utilizes a CNN to extract characteristics directly from node pairs, and the second component acknowledges that different components of node pair features among lncRNAs, miRNAs, and disease nodes contribute variably to association prediction. This component assigns weight values to distinct types of association features and feature components prior to the convolutional layer.
Additionally, Xuan et al. constructed a CNN-based method named ldapred (Xuan et al., 2019b). This method initially constructs feature vectors for diseases and lncRNAs on the basis of the functional similarity matrix of lncRNAs, the semantic association matrix of diseases, and the functional similarity matrix of miRNAs. These feature vectors are then linked and input into a wide CNN to predict the output value. To effectively capture the topological information within the network, this method employs the concept of information dissemination, which uses second-order similarity matrices and association matrices for lncRNAs, diseases, and miRNAs during the computation of initial features. Furthermore, the method incorporates a two-way convolutional neural network to enhance model performance.
Graph convolutional networks (GCNs) represent an important method for extracting structural features from graph data (Wang et al., 2024). In recent years, GCNs have found extensive applications in various domains, including node prediction, graph embedding representation, and graph classification. In the field of bioinformatics, GCNs are frequently employed for link prediction, because the regulatory relationships among biomacromolecules are often represented as structured graphs.
Xuan et al. introduced a disease association prediction model that integrates GCN and CNN techniques (Xuan et al., 2019c), termed GCNLDA. This method constructs heterogeneous graphs representing miRNA and lncRNA diseases, utilizing a GCN to extract topological features from these graphs to derive feature vectors for the nodes. A simple neural network is subsequently employed to predict the correlations between diseases and increases. Additionally, the model leverages a CNN to capture the characteristics of node pairs for correlation prediction, fusing the prediction scores through a weighted approach.
Furthermore, acknowledging the varying contributions of distinct subgraphs within heterogeneous graphs to the prediction process, Zhao et al. proposed a meta-path-based disease association prediction model for lncRNAs, referred to as Heated (Zhao et al., 2022). This model segments the lncRNA‒disease heterogeneous network into five subgraphs: disease‒lncRNA‒disease, lncRNA‒disease, lncRNA‒disease‒lncRNA, lncRNA‒disease‒lncRNA, and lncRNA‒disease. Feature vectors are derived from these five subgraphs via a graph attention network (GAT) (Dai et al., 2022), and weighted values are utilized to integrate the feature vectors corresponding to different lncRNAs and diseases. The model concludes by employing a neural network matrix completion algorithm to predict the association matrix.
Moreover, several researchers have achieved enhanced prediction outcomes by integrating machine learning models with deep learning frameworks. Jihwan Ha et al. provided a framework based on deep neural networks for predicting miRNA-disease associations (NCMD) known as Neural Collaborative Filtering based on node2vec. NCMD leverages node2vec to learn low-dimensional vector representations of miRNAs and diseases. It utilizes a deep learning framework that combines the linear capability of generalized matrix factorization with the nonlinear capability of multilayer perceptrons (Ha and Park, 2023). By applying a recommendation algorithm with miRNA and disease similarity constraints, Jihwan Ha et al. proposed a simple yet effective computational framework (SMAP) to identify associations between miRNAs and diseases. It measures comprehensive and accurate similarity values based on miRNA functional similarity, disease semantic similarity, and Gaussian Interaction Profile Kernel similarity. SMAP not only utilizes known miRNA-disease associations to construct a matrix factorization model but also incorporates the integrated similarity between miRNAs and diseases (Ha, 2023). Sheng et al. constructed an association prediction model named VADLP (Sheng et al., 2021), which constructs a heterogeneous network encompassing lncRNAs, diseases, and miRNAs. VADLP extracts network topology features of node pairs through a random walk algorithm and derives distribution features on the basis of a CNN encoder and variational autoencoder. These features are then adaptively fused to predict lncRNA‒disease relationships. Wu et al. introduced a prediction method based on random forests, termed GEAR (Wu et al., 2021). This model initially acquires feature representations of network nodes from the lncRNA–disease–miRNA heterogeneous network via a graph autoencoder, subsequently concatenating lncRNA and disease features to form node pair features. A random forest is then employed to investigate the potential associations between lncRNAs and disease. LAN et al. constructed a lncRNA‒disease relation prediction model utilizing a graph attention network, referred to as GANLDA (Lan et al., 2022). This approach inputs association vectors of increases, diseases, and genes, applies the principal component analysis (PCA) method (Zhang and Castelló, 2017) for dimensionality reduction, and utilizes the GAT to extract potential disease vectors, predicting correlations through a multilayer perceptron.
These studies collectively demonstrate the trend of combining graph-based structural analysis (GCN, GAT, random walks) with deep learning techniques (CNN, MLP, matrix completion) and multi-modal data fusion (functional similarities, semantic associations, sequence data). They increasingly focus on addressing data imbalance, enhancing feature representation through attention mechanisms, and improving prediction accuracy by exploiting heterogeneous network topologies and multi-source biological data integration.This paper proposes a graph convolutional network (GCN)-based method for predicting lncRNA-disease associations, grounded in the regulatory networks of biomolecules and diseases. Given that microRNAs (miRNAs) and long non-coding RNAs (lncRNAs) often cooperatively regulate gene expression, we construct a heterogeneous lncRNA-miRNA-disease interaction network. Furthermore, to address the issue of isolated diseases and lncRNAs lacking contextual relationships, we integrate disease semantic similarity networks and lncRNA similarity networks into the heterogeneous framework. Our contribution is a novel lncRNA-disease association prediction model called MVIGCN, which combines multi-view data sources with graph deep learning enhanced by attention mechanisms. This approach synergizes structural features extracted from the heterogeneous network with attention-weighted feature fusion, enabling more accurate and interpretable predictions of lncRNA-disease correlations.
2 Methods
The framework of the MVIGCN model has been introduced. Next, the details of the model, calculation methods, and loss functions are introduced one by one.
MVIGCN model is a neural network model of codec structure, as shown in Figure 1, which mainly includes two parts: encoder part and decoder part. In this paper, the encoder was used to extract biological network features, eliminate data noise, and reduce feature dimensions, and the decoder was used to predict lncRNA disease association. The encoder is divided into two parts in the model, as shown in Figure 1. The node embedding vectors of two different graphs were learned separately. Specifically, the upper part of the encoder was learned by the node features of the graph convolutional neural network layer, and the lower part also used the node features of the graph convolutional neural network layer to learn the node features. The decoder part predicts the lncRNA disease association probability based on the latent features of the nodes.
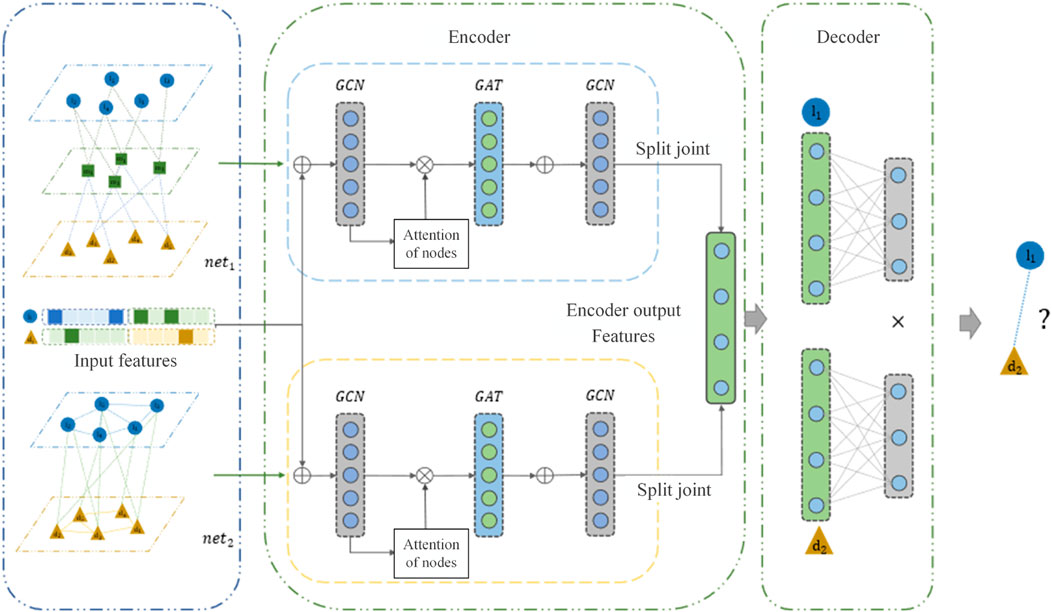
Figure 1. Diagram of the MVIGCN model structure.
2.1 Initial eigenvector construction
In this work, first, on the basis of the lncRNA‒miRNA association matrix, a three-layer heterogeneity map of lncRNA‒miRNA–disease (
Figure 2 shows the construction method of the initial input eigenvectors of

Figure 2. LncRNA and initial input eigenvectors of diseases.
2.2 Graph convolution neural networks
The conventional convolutional neural network (GNN) has demonstrated considerable efficacy in image processing and various other domains, effectively capturing informative features by extracting structured data, such as images and text (Sarıgül et al., 2019). However, unstructured data are prevalent across numerous fields, including social relationship mapping, citation analysis, and chemical molecular structure representation. Traditional convolutional operations require that data be translation invariant, a criterion that unstructured data often fail to satisfy. In this context, the degree of each node within a graph and the interconnections among nodes exhibit significant variability. To address these challenges, (Bianchi et al., 2022) introduced the graph convolutional network (GCN), a deep learning algorithm designed for graph data that employs convolutional operations tailored to graph structures. The GCN typically uses the graph as input to derive the eigenvectors of individual nodes by integrating the eigenvectors of neighbouring nodes as well as the topological information of the graph. Recently, GCNs have been applied extensively in areas such as text classification, recommendation systems (Kejani et al., 2020), and relationship extraction.
The methodologies associated with GCNs can markedly improve the performance of web-based predictive tasks, including drug‒disease correlation prediction, user‒item correlation prediction, and miRNA‒disease correlation prediction. The GCN is capable of aggregating information from adjacent nodes, resulting in similar eigenvectors for these nodes. By stacking multiple layers of the CNN, the model is able to learn higher-order associations among nodes, therefore capturing the topological characteristics of the graph.
Next, we use the lncRNA disease association network (
where
The eigendecomposition of the
where
where
Nevertheless, Equation 6 has two significant limitations. First, in the context of large networks, the computation of the eigenvector and eigenvalue matrices is resource intensive. Second, the representation of each node by a singular scalar feature is inadequate for capturing the intricate and nuanced relationships among nodes. To address the first issue, Zhang et al. employed the first-order Chebyshev polynomial to approximate the filter (Zhang et al., 2024), subsequently reformulating Equation 6 as shown in Equation 7:
To enable nodes to retain their characteristics during feature propagation, the method adds node self-connected edges in
Equation 8 is a feedforward linear neural network. To enhance the expression property of the model, the nonlinear activation function and offset matrix are introduced in this paper. The graph convolution calculation method in this paper is as shown in Equation 9:
where
As shown in Figure 3, this paper uses a GCN to extract the features of
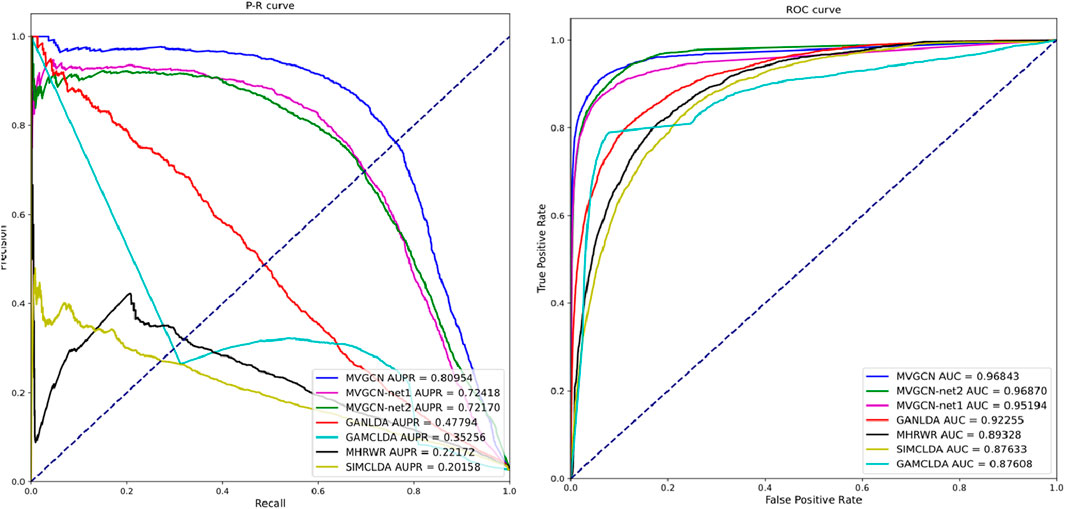
Figure 3. ROC curve and P-R curve of MVIGCN model and comparison model.
2.3 Graph attention network
Recently, attention mechanism-based deep learning models have received extensive attention. The attention mechanism is often applied in sequence tasks, which allows models to focus on key parts of the input. For example, in a machine reading task based on a recursive neural network (RNN), the model employs an attention mechanism to extract the key features of sentences and improve their sentence representation learning ability. Chan TH et al. applied the attention mechanism to graph node-embedded learning and then calculated a reasonable feature representation of nodes. This model is referred to as the GAT (Chan et al., 2024). The GAT, which can be considered an extension of the GCN, assigns different weights to neighbours through the self-attention layer and combines the features of neighbours. This operation can filter the noise in the network, concentrate on the more important correlation, and then extract the graph structure features effectively. Recently, the GAT has attracted widespread attention in the fields of node classification, social impact analysis, and recommendation systems because of its powerful graph feature extraction capability.
Given a node, the GAT needs to calculate the importance of its neighbours. Using node
In the formula,
where
where
As shown in Figure 3, after the GCN layer, the MVIGCN model introduces the above GAT layer to update the node feature representation. The GAT uses
The two potential eigenvector matrices are spliced to obtain the encoder output
where
2.4 Bilinear decoder
The MVIGCN model uses a bilinear decoder to reconstruct the association. The calculation formula is as shown in Equations 16, 17:
where
In association prediction model training, known associations are usually regarded as positive samples, whereas unknown associations are regarded as negative samples. However, in most cases, the relationship between lncRNAs and disease is unknown. The number of positive samples in training is far greater than the number of negative samples in training, and the data of positive samples and negative samples are extremely unbalanced. The model tends to predict all the correlation values as 0 so that a lower loss value can be obtained. However, the model cannot effectively distinguish positive samples. A cost-sensitive neural network was applied to address this issue (Zhang et al., 2019). The cost-sensitive loss function has been widely used in unbalanced learning. The modified reconstruction error loss function is as shown in Equation 18:
where
In the training of a deep learning model, it is usually assumed that the training and test sets have the same distribution and that the model is trained in the training set space. However, sometimes, the distributions of the two sets are not the same. If the model is overfitted on the training set, its performance on the test set will be reduced. To increase the generalizability, regularization terms are usually added to the loss function. The parameters
Therefore, the total loss
This research employs the Adam optimizer to train the MVIGCN model.
3 Results
3.1 Performance assessment of the MVIGCN model
This study employs a 50 percent cross-validation methodology to assess the properties of the model. The dataset, comprising both types of samples, is randomly partitioned into five subsets. One subset is designated as the test set, while the remaining subsets are designated as the training set. The model is trained on the training set, and its performance is subsequently evaluated on the test set. The evaluation outcomes from the test set are then aggregated to form a comprehensive dataset, and the predictive results are analyzed using various evaluation metrics, such as the TPR (true positive rate), FPR (false positive rate), Precision (precision), and Recall (recall rate) (Chen et al., 2021). The parameters involved in the model are set as follows:
Furthermore, this research compares the proposed model against several existing models, including GAMCLDA (Mishra et al., 2020), which is predicated on graph convolutional neural networks and matrix decomposition; GANLDA (Li et al., 2021), which uses a graph attention network; MHRWR (Zhao et al., 2021), which is based on random walk principles; and SIMCLDA (Lu et al., 2018), which is founded on matrix completion. To further substantiate the impact of the multiview characteristics on the association prediction model, the study incorporates relevant ablation experiments. The MVIGCN-net1 model uses only the lncRNA‒miRNA–disease heterogeneous network for prediction, whereas the MVIGCN-net2 model relies on the association network. The ablation experimental model employs the same graph deep learning network architecture as the MVIGCN to learn lncRNA‒disease associations. The results from both the comparative analysis and the ablation experiments are presented in Table 1. Additionally, ROC and PR curves are generated to show the differences in predictive performance among the models.
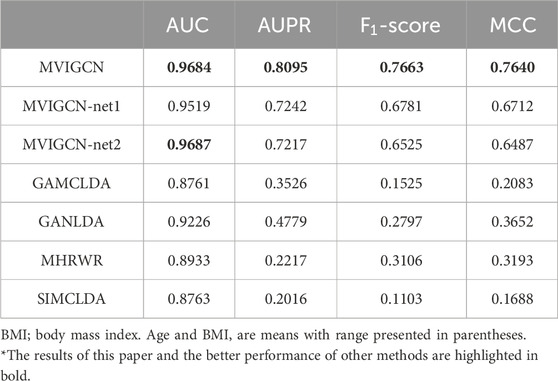
Table 1. Experimental results of MVIGCN model and comparison model.
As shown in Table 1 and Figure 3, the MVIGCN model presented in this study outperforms the four other correlation prediction models. Furthermore, the results of the experiment underscore the importance of the multiview approach utilized by the MVIGCN model. The data indicate that the AUC value for the MVIGCN model is 0.96843, which markedly exceeds the values of GANLDA (0.92255), MHRWR (0.89328), SIMCLDA (0.87633), and GAMCLDA (0.87633). In terms of the recall and accuracy rates, the recall rate serves as an indicator of the capacity of the model to predict positive samples, whereas the accuracy rate reflects the reliability of the model in predicting these samples. An effective model typically maximizes both the number of accurately predicted positive samples and the accuracy of those predictions; however, these two metrics cannot be optimized simultaneously. The AUPR and score serve as comprehensive metrics for evaluating both parameters concurrently. The AUPR value for the MVIGCN model is 0.80954, significantly surpassing the values of GANLDA (0.47794), GAMCLDA (0.35256), MHRWR (0.22172), and SIMCLDA (0.20158). Additionally, the score of the MVIGCN model is considerably higher than those of the other four models, indicating its robust performance on imbalanced datasets. With respect to the MCC evaluation index, the MVIGCN model outperforms all other models, highlighting its substantial advantages in predicting these associations.
In the ablation experiment, the MVIGCN model exhibited notable performance enhancements compared with MVIGCN-net1 and MVIGCN-net2, with the multiview fusion model demonstrating superior results across the AUC, AUPR, MCC, and other metrics. As depicted in Figure 1, the AUC value for the MVIGCN model is 0.9684, showing no significant improvement relative to MVIGCN-net1 (0.9519) and MVIGCN-net2 (0.9687). However, for the other metrics, the AUPR values for MVIGCN-net1 and MVIGCN-net2 are 0.7242 and 0.7217, respectively, while their scores are 0.6781 and 0.6525, and their MCC scores are 0.6712 and 0.6487, respectively, which are inferior to the performance of the MVIGCN model. These findings indicate that the constructed prediction model, which is based on multiple related data sources, plays a key role in improving the predictive efficacy of the model and addressing the challenges posed by imbalanced samples.The ablation experiments demonstrate that:Feature alignment and cross-view attention are critical for leveraging multi-view heterogeneity.Graph convolutional layers are indispensable for modeling biological network topology.Noisy views can be mitigated through learned attention, highlighting the model’s robustness.This analysis not only validates the MVIGCN’s design but also provides actionable insights for improving similar architectures in complex graph-based tasks.
The recall rate serves as an indicator of the capacity of a model to predict potential correlations and is a critical metric in secondary classification tasks. Importantly, the recall rate can fluctuate significantly across different probability thresholds. Moreover, establishing a consistent and appropriate threshold for calculating the recall rate across various correlation prediction models complicates the effective assessment of predictive performance differences among these models. Consequently, this study employs varying thresholds to compute the recall rate for the models being considered. The methodology involves designating the first k long noncoding RNAs (lncRNAs) associated with each disease as positive samples, while the remaining samples are classified as negative samples, facilitating the calculation of the overall recall rate. The findings are shown in Figure 4. The results indicate that the MVIGCN model is consistently superior to the other models across different values of k. When k is 30, 90, 150, and 210, the MVIGCN model achieves predicted recall rates of 71.15%, 89.54%, 96.55%, and 98.96%, respectively. In comparison, the MHRWR model yields top-k recall rates of 32.22%, 52.76%, 80.42%, and 99.00%; the GANLDA model yields recall rates of 47.87%, 76.94%, 94.55%, and 98.89%; the SIMACLDA model presents rates of 41.49%, 74.34%, 94.59%, and 99.90%; and the GAMCLDA model achieves top-k recall rates of 44.61%, 79.09%, 91.99%, and 97.74%. These experimental results indicate that the MVIGCN model is better able to identify associations between potential lncRNAs and diseases than the other models evaluated.
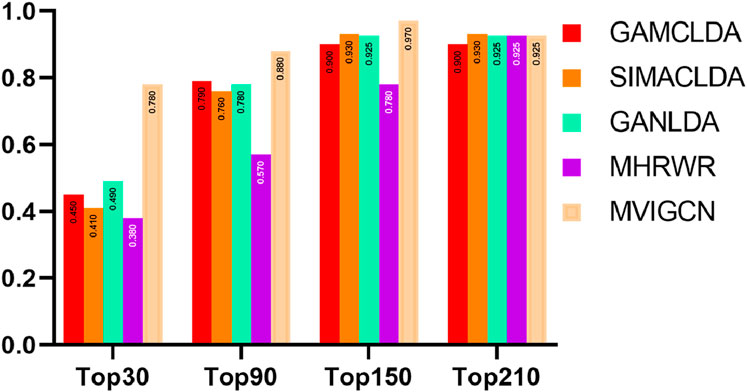
Figure 4. Top-k recall rate of MVIGCN model and comparison model.
3.2 Case study
To investigate the capacity of the MVIGCN model to recognize the associations between lncRNAs and diseases in detail, this study designed relevant case study experiments. Within the dataset, all known associations are classified as positive samples, whereas all unknown relationships are treated as candidate associations. The analysis of these candidate associations ascertain whether the model can successfully identify previously unknown associations. This study focuses on several prevalent diseases, including breast cancer, liver cancer, and kidney cancer, as subjects for case studies. The methodological approach is as follows: initially, the model predicts all unknown associations. For example, under conditions of breast cancer, the correlation scores between candidate lncRNAs and breast cancer are ranked from highest to lowest. The top 20 lncRNAs were then validated against relevant databases and studies, which demonstrated that the candidate lncRNA‒disease associations predicted by the model provide valuable insights for guiding biological wet laboratory experiments.
The lncRNA–disease relationship data utilized in this research are sourced from LncRNADisease and Lnc2Cancer, as detailed in the supplement document, encompassing 2,697 relationships among 240 lncRNAs and 412 diseases. The remaining 96,183 unknown relations are considered candidate samples. In the process of validating candidate associations, this study sought relevant experimental evidence from Lnc2Cancer 3.0 and MNDR v3.1. In instances where pertinent data are not available in these three databases, the study then uses the National Center for Biotechnology Information (NCBI) database to obtain the results. Three diseases—breast cancer, lung cancer, and cervical cancer—were selected as the focus of the case studies. The subsequent sections analyse and present the findings from the case studies pertaining to these three diseases.
Breast cancer is the most prevalent malignancy among women and poses a significant threat to their health and wellbeing. Even when sex is not considered, breast cancer remains the second most common type of cancer following lung cancer; however, owing to its better prognosis, it ranks fifth in terms of the key cause of cancer-related mortality. In less developed regions, breast cancer is a typical cancer, with incidence rates significantly exceeding those in developed areas. Recent research has highlighted the critical role of lncRNAs in the onset and development of various diseases. For example, Zhang et al. (2024) reported that LINC00963 is related to the metastasis and development of breast cancer cells. Silencing LINC00963 expression has been shown to inhibit breast cancer progression. Furthermore, Zhang et al. (2024) demonstrated that knockout of the ACK1 gene diminishes the capacity of LINC00963 to promote breast tumour growth. These findings indicate that LINC00963 inhibits ACK1 activity by downregulating miR-324-3p expression, facilitating the development and metastasis of breast cancer. Consequently, LINC00963 may serve as a promising therapeutic target for breast cancer therapy.
Table 2 shows the results of the association verification for the top 20 candidate lncRNAs identified by the MVICGN model in the context of breast cancer. The findings indicate that 17 out of the 20 candidate lncRNAs have been validated by existing databases. Notably, SNHG1 has been identified as a significant regulator that facilitates tumorigenesis, and its expression levels are markedly elevated in breast cancer cells. Research conducted by Xiong et al. demonstrated that SNHG1 suppresses the expression of associated normal mRNAs and proteins in breast cancer cells through its interaction with miR-573 and simultaneously promotes the expression of relevant cyclins (Xiong et al., 2020). These observations imply that SNHG1 can be considered a promising target for intervention and prognostic assessment in breast cancer.
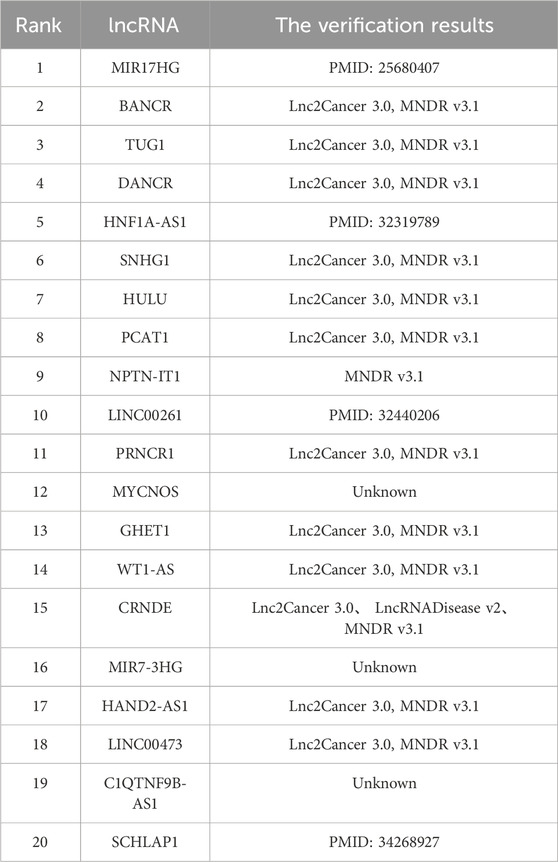
Table 2. Validation results of MVIGCN in predicting the top 20 candidate lncRNAs in breast cancer.
Lung cancer represents the most prevalent and lethal form of cancer worldwide. Among its various types, NSCLC constitutes the majority, accounting for 85% of newly diagnosed lung cancer patients. This subtype is highly resistant to chemotherapy, resulting in poor prognoses for affected patients after treatment. LncRNAs are key regulators of the pathogenesis and progression of lung cancer. Research conducted by Tong et al. has demonstrated that the lncRNA CASC11 and the gene CDK1 are markedly overexpressed in lung cancer tissues, whereas microRNA-302 levels are decreased in these tissues. Experimental evidence suggests that CASC11 facilitates the progression of lung cancer by interacting with microRNA-302, increasing the expression of CDK1 (Tong et al., 2019).
Table 3 presents the top 20 candidate lncRNAs associated with lung cancer, as predicted by the MVIGCN model. The findings indicate that 17 out of the 20 candidate lncRNAs were corroborated by existing databases. For example, the candidate lncRNA HULC has been shown in various studies to be significantly elevated in the serum of lung cancer patients, with its concentration increasing in correlation with cancer progression. Research has indicated that the lncRNA HULC facilitates the expression of SPHK1, which accelerates the proliferation of NSCLC cells but inhibits their apoptosis. Furthermore, Jin et al. identified ZEB1-AS1 as a candidate lncRNA, ZEB1-AS1, with clinical therapeutic and prognostic significance for NSCLC patients (Jin et al., 2019). Investigations revealed that ZEB1-AS1 contributes to carcinogenesis by downregulating the expression of the ID1 gene in NSCLC cells. These results indicate that ZEB1-AS1 is a promising therapeutic target for NSCLC. Notably, the MVIGCN model also identified three previously unrecognized potential lncRNAs—NALT1, MIR100HG, and PISRT1—offering avenues for validation through biological wet experiments.
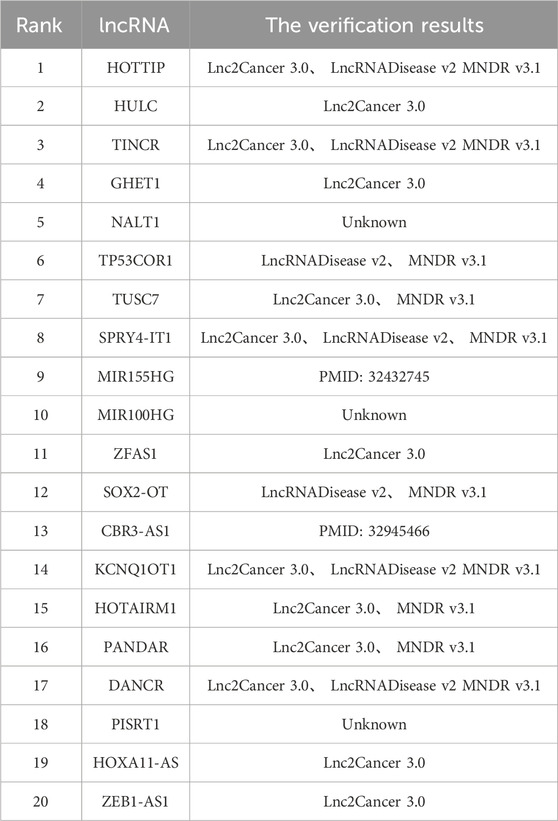
Table 3. Validation results of MVIGCN in predicting the top 20 candidate lncRNA in lung cancer.
Cervical cancer ranks among the most prevalent gynaecological malignancies, which justifies its selection as the focus of the third case study. The findings are presented in Table 4. Among the top 20 candidate lncRNAs related to cervical cancer, 14 predictive relationships were identified. For example, research conducted by Zhu et al. revealed that the mRNA expression of the candidate lncRNA CDKN2B-AS1 was significantly upregulated in cervical cancer cells, whereas the expression of miR-181a-5p was notably downregulated in cervical cancer cells. Subsequent experiments demonstrated that CDKN2B-AS1 facilitates cervical cancer cell proliferation but inhibits their senescence. This body of research indicates that CDKN2B-AS1 has a key role in disease onset and development through its interaction with miR-181a-5p. Additionally, investigations by Shen et al. revealed that the expression level of the candidate lncRNA MIR155HG was markedly elevated in cervical cancer tissues compared with normal cervical tissues. Notably, knockout of the MIR155HG gene resulted in the inhibition of cervical cancer cell proliferation, suggesting that MIR155HG is involved in the pathogenesis of cervical cancer and may serve as a valuable therapeutic target (Shen et al., 2020).
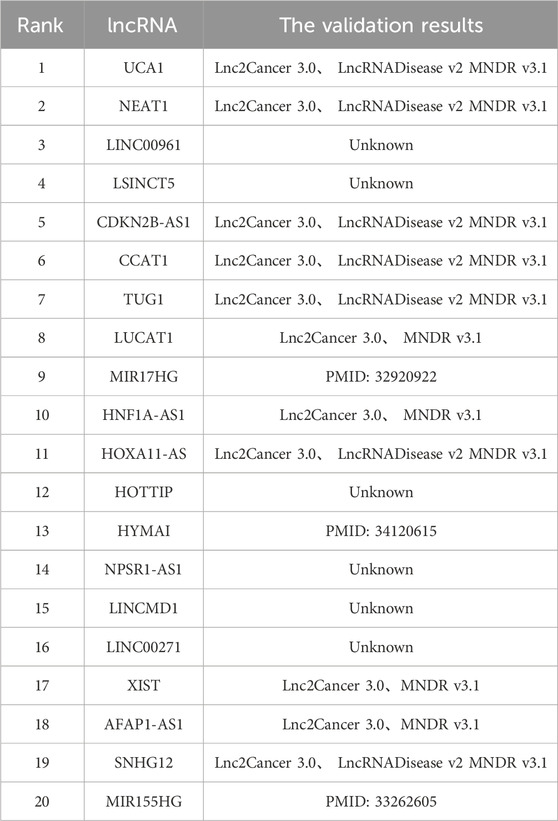
Table 4. Validation results of MVIGCN in predicting the top 20 candidate lncRNA in cervical cancer.
4 Conclusion
This research presents the MVIGCN model to predict the relationships between lncRNAs and diseases. Initially, we provide an overview of the dataset utilized in this model. Subsequently, we detail the methodology for constructing the lncRNA-related network, with various approaches for calculating similarities between lncRNAs and diseases. We elaborate on the construction of the input feature vector of the model, the computation methods employed in the graph CNN layer, the GAT, the model decoder, and the loss function used during model training. We conduct a comparative analysis of the MVIGCN model against the GAMCLDA, GANLDA, MHRWR, and SIMCLDA models through experimental validation. The predictive property of the model is assessed via 50%fold cross-validation, and we compare the AUC, AUPR, F1 score, MCC score, and top-k metric across the same dataset. The results indicate that the MVIGCN model is superior to the other models. Moreover, we establish ablation experiments, and in a case study, we demonstrated that the MVIGCN model is capable of predicting potential lncRNAs associated with prevalent cancers: breast cancer.
Research has shown that lncRNAs often regulate physiological processes through complex networks composed of various biomolecules such as miRNAs and proteins. The MVIGCN model accurately predicts deep associations between lncRNAs and diseases based on the regulatory networks of these biomolecules, thereby addressing the problem of isolated nodes.
Specifically, the model first constructs an lncRNA-miRNA-disease heterogeneous network and an lncRNA-disease association network. Then, it uses Graph Convolutional Neural Networks (GCNs) and Graph Attention Networks (GATs) to extract structural features from the regulatory networks, respectively, and fuses the features from both networks to ultimately predict lncRNA-disease associations. Compared to other algorithms, the MVIGCN model has two significant advantages. First, considering that lncRNA-miRNA-disease associations are important pathways for lncRNA function, the model incorporates regulatory information about miRNAs, and ablation experiments demonstrate the effectiveness of this approach. Second, by simultaneously using GCNs and GATs to extract network features and fusing multiple regulatory relationships, the MVIGCN model outperforms other models in five-fold cross-validation experiments.
Data availability statement
The datasets presented in this study can be found in online repositories. The names of the repository/repositories and accession number(s) can be found in the article/Supplementary Material.
Author contributions
WZ: Data curation, Resources, Software, Writing – original draft, Writing – review and editing. YZ: Conceptualization, Software, Validation, Writing – review and editing. XX: Formal Analysis, Investigation, Writing – review and editing. BZ: Conceptualization, Data curation, Writing – review and editing. SH: Investigation, Software, Writing – review and editing. LL: Investigation, Software, Writing – review and editing. XZ: Methodology, Supervision, Writing – review and editing. LW: Funding acquisition, Validation, Writing – review and editing.
Funding
The author(s) declare that financial support was received for the research and/or publication of this article. This research was funded by the National Natural Science Foundation of China (Nos 62272064, 62006030, 62272064, 62302061, 62302062, and 62402065) and the Key project of Changsha Science and technology Plan (No. KQ2203001), the Scientific Research Foundation of Hunan Provincial Education Department (Nos 23B0797, 22A0591, 24B0789, 23A0608), the Natural Science Foundation of Hunan Province (No.2023JJ40080, Nos 2023JJ40081 and 2023JJ30071), the Changsha Municipal Natural Science Foundation (No. KQ2208431 and KQ2502339).
Acknowledgments
This is a short text to acknowledge the contributions of specific colleagues, institutions, or agencies that aided the efforts of the authors.
Conflict of interest
The authors declare that the research was conducted in the absence of any commercial or financial relationships that could be construed as a potential conflict of interest.
Generative AI statement
The author(s) declare that no Gen AI was used in the creation of this manuscript.
Publisher’s note
All claims expressed in this article are solely those of the authors and do not necessarily represent those of their affiliated organizations, or those of the publisher, the editors and the reviewers. Any product that may be evaluated in this article, or claim that may be made by its manufacturer, is not guaranteed or endorsed by the publisher.
Supplementary material
The Supplementary Material for this article can be found online at: https://www.frontiersin.org/articles/10.3389/fgene.2025.1568270/full#supplementary-material
References
Bianchi, F. M., Grattarola, D., Livi, L., and Alippi, C. (2022). Graph neural networks with convolutional ARMA filters. IEEE Trans. pattern analysis Mach. Intell. 44, 3496–3507. doi:10.1109/tpami.2021.3054830
Chan, T. H., Yin, G., Bae, K., and Yu, L. (2024). Multi-task heterogeneous graph learning on electronic health records. Neural Netw. official J. Int. Neural Netw. Soc. 180, 106644. doi:10.1016/j.neunet.2024.106644
Chen, X., Li, T. H., Zhao, Y., Wang, C. C., and Zhu, C. C. (2021). Deep-belief network for predicting potential miRNA-disease associations. Briefings Bioinforma. 22, bbaa186. doi:10.1093/bib/bbaa186
Dai, G., Wang, X., Zou, X., Liu, C., and Cen, S. (2022). MRGAT: multi-relational graph attention network for knowledge graph completion. Neural Netw. official J. Int. Neural Netw. Soc. 154, 234–245. doi:10.1016/j.neunet.2022.07.014
Guzman-Pando, A., Ramirez-Alonso, G., Arzate-Quintana, C., and Camarillo-Cisneros, J. (2024). Deep learning algorithms applied to computational chemistry. Mol. Divers. 28, 2375–2410. doi:10.1007/s11030-023-10771-y
Ha, J. (2023). SMAP: similarity-based matrix factorization framework for inferring miRNA-disease association. Knowledge-Based Syst. 263, 110295. doi:10.1016/j.knosys.2023.110295
Ha, J., Park, C., Park, C., and Park, S. (2020). IMIPMF: inferring miRNA-disease interactions using probabilistic matrix factorization. J. Biomed. Inf. 102, 103358. doi:10.1016/j.jbi.2019.103358
Ha, J., and Park, S.NCMD (2023). NCMD: node2vec-based neural collaborative filtering for predicting MiRNA-disease association. IEEE/ACM Trans. Comput. Biol. Bioinforma. 20, 1257–1268. doi:10.1109/tcbb.2022.3191972
Jin, J., Wang, H., Si, J., Ni, R., Liu, Y., and Wang, J. (2019). ZEB1-AS1 is associated with poor prognosis in non-small-cell lung cancer and influences cell migration and apoptosis by repressing ID1. Clin. Sci. Lond. Engl. 1979 133, 381–392. doi:10.1042/cs20180983
Jin, L., Hong, N., Ai, X., Wang, J., Li, Z., Han, Z., et al. (2021). LncRNAs as therapeutic targets for autophagy-involved cardiovascular diseases: a review of molecular mechanism and T herapy strategy. Curr. Med. Chem. 28, 1796–1814. doi:10.2174/0929867327666200320161835
Kejani, M. T., Dornaika, F., and Talebi, H. (2020). Graph Convolution Networks with manifold regularization for semi-supervised learning. Neural Netw. official J. Int. Neural Netw. Soc. 127, 160–167. doi:10.1016/j.neunet.2020.04.016
Lan, W., Wu, X., Chen, Q., Peng, W., Wang, J., and Chen, Y. P. (2022). GANLDA: graph attention network for lncRNA-disease associations prediction. Neurocomputing 469, 384–393. doi:10.1016/j.neucom.2020.09.094
Li, J., Kong, M., Wang, D., Yang, Z., and Hao, X. (2021). Prediction of lncRNA-disease associations via closest node weight graphs of the spatial neighborhood based on the edge attention graph convolutional network. Front. Genet. 12, 808962. doi:10.3389/fgene.2021.808962
Lu, C., Yang, M., Li, M., Li, Y., Wu, F. X., and Wang, J. (2020). Predicting human lncRNA-disease associations based on geometric matrix completion. IEEE J. Biomed. health Inf. 24, 2420–2429. doi:10.1109/jbhi.2019.2958389
Lu, C., Yang, M., Luo, F., Wu, F. X., Li, M., Pan, Y., et al. (2018). Prediction of lncRNA-disease associations based on inductive matrix completion. Bioinforma. Oxf. Engl. 34, 3357–3364. doi:10.1093/bioinformatics/bty327
Mishra, V. R., Sreenivasan, K. R., Yang, Z., Zhuang, X., Cordes, D., Mari, Z., et al. (2020). Unique white matter structural connectivity in early-stage drug-naive Parkinson disease. Neurology 94, e774–e784. doi:10.1212/wnl.0000000000008867
Piroozmand, F., Mohammadipanah, F., and Sajedi, H. (2020). Spectrum of deep learning algorithms in drug discovery. Chem. Biol. and drug Des. 96, 886–901. doi:10.1111/cbdd.13674
Qiu, L., Zhong, L., Li, J., Feng, W., Zhou, C., and Pan, J. (2024). SFT-SGAT: a semi-supervised fine-tuning self-supervised graph attention network for emotion recognition and consciousness detection. Neural Netw. official J. Int. Neural Netw. Soc. 180, 106643. doi:10.1016/j.neunet.2024.106643
Sarıgül, M., Ozyildirim, B. M., and Avci, M. (2019). Differential convolutional neural network. Neural Netw. official J. Int. Neural Netw. Soc. 116, 279–287. doi:10.1016/j.neunet.2019.04.025
Shen, L., Li, Y., Hu, G., Huang, Y., Song, X., Yu, S., et al. (2020). MIR155HG knockdown inhibited the progression of cervical cancer by binding SRSF1. OncoTargets Ther. 13, 12043–12054. doi:10.2147/ott.S267594
Sheng, N., Cui, H., Zhang, T., and Xuan, P. (2021). Attentional multi-level representation encoding based on convolutional and variance autoencoders for lncRNA-disease association prediction. Briefings Bioinforma. 22, bbaa067. doi:10.1093/bib/bbaa067
Tong, W., Han, T. C., Wang, W., and Zhao, J. (2019). LncRNA CASC11 promotes the development of lung cancer through targeting microRNA-302/CDK1 axis. Eur. Rev. Med. Pharmacol. Sci. 23, 6539–6547. doi:10.26355/eurrev_201908_18539
Wang, S., Huang, S., Wu, Z., Liu, R., Chen, Y., and Zhang, D. (2024). Heterogeneous graph convolutional network for multi-view semi-supervised classification. Neural Netw. official J. Int. Neural Netw. Soc. 178, 106438. doi:10.1016/j.neunet.2024.106438
Wu, Q. W., Xia, J. F., Ni, J. C., and Zheng, C. H. (2021). GAERF: predicting lncRNA-disease associations by graph auto-encoder and random forest. Briefings Bioinforma. 22, bbaa391. doi:10.1093/bib/bbaa391
Wu, X., Lan, W., Chen, Q., Dong, Y., Liu, J., and Peng, W. (2020). Inferring LncRNA-disease associations based on graph autoencoder matrix completion. Comput. Biol. Chem. 87, 107282. doi:10.1016/j.compbiolchem.2020.107282
Xiong, X., Feng, Y., Li, L., Yao, J., Zhou, M., Zhao, P., et al. (2020). Long non-coding RNA SNHG1 promotes breast cancer progression by regulation of LMO4. Oncol. Rep. 43, 1503–1515. doi:10.3892/or.2020.7530
Xuan, P., Cao, Y., Zhang, T., Kong, R., and Zhang, Z. (2019a). Dual convolutional neural networks with attention mechanisms based method for predicting disease-related lncRNA genes. Front. Genet. 10, 416. doi:10.3389/fgene.2019.00416
Xuan, P., Jia, L., Zhang, T., Sheng, N., Li, X., and Li, J. (2019b). LDAPred: a method based on information flow propagation and a convolutional neural network for the prediction of disease-associated lncRNAs. Int. J. Mol. Sci. 20, 4458. doi:10.3390/ijms20184458
Xuan, P., Pan, S., Zhang, T., Liu, Y., and Sun, H. (2019c). Graph convolutional network and convolutional neural network based method for predicting lncRNA-disease associations. Cells-Basel 8, 1012. doi:10.3390/cells8091012
Zhang, L., Song, R., Tan, W., Ma, L., and Zhang, W. (2024). IGCN: a provably informative GCN embedding for semi-supervised learning with extremely limited labels. IEEE Trans. pattern analysis Mach. Intell. 46, 8396–8409. doi:10.1109/tpami.2024.3404655
Zhang, N., Zeng, X., Sun, C., Guo, H., Wang, T., Wei, L., et al. (2019). LncRNA LINC00963 promotes tumorigenesis and radioresistance in breast cancer by sponging miR-324-3p and inducing ACK1 expression. Mol. Ther. Nucleic acids 18, 871–881. doi:10.1016/j.omtn.2019.09.033
Zhang, Z., and Castelló, A. (2017). Principal components analysis in clinical studies. Ann. Transl. Med. 5, 351. doi:10.21037/atm.2017.07.12
Zhao, X., Yang, Y., and Yin, M.MHRWR (2021). MHRWR: prediction of lncRNA-disease associations based on multiple heterogeneous networks. IEEE/ACM Trans. Comput. Biol. Bioinforma. 18, 2577–2585. doi:10.1109/tcbb.2020.2974732
Zhao, X., Zhao, X., and Yin, M. (2022). Heterogeneous graph attention network based on meta-paths for lncRNA-disease association prediction. Briefings Bioinforma. 23, bbab407. doi:10.1093/bib/bbab407
Keywords: graph convolutional network, lncRNA-miRNA, multiview data, deep learning, similarity network
Citation: Zhang W, Zeng Y, Xiang X, Zhao B, Hu S, Li L, Zhu X and Wang L (2025) Association prediction of lncRNAs and diseases using multiview graph convolution neural network. Front. Genet. 16:1568270. doi: 10.3389/fgene.2025.1568270
Received: 29 January 2025; Accepted: 04 April 2025;
Published: 15 April 2025.
Edited by:
Marcelo R. S. Briones, Federal University of São Paulo, BrazilReviewed by:
Fernando Martins Antoneli Jr, Federal University of São Paulo, BrazilTeng Zhixia, Northeast Forestry University, China
Copyright © 2025 Zhang, Zeng, Xiang, Zhao, Hu, Li, Zhu and Wang. This is an open-access article distributed under the terms of the Creative Commons Attribution License (CC BY). The use, distribution or reproduction in other forums is permitted, provided the original author(s) and the copyright owner(s) are credited and that the original publication in this journal is cited, in accordance with accepted academic practice. No use, distribution or reproduction is permitted which does not comply with these terms.
*Correspondence: Lei Wang, d2FuZ2xlaUB4dHUuZWR1LmNu