 Weiwei Zhang
 Zhonghe Tian
- School of Mathematics Information, Shaoxing University, Shaoxing, China
Introduction: Genomic and epigenomic data from complex samples reflect the average level of multiple cell types. However, differences in cell compositions can introduce bias into many relevant analyses. Consequently, the accurate estimation of cell compositions has been regarded as an important initial step in the analysis of complex samples. A large number of computational methods have been developed for estimating cell compositions; however, their applications are limited due to the absence of reference or prior information. As a result, reference-free deconvolution has the potential to be widely applied due to its flexibility. A previous study emphasized the importance of feature selection for improving estimation accuracy in reference-free deconvolution.
Methods: In this paper, we systematically evaluated five feature selection options and developed an optimal feature-selection-based reference-free deconvolution method. Our proposal iteratively searches for cell-type-specific (CTS) features by integrating cross-cell-type differential analysis between one cell type and the other cell types, as well as between two cell types and the other cell types, and performs composition estimation.
Results and discussion: Comprehensive simulation studies and analyses of seven real datasets show the excellent performance of the proposed method. The proposed method, that is, reference-free deconvolution based on cross-cell-type differential (RFdecd), is implemented as an R package at https://github.com/wwzhang-study/RFdecd.
1 Introduction
Genomic and epigenomic data obtained from complex samples represent a weighted average of signals originating from multiple cell types, rather than individual measures for each feature across different cell types present in the mixture (Houseman et al., 2012; Jaffe and Irizarry, 2014; Shen-Orr et al., 2010; Zhong and Liu, 2011). For instance, DNA methylation profiles derived from whole blood reflect contributions from heterogeneous cell populations, such as lymphocytes (e.g., T cells and B cells), granulocytes (e.g., neutrophils), and monocytes (Zhang et al., 2021; Zheng et al., 2018). Similarly, tumor samples are composed of heterogeneous cellular mixtures, including malignant cells, stromal cells (e.g., fibroblasts), vascular endothelial cells, and immune cell subsets (e.g., T cells and macrophages), which collectively constitute the tumor microenvironment (Marusyk et al., 2012; Yadav and De, 2015). Consequently, differences in cell compositions can confound many relevant analyses, including differential analysis (Zhang et al., 2020; Zheng X. et al., 2017), and cell-type classification (Chen et al., 2024). Moreover, cell compositions serve as a crucial foundation for forecasting disease progression and patient prognosis (Dou et al., 2024; Ribas and Wolchok, 2018). Therefore, the accurate estimation of cell compositions from high-throughput data of complex samples is of great significance.
Cell composition analysis can be assessed through both in vitro experimental and in silico computational approaches. Many experimental approaches, such as fluorescence-activated cell sorting (FACS) and immunohistochemistry (IHC), along with advanced techniques like single-cell transcriptome analysis and multi-omics sequencing, provide cellular composition information (Sturm et al., 2019). However, these in vitro methods are either limited by their processing capacity or remain too expensive and labor-intensive for large-scale clinical use. To address this issue, in silico computational techniques known as “deconvolution” have been devised as alternatives. These approaches can generally be divided into two main categories: reference-based (RB) methods (Clarke et al., 2010; Gong et al., 2011; Hattab et al., 2017; Newman et al., 2015; Teschendorff et al., 2017) and reference-free (RF) methods (Brunet et al., 2004; Houseman et al., 2016; Kang et al., 2019; Rahmani et al., 2018). RB methods require the use of reference panel data that can be derived from purified tissues or annotated single-cell experiments. The proportion of each cell type is then determined using techniques such as constrained linear regression or support vector regression (Newman et al., 2015). It has been reported that RB methods generally provide more accurate and robust estimations than RF methods (Newman et al., 2015; Teschendorff et al., 2017; Zheng S. C. et al., 2017). Nevertheless, RB methods often encounter limitations due to the accessibility of appropriately matched reference panels that adequately match the target population in terms of key biological characteristics. Currently, the available reference data predominantly pertain to only a handful of extensively researched tissue types, such as the blood, breast, and brain, sourced from a relatively small number of individuals. Additionally, in scenarios where substantial disparities exist in clinical conditions and phenotypes between the intricate samples under study and the reference data, RB methods may lead to imprecise estimations of proportions (Li and Wu, 2019). For tissues without proper references, RF methods provide a better solution (Ferro Dos Santos et al., 2024; Rahmani et al., 2017). RF deconvolution is a computational framework that estimates cellular heterogeneity without requiring prior cell-type marker information by simultaneously inferring cell-type-specific (CTS) signatures and proportions directly from bulk data. Classical approaches including non-negative matrix factorization (NMF) (Brunet et al., 2004) and https://MeDeCom (Lutsik et al., 2017) require biological priors to resolve rotational ambiguity. Recent advancements diversify RF strategies: hierarchical latent variable models [e.g., MMAD (Houseman et al., 2016)] enhance biological interpretability through structured latent variables, whereas Bayesian frameworks like BayesPrism (Chu et al., 2022) improve identifiability via prior integration. Feature selection strategies, such as co-functional grouping (Deng et al., 2023), optimize biological relevance at computational cost. Spatial extensions like STANDS (Xu et al., 2024) enable reference-free tissue analysis via graph neural networks, contingent on specialized spatial inputs. Despite methodological advancements, RF frameworks continue to face inherent parameter estimation challenges in simultaneously estimating high-dimensional parameters for cellular signatures and proportions, often leading to reduced estimation accuracy. Therefore, it is worthwhile to investigate potential strategies that can improve RF deconvolution.
In this paper, we systematically evaluated five feature-selection options in reference-free deconvolution and developed an optimal feature-selection-based reference-free deconvolution based on cross-cell-type differential (RFdecd) analysis using an iteration algorithm to search for cell-type-specific features and perform cell composition estimation. We evaluate the proposed method through extensive simulation studies and analysis of seven real data. Our proposed method is implemented in the latest version of the RFdecd package, which is freely available at https://github.com/wwzhang-study/RFdecd.
2 Materials and methods
2.1 Data model
RF deconvolution uses a raw data matrix
where
Figure 1 shows the workflow of the proposed algorithm, which consists of three main phases. The initialization phase begins by selecting the top 1,000 features (
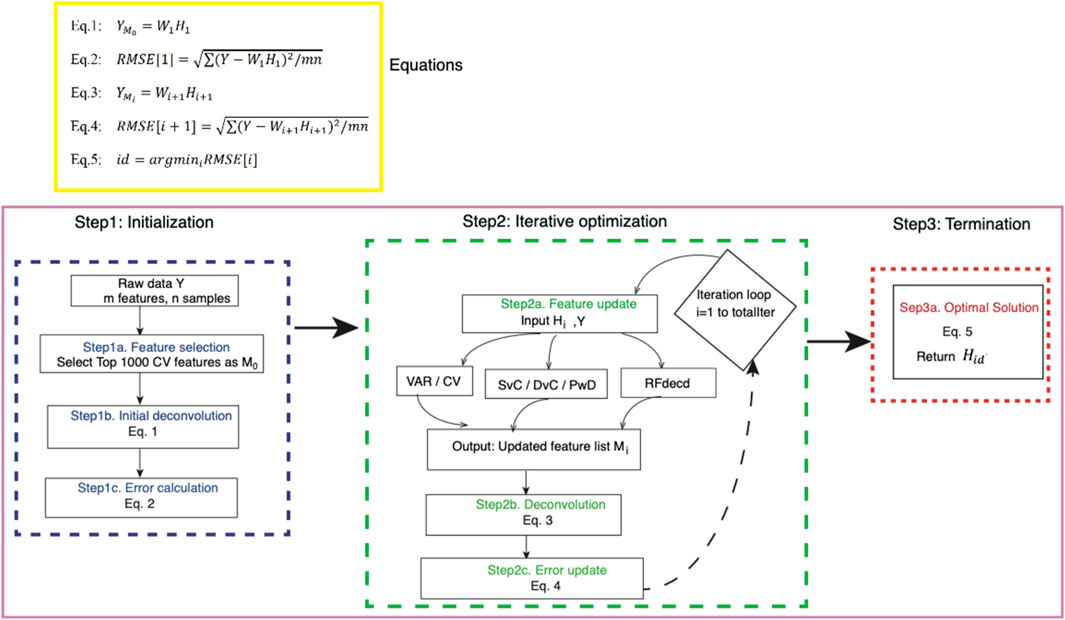
Figure 1. Workflow of the proposed method. Our algorithm starts with raw data
The algorithm uses six feature-selection options during iterative optimization. Initial approaches include VAR and CV, which select the top 1,000 features based on VAR or CV in the estimated cell-type profiles. Building on the previous work of Li and Wu (2019), who demonstrated that cross-cell-type differential analysis enhances feature selection and subsequent proportion estimation, we further developed three strategies: SvC, reflecting the comparison between one target cell type and a composite group of all other cell type; DvC, indicating the joint analysis of two specified cell types against the remaining composite population; and PwD, emphasizing direct feature selection between two explicitly contrasted cell types without composite interference. For illustration, a sample is considered with four cell types (
2.2 Selection of features using cross-cell-type differential analysis
We denote all the observed data for the
In Equation 2,
(1) SvC: testing the difference in the
(2) DvC: testing the difference in the
This formulation assesses whether the combined effect of groups
(3) PwD: testing the difference in the
The ordinary least squares (OLS) method can be used to fit the linear model described above, and the corresponding test statistics and p-values can be derived from this estimation.
2.3 Datasets
2.3.1 Simulation datasets
We designed two simulation studies based on real datasets: one for the gene expression data and the other for the DNA methylation data. The simulated data (
2.3.2 Real datasets
In the real data analysis, a total of seven datasets were retrieved from the Gene Expression Omnibus (GEO) database, accessible at https://www.ncbi.nlm.nih.gov/geo/ under the following accession IDs: Mouse-Mix data by Shen-Orr et al. (2010) with accession ID GSE19830, Immune data by Abbas et al. (2009) with accession ID GSE11058, Aging data by Hannum et al. (2013) with accession ID GSE40279, Rheumatoid Arthritis data by Liu et al. (2013) with accession ID GSE42861, European Prospective Investigation into Cancer and Nutrition data by Riboli et al. (2002) with accession ID GSE51032, and two Schizophrenia datasets by Hannon et al. (2016) with accession IDs GSE80417 and GSE84727, abbreviated as Hannon et al. I and Hannon et al. II, respectively. We normalized DNA methylation data using quantile normalization. In the simulation and seven datasets, we calculated the mean Pearson correlation coefficient (mean PCC) and mean absolute error (MAE) between the estimated and true proportions across the four cell types to evaluate the performance of our proposed algorithm. A higher mean PCC and lower MAE are expected for a better method.
3 Results
3.1 Simulation
First, we evaluated the performance of our method in simulation based on gene expression and DNA methylation datasets with four cell types. A total of 100 samples were generated using the simulation steps described in Section 2.4. Figure 2A is based on gene expression, and Figure 2B is based on DNA methylation. The left panel of Figure 2 shows the mean Pearson correlations between the estimated and true proportions across the four cell types at the initial point (number of iterations = 0) and after 30 iterations of application of the six proposed methods. The middle and right panels of Figure 2 show the mean Pearson correlation and mean absolute error, respectively, between the estimated and true proportions across the four cell types using the seven methods. Here, the estimated proportions of PreOpt refer to the initial cell-type proportion estimates prior to the first iteration of optimization (equivalent to iteration count = 0), derived directly from raw input features without feature selection or model refinement, and the estimated proportions of the other six methods are based on the results with the smallest RMSE in 30 iterations. The left panel clearly shows that the mean correlations between the estimated and true proportions continue to increase during the iterations for all the six methods. The improvements are dramatic for all six methods, particularly for the four methods: RFdecd, SvC, DvC, and PwD, which are based on cross-cell-type differential analysis. For the gene expression data, the mean correlation at the number of iterations = 0 was 0.217. However, at seven iterations, the mean correlation of VAR was 0.443, CV was 0.659, SvC was 0.724, DvC was 0.751, PwD was 0.637, and RFdecd was 0.911. From the middle and right panels, whether for gene expression data or DNA methylation data, compared with “PreOpt” (number of iterations = 0), the mean correlation across the four cell types significantly increased, and the mean absolute error significantly decreased. RFdecd achieved the best performance, followed by DvC and SvC. Similar results were obtained for DNA methylation data (lower panel of Figure 2). It is worth mentioning that the improvement in DNA methylation was not as rapid as that in gene expression (the mean Pearson correlation was 0.911 for seven iterations of gene expression and 0.907 for 10 iterations of DNA methylation). This computational challenge was reflected in our benchmarking tests: on a standard laptop (Apple M1 8-core processor and 16 GB unified memory), the algorithm analyzed 54,675 genes across 100 samples in 7.8 min per run while processing 459,226 CpG sites with equivalent sample size required 23.8 min. The increased computational demand for methylation data further supports the notion that its higher feature complexity impacts optimization efficiency. Thus, we suggest more iterations of the DNA methylation data with smaller sample sizes.
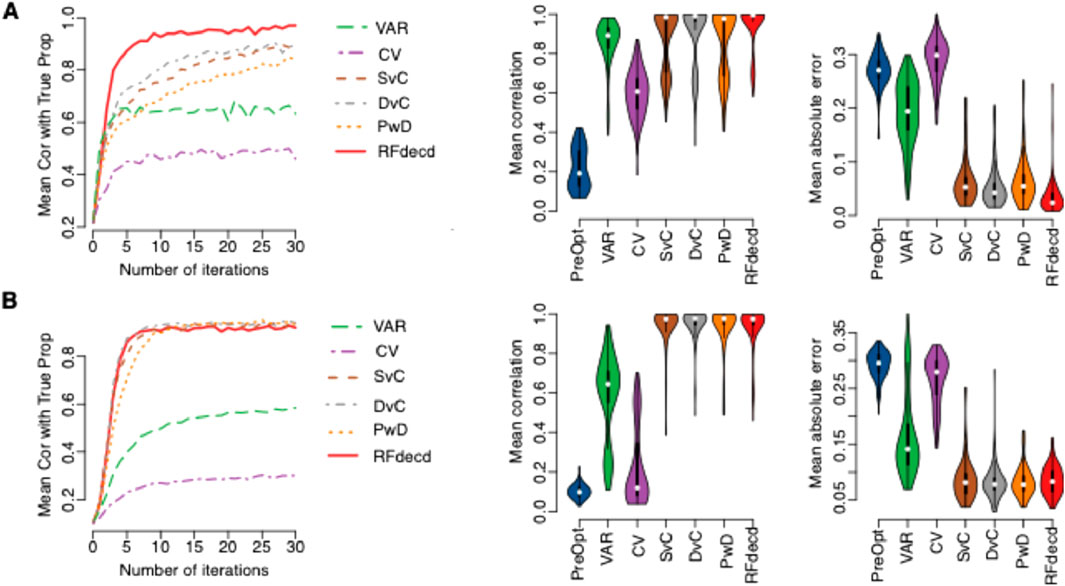
Figure 2. Performance of our algorithm on synthetic mixtures. (A) Gene expression dataset (GSE19830); (B) DNA methylation dataset (GSE35069). Left panels: boxplots of mean Pearson correlations between estimated and true cell-type proportions across four cell types for six methods (VAR, CV, SvC, DvC, PwD, and RFdecd) over 30 iterations. Middle and right panels: boxplots comparing mean Pearson correlations (middle) and mean absolute errors (right) for seven methods, including the baseline “PreOpt” (initial deconvolution using the top 1,000 CV-selected features without iteration). Results for the six iterative methods reflect the lowest RMSE across 30 iterations. All metrics are aggregated from 100 Monte Carlo simulations with 100 samples per simulation.
Next, we examined the effect of the number of cell types in the mixture for different sample sizes. We use DNA methylation data (GSE35069) to generate simulation data with six cell types (CD4 T, CD8 T, CD56NK, B cell, Mono, and Gran). The simulation details are presented in Section 2.4. As shown in Figure 3, RFdecd consistently achieves higher correlations and lower mean absolute errors than “PreOpt.” We also observed that RFdecd had increased correlations and decreased errors when the sample size increased from 50 to 200 (the mean Pearson correlation is 0.77 for a sample size of 50 compared to 0.98 for a sample size of 200, and the mean absolute error is 0.10 for a sample size of 50 compared to 0.05 for a sample size of 200). Furthermore, compared to Figure 2B, under the same number of iterations, the proportion estimations for four cell types are more accurate than that for six cell types (the mean Pearson correlation over 10 iterations is 0.927 for four cell types, whereas it is only 0.88 for six cell types). These findings suggest that in scenarios with a limited sample size (e.g.,
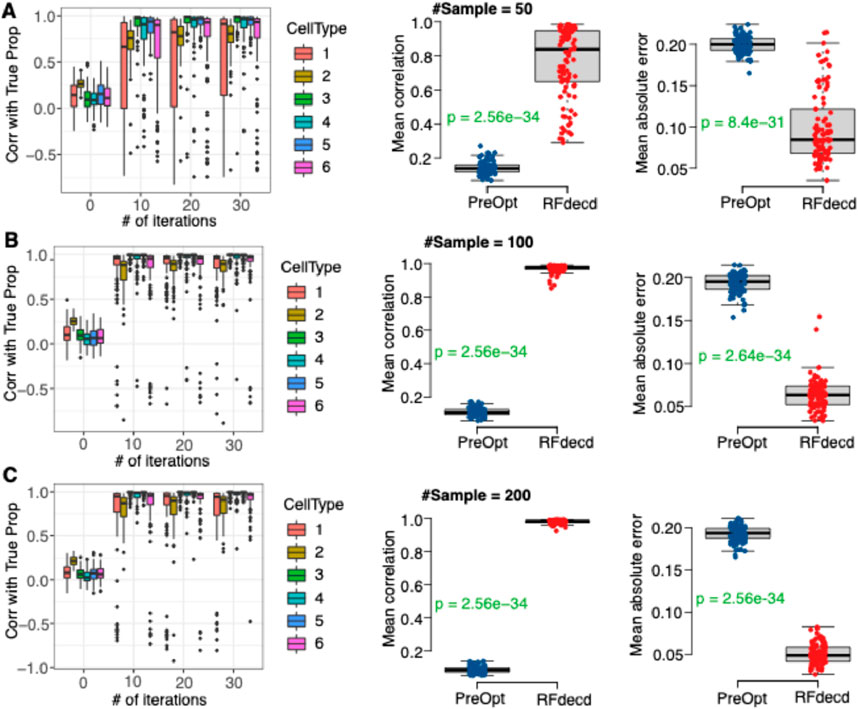
Figure 3. The Performance of RFdecd on synthetic mixtures based on DNA methylation dataset with six cell types under sample sizes of 50, 100 and 200 (GSE35069). (A) Top row (sample size 50). Left panel: boxplots of Pearson correlations between the estimated and true proportions by the number of iterations for each of the six cell types. Middle and right panels: boxplots of mean Pearson correlations and mean absolute errors between estimated and true proportions over six cell types from “PreOpt” and RFdecd. (B) Middle row (sample size 100): Panels for 100 samples. (C) Bottom row (sample size 200): Panels for 200 samples. The estimated proportions of “PreOpt” are obtained using the top 1000 features by CV for observed data as inputs for RF deconvolution (i.e., number of iterations = 0). The estimated proportions of RFdecd are based on the results with the smallest RMSE over 30 iterations. From the top panel to bottom panel, sample size increases from 50, 100 to 200. P-values for each panel were obtained using the rank-sum test. The presented results are summarized over 100 Monte Carlo simulation experiments.
To further investigate how cell-type proportion influence the deconvolution accuracy, we designed a dual-pronged validation strategy targeting both the generation and perturbation of the proportion matrix
Notably, under the extreme configuration, where two cell types approached sparsity (
3.2 Real data analysis
3.2.1 Benchmarking RFdecd through seven real datasets
Seven datasets described in Section 2.3.2 were used to evaluate the performance of RFdecd. Both Mouse-Mix and Immune data had true proportions ascertained through experiments; however, the five DNA methylation datasets did not have true proportions to provide benchmarks. To circumvent this, blood reference panels were obtained from the R package FlowSorted.Blood.450k (Jaffe and Irizarry, 2014), which furnishes methylation profiles of six cell types, namely, CD8T, CD4T, NK cell, B cell, Mono, and Gran. Subsequent to mitigating the batch effect between the mixture and reference data via the Combat (Johnson et al., 2007), the reference-based deconvolution method EpiDISH (Teschendorff et al., 2017) was used to derive proportion estimations. These estimated proportions were used as the reference standard for benchmarking RFdecd. Figure 4A shows the scatterplots of the estimated and true proportions of Mouse-Mix and Immune data for each cell type at the initial point (“PreOpt,” i.e., number of iterations = 0) and after applying RFdecd, and the mean Pearson correlations across cell types are shown. Improvements in proportion estimation were significant for both datasets. After applying RFdecd, mean correlations (mean PCC) increase from 0.75 to 0.995 for Mouse-Mix and from 0.451 to 0.963 for Immune data. Figure 4B shows bar plots of the Pearson correlations between the reference-based solved and estimated proportions for each cell type in the five datasets. Overall, RFdecd demonstrated superior performance compared to not using the feature-selection method, as evidenced by higher correlations between the reference-based resolved and estimated proportions for each cell type across the seven datasets. Evidently, our proposed method provides a higher mean correlation than PreOpt (0.39 versus 0.21). Moreover, we found that the correlations in Figure 4B are lower than those in Figure 4A. Nevertheless, these results still demonstrate that the proposed method achieves a significant enhancement in proportion estimation. To comprehensively evaluate the robustness of RFdecd across diverse datasets, Figure 4C presents boxplots of Pearson correlations between the actual (or reference-based resolved) and estimated proportions for each cell type aggregated across all seven datasets. Clearly, our proposed method demonstrates significant improvements in the composition estimation.
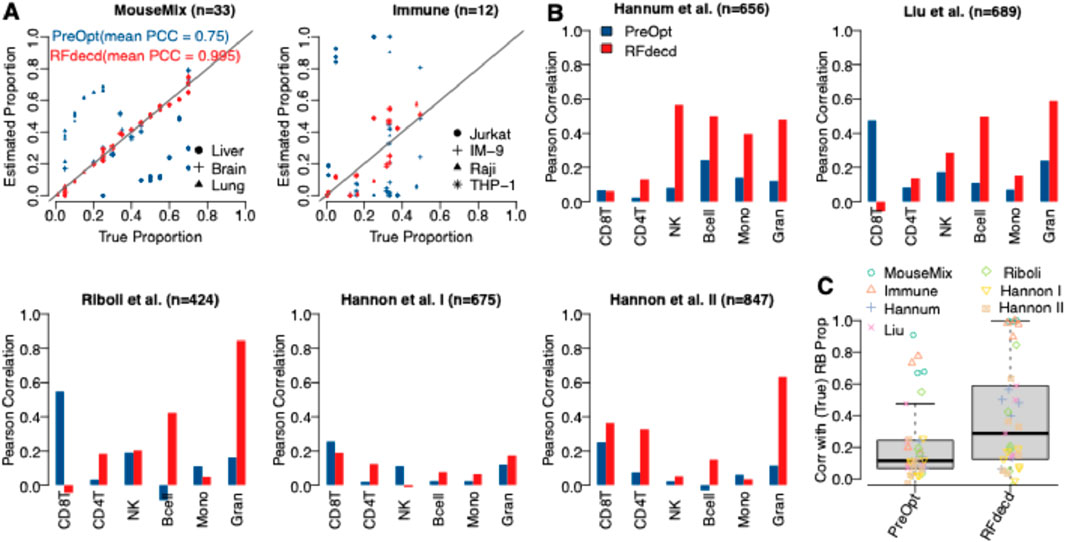
Figure 4. Performance assessment of RFdecd on seven real datasets. (A) Scatterplots depicting the estimated and true proportions of Mouse-Mix and Immune data for each cell type at the initial point (PreOpt, i.e., number of iterations = 0) and after applying RFdecd. (B) Bar plots illustrating Pearson correlations between reference-based resolved and estimated proportions for each cell type across the five datasets, based on the assumption of six constituent cell types (CD8T, CD4T, NK, Bcell, Mono, and Gran) in blood. (C) Boxplots representing Pearson correlations between the actual (or reference-based resolved) and estimated proportions for each cell type in the seven datasets. The mean Pearson correlations across cell types for Mouse-Mix and Immune data are shown in (A).
3.2.2 Study of the biological significance of proportion estimation in rheumatoid arthritis
Finally, we examined whether the estimated proportion was biologically significant. Research has indicated that the proportions of certain blood cell types in individuals with rheumatoid arthritis (RA) deviate from those observed in healthy individuals (Hidaka et al., 1999; Kikuchi et al., 2015). Consequently, the proportion of blood cells can serve as a predictive marker for RA. Estimates of proportions that more accurately predict disease are considered to be superior. The RA dataset included 354 patients with RA and 335 healthy controls, with male and female subjects in each group (Liu et al., 2013). We used the RB method EpiDISH, along with the RF methods RefFreeEWAS and RFdecd, to decompose the 689 RA samples. The reference panel for EpiDISH was obtained from the R package FlowSorted.Blood.450k. Because the 689 samples had a disease status (control or patient), we trained a nonlinear support vector machine (SVM) with radial basis function (RBF) kernel using the estimated proportion to predict the disease status. The SVM model was trained through the “svm” function of the R package e1071, with kernel parameters optimized via grid search and feature vectors standardized to zero-mean unit-variance prior to model fitting. A 10-fold cross-validation was used to evaluate and compare the classification accuracies of the three methods. Figure 5A shows the estimated proportions of RA patients and controls using the three methods. Figure 5B presents the precision–recall curves for disease status prediction based on the estimated proportions of 689 samples from the three methods. It is evident that RFdecd achieved the best disease prediction performance, followed by EpiDISH and RefFreeEWAS. This result is reasonable. This is because the top 1,000 variable sites used in RefFreeEWAS contained contributions from within-cell-type variances (biological variation among samples for pure cell types), cross-cell-type variances (mean differences among pure cell types), and variation from the mixing proportions. EpiDISH is an RB method, and the reference panel provides useful information for deconvolution, resulting in a better estimation than RefFreeEWAS. When the reference panel is obtained from subjects with different phenotypes, such as age, sex, and disease status, RF can provide better proportion estimates than the RB method (Rahmani et al., 2017). In addition, RFdecd iteratively searches for cell-type-specific features and performs composition estimation, resulting in better estimation than EpiDISH. We also investigated the impact of sex on the prediction performance. Figures 5C,D show the precision–recall curves from the analysis of the RA datasets by gender. The results in Figure 5C are consistent with those in Figure 5B, indicating that RFdecd achieves better performance. Additionally, we observed greater improvements using RFdecd in female subjects than in male subjects. We believe that this could be explained by sex differences in RA etiology (Abbas et al., 2009; Affleck et al., 1999; Ahlmen et al., 2010) and sample size differences (197 male and 492 female subjects); future studies should incorporate multi-covariate analyses to disentangle the interplay of sex, age, and other clinical variables. Overall, RFdecd provides a favorable and robust performance for improving proportion estimations and disease predictions.
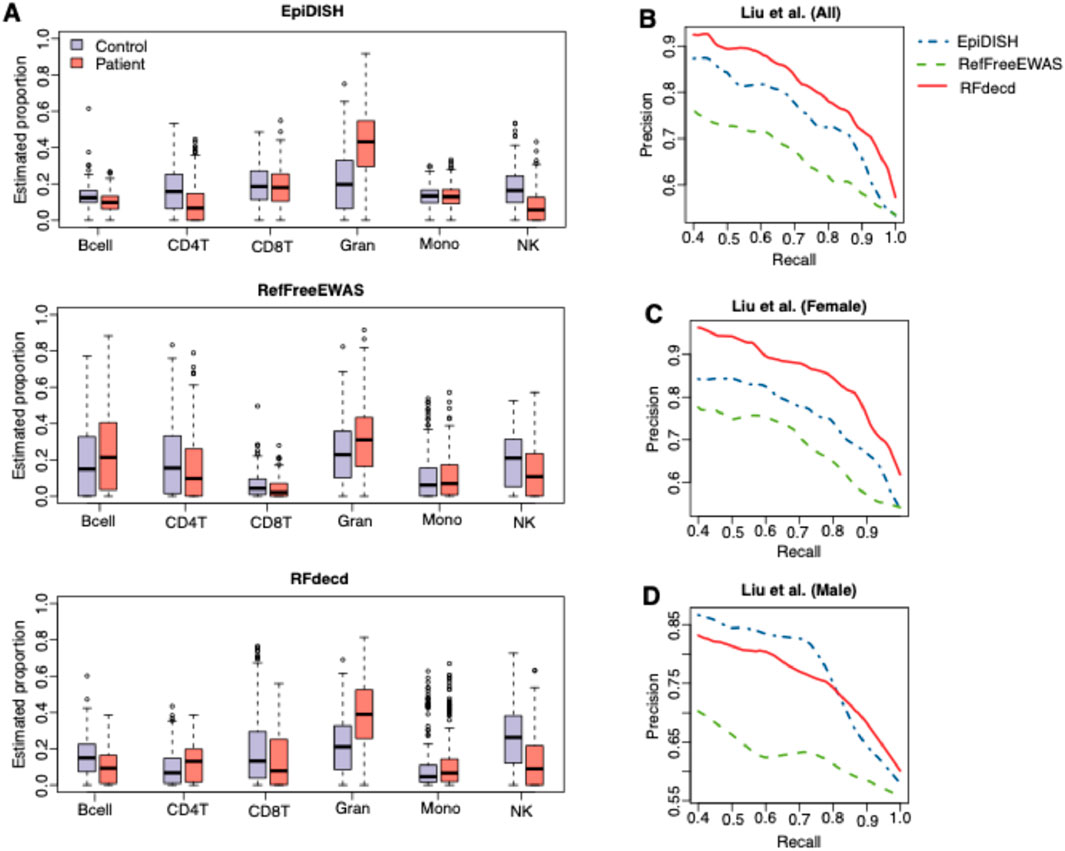
Figure 5. Results of the analysis of RA datasets. (A) Boxplots of proportion estimations of patients with RA and controls from EpiDISH, RefFreeEWAS, and RFdecd. (B–D) Precision–recall curves for predicting the disease status using estimated proportions for 689 samples (B), of which 492 female samples (C) and 197 male samples (D) from the three methods. Curves were generated using the averaged results of the 10-fold cross-validation.
4 Discussion
In this study, we systematically evaluated five feature-selection options for reference-free deconvolution and presented an optimal feature selection-based reference-free deconvolution method, RFdecd. Our proposal iteratively searches for cell-type-specific features by integrating cross-cell-type differential analysis between one cell type and the other cell types, as well as between two cell types and the other cell types, and performs composition estimation. RFdecd does not require any prior knowledge of the cell types or their proportions; therefore, it is purely data driven. Moreover, they are not limited to specific RF deconvolution methods. Currently, most existing RF methods can be incorporated into this procedure. The application of deconf and RefFreeEWAS demonstrated this flexibility.
The proposed method is primarily aimed at microarray data of gene expression and DNA methylation. However, the idea and principle of this method can also be applied to other data types, such as RNA-seq data. A simulation study based on a real RNA-seq dataset has shown that differential analysis between one cell type and other cell types (i.e., SvC) can accurately identify cell-type-specific features (Li et al., 2019). Our current study demonstrates through comprehensive simulation analyses and real-data benchmark tests that RFdecd outperforms SvC in both cases, highlighting its stronger ability to resolve cell-type-specific features through iterative optimization. Our future work will explicitly validate these strategies in RNA-seq data.
Our selection of 1,000 features was motivated by balancing computational efficiency and biological signal preservation, which is consistent with prior genomic studies (Li and Wu, 2019). This heuristic threshold, analogous to conventional statistical cutoffs (p < 0.05), was further validated through 20 Monte Carlo simulations of 100-sample gene expression analyses (Supplementary Figure S4). We evaluated algorithm performance across varying feature numbers (500, 1,000, 1,500, up to 5,000). At 500 features, the mean correlation coefficient was 0.87, which significantly improved to 0.96 with 1,000 features. Although results for 1,500 to 4,000 features were comparable to those of 1,000 features, computational time increased by 40% (7.8 min for 1,000 features vs. 31.2 min for 4,000 features). Notably, when exceeding 4,000 features (e.g., 4,500–5,000 genes), correlation coefficients decreased. This supports 1,000 features as an optimal trade-off for balancing accuracy and efficiency in our framework. It is worth mentioning that in practical problems, this number should be case specific, and for different species, it may not hold universally.
Importantly, as discussed in recently published studies (Feng et al., 2018; Wang et al., 2019), good features for deconvolution are those with low within-cell-type variation and high cross-cell-type variation. If we select features solely based on the variance of raw observations, features with high within-cell-type variances could also be included, which would have a negative impact on the RF deconvolution in a later step, resulting in the poor performance of RefFreeEWAS. Thus, RFdecd’s iterative differential analysis framework inherently enforces this dual criterion, dynamically selecting features that maximize the biological signal while minimizing noise propagation.
Despite its merits, RFdecd has the following limitations. First, RF methods must estimate a large number of unknown parameters. Therefore, a large sample size is required to obtain accurate estimates of the cell composition. This hinders the application of RF deconvolution to small-scale studies. To evaluate this limitation, we tested RFdecd’s performance under reduced sample conditions using 30 simulated samples. As shown in Supplementary Figure S5 (parts A and B), both gene expression and DNA methylation data revealed significant improvements in mean Pearson correlations between estimated and true cell proportions across iterations for all six methods compared. Specifically, RFdecd outperformed alternatives like DvC and SvC, with mean correlations increasing from 0.85 (30 samples and 30 iterations) to 0.95 (30 samples and 100 iterations) for gene expression data (Part C), highlighting how iterative refinement mitigates sample scarcity by enhancing feature selection. Parallel analysis with 10 simulated samples demonstrated comparable trends, where 100 iterations maintained robust performance despite limited sample size, achieving a correlation of 0.93 versus 0.95 with 30 samples (Supplementary Figure S6). So, for studies with ≤50 samples, we recommend 100 iterations as a default to balance accuracy and computational efficiency. For datasets with smaller sample sizes, for example, those with fewer than 20 samples, especially those obtained from model animals (Li et al., 2020), provided a promising solution for gene expression. Second, a common challenge in applying RF methods is determining an appropriate number of cell types. For tissues that have been well studied, such as the blood and brain, prior knowledge of cell types can be easily obtained (Montano et al., 2013; Reinius et al., 2012). When there is no prior information about the number of cell types, many RF methods recommend selecting them based on model selection criteria, such as comparing the estimation error and approximation error (Lutsik et al., 2017), AIC, and BIC (Zhang et al., 2021). However, for tumor tissues, this problem is much more complicated because every two cells in the tumor tissue may be different. Under similar thresholds, cells in tumor tissues can be classified into different groups. Therefore, we propose combining model selection criteria with biological knowledge to determine the number of cell types in complex tissues. Third, assigning cell-type labels to the estimated anonymous cell types is difficult in real RF method applications. However, Rahmani et al. (2018) developed a promising Bayesian model that incorporated prior cell composition knowledge in deconvolution to solve this problem. However, prior knowledge exists only for a small number of well-studied tissues, which limits its application to real data. We provided a data-driven geometric approach to address this issue in the study of DNA methylation data (Zhang et al., 2021), which can be easily applied to gene expression data.
Data availability statement
The original contributions presented in the study are included in the article/Supplementary material; further inquiries can be directed to the corresponding author.
Author contributions
WZ: Data curation, Methodology, Software, Writing – original draft, Writing – review and editing, Funding acquisition. ZT: Software, Writing – original draft. LP: Software, Writing – original draft.
Funding
The author(s) declare that financial support was received for the research and/or publication of this article. This project was partially supported by the Jiangxi Natural Science Foundation (20212BAB202001 to WZ).
Acknowledgments
The authors thank Ziyi Li for helpful discussions and constructive comments while building the model and preparing the manuscript.
Conflict of interest
The authors declare that the research was conducted in the absence of any commercial or financial relationships that could be construed as a potential conflict of interest.
Generative AI statement
The author(s) declare that no Generative AI was used in the creation of this manuscript.
Publisher’s note
All claims expressed in this article are solely those of the authors and do not necessarily represent those of their affiliated organizations, or those of the publisher, the editors and the reviewers. Any product that may be evaluated in this article, or claim that may be made by its manufacturer, is not guaranteed or endorsed by the publisher.
Supplementary material
The Supplementary Material for this article can be found online at: https://www.frontiersin.org/articles/10.3389/fgene.2025.1570781/full#supplementary-material
References
Abbas, A. R., Wolslegel, K., Seshasayee, D., Modrusan, Z., and Clark, H. F. (2009). Deconvolution of blood microarray data identifies cellular activation patterns in systemic lupus erythematosus. PLoS One 4, e6098. doi:10.1371/journal.pone.0006098
Affleck, G., Tennen, H., Keefe, F. J., Lefebvre, J. C., Kashikar-Zuck, S., Wright, K., et al. (1999). Everyday life with osteoarthritis or rheumatoid arthritis: independent effects of disease and gender on daily pain, mood, and coping. Pain 83, 601–609. doi:10.1016/S0304-3959(99)00167-0
Ahlmen, M., Svensson, B., Albertsson, K., Forslind, K., Hafstrom, I., and Group, B. S. (2010). Influence of gender on assessments of disease activity and function in early rheumatoid arthritis in relation to radiographic joint damage. Ann. Rheum. Dis. 69, 230–233. doi:10.1136/ard.2008.102244
Brunet, J. P., Tamayo, P., Golub, T. R., and Mesirov, J. P. (2004). Metagenes and molecular pattern discovery using matrix factorization. Proc. Natl. Acad. Sci. U. S. A. 101, 4164–4169. doi:10.1073/pnas.0308531101
Chen, L., Guo, Z., Deng, T., and Wu, H. (2024). scCTS: identifying the cell type-specific marker genes from population-level single-cell RNA-seq. Genome Biol. 25, 269. doi:10.1186/s13059-024-03410-8
Chu, T., Wang, Z., Pe'er, D., and Danko, C. G. (2022). Cell type and gene expression deconvolution with BayesPrism enables Bayesian integrative analysis across bulk and single-cell RNA sequencing in oncology. Nat. Cancer 3, 505–517. doi:10.1038/s43018-022-00356-3
Clarke, J., Seo, P., and Clarke, B. (2010). Statistical expression deconvolution from mixed tissue samples. Bioinformatics 26, 1043–1049. doi:10.1093/bioinformatics/btq097
Deng, T., Chen, S., Zhang, Y., Xu, Y., Feng, D., Wu, H., et al. (2023). A cofunctional grouping-based approach for non-redundant feature gene selection in unannotated single-cell RNA-seq analysis. Brief. Bioinform 24, bbad042. doi:10.1093/bib/bbad042
Dou, T., Li, J., Zhang, Y., Pei, W., Zhang, B., Wang, B., et al. (2024). The cellular composition of the tumor microenvironment is an important marker for predicting therapeutic efficacy in breast cancer. Front. Immunol. 15, 1368687. doi:10.3389/fimmu.2024.1368687
Feng, H., Jin, P., and Wu, H. (2018). Disease prediction by cell-free DNA methylation. Brief Bioinform. 20, 585–597. doi:10.1093/bib/bby029
Ferro Dos Santos, M. R., Giuili, E., De Koker, A., Everaert, C., and De Preter, K. (2024). Computational deconvolution of DNA methylation data from mixed DNA samples. Brief. Bioinform 25, bbae234. doi:10.1093/bib/bbae234
Gong, T., Hartmann, N., Kohane, I. S., Brinkmann, V., Staedtler, F., Letzkus, M., et al. (2011). Optimal deconvolution of transcriptional profiling data using quadratic programming with application to complex clinical blood samples. PLoS One 6, e27156. doi:10.1371/journal.pone.0027156
Hannon, E., Dempster, E., Viana, J., Burrage, J., Smith, A. R., Macdonald, R., et al. (2016). An integrated genetic-epigenetic analysis of schizophrenia: evidence for co-localization of genetic associations and differential DNA methylation. Genome Biol. 17, 176. doi:10.1186/s13059-016-1041-x
Hannum, G., Guinney, J., Zhao, L., Zhang, L., Hughes, G., Sadda, S., et al. (2013). Genome-wide methylation profiles reveal quantitative views of human aging rates. Mol. Cell 49, 359–367. doi:10.1016/j.molcel.2012.10.016
Hattab, M. W., Shabalin, A. A., Clark, S. L., Zhao, M., Kumar, G., Chan, R. F., et al. (2017). Correcting for cell-type effects in DNA methylation studies: reference-based method outperforms latent variable approaches in empirical studies. Genome Biol. 18, 24. doi:10.1186/s13059-017-1148-8
Hidaka, T., Suzuki, K., Matsuki, Y., Takamizawa-Matsumoto, M., Okada, M., Ishizuka, T., et al. (1999). Changes in CD4+ T lymphocyte subsets in circulating blood and synovial fluid following filtration leukocytapheresis therapy in patients with rheumatoid arthritis. Ther. Apher. 3, 178–185. doi:10.1046/j.1526-0968.1999.00136.x
Houseman, E. A., Accomando, W. P., Koestler, D. C., Christensen, B. C., Marsit, C. J., Nelson, H. H., et al. (2012). DNA methylation arrays as surrogate measures of cell mixture distribution. BMC Bioinforma. 13, 86. doi:10.1186/1471-2105-13-86
Houseman, E. A., Kile, M. L., Christiani, D. C., Ince, T. A., Kelsey, K. T., and Marsit, C. J. (2016). Reference-free deconvolution of DNA methylation data and mediation by cell composition effects. BMC Bioinforma. 17, 259. doi:10.1186/s12859-016-1140-4
Jaffe, A. E., and Irizarry, R. A. (2014). Accounting for cellular heterogeneity is critical in epigenome-wide association studies. Genome Biol. 15, R31. doi:10.1186/gb-2014-15-2-r31
Johnson, W. E., Li, C., and Rabinovic, A. (2007). Adjusting batch effects in microarray expression data using empirical Bayes methods. Biostatistics 8, 118–127. doi:10.1093/biostatistics/kxj037
Kang, K., Meng, Q., Shats, I., Umbach, D. M., Li, M., Li, Y., et al. (2019). CDSeq: a novel complete deconvolution method for dissecting heterogeneous samples using gene expression data. PLoS Comput. Biol. 15, e1007510. doi:10.1371/journal.pcbi.1007510
Kikuchi, J., Hashizume, M., Kaneko, Y., Yoshimoto, K., Nishina, N., and Takeuchi, T. (2015). Peripheral blood CD4(+)CD25(+)CD127(low) regulatory T cells are significantly increased by tocilizumab treatment in patients with rheumatoid arthritis: increase in regulatory T cells correlates with clinical response. Arthritis Res. Ther. 17, 10. doi:10.1186/s13075-015-0526-4
Li, Z., Guo, Z., Cheng, Y., Jin, P., and Wu, H. (2020). Robust partial reference-free cell composition estimation from tissue expression. Bioinformatics 36, 3431–3438. doi:10.1093/bioinformatics/btaa184
Li, Z., and Wu, H. (2019). TOAST: improving reference-free cell composition estimation by cross-cell type differential analysis. Genome Biol. 20, 190. doi:10.1186/s13059-019-1778-0
Li, Z., Wu, Z., Jin, P., and Wu, H. (2019). Dissecting differential signals in high-throughput data from complex tissues. Bioinformatics 35, 3898–3905. doi:10.1093/bioinformatics/btz196
Liu, Y., Aryee, M. J., Padyukov, L., Fallin, M. D., Hesselberg, E., Runarsson, A., et al. (2013). Epigenome-wide association data implicate DNA methylation as an intermediary of genetic risk in rheumatoid arthritis. Nat. Biotechnol. 31, 142–147. doi:10.1038/nbt.2487
Lutsik, P., Slawski, M., Gasparoni, G., Vedeneev, N., Hein, M., and Walter, J. (2017). MeDeCom: discovery and quantification of latent components of heterogeneous methylomes. Genome Biol. 18, 55. doi:10.1186/s13059-017-1182-6
Marusyk, A., Almendro, V., and Polyak, K. (2012). Intra-tumour heterogeneity: a looking glass for cancer? Nat. Rev. Cancer 12, 323–334. doi:10.1038/nrc3261
Montano, C. M., Irizarry, R. A., Kaufmann, W. E., Talbot, K., Gur, R. E., Feinberg, A. P., et al. (2013). Measuring cell-type specific differential methylation in human brain tissue. Genome Biol. 14, R94. doi:10.1186/gb-2013-14-8-r94
Newman, A. M., Liu, C. L., Green, M. R., Gentles, A. J., Feng, W., Xu, Y., et al. (2015). Robust enumeration of cell subsets from tissue expression profiles. Nat. Methods 12, 453–457. doi:10.1038/nmeth.3337
Rahmani, E., Schweiger, R., Shenhav, L., Wingert, T., Hofer, I., Gabel, E., et al. (2018). BayesCCE: a Bayesian framework for estimating cell-type composition from DNA methylation without the need for methylation reference. Genome Biol. 19, 141. doi:10.1186/s13059-018-1513-2
Rahmani, E., Zaitlen, N., Baran, Y., Eng, C., Hu, D., Galanter, J., et al. (2017). Correcting for cell-type heterogeneity in DNA methylation: a comprehensive evaluation. Nat. Methods 14, 218–219. doi:10.1038/nmeth.4190
Reinius, L. E., Acevedo, N., Joerink, M., Pershagen, G., Dahlen, S. E., Greco, D., et al. (2012). Differential DNA methylation in purified human blood cells: implications for cell lineage and studies on disease susceptibility. PLoS One 7, e41361. doi:10.1371/journal.pone.0041361
Repsilber, D., Kern, S., Telaar, A., Walzl, G., Black, G. F., Selbig, J., et al. (2010). Biomarker discovery in heterogeneous tissue samples -taking the in-silico deconfounding approach. BMC Bioinforma. 11, 27. doi:10.1186/1471-2105-11-27
Ribas, A., and Wolchok, J. D. (2018). Cancer immunotherapy using checkpoint blockade. Science 359, 1350–1355. doi:10.1126/science.aar4060
Riboli, E., Hunt, K. J., Slimani, N., Ferrari, P., Norat, T., Fahey, M., et al. (2002). European Prospective Investigation into Cancer and Nutrition (EPIC): study populations and data collection. Public Health Nutr. 5, 1113–1124. doi:10.1079/PHN2002394
Shen-Orr, S. S., Tibshirani, R., Khatri, P., Bodian, D. L., Staedtler, F., Perry, N. M., et al. (2010). Cell type-specific gene expression differences in complex tissues. Nat. Methods 7, 287–289. doi:10.1038/nmeth.1439
Sturm, G., Finotello, F., Petitprez, F., Zhang, J. D., Baumbach, J., Fridman, W. H., et al. (2019). Comprehensive evaluation of transcriptome-based cell-type quantification methods for immuno-oncology. Bioinformatics 35, i436–i445. doi:10.1093/bioinformatics/btz363
Teschendorff, A. E., Breeze, C. E., Zheng, S. C., and Beck, S. (2017). A comparison of reference-based algorithms for correcting cell-type heterogeneity in Epigenome-Wide Association Studies. BMC Bioinforma. 18, 105. doi:10.1186/s12859-017-1511-5
Wang, X., Park, J., Susztak, K., Zhang, N. R., and Li, M. (2019). Bulk tissue cell type deconvolution with multi-subject single-cell expression reference. Nat. Commun. 10, 380. doi:10.1038/s41467-018-08023-x
Xu, K. C., Lu, Y., Hou, S. Y., Liu, K. A., Du, Y. H., Huang, M. Q., et al. (2024). Detecting anomalous anatomic regions in spatial transcriptomics with STANDS. Nat. Commun. 15, 8223. doi:10.1038/s41467-024-52445-9
Yadav, V. K., and De, S. (2015). An assessment of computational methods for estimating purity and clonality using genomic data derived from heterogeneous tumor tissue samples. Brief. Bioinform 16, 232–241. doi:10.1093/bib/bbu002
Zhang, W., Li, Z., Wei, N., Wu, H. J., and Zheng, X. (2020). Detection of differentially methylated CpG sites between tumor samples with uneven tumor purities. Bioinformatics 36, 2017–2024. doi:10.1093/bioinformatics/btz885
Zhang, W., Wu, H., and Li, Z. (2021). Complete deconvolution of DNA methylation signals from complex tissues: a geometric approach. Bioinformatics 37, 1052–1059. doi:10.1093/bioinformatics/btaa930
Zheng, S. C., Beck, S., Jaffe, A. E., Koestler, D. C., Hansen, K. D., Houseman, A. E., et al. (2017). Correcting for cell-type heterogeneity in epigenome-wide association studies: revisiting previous analyses. Nat. Methods 14, 216–217. doi:10.1038/nmeth.4187
Zheng, S. J. C., Breeze, C. E., Beck, S., and Teschendorff, A. E. (2018). Identification of differentially methylated cell types in epigenome-wide association studies. Nat. Methods 15, 1059–1066. doi:10.1038/s41592-018-0213-x
Zheng, X., Zhang, N., Wu, H. J., and Wu, H. (2017). Estimating and accounting for tumor purity in the analysis of DNA methylation data from cancer studies. Genome Biol. 18, 17. doi:10.1186/s13059-016-1143-5
Keywords: reference-free deconvolution, feature selection, cross-cell-type differential analysis, cell compositions, gene expression, DNA methylation
Citation: Zhang W, Tian Z and Peng L (2025) Reference-free deconvolution of complex samples based on cross-cell-type differential analysis: Systematic evaluations with various feature selection options. Front. Genet. 16:1570781. doi: 10.3389/fgene.2025.1570781
Received: 04 February 2025; Accepted: 05 May 2025;
Published: 30 May 2025.
Edited by:
Angelo Facchiano, National Research Council (CNR), ItalyReviewed by:
Xiaoxiao Sun, University of Arizona, United StatesXiaobo Sun, Zhongnan University of Economics and Law, China
Eugenio Del Prete, Telethon Institute of Genetics and Medicine (TIGEM), Italy
Copyright © 2025 Zhang, Tian and Peng. This is an open-access article distributed under the terms of the Creative Commons Attribution License (CC BY). The use, distribution or reproduction in other forums is permitted, provided the original author(s) and the copyright owner(s) are credited and that the original publication in this journal is cited, in accordance with accepted academic practice. No use, distribution or reproduction is permitted which does not comply with these terms.
*Correspondence: Weiwei Zhang, d3d6aGFuZ0B1c2MuZWR1LmNu