 Heewon Park
 Seiya Imoto3
- 1School of Mathematics, Statistics and Data Science, Sungshin Women’s University, Seoul, Republic of Korea
- 2Data Science Center, Sungshin Women’s University, Seoul, Republic of Korea
- 3Human Genome Center, Institute of Medical Science, University of Tokyo, Bunkyo, Japan
- 4M&D Data Science Center, Institute of Science Tokyo, Tokyo, Japan
- 5Department of Mathematics, Faculty of Science and Engineering, Chuo University, Hachioji, Japan
Identifying individual genomic characteristics is a critical focus in personalized therapies. To reveal targets in such therapies, we considered personalized gene network analysis using kernel-based
1 Introduction
In recent years, significant attention has been paid to the identification of individual genomic characteristics, particularly with the growing focus on personalized therapy across various research areas, such as statistics, bioinformatics, and medical science. Heterogeneous genetic network analysis is attracting growing interest, as it provides crucial targets for personalized therapy because diseases are typically caused by perturbations in complex molecular interactions rather than by isolated genetic defects (Ahmed et al., 2020). Various computational and statistical methods have been developed to reveal the molecular interactions associated with disease mechanisms, such as Bayesian networks (Imoto et al., 2002), graphical lasso (Huang et al., 2020) and
To address this issue, Shimamura et al. (2011) proposed the use of a kernel-based
Kernel-based
Figure 1 shows schematic of the proposed strategy for personalized gene network analysis.
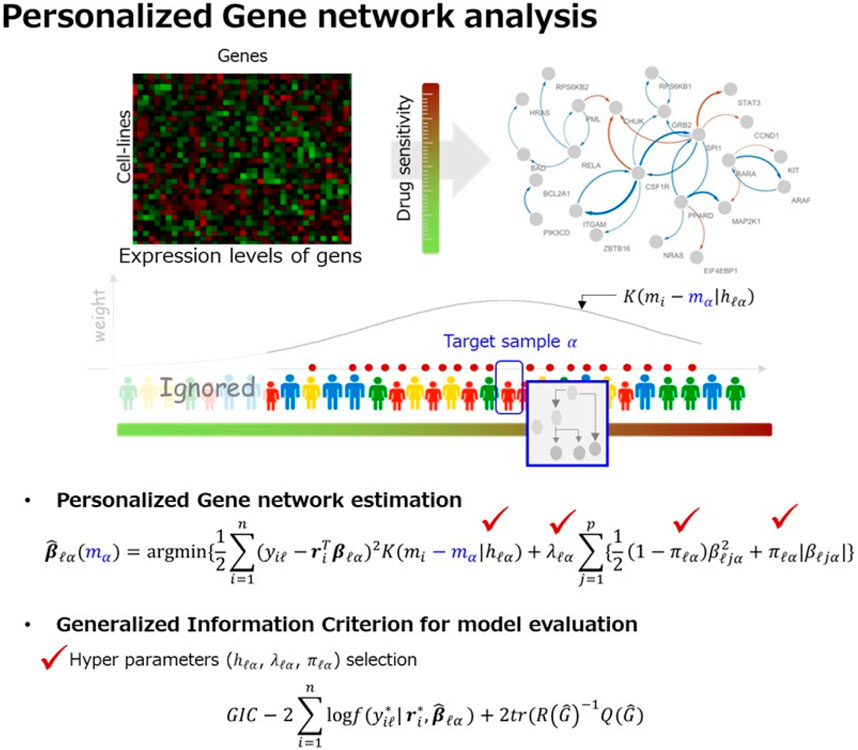
Figure 1. Overview of our strategy for personalized gene network analysis. By using the
Monte Carlo simulations are conducted to illustrate the performance of the proposed strategy. The simulation results showed that the proposed GIC outperformed other model evaluation criteria for edge selection in a personalized gene network analysis. Furthermore, our strategy showed effective results for edge weight estimation. We applied the proposed GIC to the Sanger Genomics of Drug Sensitivity in Cancer (GDSC) dataset and performed drug sensitivity-specific gene network analysis for the FDA-approved acute myeloid leukemia (AML) drugs, i.e., doxorubicin, midostaurin, quizartinib, and cytarabine, where drug sensitivity is considered a characteristic of cell lines. In the AML drug sensitivity-specific gene network analysis, our strategy also showed effective results for network estimation. We then identified AML drug resistant- and sensitive-specific molecular interactions. Our results revealed the activity of PIK3CD and RARA/RELA in AML drug-sensitive- and resistant-specific molecular interactions. The identified markers were validated through literature as therapeutic targets for AML. Based on our findings and the existing literature, we suggest that suppression of the identified AML drug resistant-specific markers (i.e., RARA and RELA) and activation of the sensitivity-specific marker (i.e., PIK3CD) may offer essential guidance for improving chemotherapy.
The proposed strategy was also applied to dataset obtained from the Cancer Dependency Map (DepMap) Portal (https://depmap.org/portal/) and we performed gastric cancer drug sensitivity-specific gene network analysis. Our result uncovered FGF16, FGF6, CSNK1A1L and WNT1 as personalized therapeutic targets of gastric cancer.
Personalized medicine enables more precise treatments, early prevention strategies, patient-centered care, and potential cost reductions, which has driven extensive research efforts aimed at improving therapeutic outcomes across diverse medical fields. In statistics and computational biology areas, numerous studies have been conducted to provide data-driven evidences for personalized medicine. The kernel-based
2 Methods
2.1 Personalized gene network analysis
Let
The following linear regression model is used to describe the molecular interactions between genes:
where
Figure 2 shows the correlations between two genes (i.e., LEF1 and RUNX1) that vary depending on AML drug sensitivity (i.e., as a characteristic of cell line), where the top left, top right, bottom left, and bottom right indicate the correlations between genes in all cell lines as well as drug-sensitive, moderate, and drug-resistant cell lines, respectively. As shown in Figure 2, the correlations between genes showed different patterns in the drug-sensitive and drug-resistant cell lines. However, the correlations in all cell lines did not capture drug sensitivity-specific patterns of association between the genes. This implies that gene regulatory networks should be estimated by considering the characteristics of the cell lines.
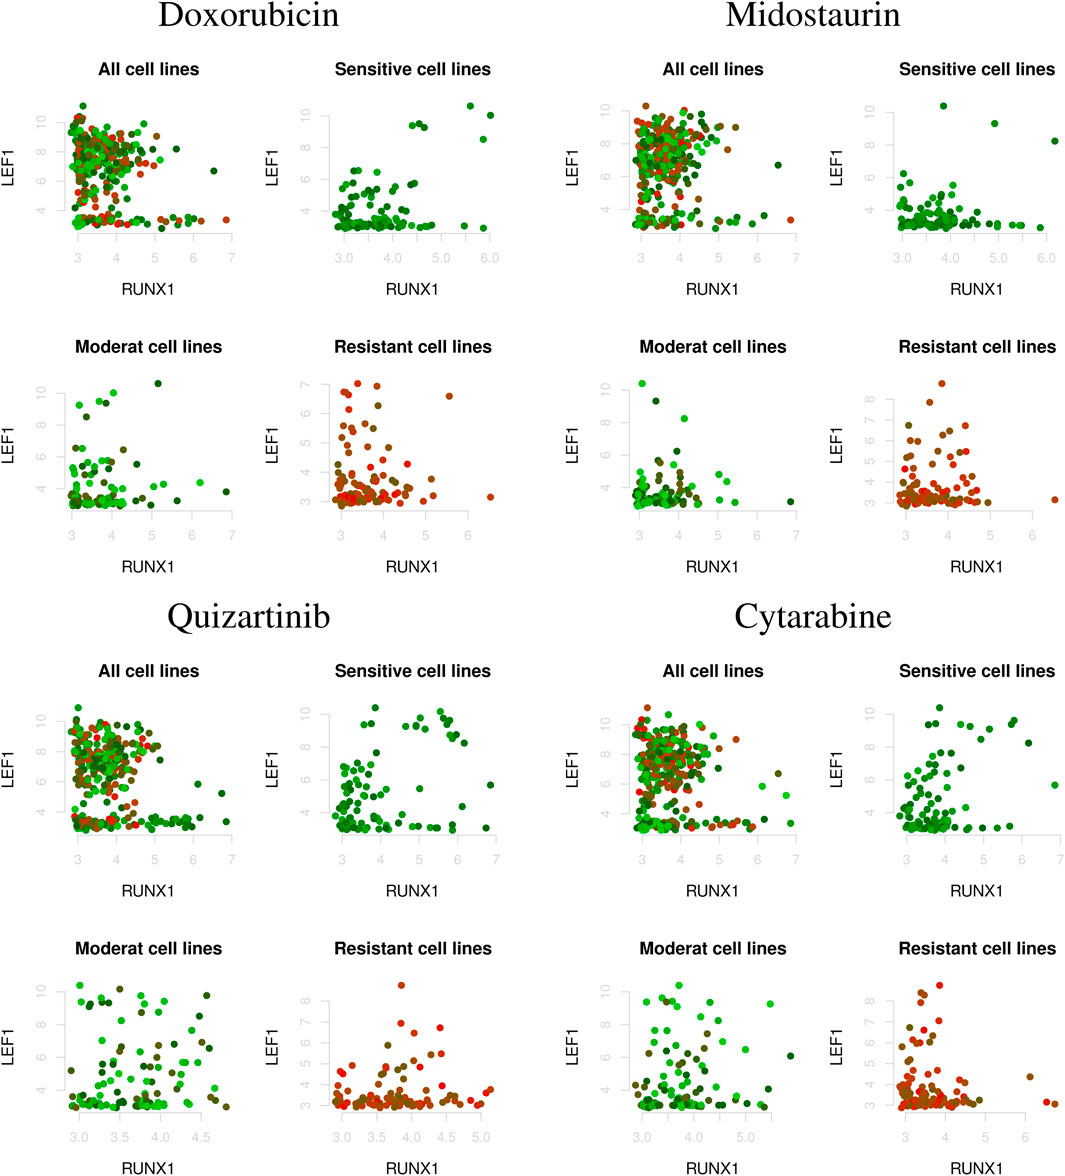
Figure 2. Correlations between two genes (i.e., LEF1 and RUNX1) under varying AML drug sensitivities; i.e., Z-score of IC50 values (top left: all cell lines; top right: drug-sensitive cell lines; bottom left: moderate-sensitive cell lines; bottom right: drug-resistant cell lines). The red and green dots indicate drug resistant and sensitive cell lines, respectively.
To address this issue and estimate a personalized gene network, we considered the following varying coefficient model (Hastie and Tibshirani, 1993),
where
Shimamura et al. (2011) proposed the use of kernel-based
where
where
is a Gaussian kernel function with the bandwidth
2.2 Generalized information criteria for personalized gene network analysis
In personalized gene network analysis based on kernel-based
In previous studies, cross-validation (CV) or traditional information criteria, e.g., AIC and BIC, have often been used to select the regularization parameters and bandwidth. However, CV leads to time-consuming results; in particular, personalized gene network analysis is based on n estimations of a model for each
In this study, we considered the generalized information criterion (GIC) for model evaluation of personalized gene network analysis (i.e.,
• The model is estimated by the maximum likelihood method.
• The estimation is carried out in a parametric family of distributions including the true model.
Thus, the GIC enables us to properly evaluate models estimated using various methodologies, not only the maximum likelihood method.
We derived a GIC for personalized gene network analysis based on a kernel-based
where
and where
In the derivative of the GIC, the calculation of an influence function is crucial, where the second-order differentiable functional estimator
However, the estimator
Suppose that we provide an initial value
when
This implies that the estimator
To derive the following influence function
We substitute
We then differentiate both sides of Equation 9 with respect to
and set
Consequently, the influence function
Thus, the bias correction term in GIC for personalized gene network estimation is given as the following Equation 12,
By replacing the unknown distribution
where
and where
and
Personalized gene network analysis is based on the selected tuning parameters
3 Monte Carlo simulation
Monte Carlo simulations were conducted to illustrate the performance of the proposed GIC in personalized gene network analysis.
Gene expression data were simulated under assumed personalized networks that varied depending on the characteristics of the samples. The expression levels of
where
We considered a sample size
• Scenario 1:
• Scenario 2:
• Scenario 3:
• Scenario 4:
Scenarios 1 and 2 (3 and 4) represent positive (negative) edge weights; that is, the strength of the effects of activators (inhibitors) on their target genes, where edge weights that vary greatly depending on the modulator values (i.e.,
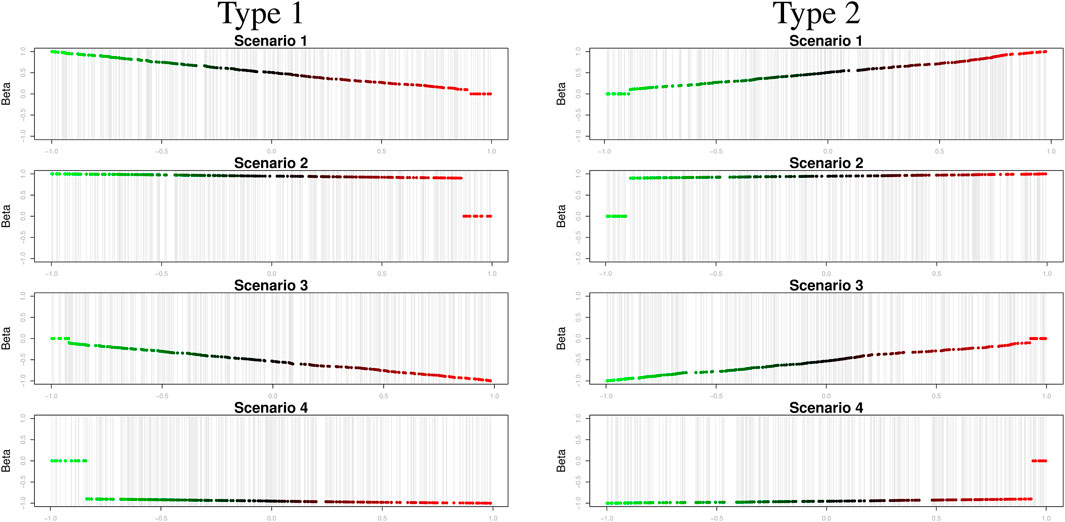
Figure 3. Varying coefficients to describe sample-specific edge weights.
We considered the number of genes consisting of networks
The performance of the proposed model evaluation criterion (i.e., GIC) for personalized gene network analysis was evaluated by comparing it with CV and traditional information criteria, including AIC, BIC, Akaike’s second-order corrected Information Criterion (AICc) (Hurvich and Tsai, 1989), and the Hannah and Quinn Criterion (HQC) (Hannan and Quinn, 1979). CV was implemented using the R package glmnet (Friedman et al., 2024) and traditional information criteria were implemented using the R packageHDeconometrics (Gabriel, 2016).We also show the evaluate results by the recently developed model evaluation criteria, i.e., extended BIC (EBIC) (Chen et al., 2022) and high-dimensional BIC (BIC-p) (Nan and Yang, 2014). The evaluation was conducted based on the accuracies of edge selection, including true positive (TP), true negative (TN), and their average values, based on 100 iterations. Table 1 lists the edge selection results, where bold numbers indicate the most effective performance among the model evaluation criteria.
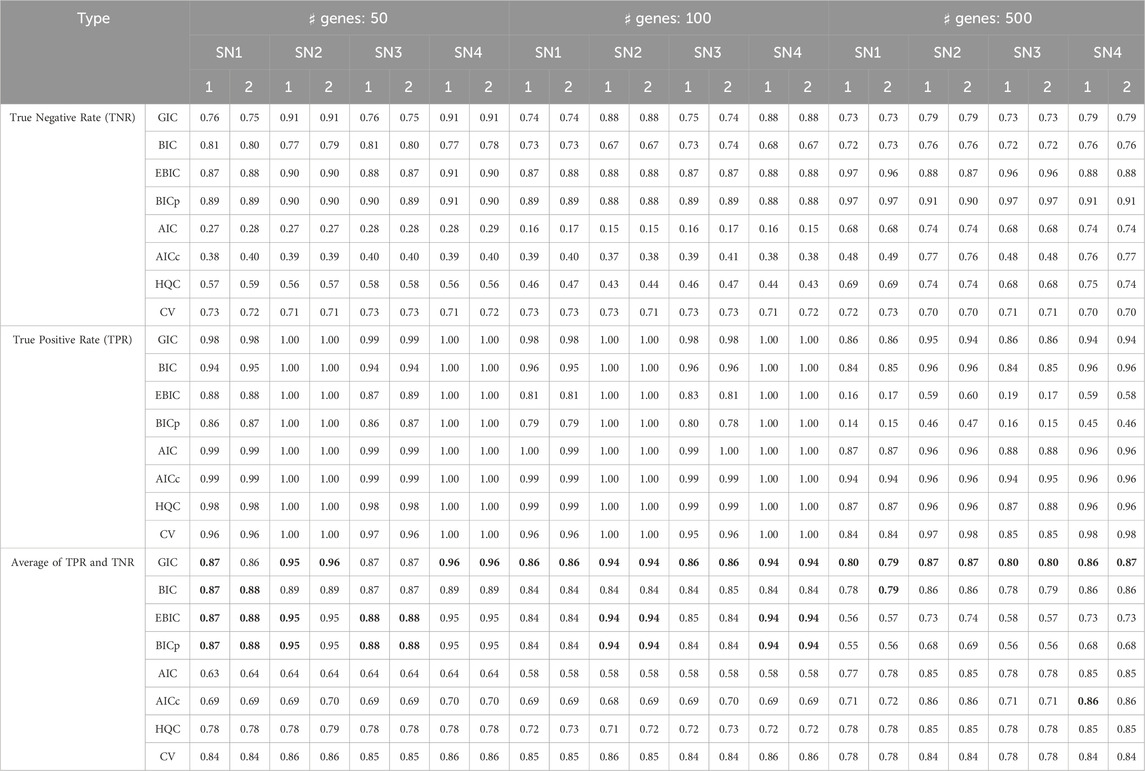
Table 1. Accuracy of edge selection (true negative rate, true positive rate, and their average values), where bold numbers indicate the best performance among the model evaluation criteria, where “SN
As shown in Table 1, the proposed GIC and BIC-type criteria (BIC, EBIC, BIC-p) provide outstanding edge selection performance in personalized gene network analysis. Although EBIC and BIC-p show effective results, the methods cannot perform well for edge selection in high-dimensional situations (i.e.,
We also evaluated the accuracy of edge weight estimation based on the mean absolute error (MAE) of
where
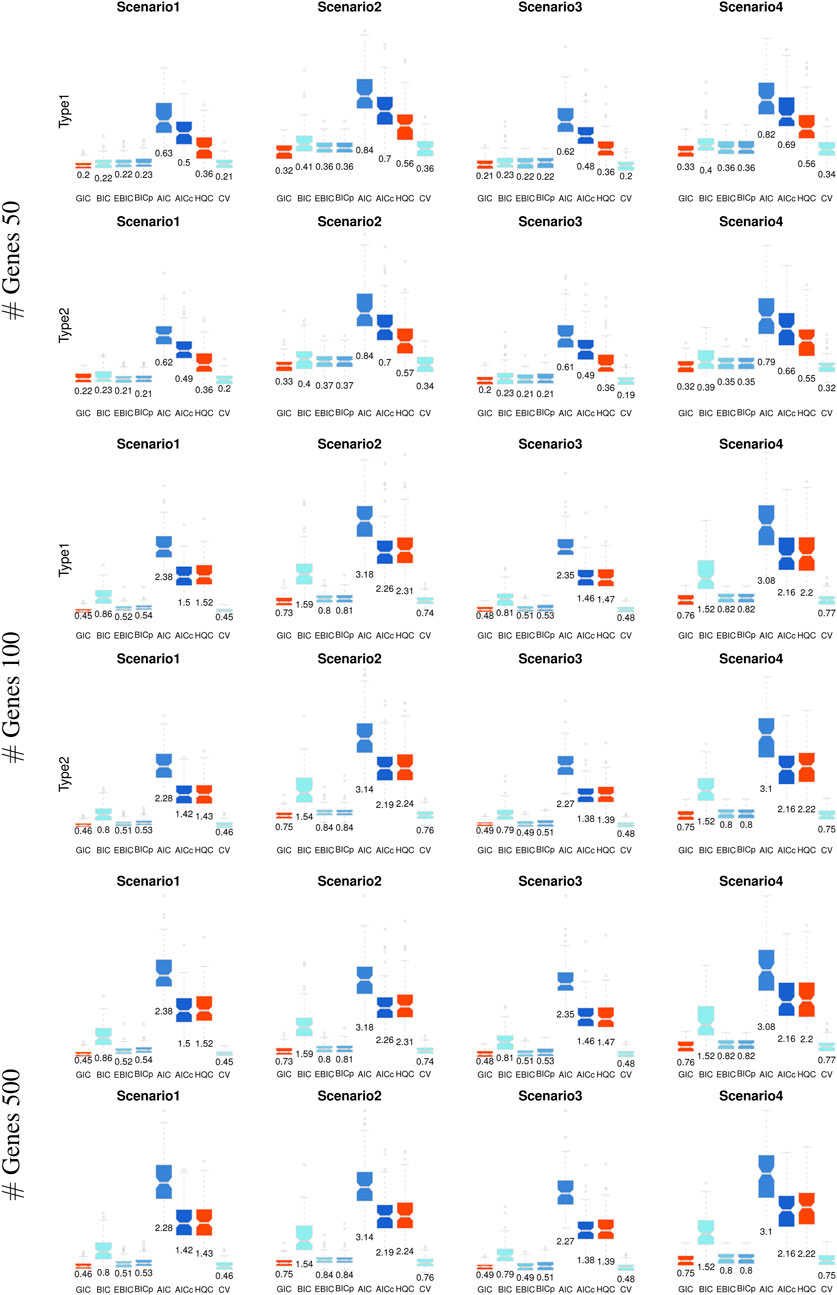
Figure 4. Mean absolute error of the edge weight estimation in personalized gene network analysis.
We also evaluated computational efficacy of the proposed GIC by compared with the CV. The varying coefficient model in Equation 2 for various data dimensional situations was considered, i.e., various number of regulator genes

Table 2. Computational costs in seconds for the kernel-based
As shown in Table 2, the proposed GIC provides computational cost-effective results compared with the CV. The challenge in computational complexity of GIC was computational of inverse matrix of
In summary, the proposed GIC effectively performed edge selection in personalized gene network analysis and provided efficient results for edge weight estimation. We expect that the proposed GIC will be a useful tool for model evaluation in personalized gene network analysis.
4 Anticancer drug sensitivity-specific gene network analysis
4.1 Acute myeloid leukemia drug sensitivity-specific gene network analysis
We applied the proposed GIC to AML drug sensitivity-specific gene network analysis. AML is a deadly hematopoietic malignancy characterized by the malignant proliferation of myeloid stem/progenitor cells (Culver-Cochran et al., 2024; Niu et al., 2022) Although the primary treatment for AML involves chemotherapy, acquired drug resistance in AML cell lines is a critical issue that leads to ineffective chemotherapy. Thus, uncovering the mechanisms underlying acquired AML drug resistance has been recognized as a critical problem. To uncover these mechanisms, we performed drug sensitivity-specific gene network analysis. We used the publicly available “Sanger Genomics of Drug Sensitivity in Cancer (GDSC) dataset from the Cancer Genome Project.” The gene expression and drug sensitivity data (i.e., the half-maximal inhibitory concentration (IC50) and its Z-score) were obtained from the GDSC dataset (https://www.cancerrxgene.org/). We considered four FDA-approved AML drugs, namely, doxorubicin, midostaurin, quizartinib, and cytarabine, which have sensitivity values in the GDSC dataset. We then considered 68 genes involved in the pathway “Acute myeloid leukemia (hsa05221)” of the KEGG pathway database (https://www.genome.jp/kegg/pathway.htm). For the 36 genes involved in the AML pathway that existed in the GDSC data, we extracted the expression levels of 300 randomly selected cell lines, including resistant (greater than
4.1.1 Evaluation
We first evaluated the performance of the proposed GIC based on an AML drug sensitivity-specific gene network analysis in which the Z-score of the IC50 value was used as a characteristic of the cell lines (i.e., modulator). Drug sensitivity-specific gene networks were estimated for a randomly selected set of each five sensitive, resistant, and moderately sensitive cell lines. We then evaluated the gene network estimation error, namely, the mean square error (MSE) of estimating the expression levels of the target genes based on the varying coefficient model (Equation 2). Figure 5 presents the average MSE over 50 iterations.
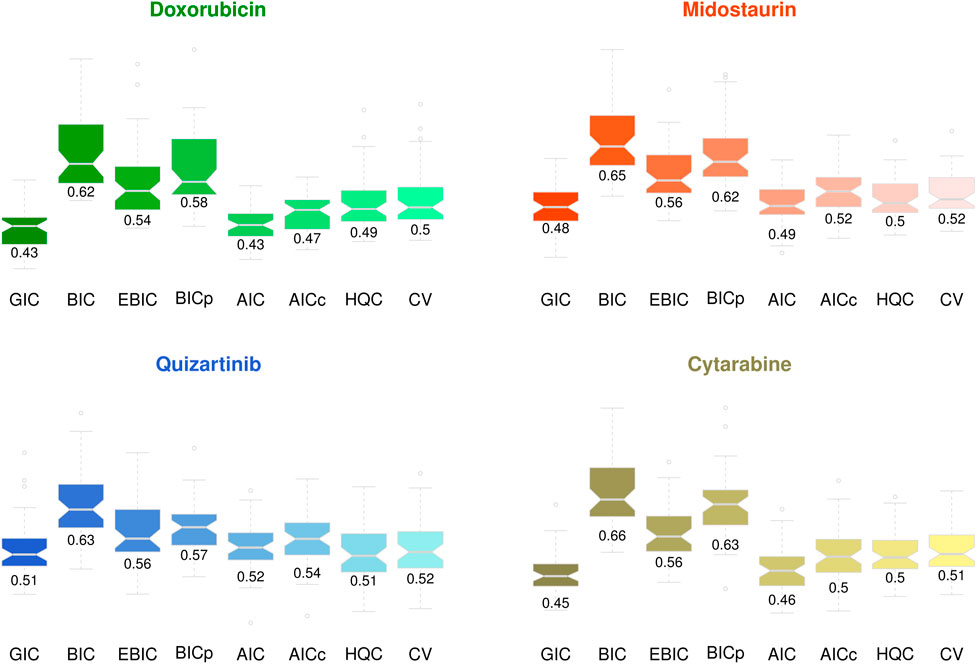
Figure 5. AML drug sensitivity-specific gene network estimation errors.
For doxorubicin, midostaurin, and cytarabine sensitivity-specific gene network analyses, the proposed GIC showed outstanding performance compared with that of other model evaluation criteria, whereas AIC also showed effective results in the quizartinib sensitivity-specific gene network estimation. Although there was no significant difference between the accuracies of the model selection criteria, the proposed GIC showed effective results in AML drug-specific gene network analysis.
4.1.2 Uncovering AML drug resistant-specific molecular interactions
To uncover AML drug resistant-specific molecular interactions, we estimated drug sensitivity-specific gene networks for 100 randomly selected resistant and sensitive cell lines.
The medians of edge weights were computed for the 100 gene networks of 100 resistant cell lines. We then computed the means of the edge weights using four median edge weights from doxorubicin, midostaurin, quizartinib and cytarabine sensitivity-specific gene networks, where edges having non-zero median edge weights in the networks of the four drugs were only extracted. We defined the network based on the computed edge weights as the AML drug resistant-specific gene network. A similar process was conducted for the AML drug sensitivity-specific gene network.
Figure 6 shows the estimated AML drug-resistant- and sensitive-specific gene networks, where we considered only the largest 5% absolute edge weights for effective visualization.
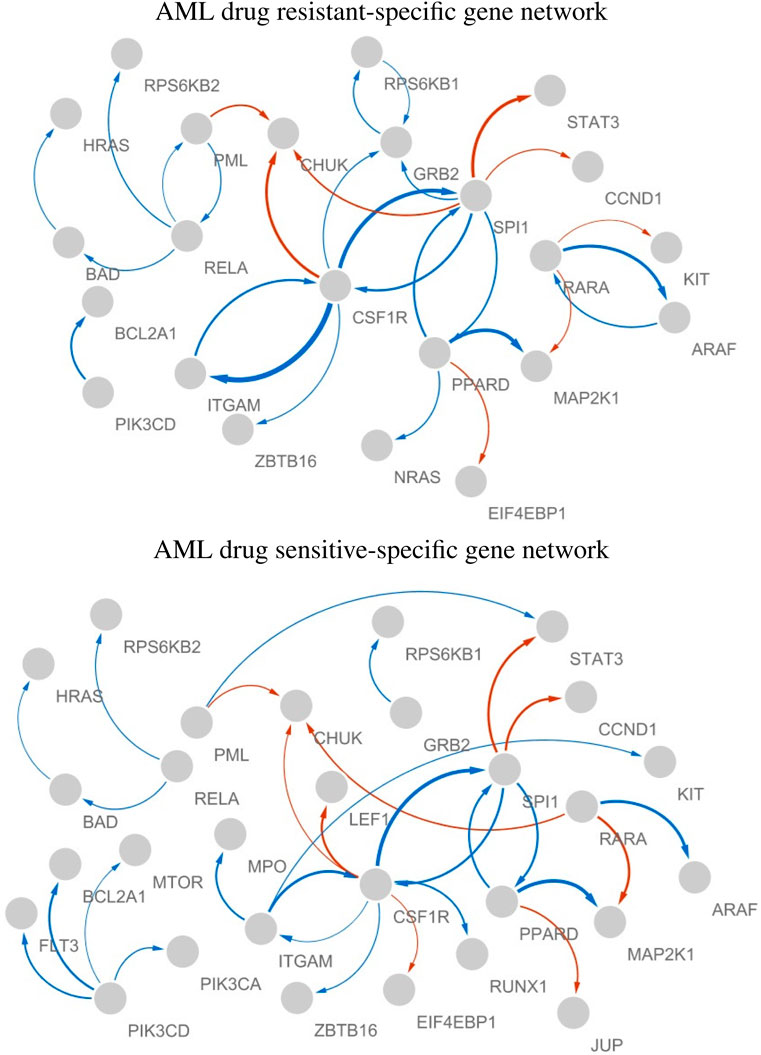
Figure 6. AML drug resistant- and sensitive-specific gene networks, where edge color indicates sign of the effect (red and blue are “-” and “+,” respectively), thickness represents the strength of the edge, and arrows (X
In both AML drug resistant- and sensitive-specific gene networks, CSF1R, SPI1, and PPARD played key roles as hub genes. The activity of PIK3CD can be considered a drug sensitive-specific molecular interaction, whereas its activity becomes weaker in resistant cell lines. The hubness of RARA and RELA were AML drug resistant-specific molecular characteristic. Thus, CSF1R, SPI1, PPARD, PIK3CD, RARA, and RELA can be considered crucial biomarkers associated with the mechanisms of AML drug sensitivity. The markers identified in our analysis have been identified as crucial biomarkers of AML in literature, especially previous studies identified some markers as therapeutic targets of AML as follows.
• CSF1R (Common marker) According to Edwards et al. (2019), inhibition of CSF1R, a receptor tyrosine kinase essential for the survival, proliferation, and differentiation of myeloid-lineage cells, demonstrated sensitivity. They identified CSF1R as a promising therapeutic target for AML and described its involvement in paracrine cytokine/growth factor signaling within this condition. CSF1R was suggested as an important target for sunitinib and related drugs (Kogan et al., 2012).
• SPI1 (Common marker) Xiong et al. (2023) demonstrated that reduced circ-SPI1 expression correlates with lower white blood cell counts, favorable risk profiles, and enhanced therapy response, while its decrease during therapy independently predicts prolonged event-free and overall survival in patients with AML.
• PPARD (Common marker) Lymboussaki et al. (2009) identified PPARD as a negative regulator of vitamin D3-induced monocyte differentiation, leading to the hypothesis that plays a role in the differentiation block observed in M5-type AML.
• PIK3CD (Sensitive specific marker) Mutations in the AKT3 and PIK3CD genes were frequently observed in de novo Philadelphia chromosome-positive AML, highlighting the significant role of PIK3CD in cell proliferation and its potential as a therapeutic target for AML (Follo et al., 2019).
• RARA (Resistant specific marker) de Botton et al. (2023) suggested that utilizing tamibarotene-based treatment in patients with AML or MDS and RARA overexpression might provide a personalized approach to achieving better therapeutic results. Fiore et al. (2020) suggested that SY-1425 plus azacitidine could serve as a novel targeted treatment option for RARA + newly diagnosed unfit AML, particularly for patients resistant to venetoclax-based standard-of-care therapy, warranting further exploration in this specific genomic subset. Stein et al. (2023) demonstrated that combining tamibarotene and azacitidine yielded a high response rate and rapid response onset with an associated favorable tolerability profile in newly diagnosed unfit patients with AML and RARA overexpression.
• RELA (Resistant specific marker)
RELA and PARP1 establish a positive feedback loop for DNA damage repair in AML cells, and inhibiting both NF-
To reveal the biological pathways and functions involved in AML drug resistant- and sensitive-specific gene networks, we performed gene enrichment analysis using the bioinformatics tool Database for Annotation, Visualization, and Integrated Discovery (DAVID) (Dennis et al., 2003). Gene Ontology (GO) analysis was performed using the categories “Molecular Function,” “Cellular Component,” and “Biological Processes.” The genes comprising the drug resistant- and sensitive-specific gene networks were used as inputs for GO term pathway analysis. Figure 7 shows the five most significant pathways with

Figure 7. Gene Ontology analysis of AML drug resistant- and sensitive-specific gene networks.
As shown in Figure 7, the AML drug resistant and sensitive specific gene networks involve different biological pathways. The drug resistant-specific gene network was enriched in the Cytosol Positive regulation of DNA-templated transcription, Signal transduction and Negative regulation of cell population proliferation pathways. In contrast, Positive regulation of gene expression, insulin-like growth factor receptor signaling pathway and Vascular endothelial growth factor signaling pathway were identified as GO terms enriched in drug sensitive-specific gene networks. Furthermore, Negative regulation of apoptotic process and Positive regulation of DNA-templated transcription were identified as common GO terms enriched in both the drug resistant and sensitive specific gene networks.
Our results suggest that suppression of the identified AML drug resistant-specific markers (i.e., RARA and RELA) and activation of the sensitive-specific marker (i.e., PIK3CD) may be powerful means of improving chemotherapy efficacy in AML. Additionally, controlling the revealed AML drug resistant- and sensitive-specific pathways may help overcome drug resistance in AML.
4.2 Gastric cancer drugs sensitivity-specific gene network analysis
We also applied our strategy for gastric cancer drugs sensitivity-specific gene network analysis. We used the dataset obtained from the Cancer Dependency Map (DepMap) Portal (https://depmap.org/portal/), where the RNA expression levels were from the Cancer Cell Line Encyclopedia (CCLE) dataset and drug sensitivity measurements were obtained from the PRISM repurposing primary screen (https://depmap.org/repurposing). For the 148 genes involved in the gastric cancer pathway (i.e., “Gastric cancer” (hsa05226) of KEGG database) that existed in the CCLE data, we extracted the expression levels of 100 randomly selected cell lines. We focused on FDA approved gastric cancer drugs, 5-Fluorouracil, Capecitabine, Docetaxel, Doxorubicin, and Mitomycin-c. In the gastric cancer drugs sensitivity-specific gene network analysis, we consider a module of the drug sensitivities that describes common features of five drugs sensitivities. We then extracted the module of the gastric cancer drugs, i.e., we computed the first principal component of the drug sensitivities of 5 drugs. We then performed the gastric cancer drugs module-specific gene network analysis.
4.2.1 Evaluation
We first evaluated our strategy based on MSE of the estimating expression levels of target genes, where randomly selected 10 samples having 5 largest and 5 smallest module values are considered as target samples. Our strategy was applied to hyper parameter selection in the kernel based
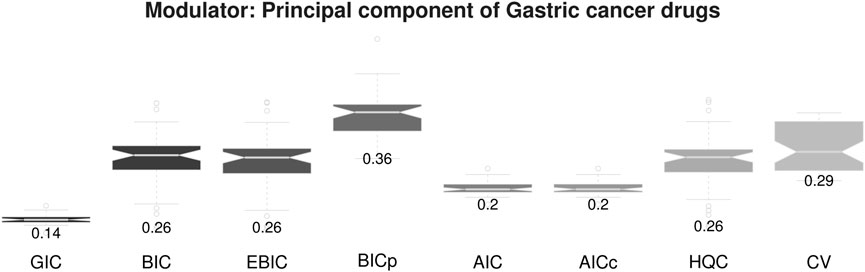
Figure 8. Gastric cancer drugs module sensitivity-specific gene network estimation errors.
The proposed sample-specific GIC also provides outstanding performance for personalized gene network estimation. Furthermore, our strategy shows stables results compared with other methods, i.e., low variance of MSE. The result implies that the proposed method is a useful tool for personalized gene network analysis.
4.2.2 Gastric cancer drugs sensitivity-specific molecular interplays
We aim to uncover gastric cancer markers, i.e., candidate chemotherapy targets that have drug sensitivity specific molecular interplays. From the gastric cancer drug sensitivity module-specific gene networks, we computed effect change of regulator genes on their target gene according to ten modulator values, called a regulate effect. The regulate effect changes are computed as range of varying coefficients for 10 modules values. Figure 9 present the regulator effect changes of regulator genes on their target genes, where the numbers indicate total regulator effects for all target genes.
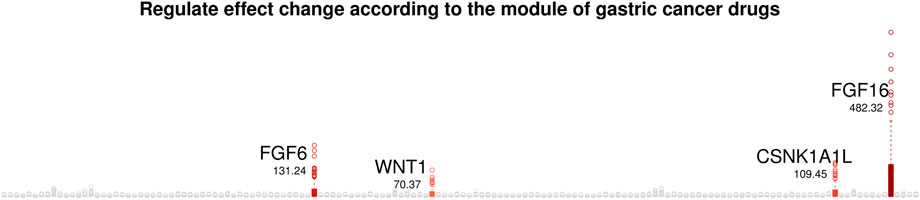
Figure 9. Regulate effect change of regulator genes according to the module of gastric cancer drugs.
We focus on four genes, FGF16, FGF6, CSNK1A1L and WNT1 that show the largest regulate effect changes according to the module values of gastric cancer drug sensitivity. That is, FGF16, FGF6, CSNK1A1L and WNT1 show gastric cancer drug module-specific molecular interplays, and thus can be considered as candidate chemotherapy targets of gastric cancer.
• FGF family (FGF16 and FGF6) Dysregulated FGF-FGFR signaling plays a major role in the onset of skeletal diseases and gastric cancer (Zhang et al., 2019). According to Zhang et al., 2021, FGF16 was found to be an immune-related gene with differential expression, significantly associated with overall survival in gastric cancer. Their study also highlighted the roles of NRP1, PPP3R1, IL17RA, and FGF16 in tumor progression and prognosis prediction.
• CSNK1A1L CSNK1A1L, implicated in the Wnt signaling cascade, has been suggested as a diagnostic and prognostic marker in gastric and ovarian cancers (Anderson et al., 2015; Yang et al., 2017; Seabra et al., 2014 further demonstrated that CSNK1A1L expression varies across tumor stages, with notable differences between T4 and T1–T3 stages.
• Wnt1 Dou et al. (2020) demonstrated that dysregulation of the cell cycle by Wnt1 plays a critical role in driving ovarian cancer development. The study by Wang and Gao (2021) revealed that H19 promotes ovarian cancer progression by sequestering miR-140, which in turn leads to Wnt1 upregulation and increased cell proliferation and migration. Li et al., 2023 found that WNT1 expression is significantly upregulated in gastric cancer tumors. Their findings also indicate that KLF3 may enhance tumor progression and metastasis by stimulating the WNT/
Figure 10 shows the most significant GO terms for the identified gastric therapeutic targets (i.e., FGF16, FGF6, CSNK1A1L and WNT1) and their target genes.
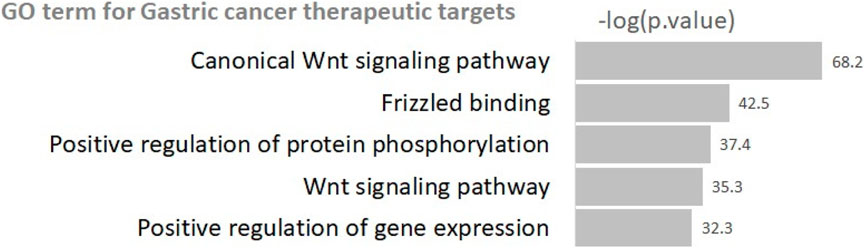
Figure 10. Gene Ontology terms for gastric cancer therapeutic targets.
The results indicate that the identified therapeutic targets are involved in Wnt signaling-related pathways (i.e., Wnt signaling pathway and Canonical W. signaling pathway). Abnormal regulation of Wnt pathway components has been observed in gastric cancer cells, contributing to uncontrolled cell growth, increased invasiveness and metastasis, poor clinical outcomes, and resistance to chemotherapy (Han et al., 2024). Furthermore, positive regulation-related terms (i.e., Positive regulation of gene expression and Positive regulation of protein phosphorylation) are also identified as GO terms enriched in the identified markers. It can be suggested through our results and literature survey that the identified genes (FGF16, FGF6, CSNK1A1L, WNT1) and Wnt signaling-related pathways provide crucial clue to chemotherapy efficacy of gastric cancer.
5 Discussion
In this study, we introduce a novel model evaluation tool for personalized gene network analysis. Although the kernel-based
To address these issues, we proposed a GIC for personalized gene network analyses. Because the GIC was derived by relaxing the assumptions that 1. The model was estimated using the maximum likelihood method and 2. The estimation was carried out in a parametric family of distributions, including the true model, it properly evaluated the models for personalized gene network analysis. To derive the GIC, we first focused on the objective function of the kernel-based
Monte Carlo simulations were conducted to demonstrate the performance of the proposed model evaluation strategy. Experiments with synthetic data demonstrated that the proposed GIC provided superior performance for edge selection in personalized gene network analysis. Furthermore, our strategy demonstrated effective results for edge weight estimation. We applied the proposed GIC to AML drug sensitivity-specific gene network analysis for FDA-approved AML drugs, including doxorubicin, midostaurin, quizartinib, and cytarabine. Our strategy yielded efficient network estimation results. From AML drug resistant- and sensitive-specific gene network analysis, we revealed that PIK3CD and RARA/RELA are sensitive- and resistant-specific markers, respectively. We suggest that RARA and RELA suppression and PIK3CD activation may provide crucial targets for improving chemotherapy efficacy in AML. We expect that the proposed strategy will be a useful tool not only for personalized gene network analysis, but also for various sample characteristic-specific analyses.
Although our strategy showed effective results for personalized gene network analysis, there are several limitations.
• Asymptotic bias of
• Applicability for categorical sample characteristic (e.g., tumor subtypes) analysis The proposed strategy cannot be applied to categorical sample characteristic (e.g., tumor subtypes) analysis, because the kernel-based
• Lack of experimental validation In this study, we identified CSF1R, SPI1, PPARD, PIK3CD, RARA, and RELA as crucial AML markers by data-driven strategy and the identified markers were validated through literature survey. However, the literature survey is not enough to support biological evidences of our results. Although our study focuses on a computational strategy for personalized gene network analysis, the lack of experimental validation can be considered as one of limitation of this study.
Although we performed personalized gene network analysis focused on the anti-cancer drug sensitivity of samples, our strategy can be extended to various sample characteristics-specific analysis with continuous sample characteristics (e.g., drug sensitivity, cancer progression, survival time). Especially in the medical field, survival analysis plays a pivotal role in examining how outcomes evolve over a period. We consider application of our strategy for survival time specific gene network analysis and uncovering crucial molecular interplays influencing survival time dynamics as one of future work of this study.
Data availability statement
The original contributions presented in the study are included in the article/supplementary material, further inquiries can be directed to the corresponding author.
Author contributions
HP: Conceptualization, Formal Analysis, Methodology, Project administration, Validation, Visualization, Writing – original draft, Writing – review and editing. SI: Supervision, Writing – review and editing. SK: Supervision, Writing – review and editing.
Funding
The author(s) declare that financial support was received for the research and/or publication of this article. This research was also supported by AMED under Grant Numbers 23tk0124003h0001 and 24tk0124003h0002 and JSPS KAKENHI Grant Number JP24H00009.
Acknowledgments
This study used Computational resources obtained from the Super Computer System, Human Genome Center, Institute of Medical Science, University of Tokyo, Japan.
Conflict of interest
The authors declare that the research was conducted in the absence of any commercial or financial relationships that could be construed as a potential conflict of interest.
Generative AI statement
The author(s) declare that no Generative AI was used in the creation of this manuscript.
Publisher’s note
All claims expressed in this article are solely those of the authors and do not necessarily represent those of their affiliated organizations, or those of the publisher, the editors and the reviewers. Any product that may be evaluated in this article, or claim that may be made by its manufacturer, is not guaranteed or endorsed by the publisher.
References
Ahmed, K. T., Park, S., Jiang, Q., Yeu, Y., Hwang, T., and Zhang, W. (2020). Network-based drug sensitivity prediction. BMC Med. Genom. 13 (Suppl. 11), 193. doi:10.1186/s12920-020-00829-3
Akaike, H. (1973). “Information theory and an extension of the maximum likelihood principle,” in 2nd international symposium on information theory Budapest: akademia kiado. Editors B. N. Petrov, and F. Csaki, 267–281. doi:10.1007/978-1-4612-1694-0-15
Anderson, K. S., Cramer, D. W., Sibani, S., Wallstrom, G., Wong, J., Park, J., et al. (2015). Autoantibody signature for the serologic detection of ovarian cancer. J. Proteome. Res. 14 (1), 578–586. doi:10.1021/pr500908n
Belanche, L. A., and Villegas, M. A. (2013). Kernel functions for categorical variables with application to problems in the life sciences art. Intel. Res. Dev. 256, 171–180. doi:10.3233/978-1-61499-320-9-171
Chen, Z., Zhang, J., Xu, W., and Yang, Y. (2022). Consistency of BIC model averaging. Stat. Sin. 32, 635–640. doi:10.5705/ss.202021.0145
Culver-Cochran, A. E., Hassan, A., Hueneman, K., Choi, K., Ma, A., VanCauwenbergh, B., et al. (2024). Chemotherapy resistance in acute myeloid leukemia is mediated by A20 suppression of spontaneous necroptosis. Nat. Commun. 15 (1), 9189. doi:10.1038/s41467-024-53629-z
de Botton, S., Cluzeau, T., Vigil, C., Cook, R. J., Rousselot, P., Rizzieri, D. A., et al. (2023). Targeting RARA overexpression with tamibarotene, a potent and selective RARα agonist, is a novel approach in AML. Blood. Adv. 7 (9), 1858–1870. doi:10.1182/bloodadvances.2022008806
Dennis, G., Sherman, B. T., Hosack, D. A., Yang, J., Gao, W., Lane, H. C., et al. (2003). DAVID: database for annotation, visualization, and integrated Discovery. Genome. Biol. 4, P3. doi:10.1186/gb-2003-4-5-p3
Dou, Y., Chen, F., Lu, Y., Qiu, H., and Zhang, H. (2020). Effects of wnt/β-catenin signal pathway regulated by miR-342-5p targeting CBX2 on proliferation, metastasis and invasion of ovarian cancer cells. Cancer Manag. Res. 12, 3783–3794. doi:10.2147/CMAR.S250208
Edwards, D. K., Watanabe-Smith, K., Rofelty, A., Damnernsawad, A., Laderas, T., Lamble, A., et al. (2019). CSF1R inhibitors exhibit antitumor activity in acute myeloid leukemia by blocking paracrine signals from support cells. Blood 133 (6), 588–599. doi:10.1182/blood-2018-03-838946
Fan, J., and Li, R. (2001). Variable selection via nonconcave penalized likelihood and its oracle properties. J. Am. Stat. Assoc. 96, 1348–1360. doi:10.1198/016214501753382273
Fiore, C., Kelly, M. J., Volkert, A., Zhou, L., Madigan, K., Eaton, M., et al. (2020). Selection of RARA-positive newly diagnosed unfit AML patients with elevated RARA gene expression enriches for features associated with primary resistance to venetoclax and clinical response to SY-1425, a potent and selective RARα agonist plus azacitidine. Blood 136, 15–16. doi:10.1182/blood-2020-137323
Follo, M. Y., Pellagatti, A., Armstrong, R. N., Ratti, S., Mongiorgi, S., De Fanti, S., et al. (2019). Response of high-risk MDS to azacitidine and lenalidomide is impacted by baseline and acquired mutations in a cluster of three inositide-specific genes. Leukemia 33 (9), 2276–2290. doi:10.1038/s41375-019-0416-x
Friedman, J., Hastie, T., Narasimhan, B., Tay, K., Simon, N., Qian, J., et al. (2024). Glmnet: lasso and elastic-net regularized generalized linear models. R. package version 4, 1–8.
Gabriel, F. R. (2016). HDeconometrics: implementation of several econometric models in high-dimension. R. package. version 0.1.0.
Han, R., Yang, J., Zhu, Y., and Gan, R. (2024). Wnt signaling in gastric cancer: current progress and future prospects. Front. Oncol. 14, 1410513. doi:10.3389/fonc.2024.1410513
Hannan, E. J., and Quinn, B. G. (1979). The determination of the order of an autoregression. J. R. Stat. Soc. Ser. B 41 (2), 190–195. doi:10.1111/j.2517-6161.1979.tb01072.x
Hastie, T., and Tibshirani, R. (1993). Varying-coefficient models. J. R. Stat. Soc. Ser. B 4, 757–779. doi:10.1111/j.2517-6161.1993.tb01939.x
Hoerl, A. E., and Kennard, R. W. (1970). Ridge regression: biased estimation for nonorthogonal problems. Techonometrics 12, 80–67. doi:10.2307/1271436
Huang, Y. J., Lu, T. P., and Hsiao, C. K. (2020). Application of graphical lasso in estimating network structure in gene set. Ann. Transl. Med. 8 (23), 1556. doi:10.21037/atm-20-6490
Hurvich, C. M., and Tsai, C. L. (1989). Regression and time series model selection in small samples. Biometrika 76, 297–307. doi:10.1093/biomet/76.2.297
Imoto, S., Goto, T., and Miyano, S. (2002). Estimation of genetic networks and functional structures between genes by using Bayesian networks and nonparametric regression. Pac. Symp. Biocomput., 175–186.
Kogan, M., Fischer-Smith, T., Kaminsky, R., Lehmicke, G., and Rappaport, J. (2012). CSF-1R up-regulation is associated with response to pharmacotherapy targeting tyrosine kinase activity in AML cell lines. Anticancer. Res. 32 (3), 893–899.
Konishi, S., and Kitagawa, G. (1996). Generalised information criteria in model selection. Biometrika 83, 875–890. doi:10.1093/biomet/83.4.875
Konishi, S., and Kitagawa, G. (2008). Information criteria and statistical modeling. New York: Springer. doi:10.1007/978-0-387-71887-3
Li, D., Luo, Y., Chen, X., Zhang, L., Wang, T., Zhuang, Y., et al. (2019). NF-κB and poly (ADP-ribose) polymerase 1 form a positive feedback loop that regulates DNA repair in acute myeloid leukemia cells. Mol. Cancer. Res. 17 (3), 761–772. doi:10.1158/1541-7786.MCR-18-0523
Li, Y., Wang, Y., Zou, Q., Li, S., and Zhang, F. (2023). KLF3 transcription activates WNT1 and promotes the growth and metastasis of gastric cancer via activation of the WNT/β-Catenin signaling pathway. Lab. Invest 103 (6), 100078. doi:10.1016/j.labinv.2023.100078
Lymboussaki, A., Gemelli, C., Testa, A., Facchini, G., Ferrari, F., Mavilio, F., et al. (2009). PPARdelta is a ligand-dependent negative regulator of vitamin D3-induced monocyte differentiation. Carcinogenesis 30 (2), 230–237. doi:10.1093/carcin/bgn272
Mao, J., Fan, S., Ma, W., Fan, P., Wang, B., Zhang, J., et al. (2014). Roles of Wnt/β-catenin signaling in the gastric cancer stem cells proliferation and salinomycin treatment. Cell Death Dis. 5 (1), e1039. doi:10.1038/cddis.2013.515
Nan, Y., and Yang, Y. (2014). Variable selection diagnostics measures for highdimensional regression. J. Comp. Grap Stat. 23 (3), 636–656. doi:10.1080/10618600.2013.829780
Niu, J., Peng, D., and Liu, L. (2022). Drug resistance mechanisms of acute myeloid leukemia stem cells. Front. Oncol. 12, 896426. doi:10.3389/fonc.2022.896426
Park, H., Yamada, M., Imoto, S., and Miyano, S. (2019). Robust sample-specific stability selection with effective error control. J. Comput. Biol. 26 (3), 202–217. doi:10.1089/cmb.2018.0180
Schwarz, G. (1978). Estimating the dimension of a model. Ann. Stat. 6 (2), 461–464. doi:10.1214/aos/1176344136
Seabra, A. D., Araújo, T. M., Mello Junior, F. A., Di Felipe Ávila Alcântara, D., De Barros, A. P., De Assumpção, P. P., et al. (2014). High-density array comparative genomic hybridization detects novel copy number alterations in gastric adenocarcinoma. Anticancer Res. 34 (11), 6405–6415.
Shimamura, T., Imoto, S., Shimada, Y., Hosono, Y., Niida, A., Nagasaki, M., et al. (2011). A novel network profiling analysis reveals system changes in epithelial-mesenchymal transition. PLoS ONE 6 (6), e20804. doi:10.1371/journal.pone.0020804
Stein, E. M., de Botton, S., Cluzeau, T., Pigneux, A., Liesveld, J. L., Cook, R. J., et al. (2023). Use of tamibarotene, a potent and selective RARα agonist, in combination with azacitidine in patients with relapsed and refractory AML with RARA gene overexpression. Leuk. Lymphoma 64 (12), 1992–2001. doi:10.1080/10428194.2023.2243356
Tibshirani, R. (1996). Regression shrinkage and selection via the lasso. J. R. Stat. Soc. Ser. B 58, 267–288. doi:10.1111/j.2517-6161.1996.tb02080.x
van Dijk, A. D., Hoff, F. W., Qiu, Y., Gerbing, R. B., Gamis, A. S., Aplenc, R., et al. (2022). Bortezomib is significantly beneficial for de novo pediatric AML patients with low phosphorylation of the NF-κB subunit RelA. Prot. Clin. Appl. 16 (2), e2100072. doi:10.1002/prca.202100072
Wang, Y., and Gao, W. J. (2021). Long non-coding RNA-H19 promotes ovarian cancer cell proliferation and migration via the microRNA-140/Wnt1 axis. Kaohsiung J. Med. Sci. 37 (9), 768–775. doi:10.1002/kjm2.12393
Xiong, T., Xia, L., and Song, Q. (2023). Circular RNA SPI1 expression before and after induction therapy and its correlation with clinical features, treatment response, and survival of acute myeloid leukemia patients. J. Clin. Lab. Anal. 37 (3), e24835. doi:10.1002/jcla.24835
Yang, W. L., Lu, Z., and Bast, R. C. (2017). The role of biomarkers in the management of epithelial ovarian cancer. Expert. Rev. Mol. Diagn 17 (6), 577–591. doi:10.1080/14737159.2017.1326820
Zhang, J., Tang, P. M. K., Zhou, Y., Cheng, A. S. L., Yu, J., Kang, W., et al. (2019). Targeting the oncogenic FGF-FGFR Axis in gastric carcinogenesis. Cells 8 (6), 637. doi:10.3390/cells8060637
Zhang, S., Li, Z., Dong, H., Wu, P., Liu, Y., Guo, T., et al. (2021). Construction of an immune-related gene signature to predict survival and treatment outcome in gastric cancer. Sci. Prog. 104 (1). doi:10.1177/0036850421997286
Keywords: model evaluation, personalized gene network, generalized information criteria, acute myeloid leukemia, gastri cancer
Citation: Park H, Imoto S and Konishi S (2025) Generalized information criteria for personalized gene network inference. Front. Genet. 16:1583756. doi: 10.3389/fgene.2025.1583756
Received: 27 February 2025; Accepted: 26 May 2025;
Published: 20 June 2025.
Edited by:
Ka-Chun Wong, City University of Hong Kong, Hong Kong SAR, ChinaReviewed by:
Zhong Chen, Southern Illinois University Carbondale, United StatesMiao Rui, Zunyi Medical University, China
Copyright © 2025 Park, Imoto and Konishi. This is an open-access article distributed under the terms of the Creative Commons Attribution License (CC BY). The use, distribution or reproduction in other forums is permitted, provided the original author(s) and the copyright owner(s) are credited and that the original publication in this journal is cited, in accordance with accepted academic practice. No use, distribution or reproduction is permitted which does not comply with these terms.
*Correspondence: Heewon Park, aGVld29ubi5wYXJrQGdtYWlsLmNvbQ==