 Israa M. T. Witwit1
 Hadi A. Al-agele
 Chad W. Higgins
- 1Department of Soil and Water Resource, College of Agriculture, Al-Qasim Green University, Babylon, Iraq
- 2Department of Biological and Ecological Engineering, College of Agricultural Science, Oregon State University, Corvallis, OR, United States
Integrating innovative technologies such as agrivoltaic systems, improving water use efficiency, and adopting climate-smart agricultural practices can help ensure that farming systems are resilient, resource-efficient, and capable of feeding future generations. This study aims to investigate the growth of potato plants both beneath and between simulated solar panels, as well as in a control area. The effects of two levels of deficit irrigation (35% and 50%) and three levels of potassium sulfate fertilizer are examined. Total yield, water productivity, and nutrient analysis of the plants, potatoes, and soil are conducted. The results show that light conditions are the most significant factor (more than irrigation or fertilizer) for most observations. The results show that light conditions are the most important factor (more so than irrigation or fertilizers), with total yields higher (277.9 kg or more than 17 t/ha) at irrigation level (I0.35) and (241.4 kg or more than 15 t/ha) at irrigation level (I0.5) in the partially shaded areas between the solar panels marked as (B). In contrast, the total yield in the light areas (L) was (253.1 kg or more than 16 t/ha) at irrigation level (I0.35) and (232.3 kg or more than 14 t/ha) at irrigation level (I0.5), while the yield in shaded areas (S) was (204.8 kg or more than 13 t/ha) at irrigation level (I0.35) and (191.45 kg or more than 12 t/ha) at irrigation level (I0.5). The decrease in total production in the shade was 26% at irrigation level (I0.35) and 20% at irrigation level (I0.5) compared to the partial-shade area, and 19% at irrigation level (I0.35) and 18% at irrigation level (I0.5) compared to the light area. The results of water consumption (added water) indicated that the amount of water added to plants growing in shade was significantly less than that of plants in partial shade and light at both irrigation levels. The amount of added water in the shade was 3833 m3/ha at irrigation level (I0.35) and 3517 m3/ha at irrigation level (I0.5). In partial shade, it was 3883 m3/ha at irrigation level (I0.35) and 3585 m3/ha at irrigation level (I0.5). In light conditions, it was 3903 m3/ha at irrigation level (I0.35) and 3607 m3/ha at irrigation level (I0.5). The results indicated that water productivity in partial shade and light conditions differed significantly from that of shaded plants at both irrigation levels. Water productivity values in partial shade were recorded at 4.42 kg/m3 at irrigation level (I0.35) and 4.16 kg/m3 at irrigation level (I0.5). Under light conditions, water productivity values measured 4.00 kg/m³ at irrigation level (I0.35) and 3.98 kg/m3 at irrigation level (I0.5). In the shade, water productivity values were 3.30 kg/m3 at irrigation level (I0.35) and 3.36 kg/m3 at irrigation level (I0.5). The increase in water productivity in the interpanel areas suggests that the combination of shading and irrigation contributed to water conservation and reduced evaporation, leading to more efficient water use without compromising overall production. The combination of full shade, 35% irrigation deficit, and low potassium enhances available phosphorus and decreases potassium concentrations in the soil. The discovery that agrivoltaic systems can support healthier soil nutrient dynamics through shading and deficit irrigation is a promising area for future research into sustainable farming practices.
Introduction
The increasing global population creates the dual challenge of maintaining food and energy security in a changing climate. That is, sustainable energy production (particularly solar energy production) and sustainable food production can be in tension in land resource development and management (Zainali et al., 2025). Should an area be used for food or energy production? Agrivoltaic systems relieve this tension by proposing a method to do both in an integrated manner on the same piece of land. Agrivoltaic systems refer to the dual use of land for agricultural production and solar installations for electricity generation, thereby enhancing the sustainability of both agricultural production and energy generation (Gorjian et al., 2022). An agrivoltaic system can be conceptualized as two essential elements: the energy canopy above the land that harvests a fraction of the sunlight and produces electricity, and the agricultural activities below the energy canopy that occur in a structured shade environment (Mazzeo et al., 2025). Whilst these two activities (energy production and agricultural production) indeed interact in meaningful ways, this study is conceived to target and measure how the agricultural elements (water and nutrients) within a structured shade environment are impacted.
Recent studies have increasingly highlighted the effects of structured shade on crop water demand and efficiency. In agrivoltaic systems, the shade created by solar panels reduces evapotranspiration from both the soil and plant canopies. This shading lowers overall water demand and enhances the efficiency of water use (Al-Agele et al., 2021a; Barron-Gafford et al., 2019; Elamri et al., 2018). An open area of study is how deficit irrigation and nutrient management within the shaded agricultural component of the agrivoltaic systems function.
A study conducted during the spring and summer of 2011 (from March 22 to August 31) on an experimental prototype in Montpellier, France, found that agrivoltaic systems reduced water usage by 14-29% due to decreased evapotranspiration when growing lettuce and cucumber beneath solar panels (Marrou et al., 2013). This led to a significant reduction in the water required for plant growth during the season, with crop water consumption in agrivoltaic systems decreasing by 20-30%. Elamri et al. used model simulations to predict the benefits of agrivoltaic installations and found that irrigation amounts could be reduced by 20% while tolerating a 10% decrease in yield (Elamri et al., 2018).
Recently, a study on maize (Zea mays L., RAGT IXABEL) grown for three years (2019, 2020, and 2021) under solar panels with deficit irrigation in southern France (Mediterranean climate) found that agrivoltaic systems reduced irrigation inputs by 19-47% compared to open areas by decreasing soil water depletion and reference evapotranspiration (Ramos-Fuentes et al., 2023).
In experiments conducted in Jiangcun Forest Farm, Fugou County, Henan Province, China, the growth of Paulownia variety wheat under agrivoltaic systems resulted in a 51% reduction in yield due to the wheat’s inability to adapt to low light (Li et al., 2008).
Al-Agele et al. grew tomato plants (Solanum Lycopersicon var. Legend) under agrivoltaic systems in three locations (control, interrow, and beneath panels) with two different irrigation treatments (full and deficit) (Al-Agele et al., 2021a). They found that crop production decreased as shading increased, with yields in the control area under full irrigation being 55.25 kg, 86.35 kg, and 156.55 kg, respectively. Additionally, they observed increased water productivity in the interrow and beneath panels under deficit irrigation, measuring approximately 93.11 kg/m³ and 68.90 kg/m³, respectively.
A study on soybean yield under agrivoltaic systems with varying levels of shade (AV1 = 27%, AV2 = 16%, AV3 = 9%, AV4 = 18%) compared to an open area in Monticelli d’Ongina, Italy, found grain yields reduced by 8% and 13%, with a slight increase of 4.4% in yield for AV2 compared to the open area (Potenza et al., 2022).
The effect of growing broccoli between the fall of 2019 and the spring and fall of 2020 under agrivoltaic systems in Naju, Jeollanam Province, South Korea, was also evaluated (Chae et al., 2022). The study found that agrivoltaic systems produced greener broccoli that was highly consumed, with no significant difference in production compared to open areas.
Barron-Gafford et al. planted various crops under agrivoltaic systems in central northern Tucson, AZ, USA (Barron-Gafford et al., 2019). The researchers discovered that the shade generated by solar panels positively affected plants by reducing air temperature and direct solar radiation, thereby decreasing their water requirements during the day. They also noted a positive impact on crop production compared to open areas. The total fruit production of red peppers and tomatoes was twice as high under agrivoltaic systems, while the total yield of jalapeño peppers was lower than in the control area. Although crop production remained similar to the control area, the care required for these crops used 65% less water than open areas.
Omer et al. (2024a) planted sweet potatoes under a novel agricultural photovoltaic system called Spectrum Splitting and Concentrated APV (SCAPV), which utilizes curved glass covered with multilayer polymer films (MPF) to split sunlight. They found that cumulative soil water evaporation was higher in the control area compared to SCAPV, measuring 80.53 mm and 63.38 mm, respectively. Additionally, sweet potato yields (both fresh and dry) increased by 56.13% and 56.64%. Another study examined the impact of two agricultural photovoltaic systems, SCAPV and Even-lighting Agricultural Photovoltaic (EAPV), on sweet potato quality and yield compared to open areas (Omer et al., 2024b). The results indicated that sweet potato yields increased under SCAPV and EAPV compared to open areas, measuring 121.53 kg, 99.55 kg, and 77.84 kg, respectively. SCAPV and EAPV also reduced average evapotranspiration by 31% and 23%, respectively.
An emerging theme in the results of these experiments is that agrivoltaic systems lead to reduced crop water consumption and increased water productivity. This theme holds across crop types and climatic conditions (see global extent of field demonstrations). The next logical refinement is to enhance these water savings by also implementing a deficit irrigation strategy alongside the structured shade of the agrivoltaic system (Şentürk et al., 2025). Furthermore, the impacts on nutrient management with shaded agriculture should be considered as an additional dimension (Cammerino et al., 2025). Climate is also a significant factor. Note that the studies mentioned show broad correlations with the climatological conditions where the structured shade is applied. This study extends the range of potential climatological conditions to a more extreme case of water scarcity and high temperatures. Potato plants were selected because they are strategic crops worldwide and are a staple in many diets.
A major criticism of this manuscript may be that the field deployment and setup do not utilize solar panels to create the structured shaded environment in which the crops are grown (Abubakar et al., 2025; Khudhair et al., 2025). Instead, a series of shade structures are built to imitate, as closely as possible, the spatial and temporal distribution of shade that a structured solar array would provide. This is known as the simulated agrivoltaic system. We acknowledge that plant growth can impact the productivity of solar panels; however, our focus here is on how structured shade affects the growth, nutritional content, water demand, and fertilizer requirements of a potato crop.
This study aims to cultivate potato plants in three different environments: beneath simulated solar panels, between them, and in a control area, under two levels of deficit irrigation (35% and 50%) and three levels of potassium sulfate fertilizer. It will explore the interaction between deficit irrigation and potassium sulfate application, evaluating their effects on total yield across all planting areas. Additionally, the research will assess water productivity under each treatment condition.
Materials and methods
Site description and preparation
The field study was conducted in a simulated agrivoltaic system in Babylon Province, Iraq. The dimensions of the experimental field were 40 m by 45 m (1,800 m²) (length by width). The field was plowed and divided into experimental plots measuring 3 m by 6 m, located beneath the simulated solar panels, between the panels, and in a control area (see Figure 1). The simulated agrivoltaic system was constructed from wood and topped with blue plastic, which shaded the soil. The choice of blue plastic as the shading material was inspired by spectrographic measurements conducted below the solar panels, which found the largest impact in blue light. The dimensions and slopes of the design were selected to mimic a typical fixed-tilt solar architecture. The design of the simulated agrivoltaic system measured 3 m in width and 45 m in length, with a height of 3 m and an angle of 30 degrees (Figure 1).
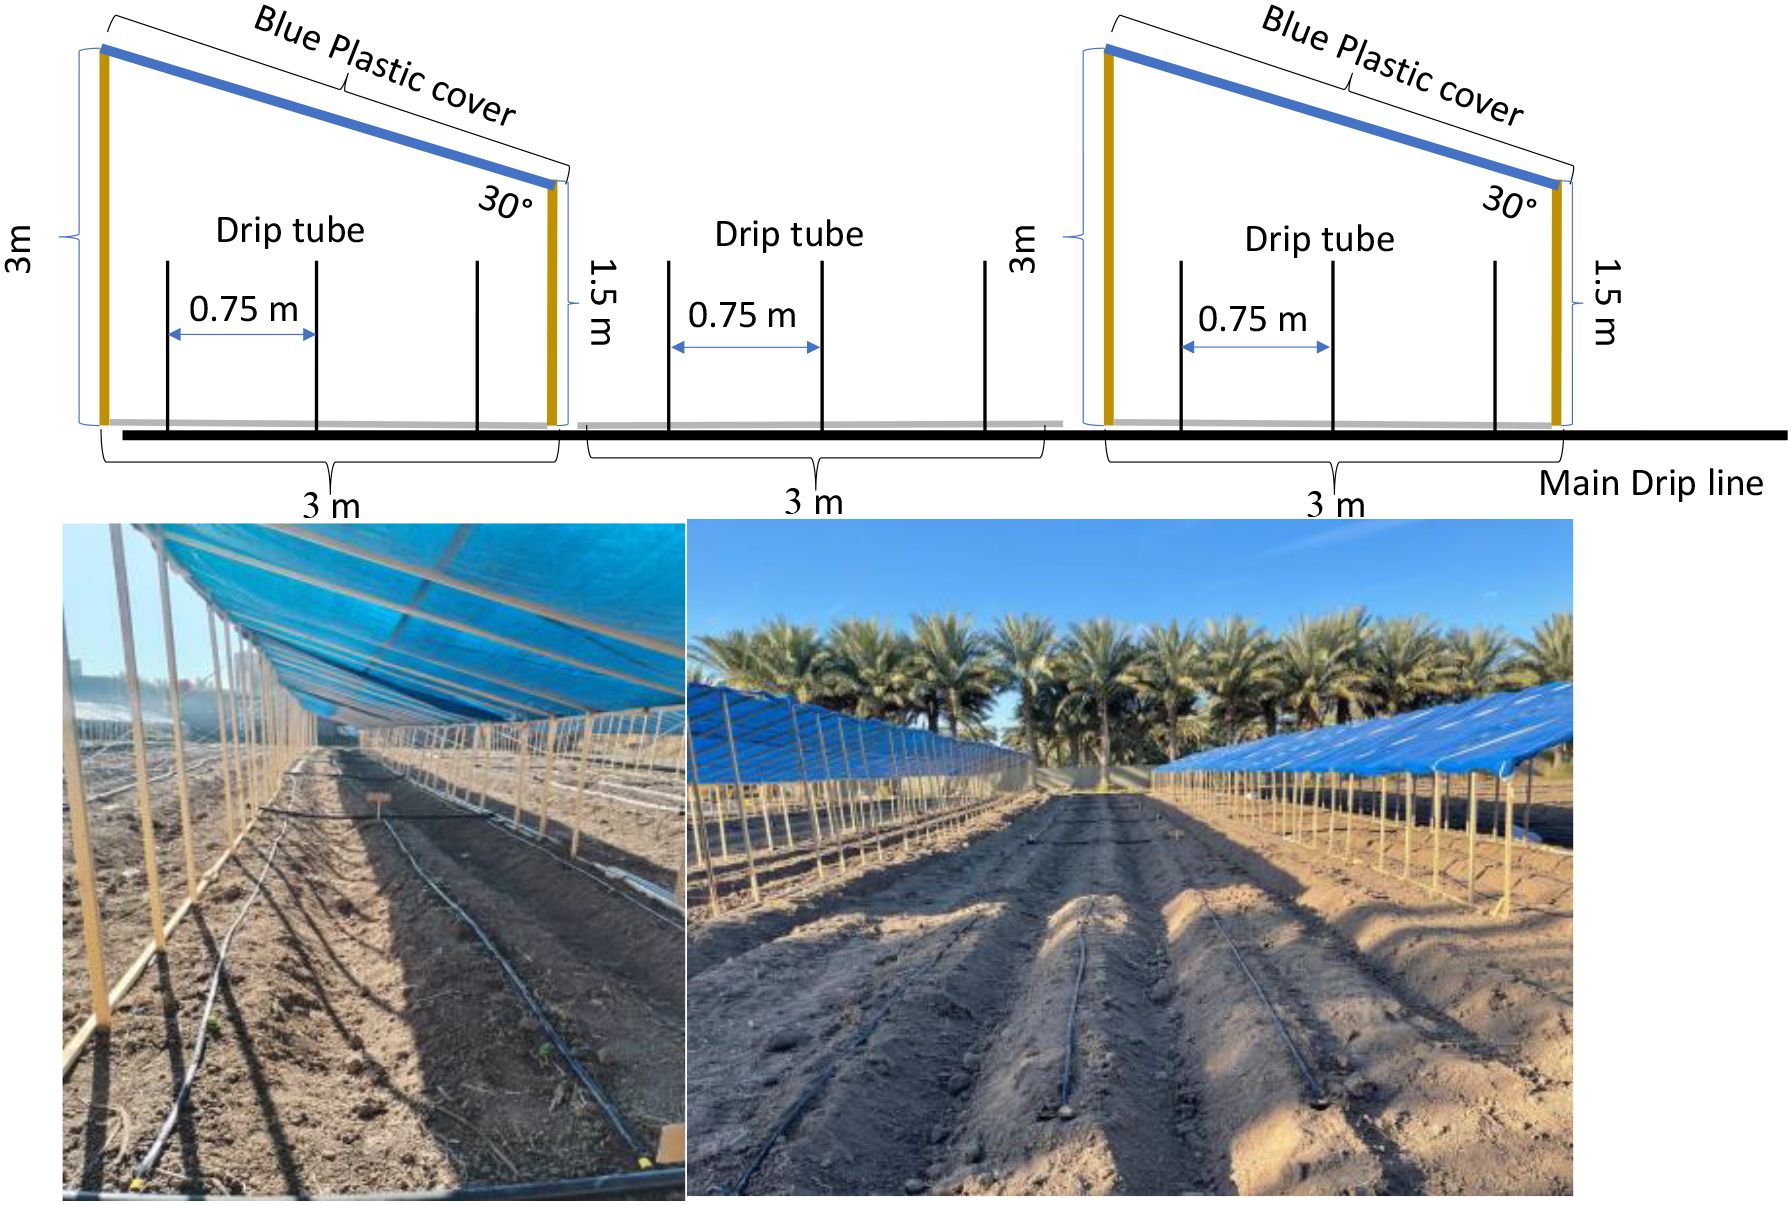
Figure 1. Schematic of the experiment design and field experiment (underneath, between, and open area). Each area is sub-divided into two irrigation and three fertilizer treatments with three replicates of each for a total of eighteen plots.
Each plot contained three lines of drip tube with a 0.75m distance between the lines. Each drip line had 0.2 m spacing between emitters, and each emitter had a flow rate of 4 L/h. An electrical water pump (SHIMGE) was used to apply the water to the field with a discharge rate of 600 l/min.
The pre-experimental soil conditions were measured. Ten soil samples were taken randomly within each treatment from a depth of 0.3 m and then aggregated to measure the field study’s physical and chemical soil properties (Table 1).
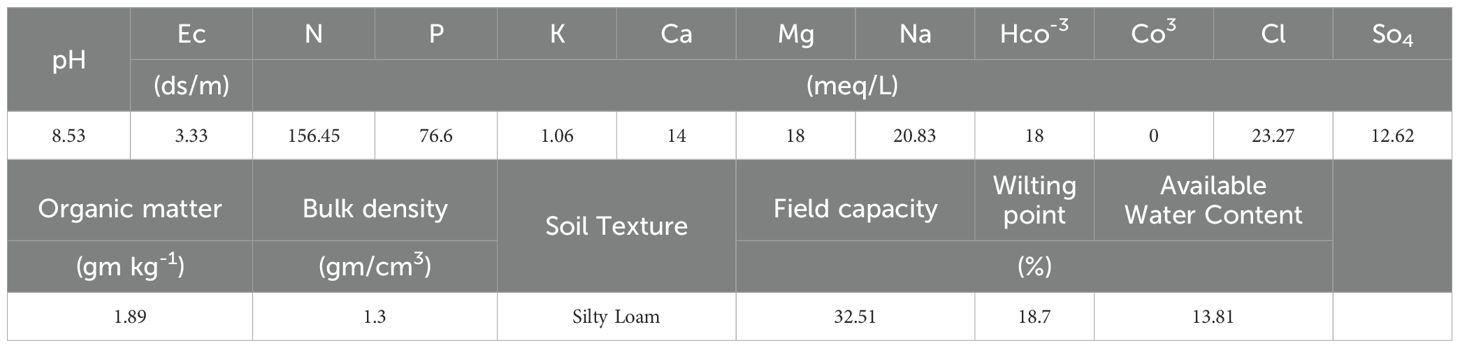
Table 1. Chemical and physical soil properties of the field soil.
A micrometeorological station was placed in the control area to provide baseline ambient weather data. Air temperature, relative humidity, wind speed, and incoming solar radiation were measured at 1-minute intervals, and the data were processed for daily outputs. These data are shown in Figure 2.
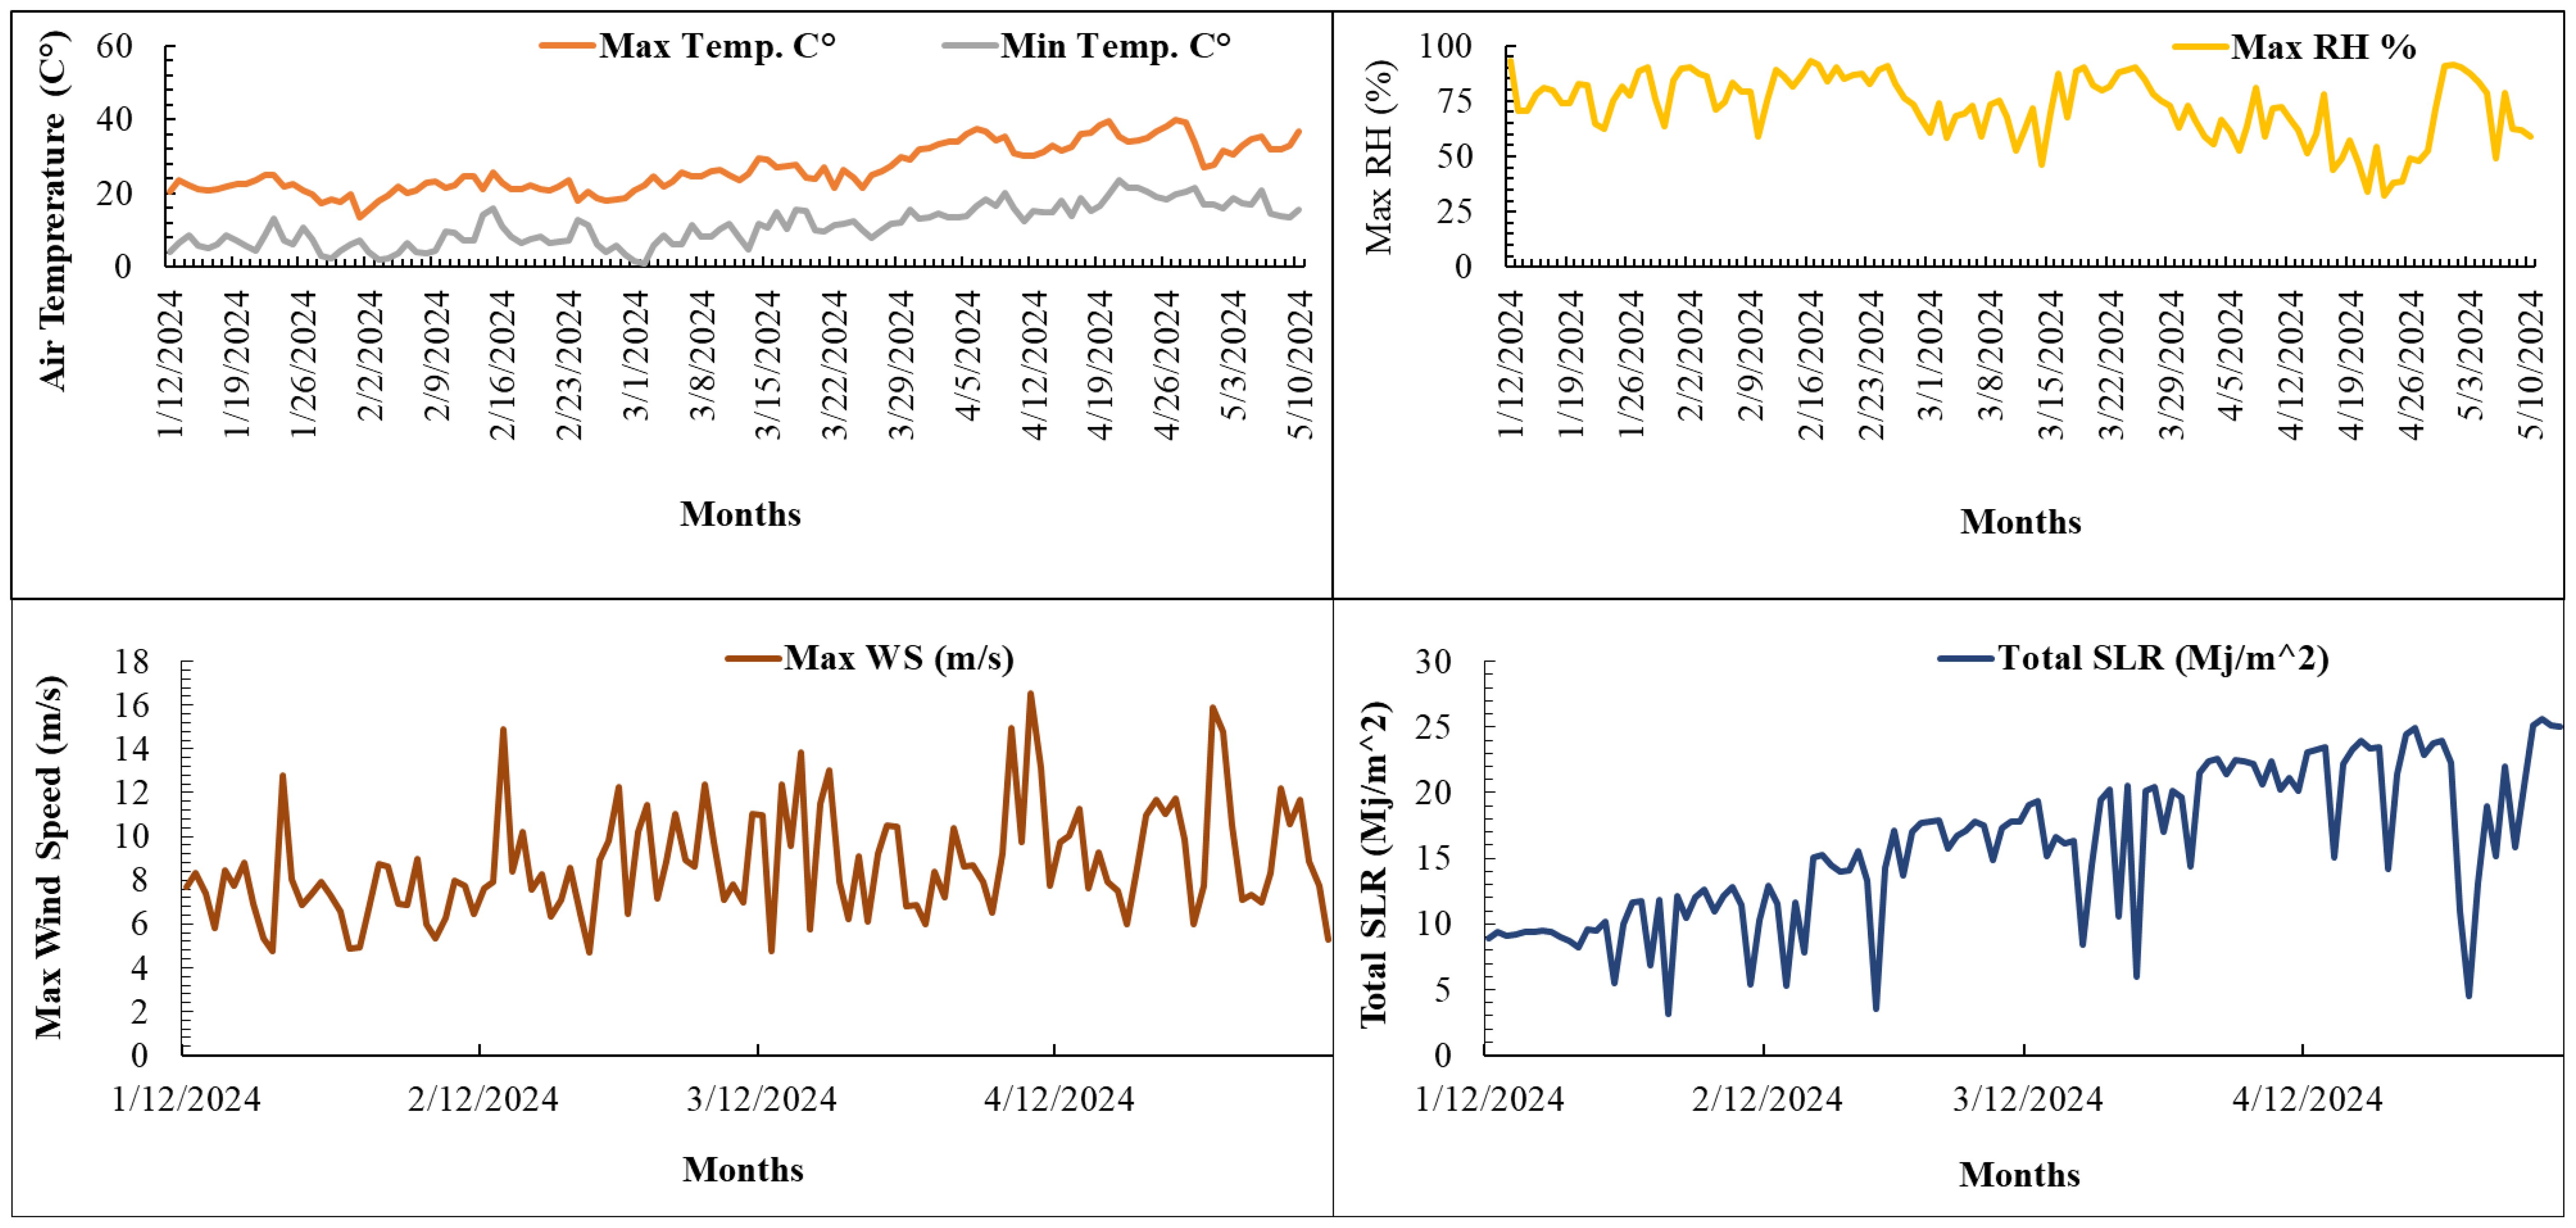
Figure 2. Micrometeorological data during the experiment, which occurred from January 12, 2024, to May 10, 2024.
The potato tubers class (Arizona) was purchased from the Netherlands. Potatoes were planted on January 12, 2024, in three rows in each plot (aligned with the drip line), with three replications for each treatment permutation, including: beneath simulated solar panels, between panels, a control area, fertilizer application levels, and deficit irrigation levels, respectively. Each plot contained 72 potatoes, with 0.25m between each tuber and 0.75m between the rows (Figure 3).
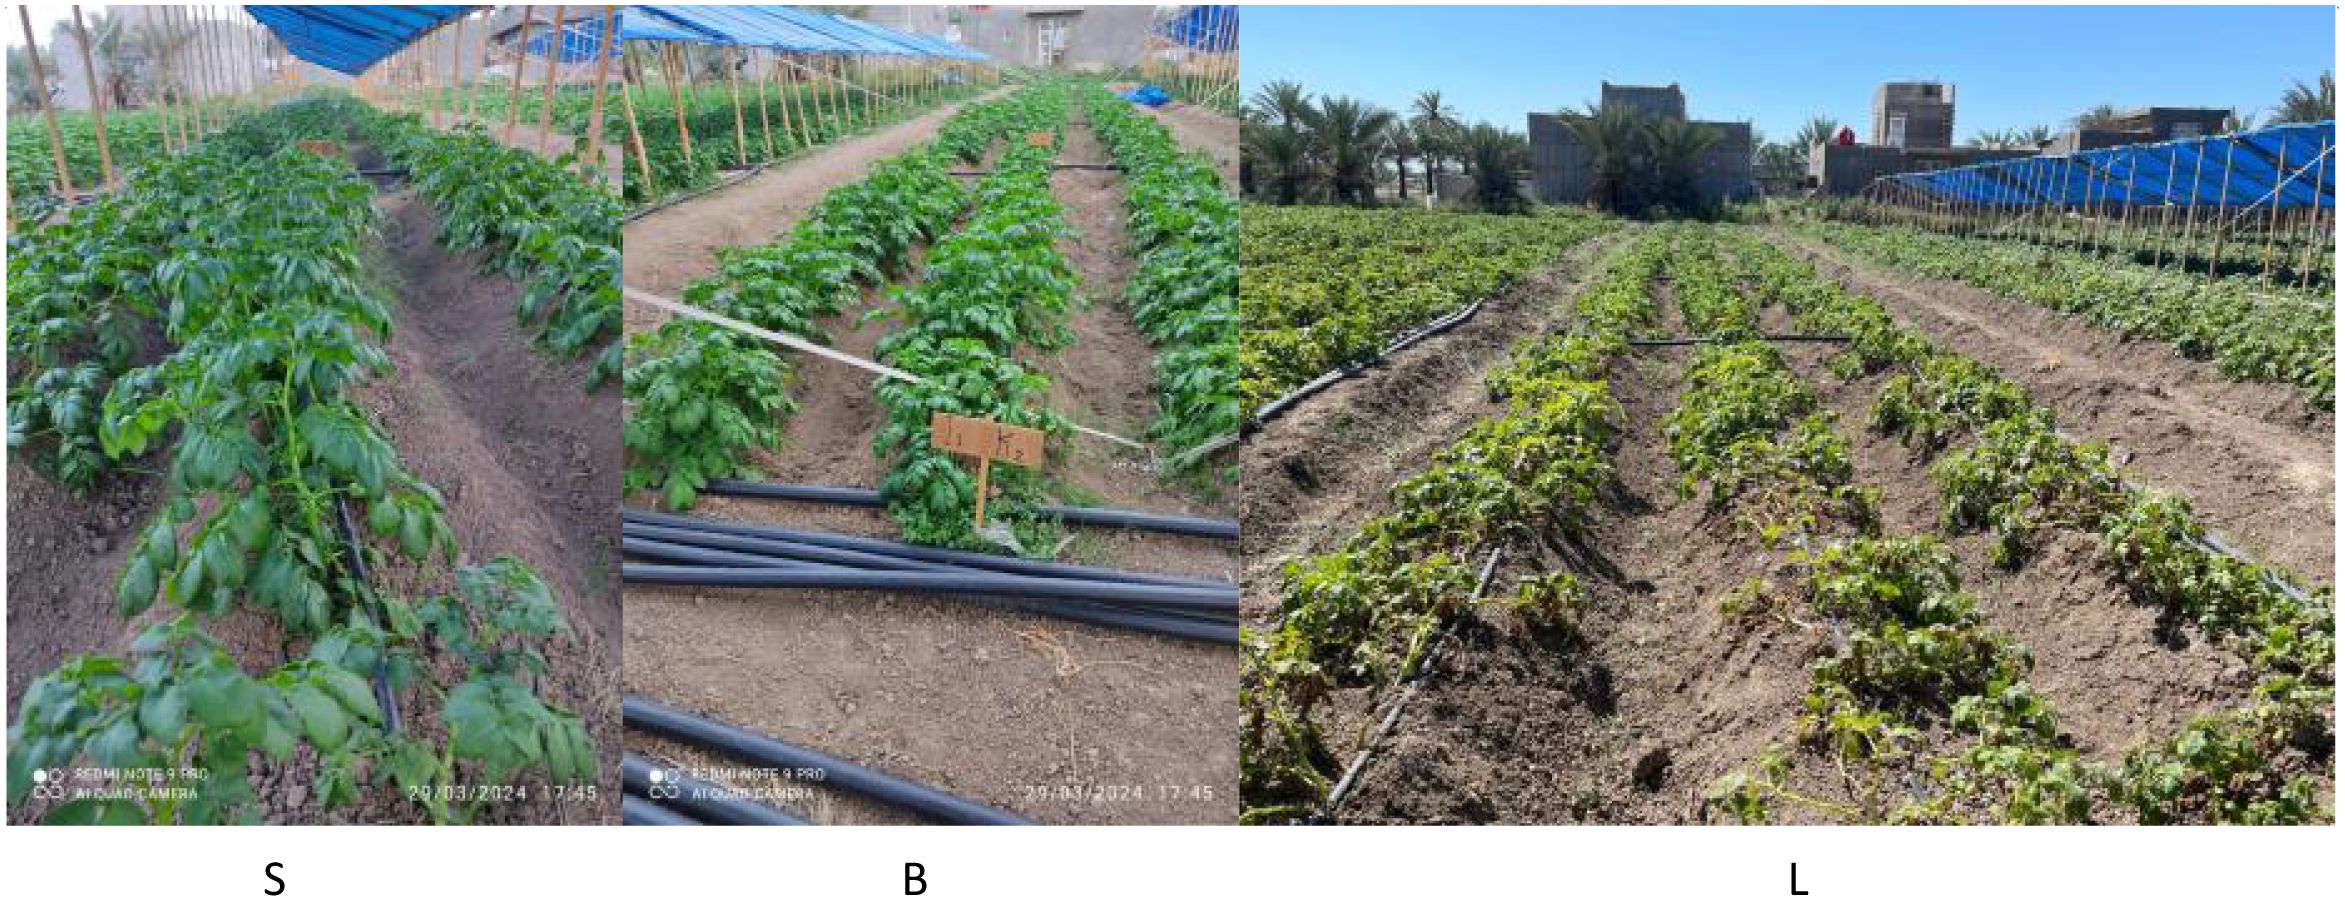
Figure 3. Photos of the potato growth underneath the panel (S), between the simulated solar panels (B), and the open area (lighter) (L). These photos were taken on the same day, March 29, 2024.
Phosphorus fertilizers were applied immediately before planting, while nitrogen fertilizers were applied at the time of plant emergence and periodically throughout the experiment. The soil nutrient measurements determined the total amount of phosphorus fertilizer (P2O5) added to each plot. The objective was to equalize the starting conditions (336–560 kg per ha) in each plot. Nitrogen (N) urea (46-0-0) was also added based on the soil data, but only half was applied at the emergence of the potato plants (168 N kg per ha). The remainder was applied during the growth cycle.
Field experimental treatments
The shade and light treatments created by the simulated agrivoltaic canopy were classified as follows: 1) the plots directly beneath the shade structures, which experienced the most shade and are designated as (S) for shade. Plots situated between the shade canopy structures encountered a partial shade and partial sun condition, and these treatments are designated as (B) for between. Control plots, located outside the influence of the shade canopy, receive full sun and full light conditions, designated as (L) for light.
Three levels (0, 150, and 300 kg per ha) of potassium sulfate (K2SO4) fertilizer were used to define the three fertilizer treatments. The no fertilizer level was designated as K0, the 150 kg/ha level was designated as K1, and the 300 kg/ha level was designated as K2.
Two irrigation deficit irrigation levels (35% and 50%) were used to define the irrigation treatments. Note that both deficit levels are defined relative to the available water content in the soil, and a 35% water deficit plot receives more water than the 50% deficit plot. The deficit is relative to full watering to available soil capacity.
Collectively, the three light factors, three fertilizer levels, and the two irrigation deficit levels represent 18 permutations, and each of these permutations is replicated three times for a total of 54 plots within the field trial. The fertilizer and irrigation factors are distributed randomly within each light/shade treatment: beneath simulated solar panels, between panels, and in a control area.
Soil measurement
Soil samples were collected post-harvest from each plot in the control area, with three replicates taken from both the shaded and unshaded areas from a depth of 0.3 m. These samples were analyzed to measure the available chemical elements, including nitrogen (N) (Buresh et al., 1982; Keeney and Nelson, 1982), phosphorus (P) (Murphy and Riley, 1962; Olsen and Sommers, 1982), and potassium (K) (Richards, 1954).
Potato growth, yield, and chemical elements measurements
The properties studied in this study include both above-ground measurements of the potato plants and below-ground measurements of the tubers. The above-ground measurements include the germination rate, the number of aerial potato stems, and the plant heights. The germination rate was measured in 72 potato tubers per treatment and location (shade, partial shade, and control area). The number of aerial stems and the plant height was measured for three randomly selected plants in each treatment plot, respectively. Each measurement was then performed in triplicate.
Below-ground measurements include the total tuber yield of each plot and the total N, P, K, protein, and carbohydrates of the dry potato tubers. These chemical composition measurements were performed in accordance with the methods in (Herbert et al., 1971; Keeney and Nelson, 1982; Rastovski and van Es, 1987; Richards, 1954). The yield was measured in 72 potato tubers per treatment and location (shade, partial shade, and control area). The nutrient content was measured for three randomly selected plants in each treatment plot, respectively. Each measurement was then performed in triplicate.
Water applied measurement
The amount of water applied was based on the available water holding capacity (AWC) within the crop’s root zone. For potatoes, the root zone was identified as 0 to 0.3 meters. AWC was measured in the laboratory prior to planting by determining the field capacity and wilting point percentages using a Pressure Plate Membrane and applying Equation 1.
Where: : Available water holding capacity, is a percentage of field capacity and The percentage of wilting point.
AWC was measured at 13.18%, and based on this value, the deficit irrigation percentage was determined, providing water at 35% and 50% of the AWC. During the growing season, water application for each irrigation event was monitored by measuring the soil moisture content using Equation 2 before irrigation. This was done by drying soil samples in an oven at 105°C for 24 hours. This process was repeated for each irrigation event at all the plots (fully shaded, between the shade and open area).
Where: is the percentage of soil moisture content, is the mass of water loss in the soil sample in the oven (gm), is the weight of dry soil (gm).
The volume of water added was calculated to replenish the total water loss from the soil by using Equation 3.
Where: is the volume of water applied (m3), is the percentage of soil moisture content, is black density (g/cm3), is water density (g/cm3), D is root depth (m), and A is field area (m2).
The irrigation time was calculated using an Equation 4.
Where: is the irrigation time (hr), q is the drip emitter discharge (m3/hr), and N is the total drip emitters in the field.
Water productivity
The actual water productivity was measured by water applied to the crop during the season. WP actual can be expressed as in Equation 5:
where, Ya is the actual yield (kg), and is the Total water applied (m-3) measured during the season.
Statistical analysis
GenStat software version 12.1.0.3278 was used to analyze the experiment data using a Split-Split Design within a Randomized Complete Block Design (RCBD). The comparison was made using the treatment means with the Least Significant Differences Test (L.S.D) at significance levels of 0.05 and 0.01 to determine statistical significance.
Results and discussion
Germination rate of potato tubers
The statistical analysis showed the full sun (L) treatments had a significantly higher germination rate than the full shade (S) treatments (Table 2). Potassium fertilizer treatment (K) showed significant differences between the fertilizer levels. There are no significant differences between the interaction of irrigation and fertilizer. Also, there are significant differences between the bi-directional irrigation and shade. The tri-directional interactions showed significant differences between all the treatments.
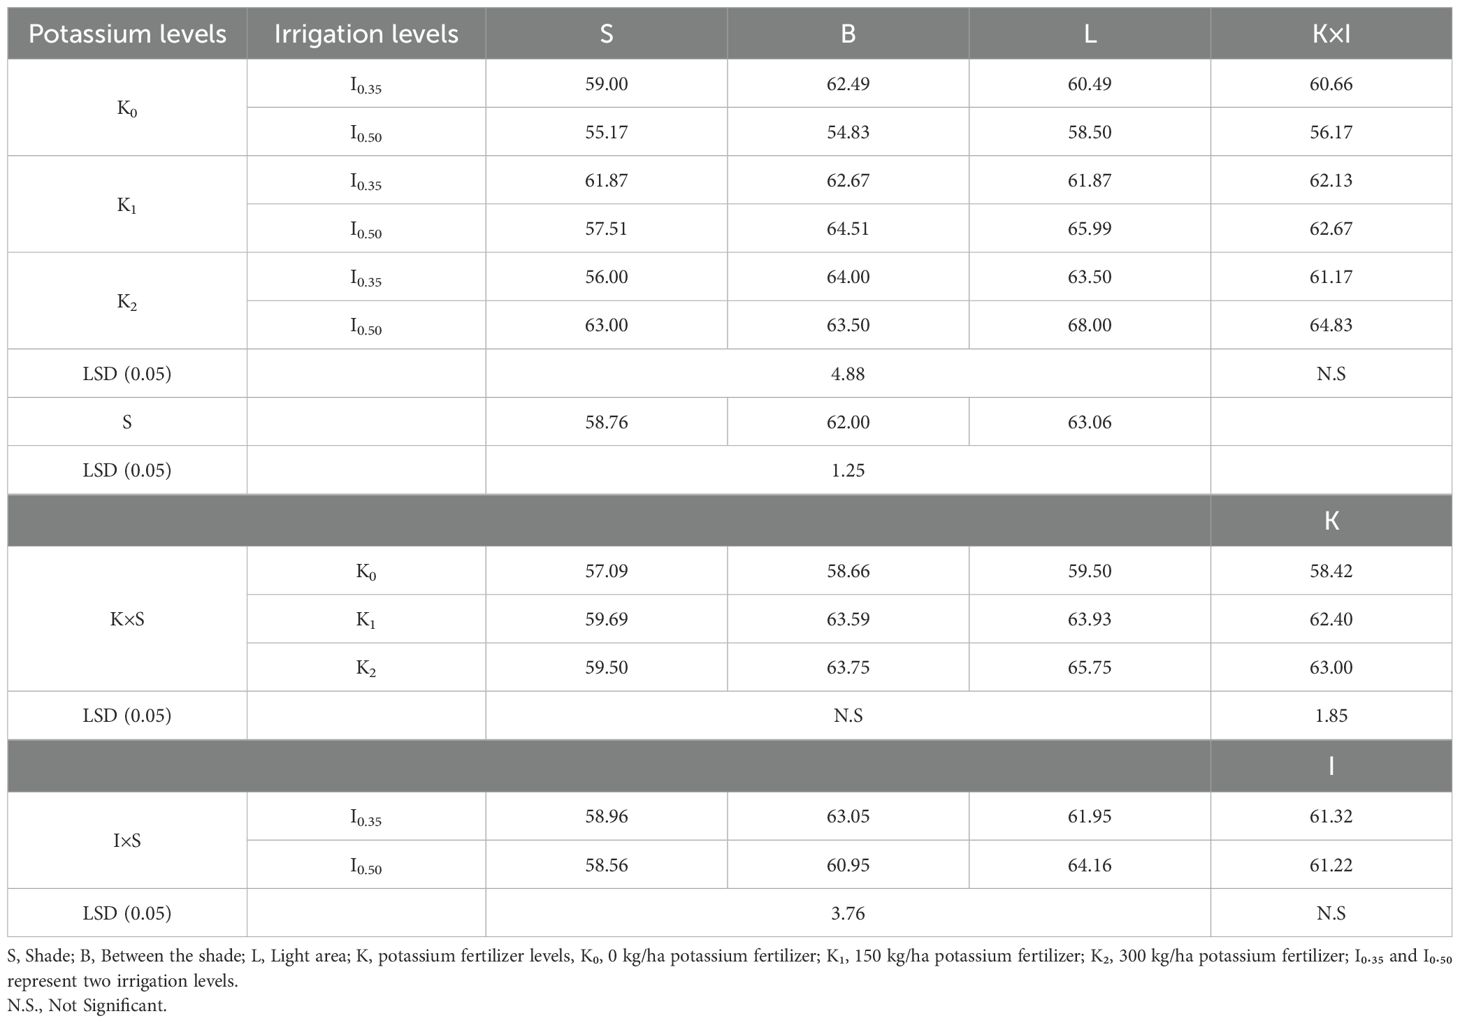
Table 2. Effect of shade, partial shade, and light, irrigation, potassium fertilizer, and their interactions on the germination rate of potato tubers.
Number of aerial potato stems
Table 3 showed that statistically significant differences were found between shade-level treatments. Potassium fertilizer treatment (K) showed significant differences between the fertilizer levels. There were significant differences between the interaction of fertilizer and irrigation. There were significant differences between the interaction of fertilizer and shade and irrigation and shade. In addition, full light (L) plots had statistically fewer stems than either the full shade (S) treatments or the partially shaded (B) treatments between panels. There are significant differences between the interaction of irrigation and shade. There were no significant differences found between other individual treatments or tri-directional interactions.
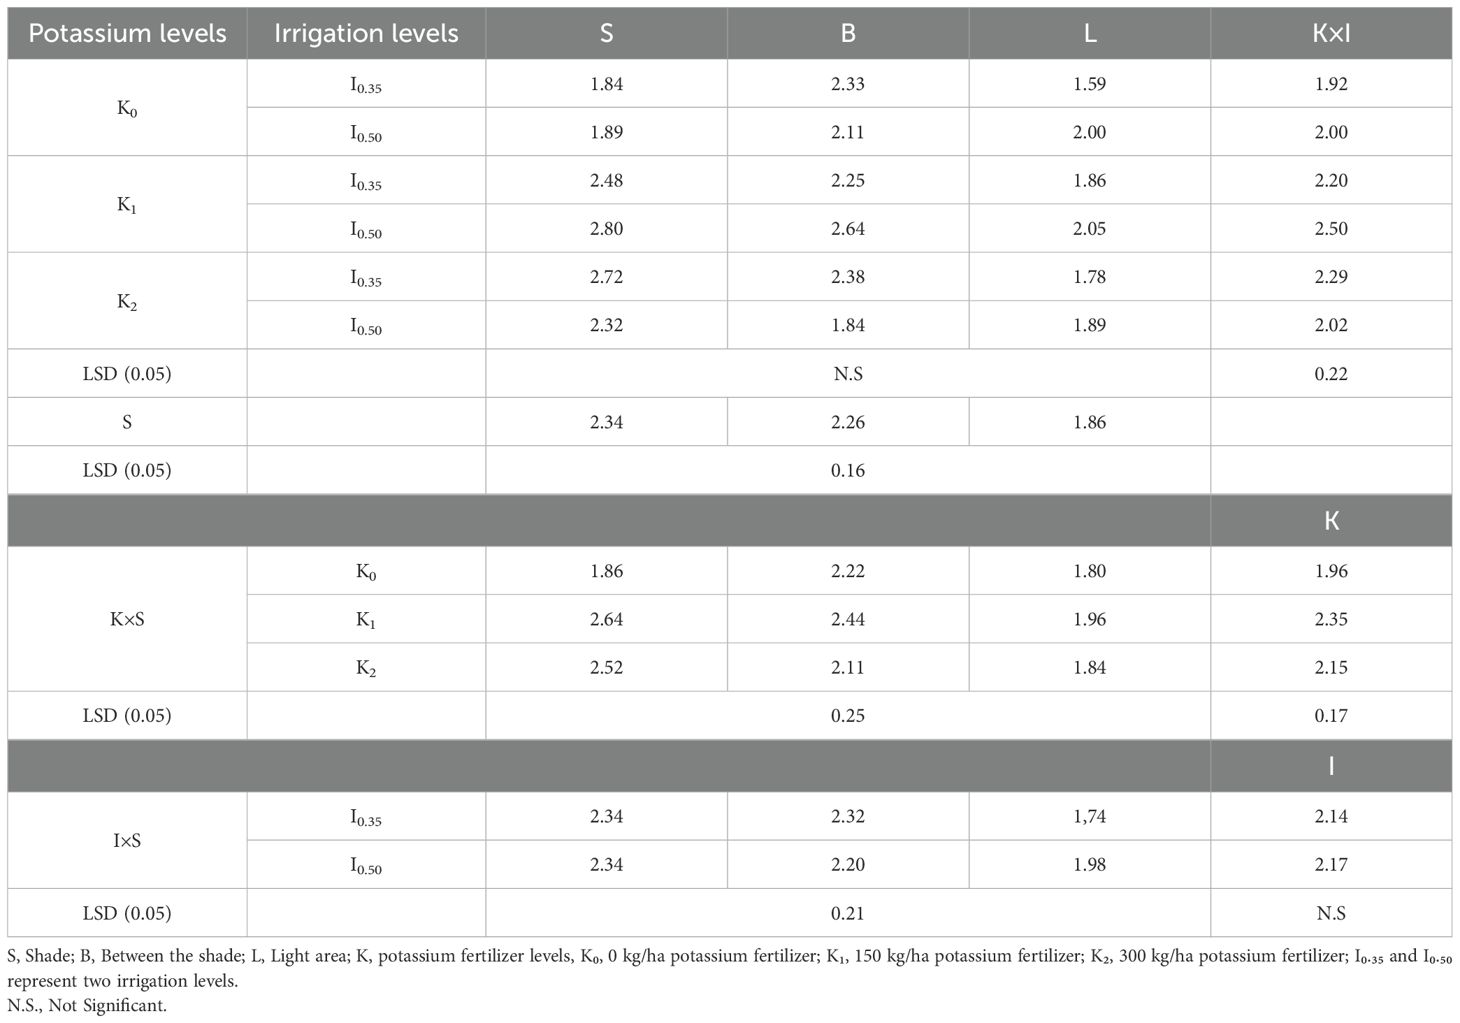
Table 3. Effect of shade, partial shade and light, irrigation, potassium fertilizer, and their interactions on the number of aerial potato stems.
Plant heights
The statistical analysis found significant differences between shade-level treatments and potassium fertilizer levels (Table 4). There were significant differences between the interaction of fertilizer and shade and irrigation and shade. Full light (L) plots had statistically shorter stems than partially shaded (B) treatments between panels, and the partially shaded treatments (B) between the panels had statistically shorter stems than the full shade treatments (S) below the panels. This is consistent with prior observations that tie lower light levels with phenotypical expressions with longer stems at lower light levels. No significant differences were found between other individual treatments or interactions.
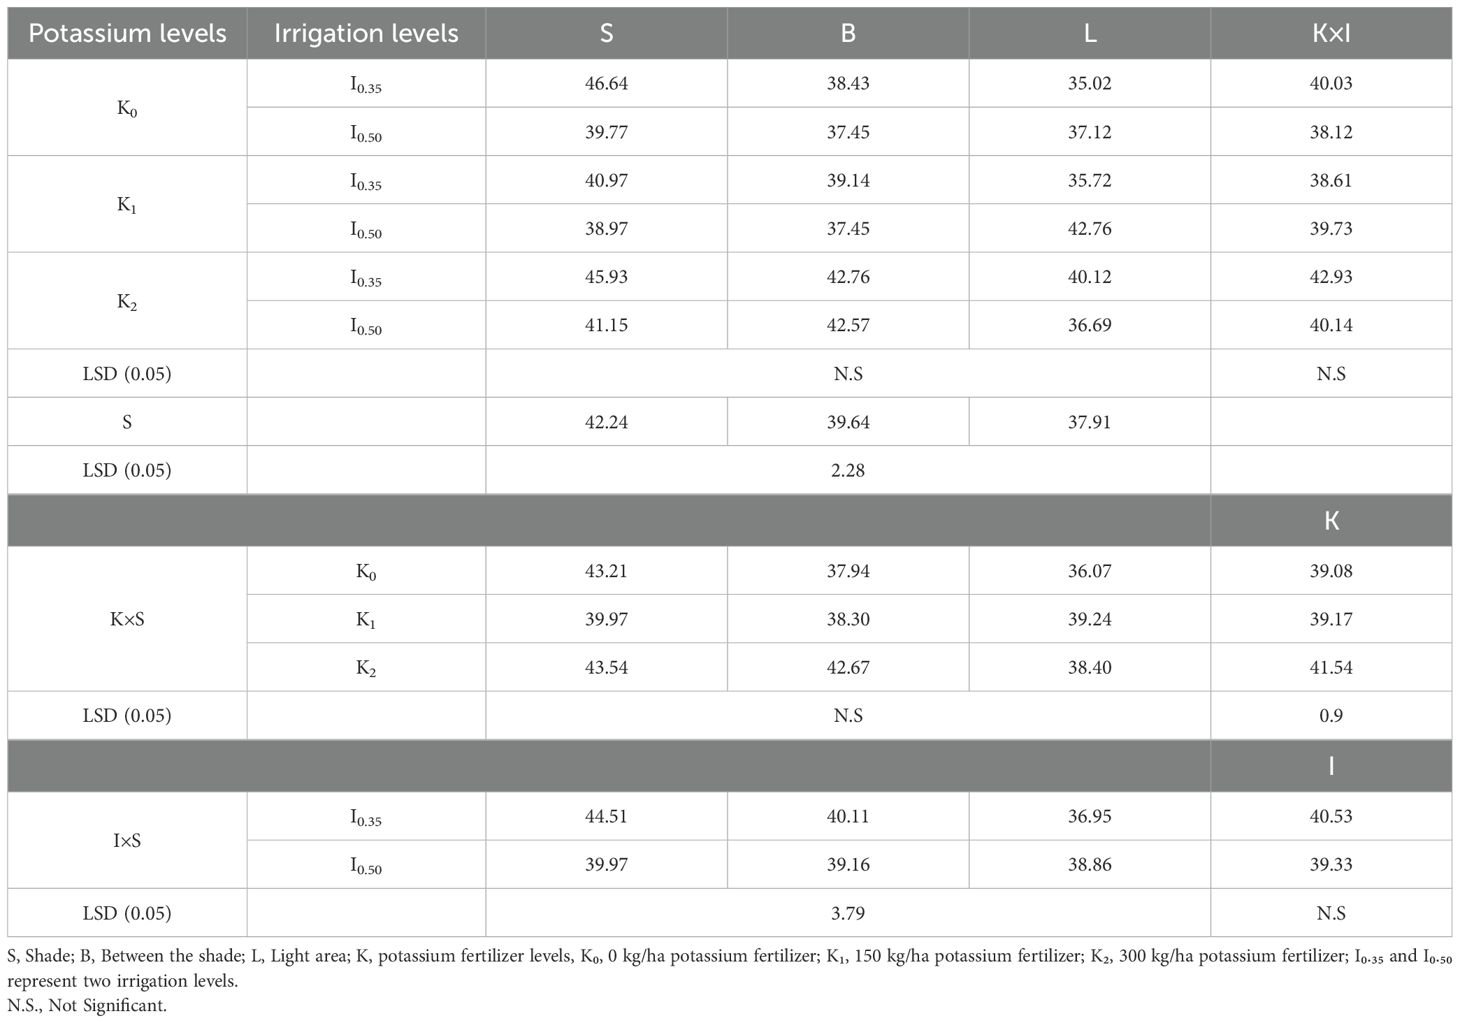
Table 4. Effect of shade, partial shade and light, irrigation, potassium fertilizer, and their interactions on the plant heights (cm).
The average yield of potatoes
Table 5 presents the statistical analysis for the average yield. Statistically significant differences were recorded in the average yield. The treatments between panels (B) 29.32 Kg/m2 and the treatments in the fill sun (L) (27.18 kg/m2) were statistically similar to each other and both were statistically greater than the yield in the full shade zone below the panels (S) 22.38 kg/m2. There were significant differences between the interaction of fertilizer and shade. Full light (L) plots had statistically lower average yield than partially shaded (B) treatments between panels, and the partially shaded treatments (B) between the panels had statistically higher average yield than the full shade treatments (S) below the panels. There were significant differences between the interaction of irrigation and shade. Also, no significant differences were found in individual and bi-directional interactions. There were significant differences found in tri-directional interactions between all the treatments [shade (S), between shade (B) and full light (L)].
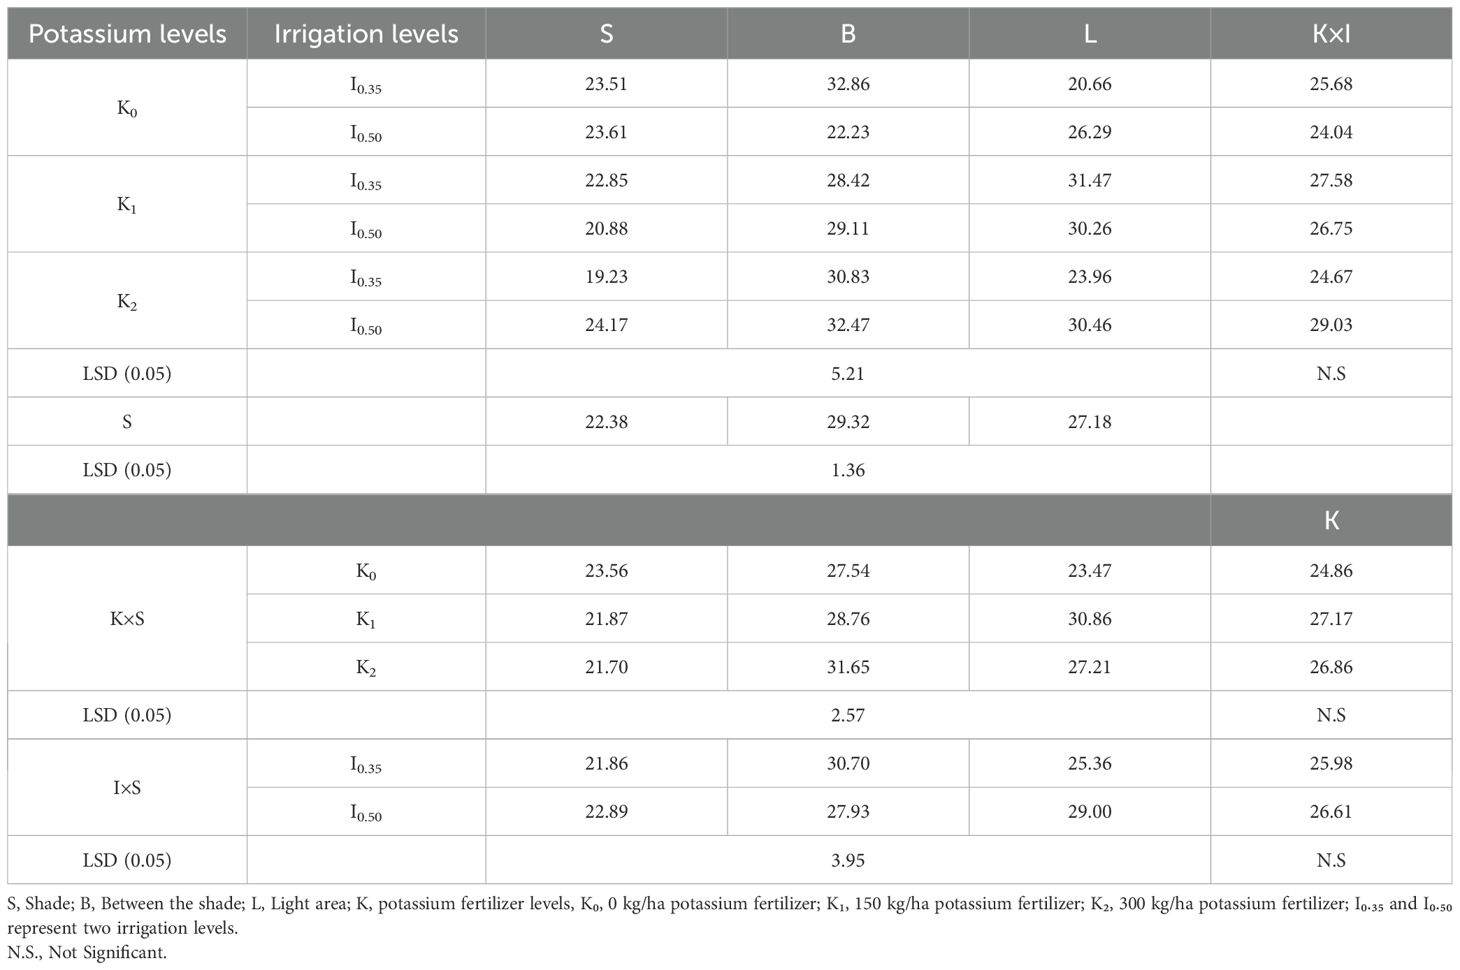
Table 5. Effect of shade, partial shade and light, irrigation, potassium fertilizer, and their interactions on the total yield of each plot.
Total nitrogen concentration in potatoes
The statistical analysis outputs for total nitrogen concentration in the potatoes are presented in Table 6. The total nitrogen concentration in the shade (S) showed significant differences compared to full light (L) and between shades (B). Only one significant interaction was observed. Irrigation level (I0.35) with shade (S) was significantly greater than irrigation level (I0.35) with between the panel (B) and full light (L). All other variables and interactions were not significant. There were significant differences found in tri-directional interactions between all the treatments [shade (S), between shade (B) and full light (L)].
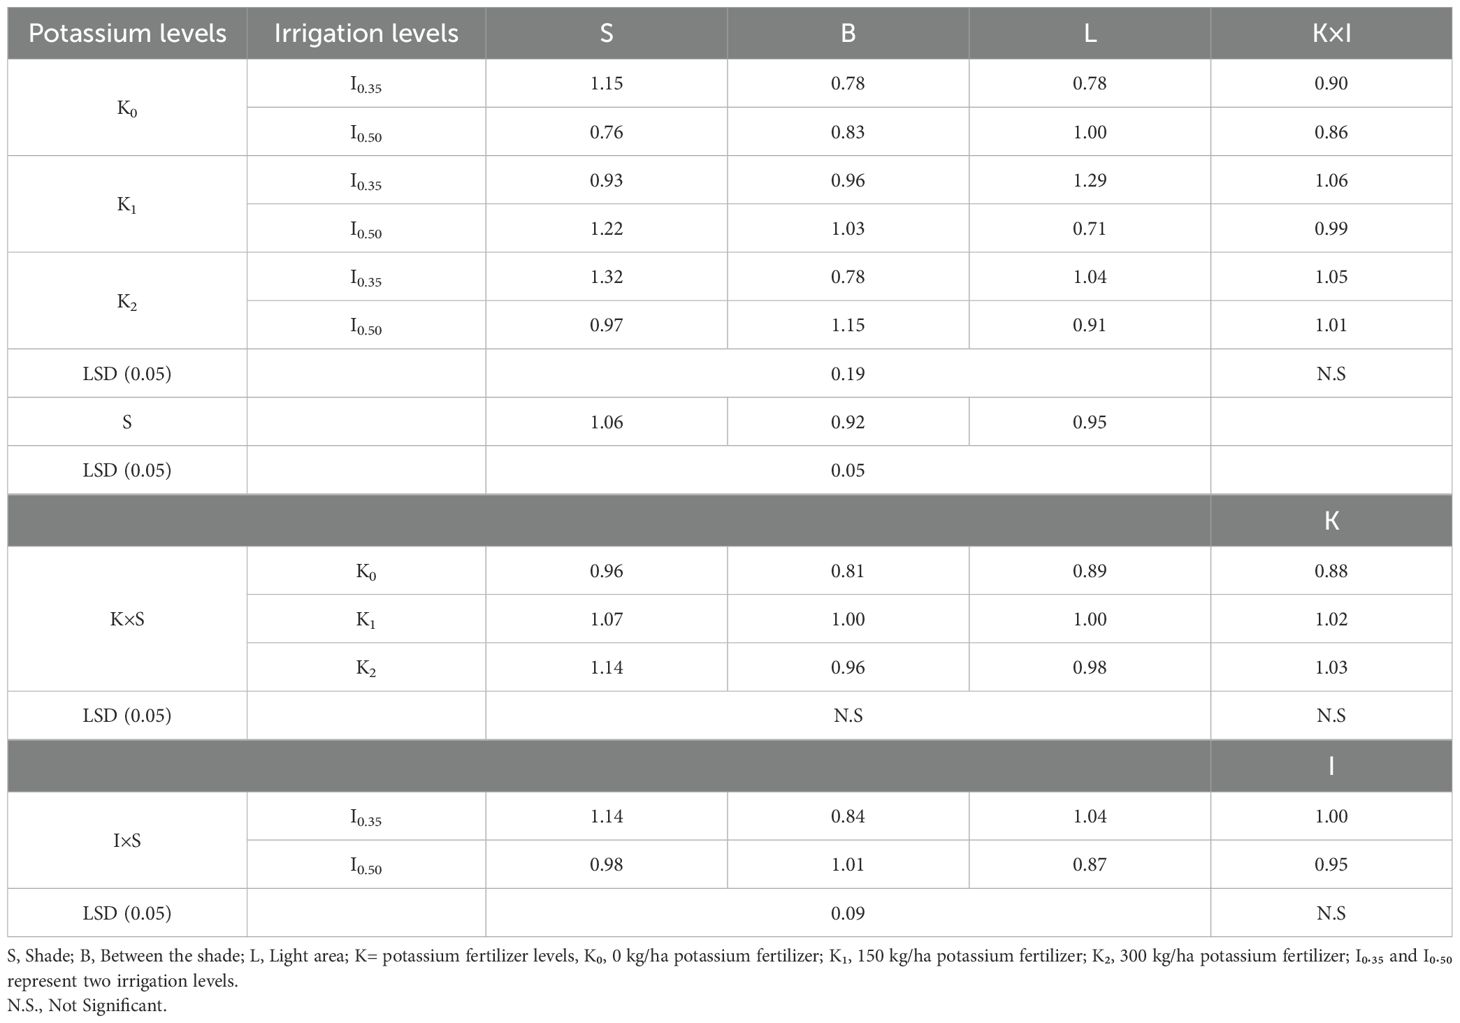
Table 6. Effect of shade, partial shade and light, irrigation, potassium fertilizer, and their interactions on total Nitrogen concentration in the plant.
Total phosphorus concentration in potatoes
The statistical analysis outputs for total phosphorus concentration in the potatoes are presented in Table 7. The total phosphorus concentration in the shade (S) and full light (L) showed significant differences than between the shades (B). In addition, potassium fertilizer and irrigation showed significant differences for individual treatment. The bi-variate of total phosphorus concentration showed significant differences between potassium fertilizer and shade, and irrigation and shade.
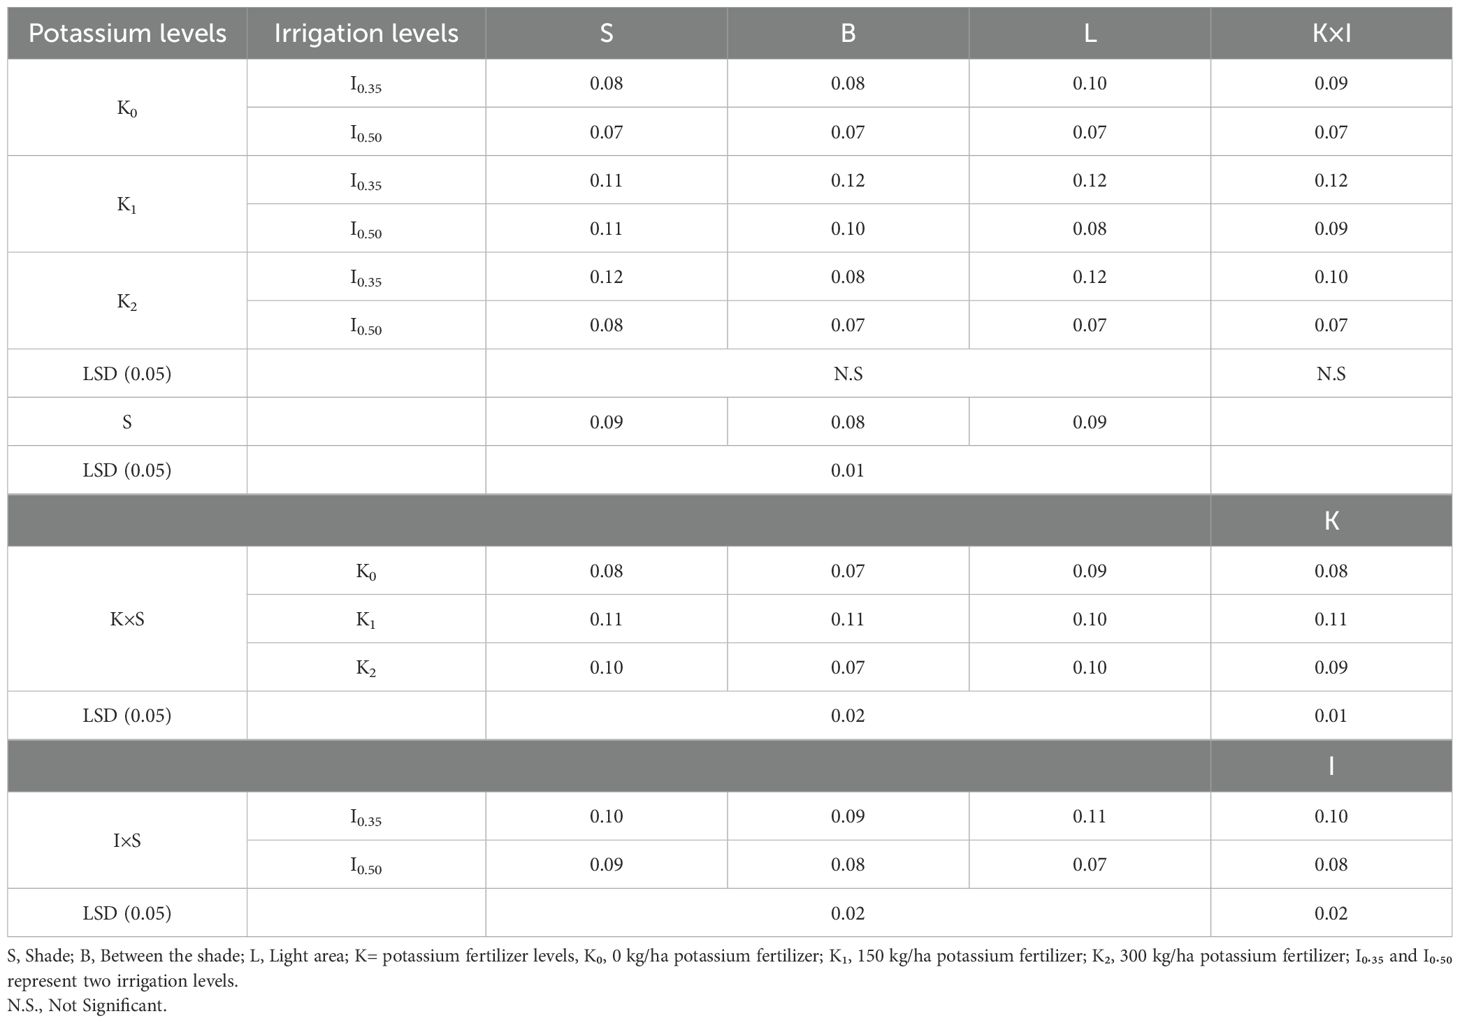
Table 7. Effect of shade, partial shade and light, irrigation, potassium fertilizer, and their interactions on total phosphorus concentration in the plant.
There were no significant differences in the total phosphorus concentration in the potatoes for the other bi-variate and tri-variate interactions.
Total potassium concentration in potatoes
Table 8 presents the statistical analysis of the total potassium concentration in the potatoes. Shade treatment showed significant differences. Full shade (S) 0.29 meq/l and partial shade between the panels (B) 0.3 meq/l were both significantly greater than the full sun (light) (L) 0.22 meq/l. The concentration within the potatoes for the treatments with the irrigation level (I0.5) and light (L) was significantly smaller than all treatments except the treatment with irrigation level (I0.35) and light (L). In addition, irrigation level (I0.35) with light (L) were statistically smaller than all treatments except irrigation level (I0.5) with light (L) and irrigation level (I0.5) with shade (S). The interaction between the irrigation level (I0.5) with between panel (B) and the irrigation level (I0.35) with shade (S) about (0.32) were statistically greater than all treatments except the irrigation level (I0.35) with between panel (B). K*S interactions were found to be significant. K0*L was significantly smaller than all of the full shade and partially shaded treatments between panels but was not significantly different from the other full sun treatments. K1*L was significantly smaller than all the partially shaded treatments between the panels and was significantly smaller than K0*S. K0*S and K2*B had the same level (0.33) and were significantly greater than all full light (L) conditions. There were significant differences in tri-variate interactions between all the treatments.
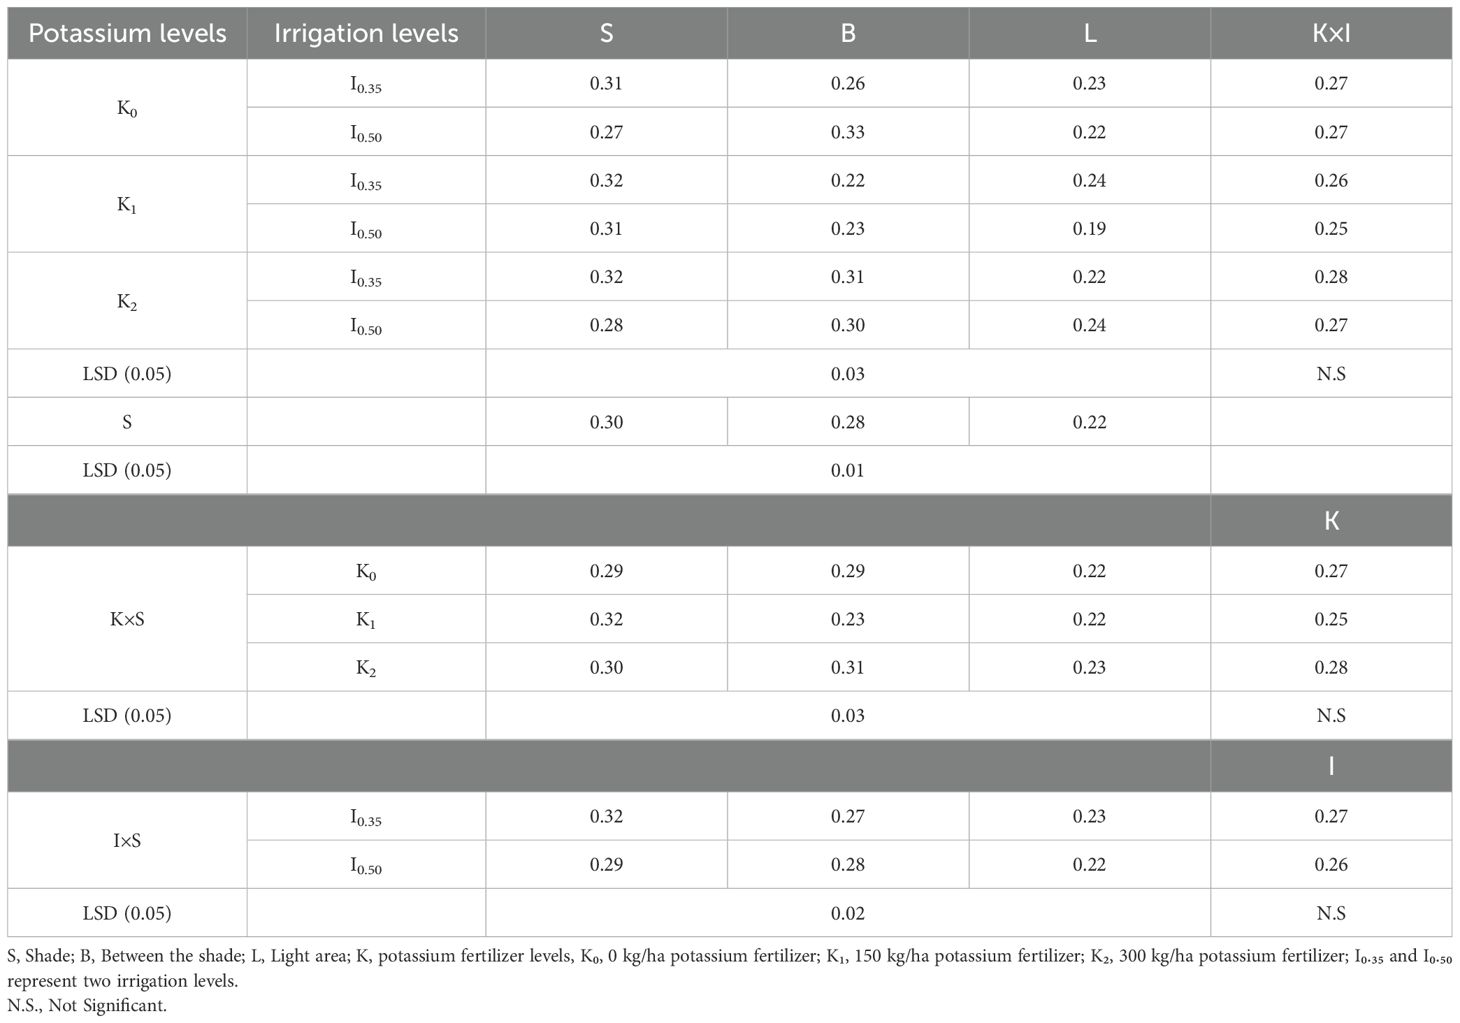
Table 8. Effect of shade, partial shade and light, irrigation, potassium fertilizer, and their interactions on total potassium concentration in the plant.
The increased potassium concentration under shade may be due to better water retention and reduced stress, which enables the plants to absorb more potassium from the soil. These conditions are particularly beneficial under reduced irrigation levels, as shade helps maintain a more stable moisture environment for nutrient uptake.
Total protein concentration in potatoes
The statistical analysis of total protein concentration in potatoes is presented in Table 9. Shade treatment did result in a significant impact. The highest protein levels were observed in the shaded area beneath the panels, which were significantly higher than those in the areas between the panels (B, partial shade). There is a significant difference in the individual treatment in the potassium (K) and irrigation (I) treatments. No significant interactions were found between potassium (K) and shade (S) treatments. However, the interaction between potassium (K) and irrigation (I) treatments and irrigation (I) and shade (S) were significant. Specifically, the combination of irrigation level (I0.35) and shade (S) resulted in lower protein levels than all other I*S interactions, except for the I0.5*L combination. On the other hand, the I0.35*S interaction produced the highest protein concentration among all I*S treatments, significantly greater than all other treatments except I0.35*L. Significant effects were found for tri-variate interactions.
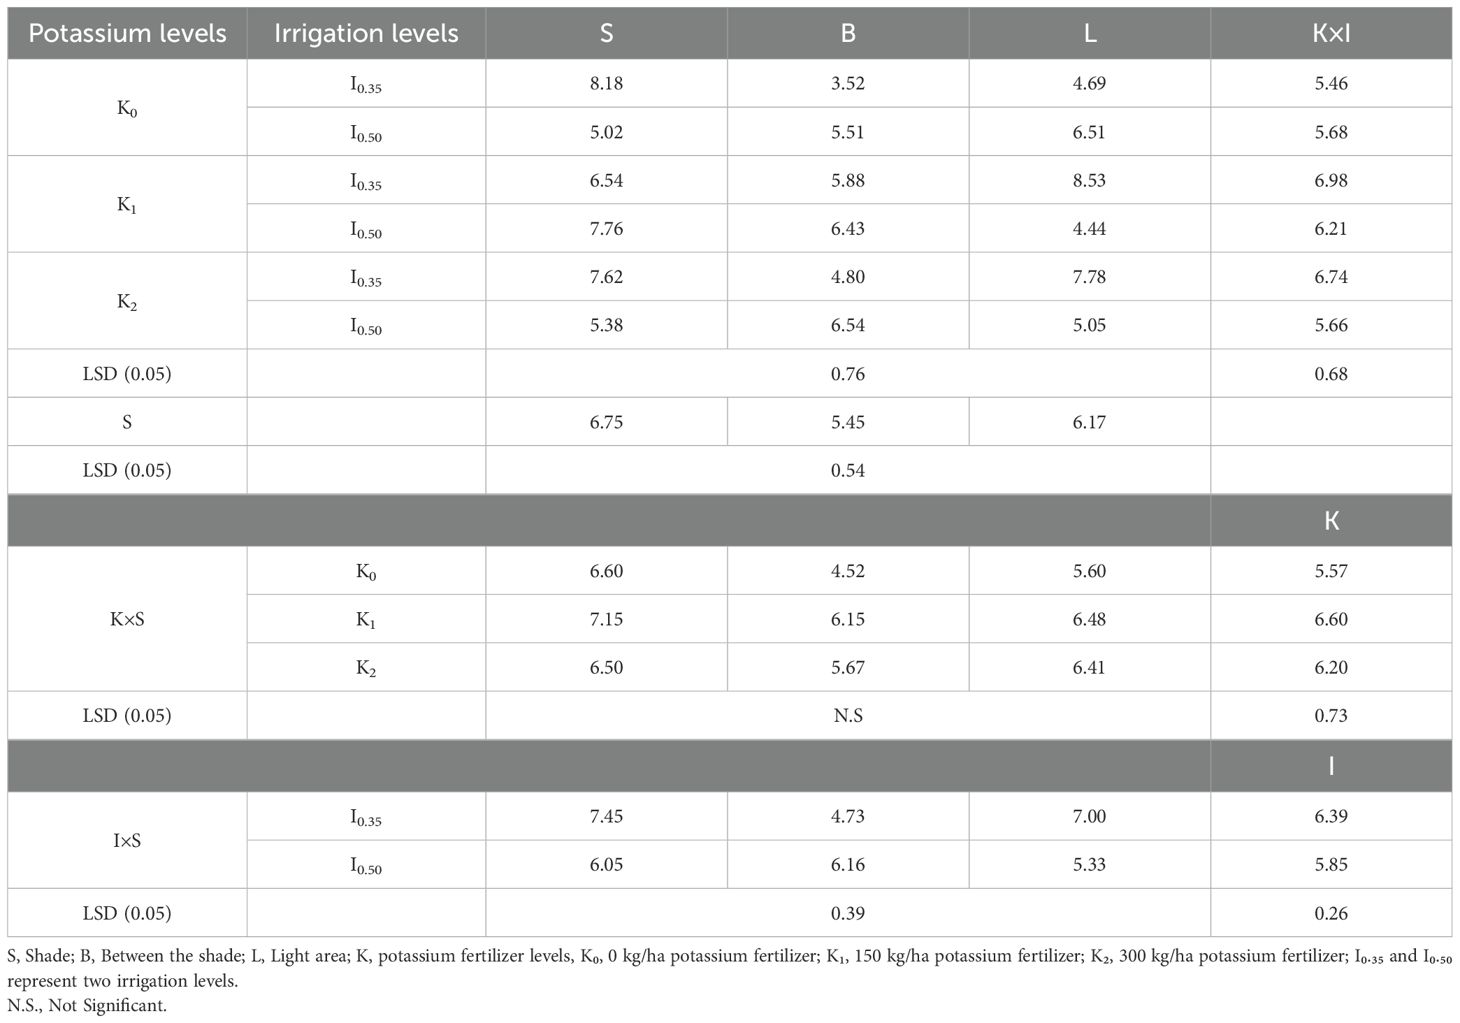
Table 9. Effect of shade, partial shade, and light, irrigation, potassium fertilizer, and their interactions on total protein concentration in the plant.
Total carbohydrate concentration in potatoes
The statistical analysis of total carbohydrate concentration in potatoes is presented in (Table 10). Light treatment did result in a significant impact. The highest carbohydrate levels were observed in the light area and beneath the panels, which were significantly higher than those in the shade areas (S). There is a significant difference in the individual factor irrigation (I) treatments. No significant interactions were found between potassium (K) and irrigation (I) treatments. However, the interaction between potassium (K) and shade (S) treatments and irrigation (I) and shade (S) were significant. Specifically, the combination of irrigation level (I0.35) and shade (S) resulted in lower carbohydrate levels than all other I*S interactions, except for the I0.5*L combination. On the other hand, the I0.35*S interaction produced the highest carbohydrate concentration among all I*S treatments, significantly greater than all other treatments except I0.35*S. Significant effects were found for tri-variate interactions.
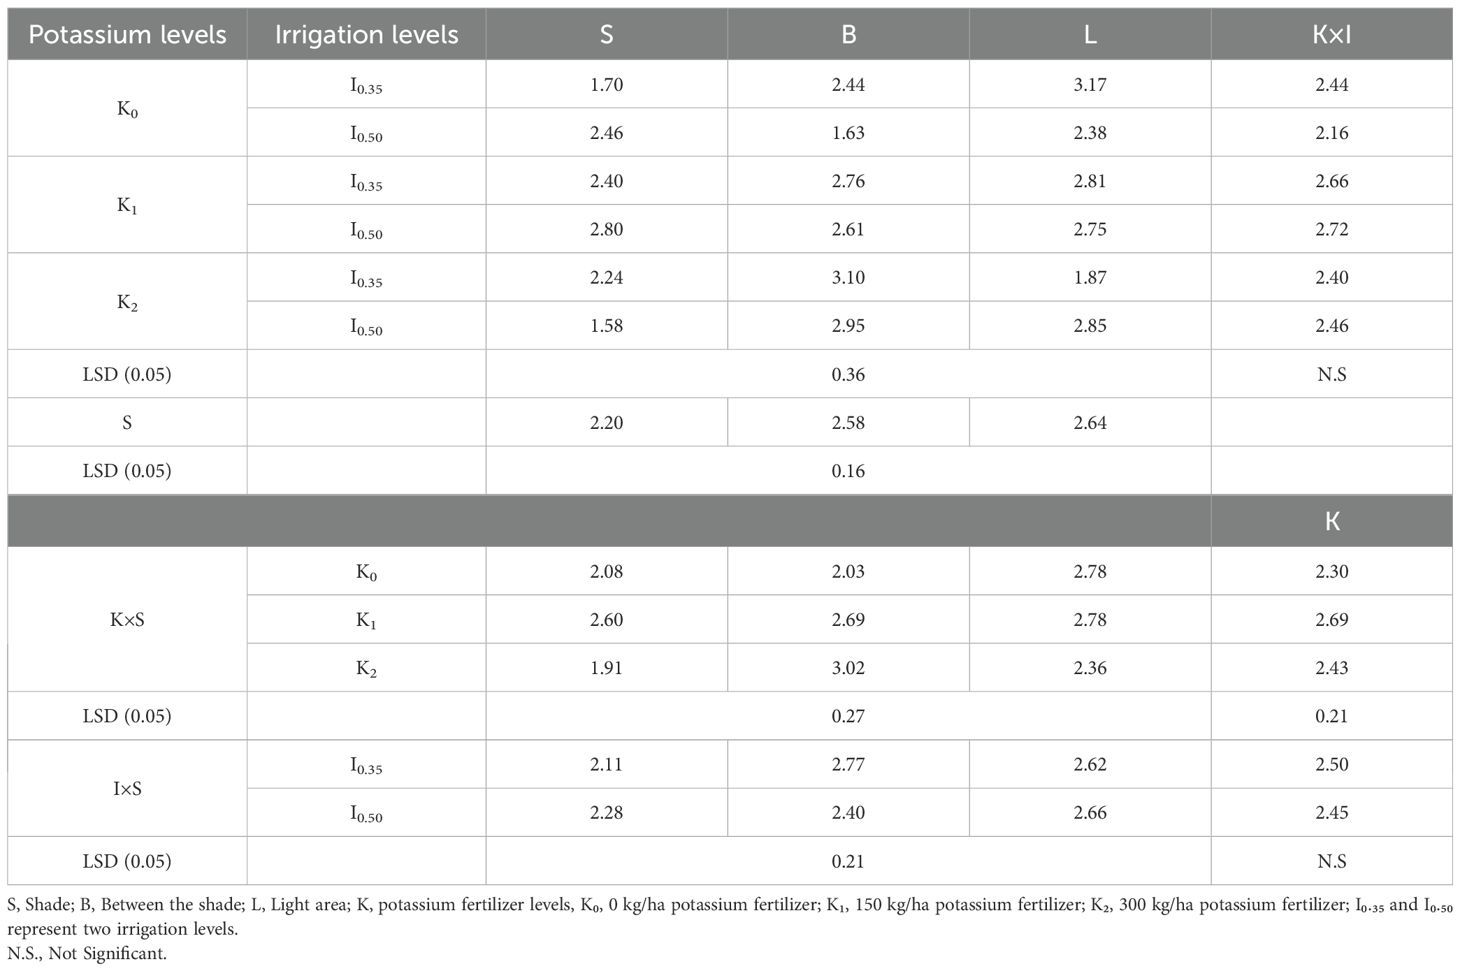
Table 10. Effect of shade, partial shade and light, irrigation, potassium fertilizer, and their interactions on total carbohydrate concentration in the potatoes.
Available nitrogen concentration in the soil
The statistical analysis of available nitrogen concentration in the soil is presented in (Table 11). Only the individual irrigation factor was found to be significant with I0.35. Significant interactions were found between potassium (K) and shade (S) treatments and between irrigation (I) and shade (S) treatments. Tri-variate interactions were found to be significant. B*I*K interactions were significant with I0.35*K2*B (400.50) statistically different (higher) from all full sun treatments, shaded and I0.35 treatments, and partially shaded and I0.5 treatments. The combination of full shade and 35% irrigation deficit likely reduces nitrogen leaching, as the cooler, less water-stressed environment beneath the panels could reduce evaporation and runoff, helping to retain nitrogen in the soil. This interaction, coupled with the low potassium application, may optimize soil conditions for nitrogen availability.
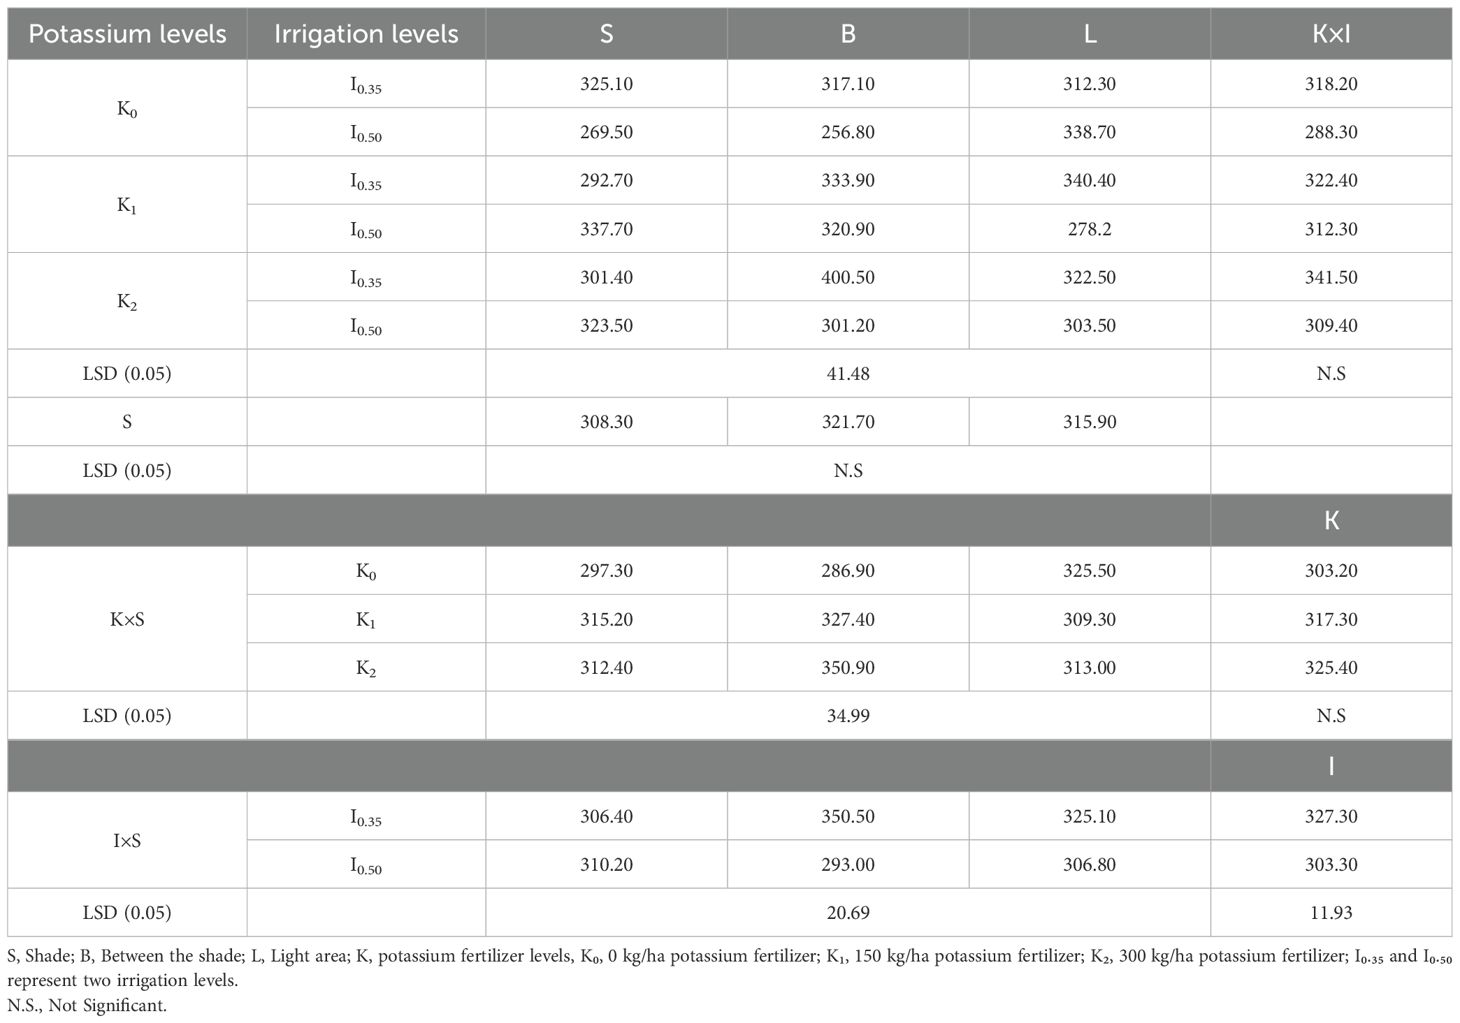
Table 11. Effect of shade, partial shade and light, irrigation, potassium fertilizer, and their interactions on Nitrogen concentration in the soil.
Available phosphorus concentration in the soil
Table 12 presents the statistical analysis of available phosphorus concentration in the soil. The potassium levels had significant differences. The potassium and irrigation levels had significant differences. Treatments with higher levels of potassium K2 had higher phosphorus in the soil than treatments with lower K0 levels. Significant interactions were found between potassium (K) and shade (S) treatments and between irrigation (I) and shade (S) treatments. Treatments with lower levels of irrigation I0.5 had less phosphorus in the soil than treatments with lower I0.5 levels. K*S interactions were found to be significant. K2*B was significantly higher than K1*S. I*S interactions were found to be significant. I0.5*S was significantly lower than I0.35*S. The tri-variate interactions between S*I*K were found to be significant with I0.35*K1*B significantly greater than I0.5*K1*S, I0.35*K2*L, I0.35*K0*B, and I0.5*K0*L, respectively.
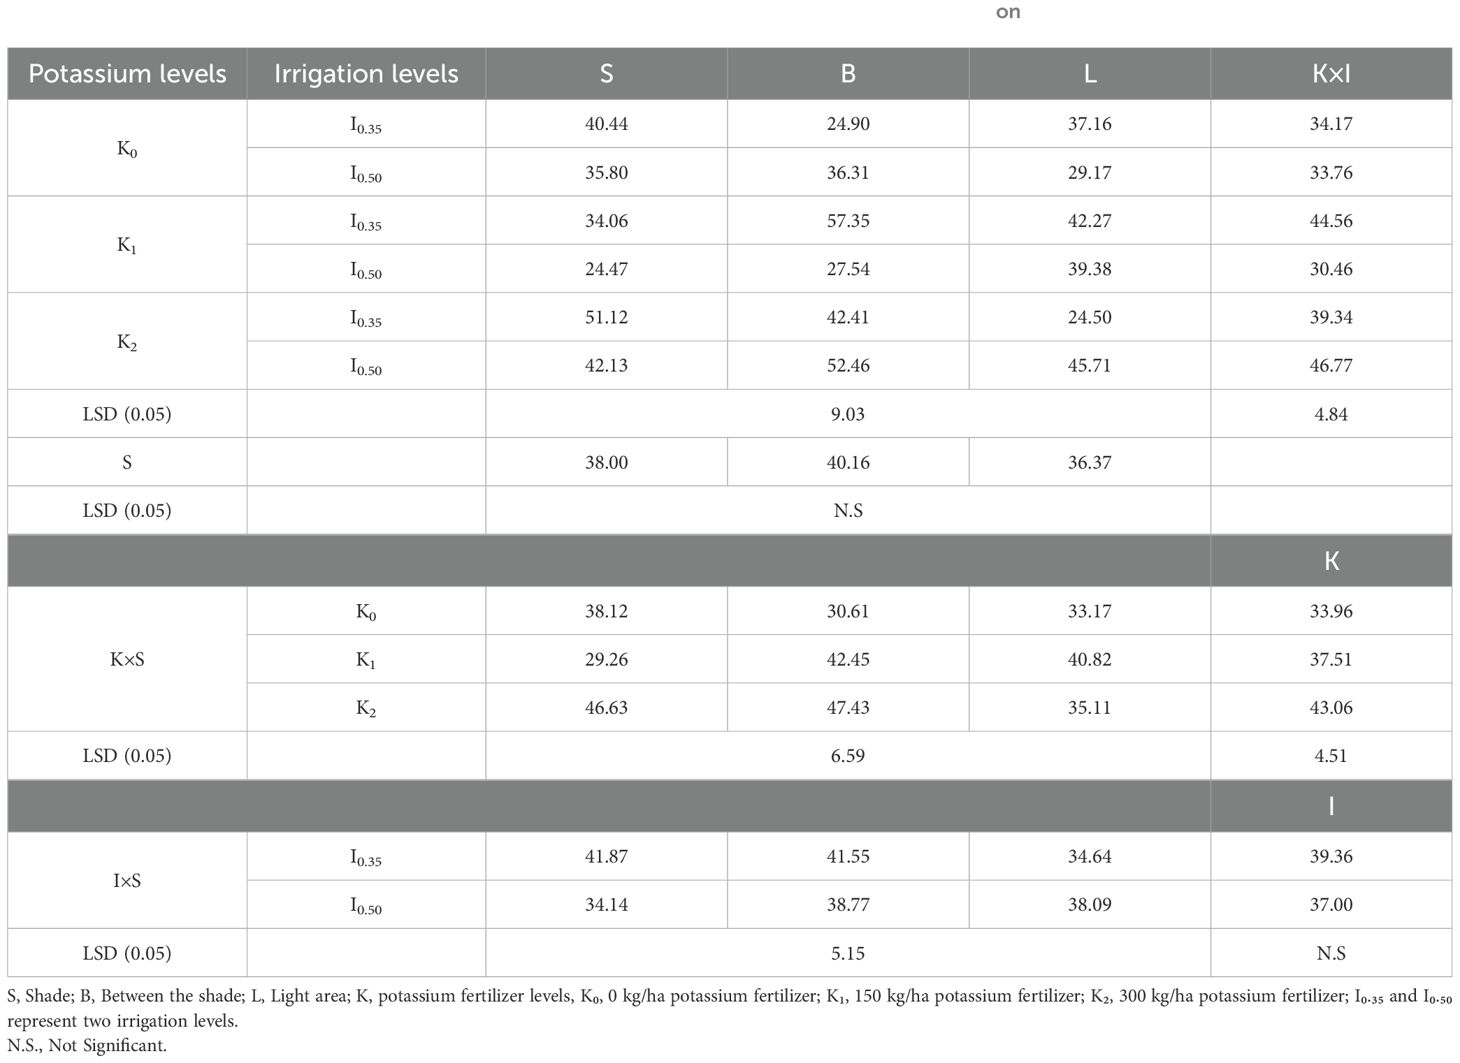
Table 12. Effect of shade, partial shade and light, irrigation, potassium fertilizer, and their interactions on phosphorus concentration in the soil.
Available potassium concentration in the soil
Table 13 shows the statistical analysis of available potassium concentration in the soil. The shade levels had significant differences. Between the shade and the shade treatment areas were higher than the light area. K*I interactions were found to be significant. K2*S was significantly higher than K1*L. K*S interactions were found to be significant. K2*S was significantly higher than K1*L. I*S interactions were found to be significant. I0.5*L was significantly lower than I0.5*B. There were many significant tri-variate interactions. The tri-variate interactions between K2*I0.5*L were significantly smaller than K2*I0.5*S but no other full sun treatments. K0*I0.35*S was significantly smaller than all partial shade (B treatments) except K1*I0.35*B and is smaller than all other shade treatments. K2*I0.5*L was significantly smaller than all partial shade treatments except K1*I0.35*B and K2*I0.5*B. K2*I0.5*L was significantly smaller than half of the full shade treatments: K0*I0.35*S, K0*I0.5*S, K1*I0.5*S, K1*I0.35*S, and K2*I0.35*S.
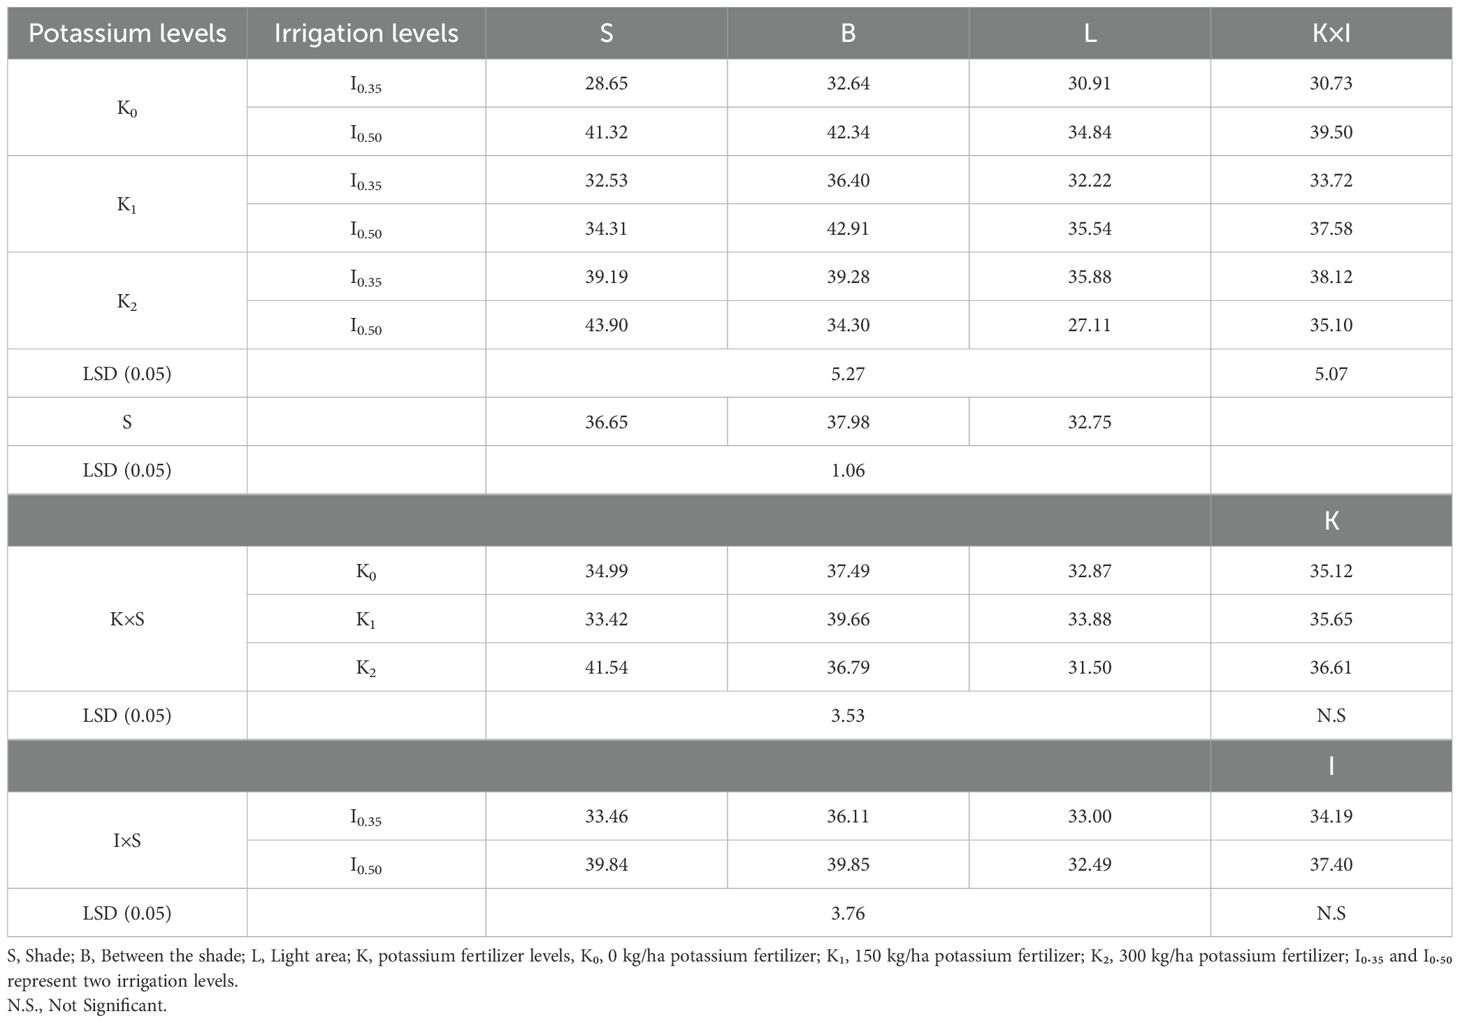
Table 13. Effect of shade, partial shade, and light, irrigation, potassium fertilizer, and their interactions on potassium concentration in the soil.
It is notable that the treatment with the most fertilizer, most water, and most sun was statistically similar to the plot with the least fertilizer, least water, and least sun. These 2 plots represented the 2 lowest potassium concentrations in the soil.
Total yield, water applied, reduction, and water productivity
The results indicate that total yield increased in the partially shaded zones between the panels. The differences in the light conditions were more pronounced at 35% irrigation deficit relative to the 50% irrigation deficit levels, respectively (Figure 4). The statistical analyses show a significant reduction with a p-value (0.05) in the total yield of the potatoes below the panels in full shade (S) to both higher light-level treatments. These differences were significant for both 35% and 50% irrigation deficit levels. There were no significant differences (p>0.05) in the total yield for plant growth between the panels (B) and the full light control (L) at each 35% and 50% irrigation deficit level, respectively. A statistically significant difference in total yield was found between irrigation treatments within the full shade (S) treatments and the partial shade (B) treatments. The 35% irrigation deficit led to higher yields relative to the 50% irrigation deficit levels. However, there were no significant differences in the total yield between the 35% and 50% irrigation levels within the full light control (L). The results regarding total yield are consistent with findings from other research (Şentürk et al., 2025).
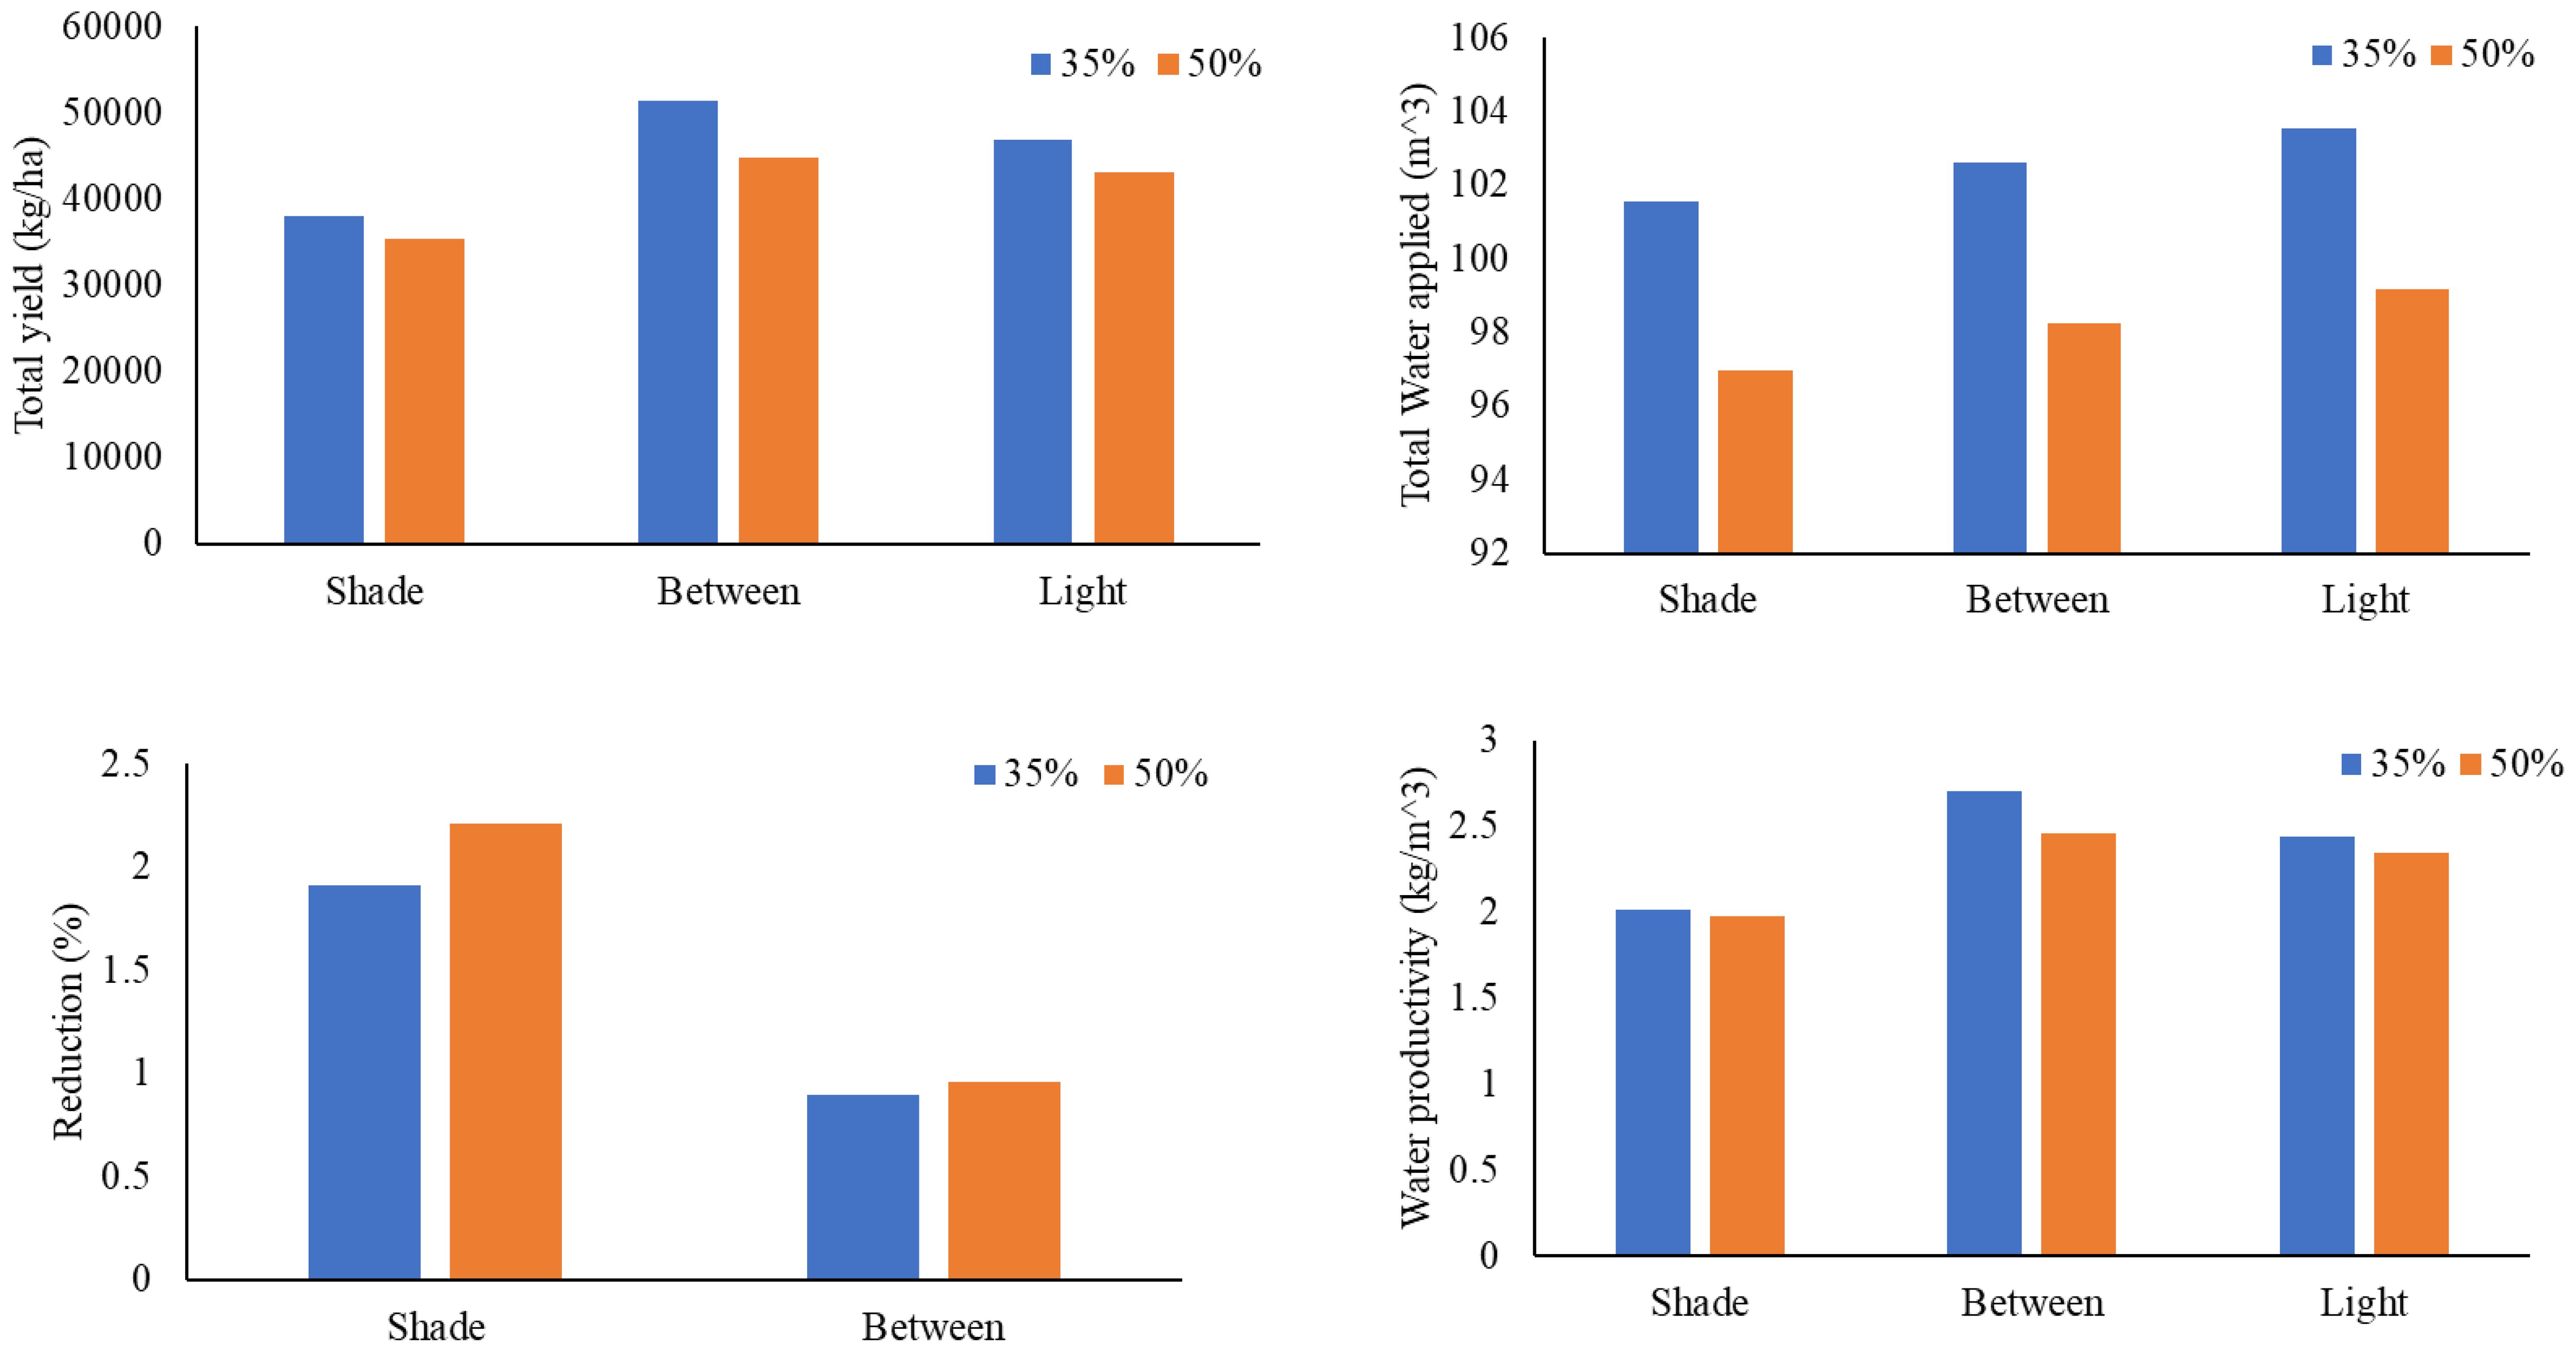
Figure 4. Presents the total yield, total water applied during the season, Water reduction percentage, and water productivity. This represents a summary of the measurements from the 54 plots within the experimental area. Yield was measured as the total yield of the 72 plants in each plot.
Statistically different amounts of water were applied to all plots. That is, the total water applied at the full shade (S), partial shade (B), and light (L) plots was significantly different even within the 35% deficit level and within the 50% level, respectively (Figure 4). Note that the irrigation levels increase as the total light on the plots increases for both deficit irrigation levels. This is because the 100% irrigation level is determined by available soil moisture as measured (see methods section). That the shaded plants required less watering is consistent with prior agrivoltaic studies (Al-Agele et al., 2021b) However, the total reduction in water by percentage is less than initially anticipated given the level of shade (Figure 4). This could be explained by the exceptionally hot growing conditions with daily temperatures exceeding 40°C and relative humidity (93%). The results regarding the total water applied are consistent with findings from other research (Marrou et al., 2013).
Water productivity was calculated as the total yield (kg) divided by the total water applied (m³) to each treatment (Figure 4). The results indicate that water productivity for plant growth between the panels was high, measuring approximately 2.80 kg/m³ at 35% deficit irrigation levels. In contrast, the lowest water productivity was observed in the shaded area, at about 1.95 kg/m³ under 50% deficit irrigation levels. Statistical analyses revealed a significant difference in water productivity between plant growth in the panels and full light conditions compared to deficit irrigation levels, with a p-value of 0.05. The results regarding water productivity are consistent with findings from other research (Endrie, 2017).
Conclusion
Global agricultural production is expected to rise in response to population growth, and this increase in production is more desirable when achieved through sustainable methods. Agrivoltaic systems represent a promising solution that could facilitate sustainable agriculture while enhancing agricultural output. This study aimed to examine the growth of potato plants both beneath and between simulated solar panels, as well as in a control area, under two levels of deficit irrigation (35% and 50%) and three levels of potassium sulfate fertilizer.
The highest yields were found in the partially shaded zones between panels. These yields were statistically similar to those obtained from the full sun treatment, and both partial shade and full sun resulted in statistically higher yields compared to the full shade directly beneath the panels. These yield differences did not correspond to reductions in nitrogen, phosphorus, or carbohydrate levels in the potatoes. The potatoes grown in the partially shaded area, where yield was greatest, exhibited statistically higher levels of potassium compared to the full sun treatment. Conversely, the potatoes grown in the fully shaded condition directly beneath the panels had significantly higher protein levels than both the partial shade and full sun treatments. We conclude that irrigated potatoes grown in the partially shaded areas between panels are just as productive as those grown in an open field. Furthermore, no sacrifices in nutritional content were detected between the potatoes grown in the partially shaded area between the simulated solar panels and the full sun condition. Indeed, the potatoes grown in treatment B had similar or greater nutritional content than the L treatments, with potassium being the only nutrient that was statistically greater in B treatments.
The study highlights the potential of Agrivoltaic systems to enhance agricultural productivity by providing optimal shading conditions (particularly in partial shade) while improving land use efficiency. However, it also underscores the importance of balancing water management to ensure crop health and yield under varying irrigation regimes. The results suggest that integrating partial shading with moderate irrigation deficit could effectively improve potato production, particularly in water-scarce areas.
The study demonstrates that Agrivoltaic systems, especially with partial shading, can improve water productivity, making them a promising solution for sustainable farming in regions with water limitations. By carefully balancing light levels and irrigation, such systems can help maximize crop yield per water unit, contributing to more sustainable and efficient agricultural practices. This approach could be scaled to other crops and regions, helping to meet growing food demands while mitigating the environmental impact of traditional farming practices.
Data availability statement
The raw data supporting the conclusions of this article will be made available by the authors, without undue reservation.
Author contributions
IW: Investigation, Writing – review & editing, Formal Analysis, Writing – original draft, Methodology. HA-A: Visualization, Formal Analysis, Resources, Writing – original draft, Project administration, Funding acquisition, Data curation, Supervision, Methodology, Conceptualization, Validation, Investigation, Software, Writing – review & editing. CH: Methodology, Writing – review & editing, Data curation, Formal Analysis, Writing – original draft.
Funding
The author(s) declare that no financial support was received for the research and/or publication of this article.
Conflict of interest
The authors declare that the research was conducted in the absence of any commercial or financial relationships that could be construed as a potential conflict of interest.
Generative AI statement
The author(s) declare that no Generative AI was used in the creation of this manuscript.
Publisher’s note
All claims expressed in this article are solely those of the authors and do not necessarily represent those of their affiliated organizations, or those of the publisher, the editors and the reviewers. Any product that may be evaluated in this article, or claim that may be made by its manufacturer, is not guaranteed or endorsed by the publisher.
References
Abubakar S. I., See C. H., Sukki F. M., Mahendiran R., Sundaram S., Abidin M. I. Z., et al. (2025). Deploying agrivoltaics in sub-saharan africa: A sustainable pathway towards energy-food security-challenges and opportunities: A review. IEEE Access. doi: 10.1109/ACCESS.2025.3568717
Al-Agele H. A., Nackley L., and Higgins C. W. (2021a). A pathway for sustainable agriculture. Sustainability (Switzerland) 13, 4328. doi: 10.3390/su13084328
Al-Agele H. A., Proctor K., Murthy G., and Higgins C. (2021b). A case study of tomato (Solanum lycopersicon var. Legend) production and water productivity in agrivoltaic systems. Sustainability (Switzerland) 13, 1–13. doi: 10.3390/su13052850
Barron-Gafford G. A., Pavao-Zuckerman M. A., Minor R. L., Sutter L. F., Barnett-Moreno I., Blackett D. T., et al. (2019). Agrivoltaics provide mutual benefits across the food–energy–water nexus in drylands. Nat. Sustainability 2, 848–855. doi: 10.1038/s41893-019-0364-5
Buresh R. J., Austin E. R., and Craswell E. T. (1982). Analytical methods in 15 N research. Fertilizer Res. 3, 37–62. doi: 10.1007/BF01063408
Cammerino A. R. B., Ingaramo M., Piacquadio L., and Monteleone M. (2025). How much longer can we tolerate further loss of farmland without proper planning? The agrivoltaic case in the apulia region (Italy). Agronomy 15, 1177. doi: 10.3390/agronomy15051177
Chae S.-H., Kim H. J., Moon H.-W., Kim Y. H., and Ku K.-M. (2022). Agrivoltaic Systems Enhance Farmers’ Profits through Broccoli Visual Quality and Electricity Production without Dramatic Changes in Yield, Antioxidant Capacity, and Glucosinolates. Agronomy 12, 1415. doi: 10.3390/agronomy12061415
Elamri Y., Cheviron B., Lopez J. M., Dejean C., and Belaud G. (2018). Water budget and crop modelling for agrivoltaic systems: application to irrigated lettuces. Agric. Water Manage. 208, 440–453. doi: 10.1016/j.agwat.2018.07.001
Endrie B. (2017). Evaluation of Water Saving, Yield and Water Productivity of Potato (Solanum Tuberosum L.) by Using Wetting Front Detector and Different Levels of Fertilizer Application at Koga Irrigation Scheme in Amhar Region, Ethiopia. (Doctoral dissertation). Haramaya University.
Gorjian S., Bousi E., Özdemir ÖzalE., Trommsdorff M., Kumar N. M., Anand A., et al. (2022). Progress and challenges of crop production and electricity generation in agrivoltaic systems using semi-transparent photovoltaic technology. Renewable Sustain. Energy Rev. 158, 112126. doi: 10.1016/j.rser.2022.112126
Herbert D., Phipps P. J., and Strange R. E. (1971). Determination of total carbohydrates. Methods Microbiol. 5, 290–344. doi: 10.1016/S0580-9517(08)70641-X
Keeney D. R. and Nelson D. W. (1982). Nitrogen—Inorganic forms. Methods Soil Analysis: Part 2 Chem. Microbiological Properties 9, 643–698. doi: 10.2134/agronmonogr9.2.2ed.c33
Khudhair M. A., Sahib M. R., and AL-Agele H. A. (2025). Interactive Effects of Agrivoltaic Shading, Irrigation, and Biofertilizers on the Chemical Composition of Lettuce Leaves (Lactuca sativa L.): Pengaruh Interaktif Peneduh Agrivoltaic, Irigasi, dan Pupuk Hayati terhadap Komposisi Kimia Daun Selada (Lactuca sativa L.). Indonesian Journal on Health Science and Medicine. 1, 10–21070. doi: 10.21070/ijhsm.v2i1.56
Li F., Meng P., Fu D., and Wang B. (2008). Light distribution, photosynthetic rate and yield in a paulownia-wheat intercropping system in China. Agroforestry Syst. 74, 163–172. doi: 10.1007/s10457-008-9122-9
Marrou H., Wéry J., Dufour L., and Dupraz C. (2013). Productivity and radiation use efficiency of lettuces grown in the partial shade of photovoltaic panels. Eur. J. Agron. 44, 54–66. doi: 10.1016/j.eja.2012.08.003
Mazzeo D., Zio A. D., Pesenti C., and Leva S. (2025). Optimizing agrivoltaic systems: A comprehensive analysis of design, crop productivity and energy performance in open-field configurations. Appl. Energy 390, 125750. doi: 10.1016/j.apenergy.2025.125750
Murphy J. and Riley J. P. (1962). A modified single solution method for the determination of phosphate in natural waters. Analytica Chimica Acta 27, 31–36. doi: 10.1016/S0003-2670(00)88444-5
Olsen S. R. and Sommers E. L. (1982). Phosphorus soluble in sodium bicarbonate. Methods Soil Analysis Part 2, 404–430. doi: 10.2134/agronmonogr9.2.2ed.c24
Omer A. A. A., Li M., Liu X.-l., Liu W.-j., Liu Y., Mukhtar Y. M.F., et al. (2024a). “The effect of the novel agricultural photovoltaic system on water evaporation reduction and sweet potato yield,” in International Petroleum and Petrochemical Technology Conference. (Singapore: Springer Nature 718 Singapore) 567–578. doi: 10.1007/978‑981‑99‑2649‑7_50
Omer A. A. A., Liu W., Liu X., Li M., Zhang X., Chen F., et al. (2024b). “Effects of agricultural photovoltaic systems development on sweet potato growth: novel agrivoltaics for water food energy nexus,” in AgriVoltaics Conference Proceedings, Vol. 1. doi: 10.52825/agripv.v1i.588
Potenza E., Croci M., Colauzzi M., and Amaducci S. (2022). Agrivoltaic system and modelling simulation: A case study of soybean (Glycine max L.) in Italy. Horticulturae 8, 1160. doi: 10.3390/horticulturae8121160
Ramos-Fuentes I. A., Elamri Y., Cheviron B., Dejean C., Belaud G., and Fumey D. (2023). Effects of shade and deficit irrigation on maize growth and development in fixed and dynamic agriVoltaic systems. Agric. Water Manage. 280, 108187. doi: 10.1016/j.agwat.2023.108187
Rastovski A. and van Es A. (1987). Storage of Potatoes. Post-Harvest Behaviour, Store Design, Storage Practice, Handling. No. Ed. 2, pp. 468-pp.
Richards L. A. (1954). Diagnosis and Improvement of Saline and Alkali Soils (No. 60). (US Government Printing Office).
Şentürk B., Öylek Y., Kanar Z. S., Çelik R., Kurtuluş G., and Özden T. (2025). The impact of photovoltaic panels on the environment and yield parameters in an open field agrivoltaic system: A case study in Ayaş, Ankara. Renewable Energy, 123553. doi: 10.2139/ssrn.5035143
Keywords: potassium sulfate, agrivoltaic system, crop production, deficit irrigation (DI), water productivity
Citation: Witwit IMT, Al-agele HA and Higgins CW (2025) The effect of agrivoltaic system on nutrient content, yield, and water productivity of potatoes. Front. Hortic. 4:1624013. doi: 10.3389/fhort.2025.1624013
Received: 06 May 2025; Accepted: 16 June 2025;
Published: 07 July 2025.
Edited by:
Xiao Yang, Chinese Academy of Agricultural Sciences, ChinaReviewed by:
Monica De Caroli, University of Salento, ItalyAlfadhl Alkhaled, University of Maryland Eastern Shore, United States
Copyright © 2025 Witwit, Al-agele and Higgins. This is an open-access article distributed under the terms of the Creative Commons Attribution License (CC BY). The use, distribution or reproduction in other forums is permitted, provided the original author(s) and the copyright owner(s) are credited and that the original publication in this journal is cited, in accordance with accepted academic practice. No use, distribution or reproduction is permitted which does not comply with these terms.
*Correspondence: Hadi A. Al-agele, YWxhZ2VsZWhAb3JlZ29uc3RhdGUuZWR1