 Bidhya Sharma
 Tim R. Moore
 Nigel T. Roulet
- Department of Geography, McGill University, Montreal, QC, Canada
Peat-based growing substrates are commonly used in specialty crop production. The decomposition rates of peat and the respiration dynamics of plants grown in peat mixtures are poorly understood. We grew lettuce (Lactuca sativa) and petunia (Petunia sp.), representing food and ornamental plant growth, in peat-based media and measured the exchange of carbon dioxide (CO2), nitrous oxide (N2O), and methane (CH4) over 3 to 4 months. We used radiocarbon isotopes to partition ecosystem respiration (ER) into autotrophic respiration (AR) and heterotrophic respiration (HR) and estimated the priming effect of roots to enhance peat HR. Average (± standard deviation) N2O emissions were 2.69 ± 3.47 mg m−2 day−1, while CH4 emissions were variable and small. HR measured from peat alone was on average 0.28 ± 0.15 g CO2-C m−2 day−1. Average net ecosystem exchange (NEE) and ER measurements for pots containing lettuce were −1.17 and 2.09 g CO2-C m−2 day−1, respectively, and NEE and ER for pots containing petunia were −0.62 and 2.96 g CO2-C m−2 day−1, respectively. Without considering the priming effect, HR contributed 9% and 13% to the total ER in lettuce and petunia, respectively. Radiocarbon partitioning of ER revealed that HR contributes 10% and 18% for lettuce and petunia, showing a statistically significant positive priming (p = 0.007) effect in petunia but not in lettuce. Our measurements provide a basis for the reporting of GHG emissions from horticultural plants grown in peat-based growing media.
1 Introduction
Peat is used as a growing media for food and ornamental plant production, which is expected to increase by fourfold in the future (Blok et al., 2021). While the extraction of peat contributes to greenhouse gas emissions (Clark et al., 2023; He et al., 2023), containerized peat-based growing media also emit CO2 gas, losing approximately 5% carbon (C) per year (Sharma et al., 2024). This loss can be incorporated into national greenhouse gas inventories (Sharma et al., 2025). However, it remains unknown if peat substrates decompose at the same rate when plants are grown in them.
Accumulation of peat in northern peatlands occurs over millennia under low-temperature and water-logged conditions (Frolking and Roulet, 2007). When peat is extracted and used in warm, aerobic environments in horticulture, decomposition is faster, releasing more CO2 into the atmosphere. Extracted peat in Canada is used almost exclusively in horticulture as substrate for growing plants (Cleary et al., 2005), mostly in controlled environment agriculture (CEA), in greenhouses, and by the ornamental plant industry, which includes floriculture, fruits and vegetable production, mushroom cultivation, cannabis production, shrubs and trees including seedlings for reforestation, and home gardening (Alvarez et al., 2018).
Technological advances in growing food products in controlled environments, where the growth environment is isolated from fluctuating weather conditions, mean that the demand for cultivation in CEA is rising and, with it, the demand for horticultural peat (Blok et al., 2021; Schmilewski, 2008). On average, 0.6 Mt C year−1 is removed from Canadian peatlands for horticultural use (Environment & Climate Change Canada, 2023), and the extraction amount is following an increasing trend (Sharma et al., 2025). In 2022, CEA, mushroom, and specialized greenhouse flower and plant producers were the dominant users of peat as a growing media, covering an area of 32 km2 with a Canadian farm gate value of over $2.5 × 10⁹ CAD (Agriculture And Agri-Food Canada, 2023a, 2023). Significant research exists on the C footprint and mitigation strategies on conventional agriculture in mineral and increasingly in peat soils (Taft et al., 2017; Säurich et al., 2019; Ma et al., 2021; Menegat et al., 2022), and the numbers are included in most of the national inventories. In contrast, research on greenhouse gas (GHG) emissions from CEA is not widely available, and in Canada, except for emissions from limestones and fertilizers, the emissions from the horticulture sector in general are not included in national GHG reporting (Environment & Climate Change Canada, 2023). Measurements of GHG exchanges in horticultural plant cultivation are few and do not separate the respiration components into plant-derived and soil-derived (Marble et al., 2011; Murphy et al., 2021). Emission factors (EFs) for organic agricultural soil, natural or disturbed peatlands, or mineral soils are not likely to reflect emissions from the horticultural use of peat owing to differences in the depth of peat used, nutrient conditions, and management practices. As Canada moves to net-zero targets by 2050 (Environment & Climate Change Canada, 2023), there is a need to develop accurate and representative EFs for the horticultural sector.
When peat C is used in horticulture, it is exposed to aerobic decomposition and released back to the atmosphere as CO2 through heterotrophic respiration (HR). When a plant is grown in peat-based media, the net CO2 exchange (net ecosystem exchange, NEE) in full light is the difference between the sum of autotrophic respiration (AR) by plants and HR by soil and the uptake of CO2 by plants. Carbon dioxide uptake by plants, which happens as a result of photosynthesis, is called gross primary productivity (GPP). During dark conditions, GPP ceases, and ecosystem respiration (ER = AR + HR) is the dominant exchange and can be directly measured under dark conditions. However, in horticultural peat with added limestone or dolomite to buffer acidity, the apparent HR from soil includes limestone-derived CO2 (Kunhikrishnan et al., 2016; Biasi et al., 2008; Sharma et al., 2024). δ13C tracers can be used to separate isotopically depleted biotic emissions from enriched limestone emissions to obtain the total CO2 values from these two sources, i.e., biotic and limestone-derived (Fry, 2006).
Subtracting the HR value measured in the fallow setups from the ER measurements with plants in dark chambers gives a reasonable estimate of AR from plants (Hicks Pries et al., 2013). However, this largely ignores the role that roots play in enhancing or suppressing the decomposition of soil. This is known as the priming effect (Blagodatskaya and Kuzyakov, 2008; Kuzyakov et al., 2000), where root exudates stimulate microbial activity in the rhizosphere and cause an associated increase in the decomposition of the peat.
Natural radiocarbon 14CO2 can be used to provide information about the age of soil C and the age of respired CO2. When respiration comes from two sources of widely differing age (contemporary plants and older peat), the 14CO2 can be used to partition total respiration into the two contributing fractions. In a horticultural setting, peat-based substrate is older C, and fresh plant biomass has a contemporary radiocarbon signature (Torn et al., 2009), which provides an ideal setup to partition the sources. Carbon dioxide values from setups with plants are a mixture of the two sources, and it is possible to separate AR (plant-based) and HR (soil-based) from the ER (total respiration) measured. By contrasting the calculated HR using the radiocarbon method with the HR measured from the fallow peat-only setup, we can aim to understand the priming effect. Several studies have used isotope-based tracers to understand the priming effect in laboratory and field studies to partition respiration sources (Hicks Pries et al., 2013; Bader et al., 2018; Biasi et al., 2013). In thawing permafrost, Hicks Pries et al. (2013) found that AR accounted for 40% to 70% of ER, and its relative contribution depended on the growing season. Assuming no impact of priming effect in increasing or decreasing soil respiration, in an ombrotrophic bog, Rankin et al. (2023) measured that the AR contribution to ER was ~75%.
The primary aim of this study was to quantify emissions of CO2, CH4, and N2O from horticultural systems that use peat-based growing media. Our specific aims were to estimate:
1. Respiration components of peat and plants in a peat-based horticultural system.
2. The potential increase in peat HR with the introduction of plants in the soil.
To represent different horticultural systems, we selected lettuce, representing food production, and petunia, representing the ornamental industry. We partition total CO2 measurements into different respiration components and estimate the impact of roots in increasing peat HR using natural radiocarbon of 14CO2. We hypothesize that the introduction of horticultural plants in a peat-based substrate induces a positive priming effect.
2 Methods
2.1 Experimental setup and design
We sourced two different types of commercial horticulture peat which contained sphagnum peat moss, perlite, limestone, and wetting agents. A total of 220 g of oven-dry equivalent peat-based growing media (peat hereafter) was placed into 40 different pots (30.5 cm diameter, 20 cm height) of 5 L volume. The peat had an initial gravimetric moisture content of 43% ( ± 5.49), pH of 5.71 ( ± 0.23), and a C:N ratio of 40 ( ± 4.33). CO2 was measured from pots (n = 12 for the two types of peat) with only peat to determine HR in the absence of plants.
Lettuce (Lactuca sativa) and petunia (Petunia × hybrida) seedlings were obtained from Jolly Farms, New Brunswick, Canada, and transplanted individually in pots (n = 28, 7 replicates for two plant types grown in two different types of peat) on 3 March 2022. The experiment was set up in a controlled growth chamber zone at McGill University Phytotron. The growth chambers were set at a temperature of approximately 23°C, 75% relative humidity, a diurnal light schedule of 16 h, photosynthetic photon flux density (PPFD) of 300 μmol m−2 s−1, and under ambient CO2 conditions (~420–450 ppm). The growth period for the lettuce and petunia plants was 90 and 120 days, respectively. Plants grown in peat and fallow peat were fertilized with 100 mL of a 1,000 mg L−1 of 20–20–20 water-soluble NPK fertilizer (The Scotts Miracle-Gro, Ohio, United States) every 2 weeks.
2.2 Chamber setup and CO2 measurements
We conducted direct CO2 measurements in the pots using transparent chambers manually. Chambers of 20 L volume were fitted with a fan to allow for adequate mixing and were placed on water-filled saucers to ensure that the chambers were air-tight. Measurements on CO2 exchange on the transparent chambers in full light represented NEE, and dark measurements with covered (opaque) chambers represented ER. Measurements using covered chambers without plants represented HR from the soil. For plant setups, we assumed that AR = ER − HR.
In all cases, we measured CO2 concentrations in the chamber every second over a period of approximately 5 min, using an SBA-5 CO2 gas analyzer (PP Systems, USA). Then, we calculated CO2 flux rates from the rates of change in concentration within the headspace volume for the given surface area extent of the pot. Flux rates are expressed as g CO2-C m−2 day−1. We adopted the convention that a positive NEE value represents a net emission of C and a negative value represents net uptake of C.
2.3 Environmental variables and biomass measurement
We measured temperature and moisture in each pot after taking the CO2 measurements. Temperature and soil moisture were measured at a depth of 12–15 cm of peat. Soil moisture was measured using an MP406 soil moisture sensor, ICT International, Australia. Pots were watered every week to a volumetric water content of ~30% (v/v) after taking the CO2 measurements. In addition, we monitored the plant growth index by measuring the height and width of the plant. We complemented dimension measurements with images of plants together with a reference to a known measurement. The number of pixels in the reference was then used to calculate the areal extent and the plant biomass using a Photoshop application. At the end of the experiment, we carried out destructive sampling, washed the plant roots, measured the dry mass of aboveground and belowground plant biomass, and converted the mass to C by a 50% conversion.
2.4 δ13C–CO2, CH4, and N2O measurements
On day 50 of the experiment, in subsamples (n = 3 each for fallow peat, lettuce, and petunia grown in peat substrates), we collected gas samples in a closed chamber to determine the δ13C (V-PDB) signature of CO2 and CH4 and N2O emissions. A 25-mL sample was taken at 0, 10, 20, 30, 40, and 50 min. Five milliliters of the sample was used to measure CO2, CH4, and N2O concentrations on a Shimadzu GC-2014 gas chromatograph equipped with a methanizer and flame ionization detector. Nitrogen was the carrier gas. The SRI column temperature was 70°C, and the flame ionization detector (FID) temperature was 110 110°C. Three to five standards of 5,000, 5, and 20 ppm of CO2, CH4, and N2O, respectively, were run through the GC before, during, and after the sampling period. Methane and N2O emission rates were calculated from the rates of change in concentration within the headspace, expressed in mg m−2 day−1.
For δ13C determination, the remaining 20 mL of the sample was run through a G2201-i CRDS Isotopic Analyzer system (Picarro, Santa Clara, CA). During each sampling period, two replicate CO2 standards of 850 ppm and −28.5‰ VPDB and an ambient air sample were run through the instrument. Measurements on the standards had a standard error of <0.4‰ throughout the sampling period. The isotopic analyzer system was calibrated prior to the measurement period with two additional isotopic standards (100% CO2) with δ13C values of −15.6 and −43.2‰ VPDB (Stix et al., 2017). δ13C of emitted CO2 was calculated using Keeling plots, where intercepts were accepted only when the regression coefficient was >0.9 (Keeling, 1958; Pataki et al., 2003).
2.5 14CO2 isotope gas collection and analysis
On the final day of sampling, we used the same closed chambers to collect the emitted CO2 for 14CO2 isotope analysis. An opaque 20-L chamber was placed on the water-filled saucer and allowed to accumulate CO2 for 5 to 30 h based on CO2 emission rates, to obtain sufficient mass of C to allow 14C measurement. The longer hours for collection were to allow for fallow peat samples to accumulate at least 2 mg C to be collected in 1 L gas jars from the headspace. A minimum of 2 mg C was required for 14C analysis of CO2 in the air.
After the period, a pump with a low flow rate was used to collect 1–2 L of gas. All the gas samples were sent to the AMS Laboratory, University of Ottawa, to be processed for 14C analysis.
Radiocarbon analyses were performed on an Ionplus AG MICADAS (Mini Carbon Dating System). 12,13,14C+1 ions were measured at 200 kV terminal voltage with He stripping. Data were processed using the BATS data reduction software as described by Wacker et al. (2010). The fraction modern carbon, F14C, was calculated as the ratio of the sample 14C/12C to the standard 14C/12C (Ox-II) measured in the same data block. Both 14C/12C ratios were background-corrected, and the result was corrected for spectrometer and sample preparation fractionation using the online AMS-measured 13C/12C ratio and was normalized to δ 13C (PDB). Radiocarbon ages were calculated as −8033 ln (F14C) and reported in percent modern carbon (pMC) as described by Stuiver and Polach (1977).
To determine the radiocarbon signature of the respired CO2 and to partition it into old and new C, we first corrected for the background CO2 concentration and the background F14C signature following Wang et al. (2021) and used the following equation to calculate the F14C value of the respired CO2.
Where CO2ms and CO2bac are the CO2 concentrations at the start and the end of the chamber closure. F14Cms is the measured signature of the emitted CO2. F14Cbac is the signature of background CO2. For the background signature, we used the mean value of −9‰ (pMC = 1.0017) for the year 2022 from Niwot Ridge station (Levin et al., 2023).
For the plants grown in peat-based media, using the isotope signature, we divided the total respiration into AR and HR using a two-carbon source model. The measured F14C-CO2 from peat and F14C of the background, representing the signature of the plants, were used to calculate the fraction of respiration from peat and from plants using the equation below (Wang et al., 2021):
Where fplant and fpeat are the relative contributions by plant and peat to total ecosystem respiration measured in the setups with plants.
2.6 Statistical analyses
Statistical analyses were performed using the R Statistical Software version 4.0.2 (R Core Team, 2021). We use linear models to understand the influence of environmental variables (biomass, temperature, moisture) on the fluxes measured. Fit of the models was checked using the distribution of the residuals and p-values of the model. Comparison among the treatments was done using ANOVA or a t-test. Mean and standard error were reported, and an alpha of 0.05 was used to establish statistical significance.
3 Results
3.1 Carbon balance for horticultural plants
3.1.1 HR, ER, and NEE values
The loss of peat C through HR (fluxes from fallow peat) ranged from 0.05 to 0.55 g CO2-C m−2 day−1 (Figure 1) and did not differ between the two peat types used in the experiment (t = 0.06, df = 108.65, p = 0.94). Linear models indicate that the variations in temperature and moisture explained 14% of the variability observed in the flux measurements. Even though the experiments were done under controlled conditions, there were minor variations in the peat temperature, and HR generally increased with warmer soil temperature and drier conditions (Table 1). Temperature exerted more influence than moisture (t = 3.35 and −1.94, respectively).
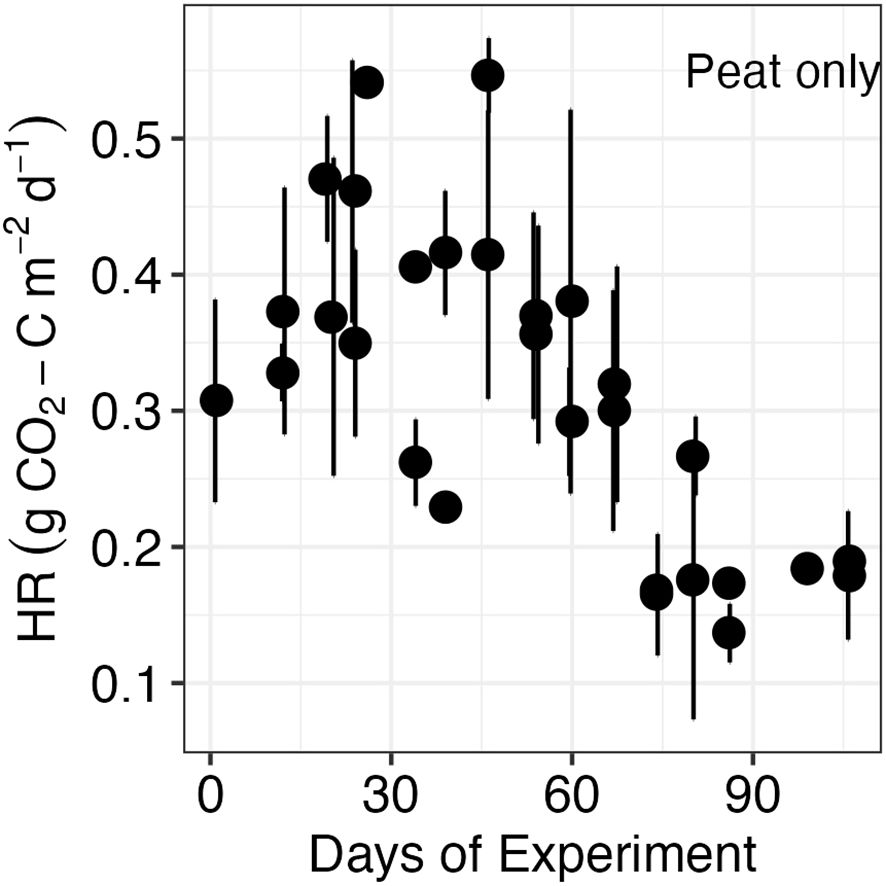
Figure 1. Heterotrophic respiration (HR) in fallow setups without plants in dark conditions. Dots represent the mean values (n = 12) for each measurement day, and error bars represent the standard deviation.
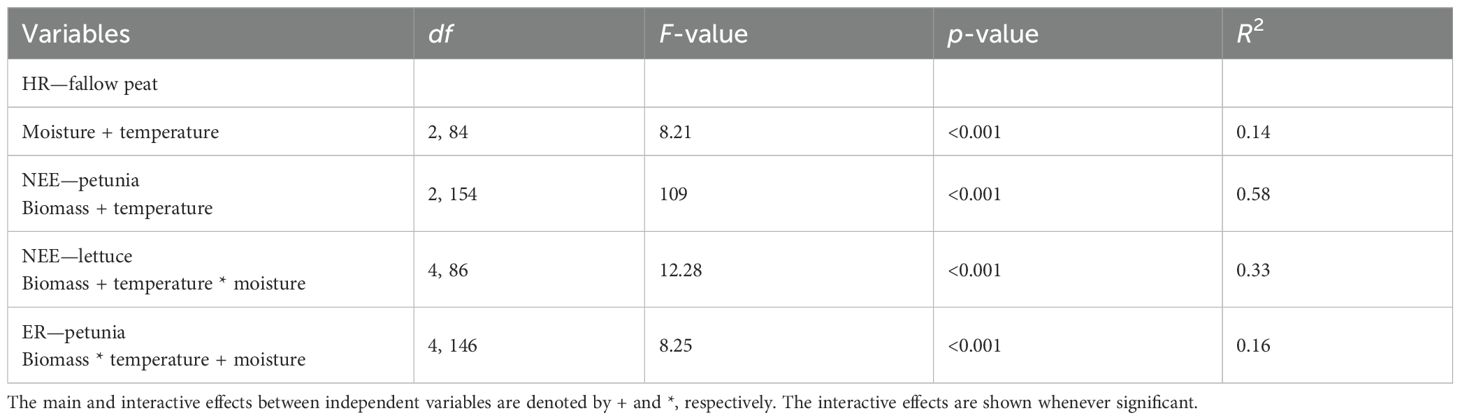
Table 1. Regression results between respiration fluxes and environmental variables.
The average of all measurements of NEE for lettuce for all the experiment days varied between −2.43 and 0.18 [mean = −1.7, sd = 0.85] g CO2-C m−2 day−1 (Figure 2). For petunia, the values ranged between −3.42 and 1.69 g CO2-C m−2 day−1 (Figure 2) [mean = −0.62, sd = 1.722]. In both cases, the NEE values followed the pattern of the plant growth, that is, when the plants started gaining biomass, NEE dropped, and the system became a total C sink. However, as plants reached their full growth potential, NEE again increased to around zero for lettuce or a net C source for petunia. For lettuce biomass, temperature, moisture, and the interaction term between temperature and moisture explained 33% of the variability observed in NEE measurements (Table 1). For petunia, biomass and temperature explained 58% of the variability observed in NEE measurements.
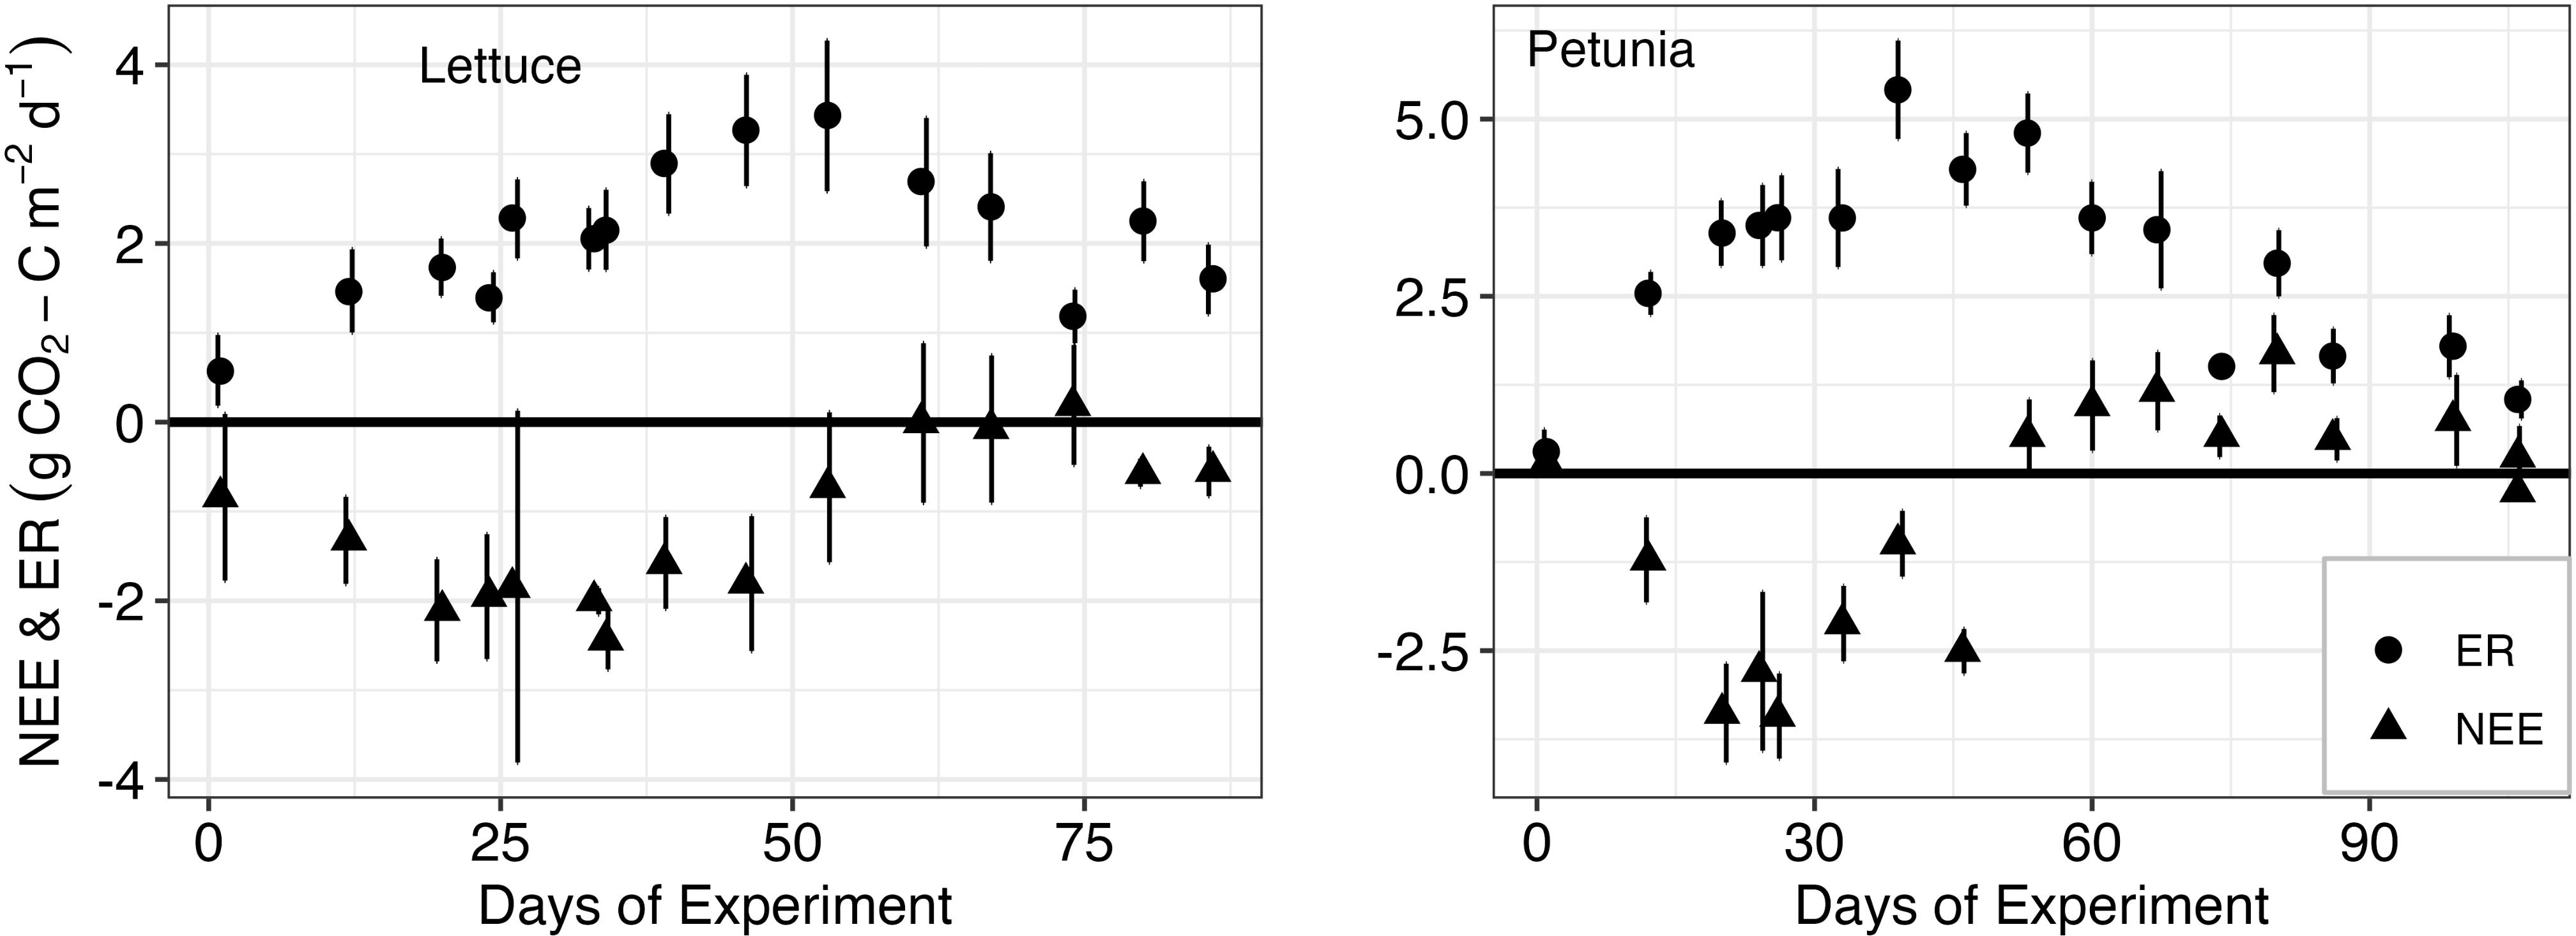
Figure 2. Net ecosystem exchange (NEE) and ecosystem respiration (ER) for lettuce and petunia from left to right. Dots represent the mean values (n = 14), and error bars represent the standard deviation around the mean.
For lettuce, ER varied between 0.57 and 3.43 g CO2-C m−2 day−1 [mean = 2.09, sd = 0.79], and for petunia, ER ranged between 0.3 and 5.41 g CO2-C m−2 day−1 [mean = 2.96, sd = 1.39]. For lettuce, none of the environmental variables measured significantly explained the variability in ER values.
Biomass, temperature, moisture, and an interaction term between biomass and temperature explained 16% of the variability observed in ER measurements in petunia samples (Table 1). The order of importance of independent variables on ER measurements was as follows: the interaction term between biomass and temperature, biomass, temperature, and moisture (t = 2.63, −2.73, −1.98, and 1.78, respectively).
3.1.2 Slight or no increase in peat HR with the introduction of plants
The radiocarbon pMC of solid peat was 0.81 ( ± 0.03), and the CO2 emitted from peat was 0.87 ± 0.05. The pMC of CO2 emitted from peat was lower than that from lettuce (0.98 ± 0.003) and petunia (0.97 ± 0.004), indicating a higher contribution of modern C to the overall CO2 emissions in lettuce and petunia compared to peat-only setups (Figure 3A).
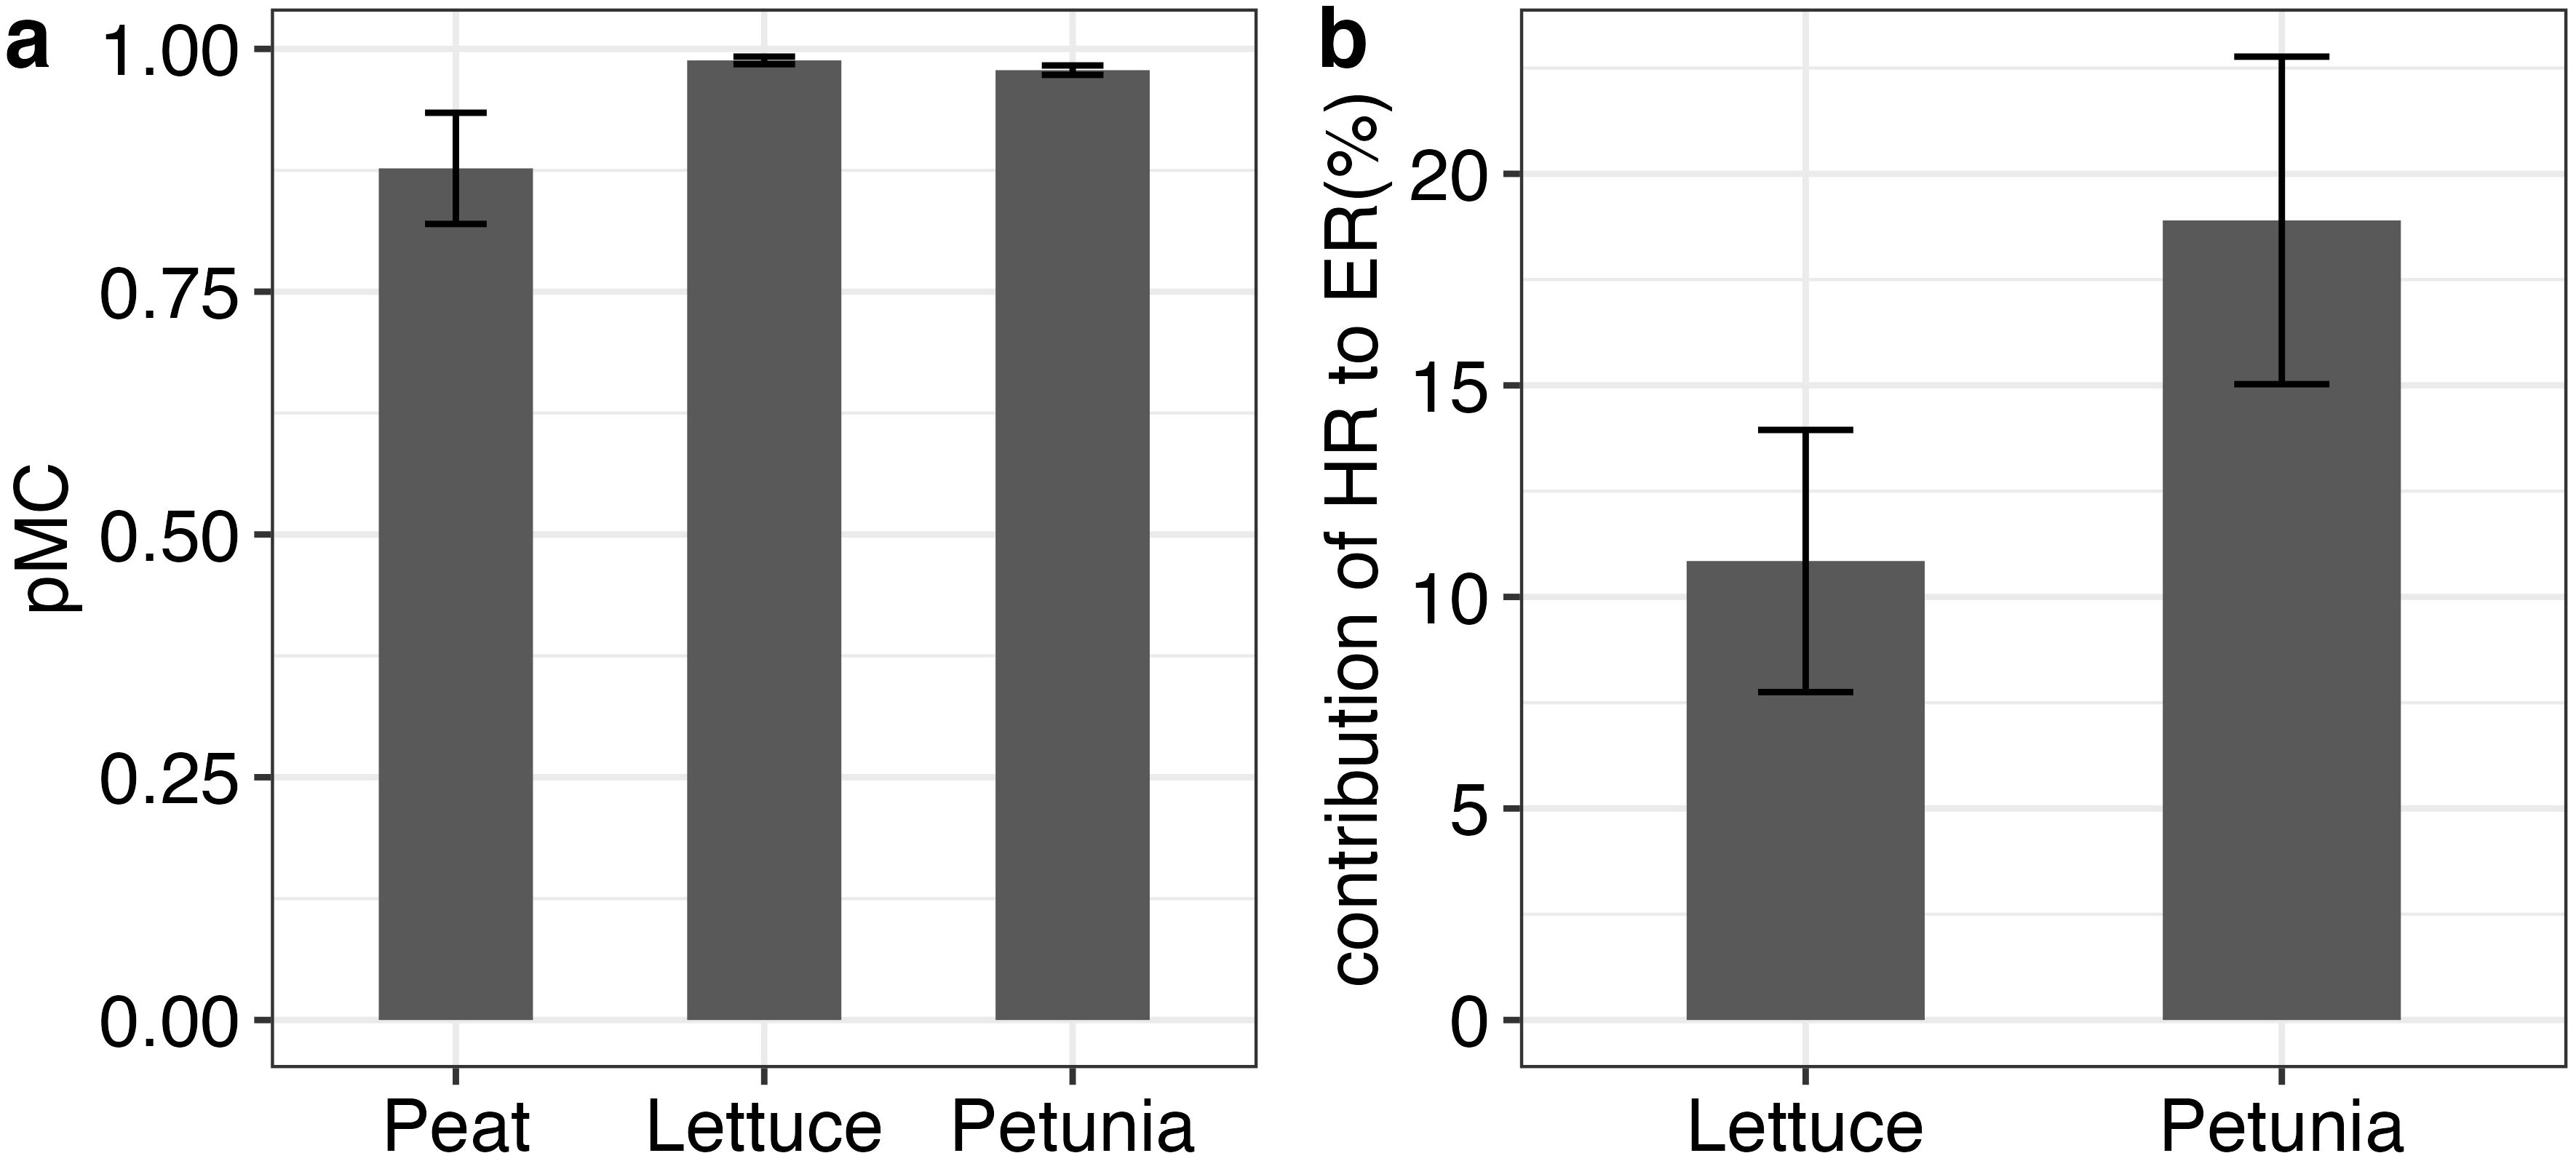
Figure 3. Measured percent modern carbon (pMC) CO2 values (A) and contribution of heterotrophic respiration (HR) to ecosystem respiration (ER) for lettuce and petunia calculated using the two-way mixing model (B); n = 6 for each of the groups. Error bars represent the standard deviation around the mean value measured.
When calculated using a two-component mixing model, peat-derived C contributed an average of 10 ( ± 3) % and 18 ( to ER in lettuce and petunia pots, respectively (Figure 3B). Peat-derived HR calculated in the lettuce was slightly larger but not statistically different than that for peat (lettuce = 0.14 g CO2-C m−2 day−1 and peat = 0.12 g CO2-C m−2 day−1 , p = 0.87), whereas peat-derived HR calculated in petunia was twice that of peat (petunia = 0.25 g CO2-C m−2 day−1 , p = 0.007) (Figure 4).
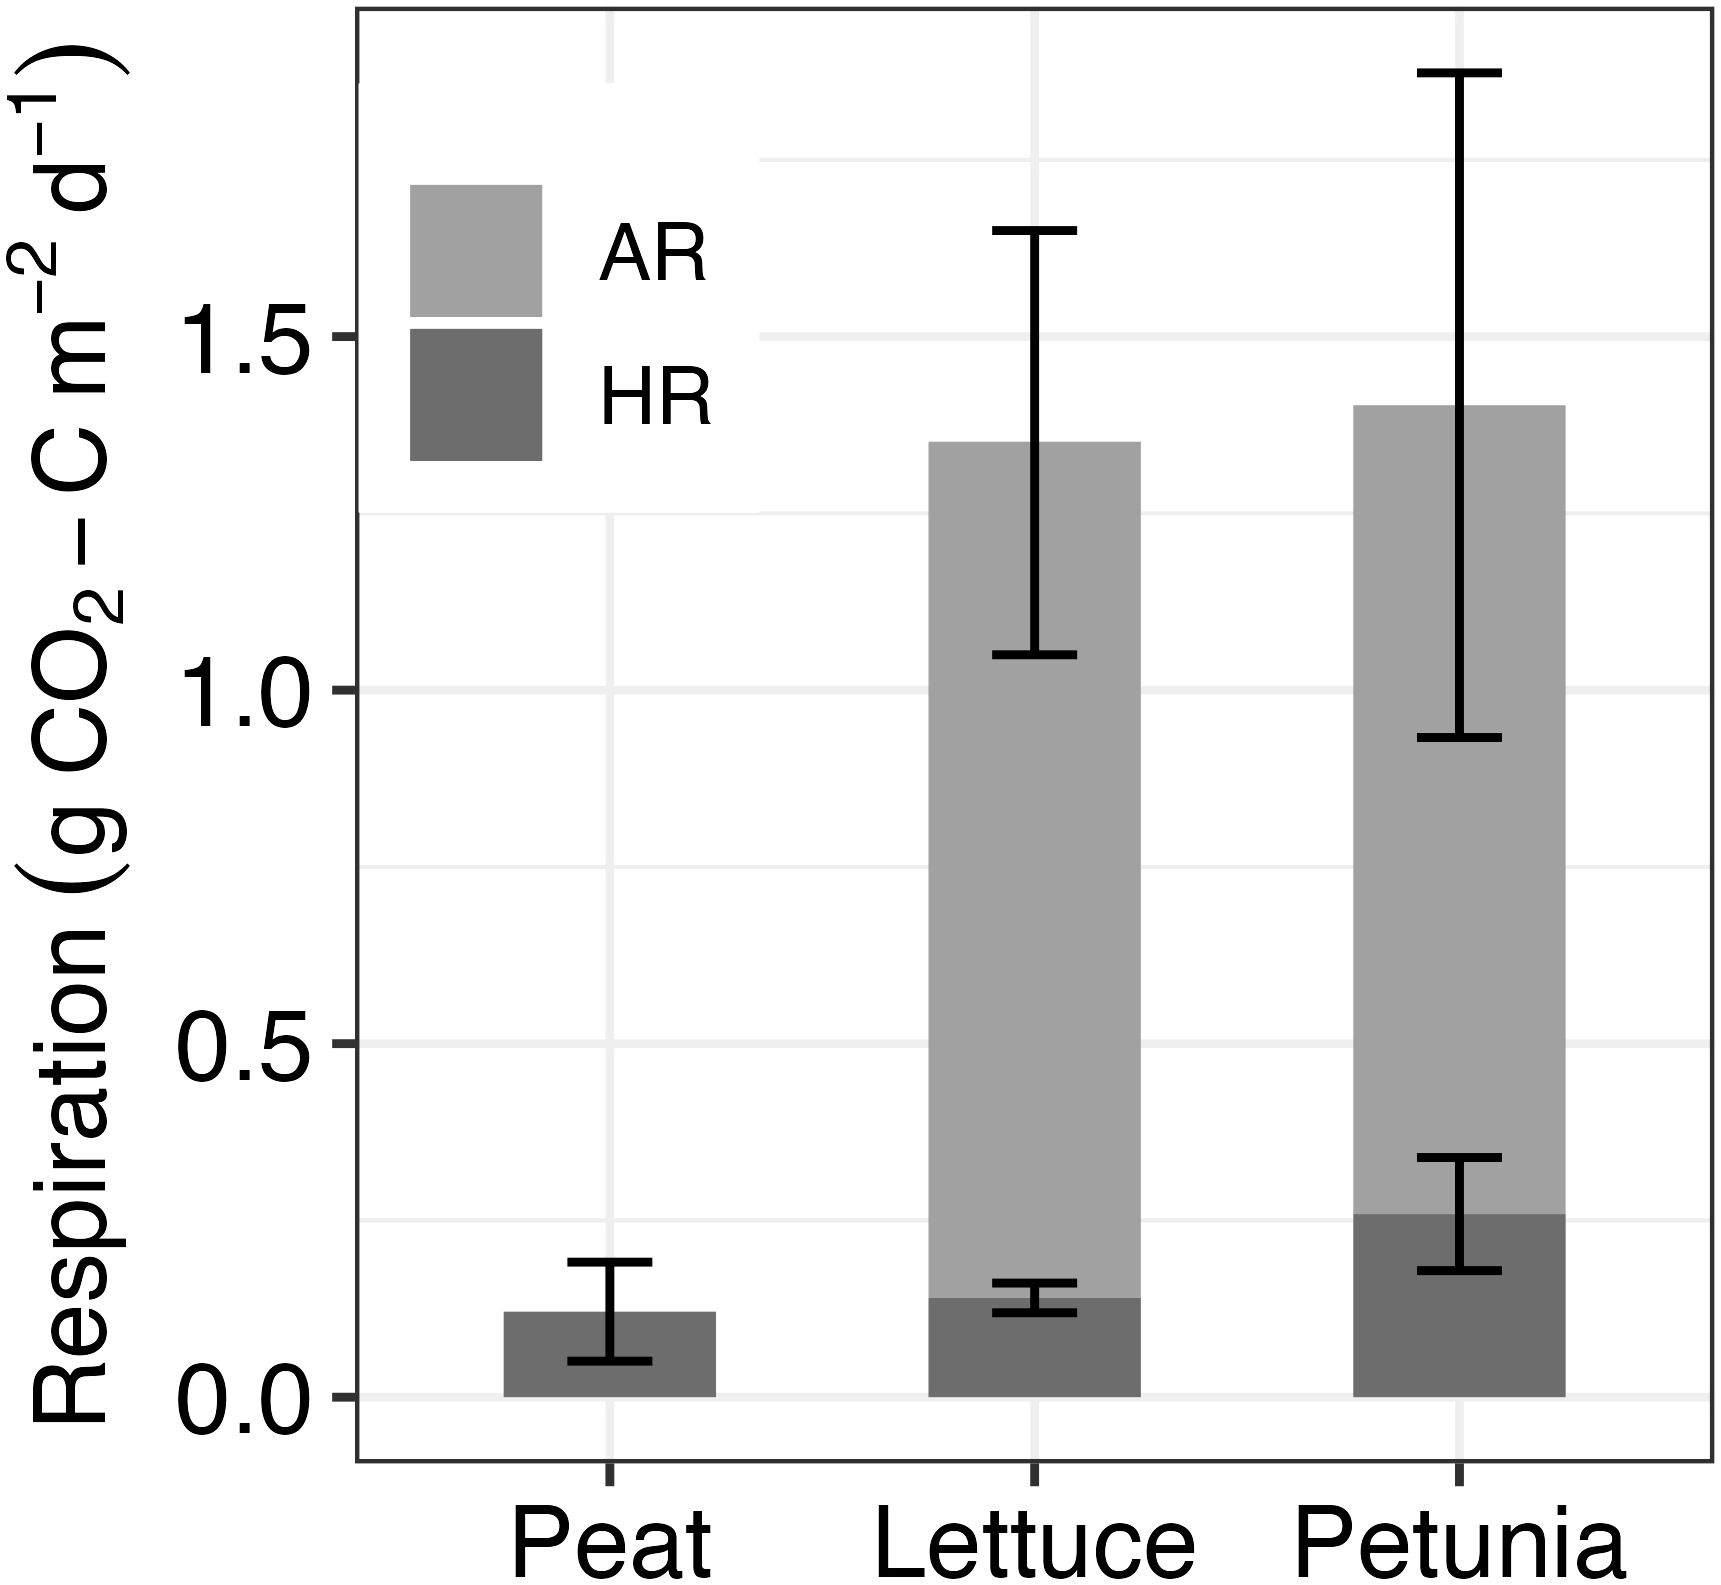
Figure 4. Heterotrophic respiration (HR) measured in peat and calculated contribution of autotrophic respiration (AR) to total respiration in lettuce and petunia samples. N = 6 for each of the groups. Calculations are made using radiocarbon signatures of peat, the present-day atmospheric signature, and the emitted CO2. Error values represent the standard deviation around the mean values calculated.
3.1.3 Apparent biomass accumulation larger than peat HR losses
Lettuce accumulated over 90 days 168 g C m−2, comprising 153 g C m−2 in the shoots and 14 g C m−2 in the roots (Figure 5). In petunia, total oven-dried biomass accumulated over 120 days was 225 g C m−2, comprising 212 g C m−2 in the shoots and 13 g C m−2 in the roots. These plant accumulations contrasted with the 26 and 34 g CO2-C m−2 lost from the peat alone, over 90 and 120 days.
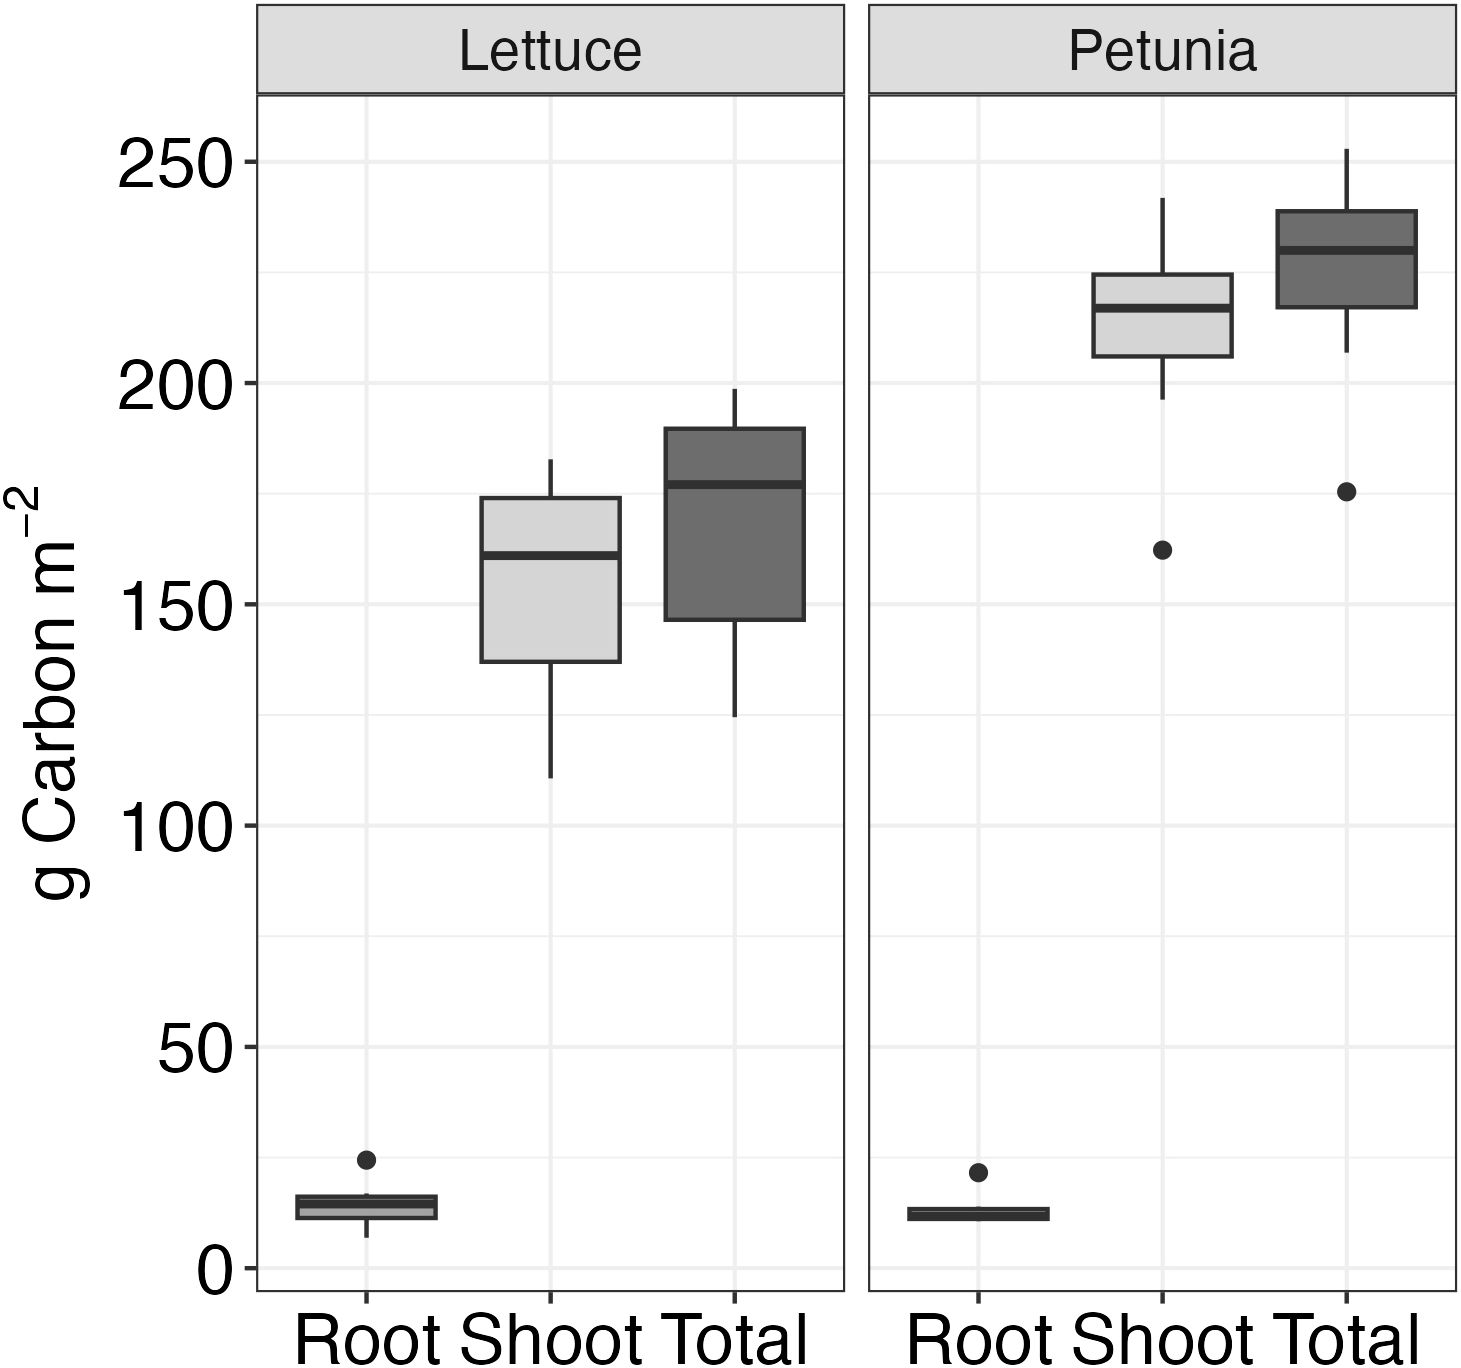
Figure 5. Dry biomass (separated into root and shoot components) measured at the end of the experiment period (n = 4) for each plant type.
3.2 δ13C– CO2 signatures, CH4, and N2O measurements
Values of CO2 ranged from −22.08‰ to −28.21‰, with an average value of −24.38‰ (Figure 6). The Kruskal−Wallis test showed that the values did not statistically differ between peat, lettuce, and petunia (K = 1.80, df = 2, p = 0.4).
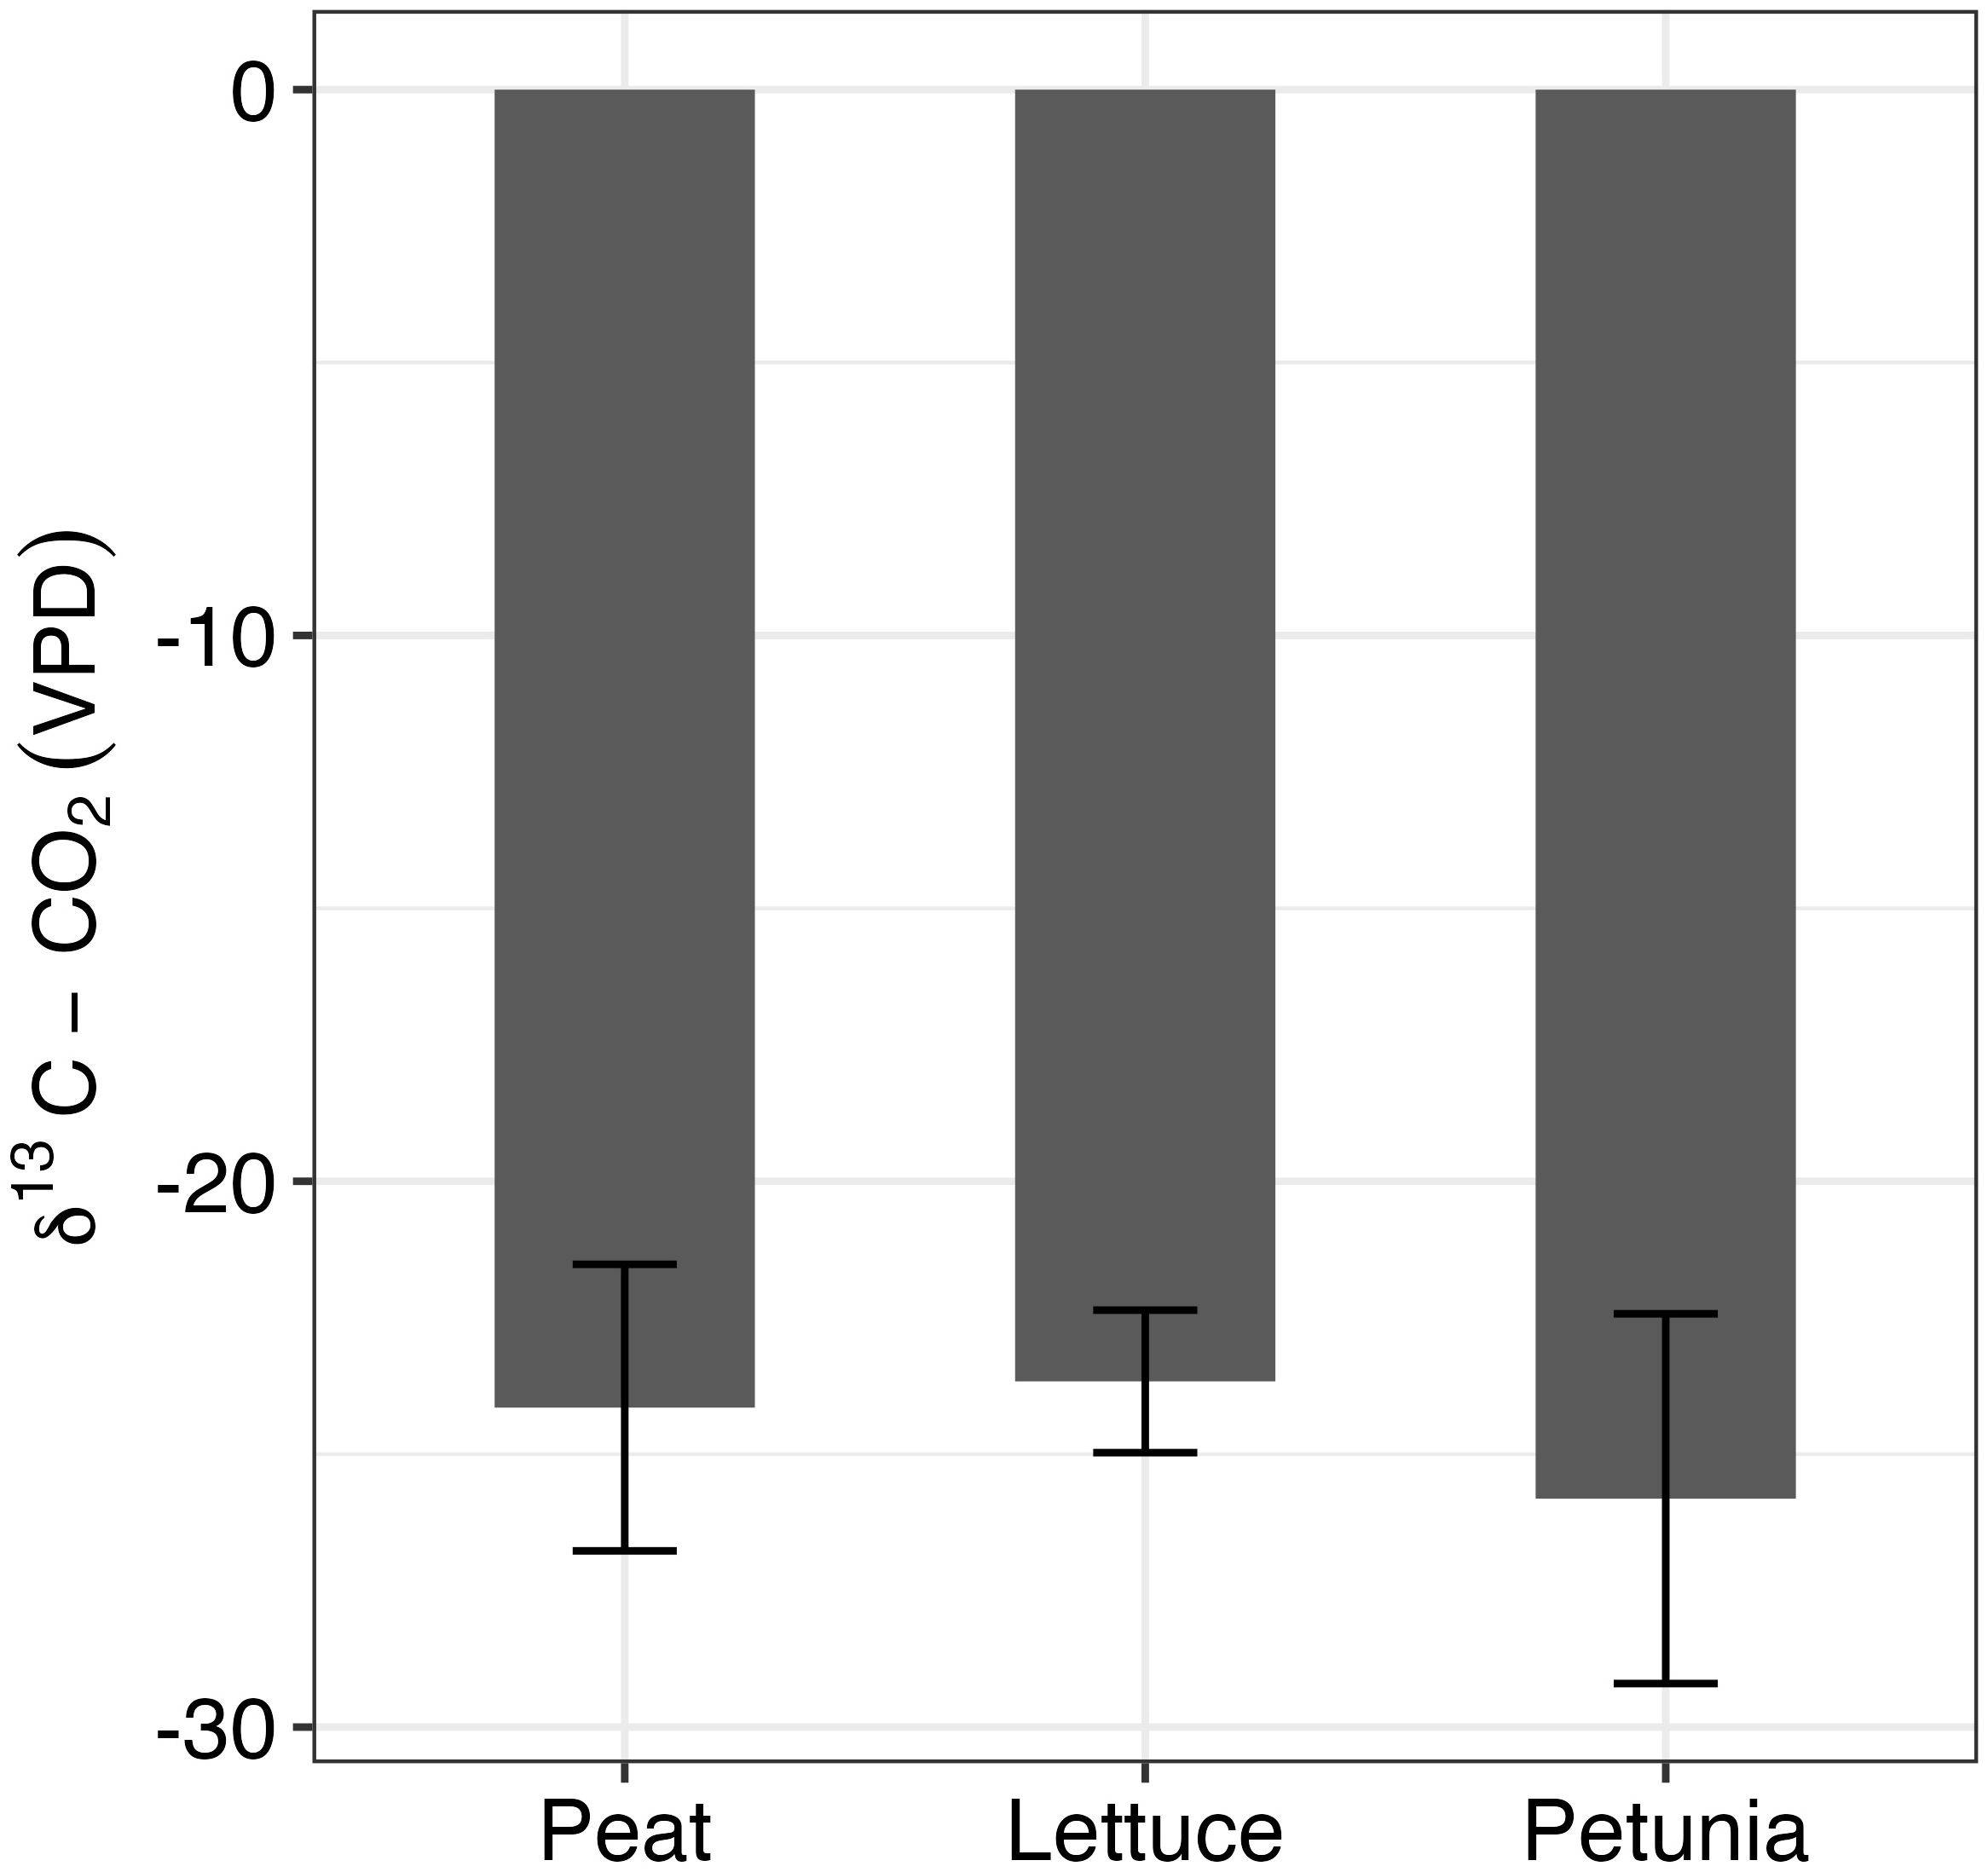
Figure 6. δ13C measurements for peat, lettuce, and petunia, respectively. n = 4 for peat and lettuce, and n = 3 for petunia. One-way ANOVA revealed no statistically significant difference among the three groups.
Measurement of CH4 and N2O fluxes showed a large range from source to sink, but they did not differ by treatment. The average CH4 flux was 0.55 mg m−2 day−1 ( ± 4.66) and did not differ between the treatments (K = 1.37, df = 2, p = 0.5) (Figure 7). The average N2O measurement for all the setups was 2.6 ( ± 3.47) mg m−2 day−1, which did not differ significantly between the treatments (K = 2.8, df = 2, p = 0.2) (Figure 7).
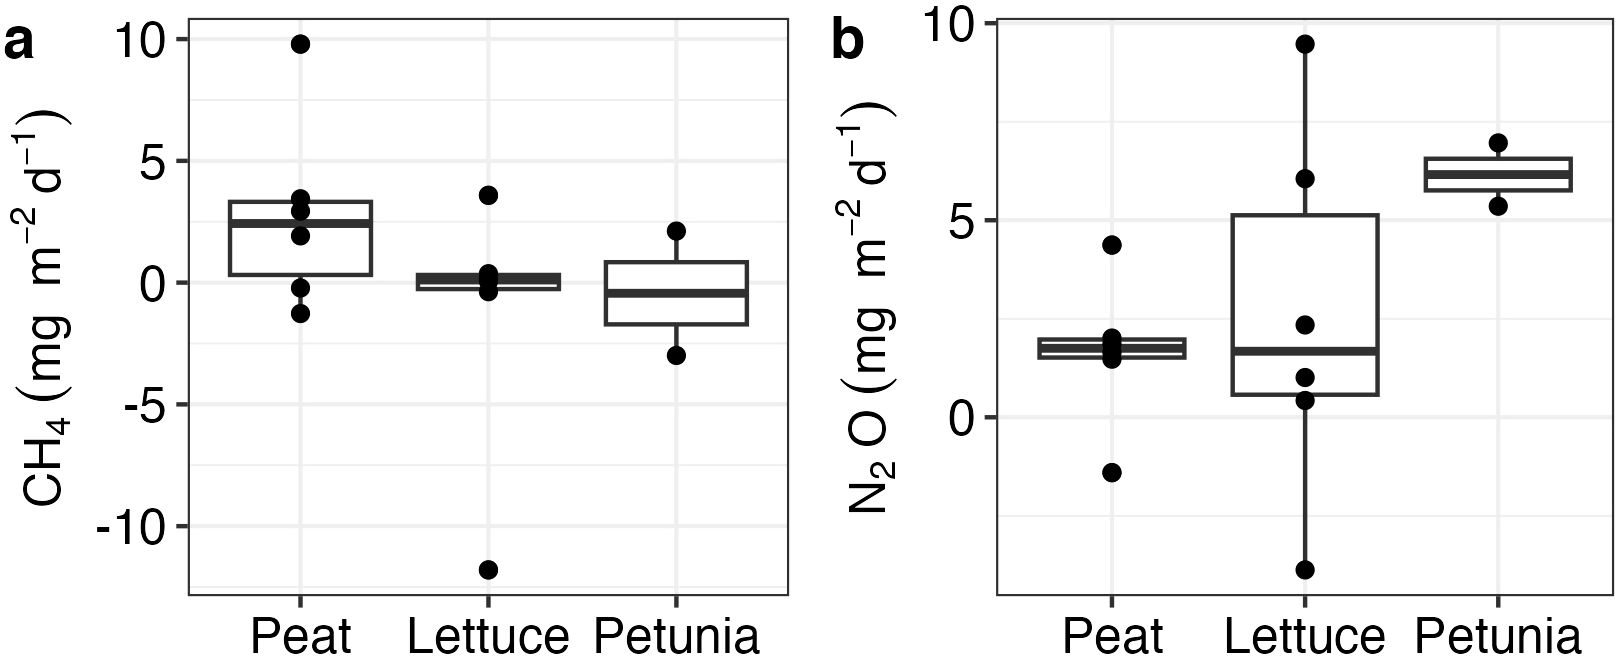
Figure 7. CH4 and N2O (A, B) measurements for different treatments. Measurements were done on day 50 of the experiment.
4 Discussion
We investigated the GHG emissions in plants grown in peat-based growing media by observing the exchange of CO2, N2O, and CH4. We used radiocarbon measurements to separate ER into plant and soil respiration components, and we examined the potential priming effect in increasing peat HR by plants. Finally, we measured the biomass of the plants grown, as the fate of the biomass needs to be accounted for in the assessment of the total C losses as CO2 to the atmosphere. Overall, NEE, ER, priming effect, and biomass accumulated depended on plant types, whereas N2O and CH4 fluxes did not vary between the two plants studied.
4.1 CO2 exchange
Heterotrophic respiration values measured in the fallow peat ranged between 0.05 and 0.7 g CO2-C m−2 day−1, combining both biotic respiration as well as abiotic dissolution of limestone added to raise the pH value of the substrate (Biasi et al., 2008). Sharma et al. (2024) showed that the contribution to CO2 from limestone is largest at the onset of addition and the contribution decreases over time. Potentially reflective of diminishing limestone contribution to CO2 and removal of the effect of an initial disturbance, CO2 values from peat show a decline after approximately the 70th day. The δ13C signature of emitted CO2 on day 86 was −24‰, demonstrating a small low contribution from carbonates (−0.03‰) and a high contribution to total CO2 flux from the biotic peat source (−27.5‰). Based on the original mass of peat added to each pot and an assumed C content of 50%, the average emission rate over the period of the experiment yields a 1-year decomposition rate of 6.6% ± 3.1% of mass loss. The measured value in this study is very close to the 5.4% ± 1.1% mass loss from lab incubations of horticultural peat (Sharma et al., 2024). The slightly higher mass loss in this study could be because the limestone contribution has not been separated, as was done in the previous incubation study. For instance, considering that there is no limestone contribution after day 70 and taking the average emissions after day 70, the extrapolated yearly mass loss would be approximately 3.31% ± 1.62%.
Previous peat incubations have shown that temperature and moisture conditions are key controllers of peat respiration (Scanlon and Moore, 2000; Blodau et al., 2004). Though our experiment was run in a controlled environment at ~23°C, minor fluctuations in temperature among the sampling plots and moisture explained 14% of the variability measured in HR values. When extrapolating the HR values, from our study that contained 2.8 kg dry peat per m2 and emitted on average 0.28 ± 0.15 g CO2-C m–2 day−1, to 32 km2 of CEA of mushroom and ornamental production in Canada (assuming similar dry peat mass per m2 and not accounting the leftover peat mass after use), we estimate 3.27 ± 1.75 kt of CO2 emissions per year from the peat-based growing substrate.
The average NEE values were −1.17 ( ± 0.85) g CO2-C m−2 day−1 for lettuce and −0.62 ( ± 1.72) g CO2-C m−2 day−1 for petunia, while the average ER values for lettuce and petunia were 2.09 ( ± 0.79) and 2.96 ( ± 1.39) g CO2-C m−2 day−1. During the initial phase of growth, as the plants accumulated biomass, both ER and NEE exhibited their highest rates and then gradually declined as the plants matured and established stable growth conditions. NEE and ER measurements were a combination of plant respiration, which is dependent on the stage of plant growth (Van Iersel, 2003), soil respiration, and limestone-derived CO2. The biomass measurements, temperature, and moisture measurements could not always explain the large portion of the variability in the NEE and ER values.
In our study, the CO2 signatures did not differ between the three possible sources, suggesting that by this time the limestone contribution to total flux was insignificant. However, lacking continuous measurements of the CO2 signature, we could not calculate the contribution of limestone-based emission through time.
The radiocarbon age of peat was relatively older than the contemporary radiocarbon age (1737 years BP, pMC = 0.81), and so was the CO2 respired from peat-only setups (pMC = 0.87). Even in fallow peat setups, the 14C of the CO2 emitted was always more modern than that of the solid peat, which indicates younger fractions of peat within the bulk peat are preferentially decomposed relative to older peat fractions. Similar results have been shown by previous studies (Biasi et al., 2013; Bader et al., 2018). The higher modern C fraction in setups with plants (pMC = 0.98) clearly shows that the respiration values are dominated by the living plants (pMC = 1.0017) and, to a lesser degree, the older C of the peat substrate. While partitioning the total flux into their sources, we showed that plants’ respiration fraction differed between plant species, as peat respiration contributed 10% and 18% to the total respiration in lettuce and petunia, respectively. Previous studies have also pointed out that the relative contribution depends on plant functional type and abiotic factors (Rankin et al., 2022). In natural peatlands, Rankin et al. (2023) and Hicks Pries et al. (2013) found the AR contribution to ER to be approximately 75% and between 40% and 70%, respectively. The larger proportions of AR (82%–90%) observed in our study are likely due to the much smaller mass of peat in the experimental pots that contributes to the absolute HR being lower as compared to the amount of peat under a peatland.
Our data also demonstrate that the priming effect, caused by the roots increasing heterotrophic respiration, was minor or positive, as shown from the separation of ER using radiocarbon signatures. In studies on peatlands, HR enhancement (Bader et al., 2018; Basiliko et al., 2012) was suppressed, as well as neutral (Estop-Aragonés et al., 2022; Bader et al., 2018; Wild et al., 2023) effects due to priming have been shown. Experiments in a laboratory mimicking root exudates have shown that the positive priming effect depends on the compound added (Wild et al., 2023), soil type (Bader et al., 2018; Wild et al., 2023), and other factors. The differences in root exudates and structure could be a possible reason for the difference in priming between lettuce and petunias in our study. Petunia roots are known to form a symbiotic association with arbuscular mycorrhizal fungi (Reddy et al., 2009; Druege and Franken, 2019). These fungi form intracellular structures by penetrating the individual cells in the root cortex and play a role in supplying nutrients to host plants (Reddy et al., 2009). At the same time, arbuscular mycorrhizal fungi are also known to be substantial contributors to total ecosystem flux that rapidly return plant-derived C to the atmosphere (Nottingham et al., 2010). However, validating this would require future studies that look at both respiration components and root structures. Additionally, it is important to note that we collected only the CO2 samples for radiocarbon measurements toward the end of the experiment because of the large cost of the isotope analysis. Monitoring the extent of the priming effect throughout the experimental period could have provided a more nuanced picture of the priming effect in horticultural crop production.
4.2 Biomass accumulated
In the experiment period, the plants assimilated 168 and 225g C m−2 in lettuce and petunia, respectively. However, most of the horticulture plants are used for food production or as ornamental plants, and their biomass is readily consumed as food or discarded to decompose at the end of the season; therefore, a large part of the biomass will be returned to the atmosphere within a short timeframe of years to decades.
4.3 CH4 and N2O exchange and global warming potential
Methane emissions from our study were small (0.55 ± 4.66 mg CH4 m−2 day−1), and some uptake was also recorded. In cropped peat soils, low CH4 emissions are well documented (Taft et al., 2017) as soils are well mixed and well aerated, creating an environment unsuitable for methanogens and supporting methanotrophic activity (Mer and Roger, 2001). The small and even negative CH4 fluxes that we observed are similar to the results from container horticulture CH4 measurements reported (Murphy et al., 2019, 2021; Marble et al., 2012b, 2012).
Except for two measurements, all the treatments were a source of N2O, but emissions are lower (2.69 ± 3.47 mg N2O m−2 day−1) than reported for vegetable crops in organic soils in Ohio with 40–133 mg N2O m−2 day−1 (Elder and Lal, 2008), in peat soil in Finland with 14 mg N2O m−2 day−1 (Regina et al., 2004), and in arable peat soil in the summer months in the United Kingdom ranging from 59 to 132 mg N2O m−2 day−1 (Taft et al., 2017). Nevertheless, when comparing our values to horticultural plants grown in containers, the results we report are in general agreement with an average of 0.83 mg N2O m−2 day−1 in peat-based substrate in annual horticultural species (Murphy et al., 2021) and with an average of 2.23 mg N2O m−2 day−1 from pine bark and sand-based media (Marble et al., 2012b). We recognize that to track a complete picture of N2O emissions, a larger control is required. For instance, N2O emissions have been shown to depend on fertilizer intensity and type (Brown et al., 2025) as well as N2O emissions depend on seasonal or cropping patterns as N2O peaks have been reported following irrigation (Lloyd et al., 2019), cultivation, or management interventions (Elder and Lal, 2008; Regina et al., 2004).
Nonetheless, we think that these findings are important to further constrain the understanding of overall GHG impact from horticulture, the values of which are rarely compared to conventional agriculture. Using the global warming potential of emitted N2O as 270, the average CO2 equivalent for N2O emissions from our study is 0.73 g CO2-eq m−2 day−1. If these values are extrapolated over a year (i.e., 365 days), then they are roughly equivalent to what is emitted from a square meter of actively harvested peatland (Clark et al., 2023). Given that the N-fertilizer application in horticultural systems is heavy and recurrent, we show that quantifying N2O emissions is important to ascertain the overall GHG budget of peat use in horticulture. Although the results that we present come from a limited number of samples in a limited timeframe, an initial extrapolation of N2O emissions from using peat as a growing substrate in horticulture in Canada amounts to approximately 2.33 kt of CO2-eq per year.
5 Conclusion
We estimated the respiration dynamics of peat substrate for two plant species representing food production and ornamental horticulture by measuring ER, net ecosystem exchange, and biomass accumulated. We used radiocarbon measurements to separate ER into HR and AR to measure if the introduction of plants in peat increased peat HR. HR from peat was on average 0.28 ± 0.15 g CO2-C m−2 day−1, similar to what has been reported for horticulture peat from previous studies (Sharma et al., 2024). Radiocarbon measurements made at the end of the experiment show that HR contributes 10% and 18% to ER in lettuce and petunia, respectively. We did not find any evidence of an increase in peat HR in lettuce, whereas we measured a positive priming effect in petunia, where peat-based HR from petunia was twice that of peat-only setups. Therefore, we conclude that differences in peat HR when plants are introduced to that of bare peat HR could be species-dependent. Future work should include radiocarbon measurements and repeated partitioning of AR and HR throughout the plant’s lifespan, rather than only measuring at the mature stage as we did, to better constrain the influence of plants on peat HR. We anticipate that the measurements on GHG emissions that we report provide a basis for upscaling and reporting emissions from horticultural plants for the controlled environment of agricultural and ornamental plants.
Data availability statement
The raw data supporting the conclusions of this article will be made available by the authors, without undue reservation.
Author contributions
BS: Methodology, Investigation, Conceptualization, Formal analysis, Writing – original draft. TM: Conceptualization, Supervision, Writing – review & editing, Writing – original draft. NR: Project administration, Writing – review & editing, Conceptualization, Funding acquisition, Supervision, Writing – original draft.
Funding
The author(s) declare financial support was received for the research and/or publication of this article. This research was supported by funds from the Natural Sciences and Engineering Research Council of Canada (Collaborative Research and Development Grant, CRDPJ 525894-18) and the companies of the Canadian Sphagnum Peat Moss Association (CSPMA). The Department of Geography, McGill University, and Schlumberger Foundation, Faculty for the Future Fellowship Program supported BS for the doctorate degree.
Acknowledgments
We thank Mahnaz Mansoori, Isabel Strachan, Sarah Negrin, Mike Dalva and Paula Kestelman for their assistance in the phytotron and in the laboratory. BS is also thankful for the initial review and insights from Dr. Kelly Bona and Dr. Sara Knox as part of her PhD dissertation.
Conflict of interest
The authors declare that the research was conducted in the absence of any commercial or financial relationships that could be construed as a potential conflict of interest.
Generative AI statement
The author(s) declare that no Generative AI was used in the creation of this manuscript.
Any alternative text (alt text) provided alongside figures in this article has been generated by Frontiers with the support of artificial intelligence and reasonable efforts have been made to ensure accuracy, including review by the authors wherever possible. If you identify any issues, please contact us.
Publisher’s note
All claims expressed in this article are solely those of the authors and do not necessarily represent those of their affiliated organizations, or those of the publisher, the editors and the reviewers. Any product that may be evaluated in this article, or claim that may be made by its manufacturer, is not guaranteed or endorsed by the publisher.
References
Agriculture And Agri-Food Canada (2023a). Statistical Overview of the Canadian Greenhouse vegetable and mushroom industry. (Government of Canada). Available at: https://agriculture.canada.ca/sites/default/files/documents/2024-10/GH%20Vegetable_Report_2023_EN.pdf.
Agriculture And Agri-Food Canada (2023b). Statistical overview of the Canadian ornamental industry. (Government of Canada). Available at: https://publications.gc.ca/collections/collection_2023/eccc/En81-4-2021-1-eng.pdf.
Alvarez J. M., Pasian C., Lal R., Lopez-Nuñez R., and Fernández M. (2018). A biotic strategy to sequester carbon in the ornamental containerized bedding plant production: A review. Spanish J. Agric. Res. 16. doi: 10.5424/sjar/2018163-12871
Bader C., MüLler M., Szidat S., Schulin R., and Leifeld J. (2018). Response of peat decomposition to corn straw addition in managed organic soils. Geoderma 309, 75–83. doi: 10.1016/j.geoderma.2017.09.001
Basiliko N., Stewart H., Roulet N. T., and Moore T. R. (2012). Do root exudates enhance peat decomposition? Geomicrobiology J. 29, 374–378. doi: 10.1080/01490451.2011.568272
Biasi C., Jokinen S., Marushchak M. E., Hämäläinen K., Trubnikova T., Oinonen M., et al. (2013). Microbial respiration in arctic upland and peat soils as a source of atmospheric carbon dioxide. Ecosystems 17, 112–126. doi: 10.1007/s10021-013-9710-z
Biasi C., Lind S. E., Pekkarinen N. M., Huttunen J. T., Shurpali N. J., Hyvönen N. P., et al. (2008). Direct experimental evidence for the contribution of lime to CO2 release from managed peat soil. Soil Biol. Biochem. 40, 2660–2669. doi: 10.1016/j.soilbio.2008.07.011
Blagodatskaya Е. and Kuzyakov Y. (2008). Mechanisms of real and apparent priming effects and their dependence on soil microbial biomass and community structure: critical review. Biol. Fertility Soils 45, 115–131. doi: 10.1007/s00374-008-0334-y
Blodau C., Basiliko N., and Moore T. R. (2004). Carbon turnover in peatland mesocosms exposed to different water table levels. Biogeochemistry 67, 331–351. doi: 10.1023/B:BIOG.0000015788.30164.e2
Blok C., Eveleens B., and Winkel A. V. (2021). Growing media for food and quality of life in the period 2020-2050. Acta Horticul. 1305, 341–356. doi: 10.17660/ActaHortic.2021.1305.46
Brown F. J., Owen J. S. Jr., and Niemiera A. X. (2025). Transformations of nitrate, ammonium, and urea when applied to pine bark-based substrate. HortScience 60, 1075–1083. doi: 10.21273/HORTSCI18428-24
Clark L., Strachan I. B., Strack M., Roulet N. T., Knorr K.-H., and Teickner H. (2023). Duration of extraction determines CO2 and CH4 emissions from an actively extracted peatland in eastern Quebec, Canada. Biogeosciences 20, 737–751. doi: 10.5194/bg-20-737-2023
Cleary J., Roulet N. T., and Moore T. R. (2005). Greenhouse gas emissions from canadian peat extraction 1990–2000: A life-cycle analysis. AMBIO: A J. Hum. Environ. 34, 456–461. doi: 10.1579/0044-7447-34.6.456
Druege U. and Franken P. (2019). Petunia as model for elucidating adventitious root formation and mycorrhizal symbiosis: at the nexus of physiology, genetics, microbiology and horticulture. Physiol. Plant 165, 58–72. doi: 10.1111/ppl.12762
Elder J. W. and Lal R. (2008). Tillage effects on gaseous emissions from an intensively farmed organic soil in North Central Ohio. Soil Tillage Res. 98, 45–55. doi: 10.1016/j.still.2007.10.003
Environment & Climate Change Canada (2023). “National Inventory Report 1990-2021: Greenhouse Gas Sources and Sinks in Canada,” in Environment and Climate Change Canada. Ed. Canada E. A. C. C.. (Government of Canada). Available at: https://publications.gc.ca/collections/collection_2023/eccc/En81-4-2021-1-eng.pdf.
Estop-Aragonés C., Heffernan L., Knorr K. H., and Olefeldt D. (2022). Limited potential for mineralization of permafrost peatland soil carbon following thermokarst: evidence from anoxic incubation and priming experiments. J. Geophysical Research: Biogeosciences 127. doi: 10.1029/2022JG006910
Frolking S. and Roulet N. T. (2007). Holocene radiative forcing impact of northern peatland carbon accumulation and methane emissions. Global Change Biol. 13, 1079–1088. doi: 10.1111/j.1365-2486.2007.01339.x
He H., Clark L., Lai O. Y., Kendall R., Strachan I., and Roulet N. T. (2023). Simulating soil atmosphere exchanges and CO2 fluxes for an ongoing peat extraction site. Ecosystems 26, 1335–1348. doi: 10.1007/s10021-023-00836-2
Hicks Pries C. E., Schuur E. A., and Crummer K. G. (2013). Thawing permafrost increases old soil and autotrophic respiration in tundra: partitioning ecosystem respiration using delta(13) C and Δ(14) C. Glob Chang Biol. 19, 649–661. doi: 10.1111/gcb.12061
Keeling C. D. (1958). The concentration and isotopic abundances of atmospheric carbon dioxide in rural areas. Geochimica Cosmochimica Acta 13, 322–334. doi: 10.1016/0016-7037(58)90033-4
Kunhikrishnan A., Thangarajan R., Bolan N. S., Xu Y., Mandal S., Gleeson D. B., et al. (2016). “Functional Relationships of Soil acidification, Liming, and Greenhouse Gas Flux,” in Advances in Agronomy. Ed. Sparks D. L.. (Netherlands: Elsevier Academic Press).
Kuzyakov Y., Friedel J. K., and K. S. (2000). Review of mechanisms and quantification of priming effects. Soil Biol. Biochem. 32, 1485–1498. doi: 10.1016/S0038-0717(00)00084-5
Levin I., Preunkert S., Graven H., Lewis C., Miller J., Turnbull X., et al. (2023). Database of existing d14CO2 measurements. (Heidelberg, Germany: ICOS ERIC Carbon Portal).
Lloyd K., Madramootoo C. A., Edwards K. P., and Grant A. (2019). Greenhouse gas emissions from selected horticultural production systems in a cold temperate climate. Geoderma 349, 45–55. doi: 10.1016/j.geoderma.2019.04.030
Ma R., Zou J., Han Z., Yu K., Wu S., Li Z., et al. (2021). Global soil-derived ammonia emissions from agricultural nitrogen fertilizer application: A refinement based on regional and crop-specific emission factors. Glob Chang Biol. 27, 855–867. doi: 10.1111/gcb.15437
Marble S. C., Prior S. A., Runion G. B., Torbert H. A., Gilliam C. H., and Fain G. B. (2011). The importance of determining carbon sequestration and greenhouse gas mitigation potential in ornamental horticulture. HortScience 46, 240–244. doi: 10.21273/HORTSCI.46.2.240
Marble S. C., Prior S. A., Runion G. B., Torbert H. A., Gilliam C. H., Fain G. B., et al. (2012a). Determining trace gas efflux from container production of woody nursery crops. J. Environ. Horticulture 30, 118–124. doi: 10.24266/0738-2898.30.3.118
Marble S. C., Prior S. A., Runion G. B., Torbert H. A., Gilliam C. H., Fain G. B., et al. (2012b). Effects of fertilizer placement on trace gas emissions from nursery container production. HortScience 47, 1056–1062. doi: 10.21273/HORTSCI.47.8.1056
Menegat S., Ledo A., and Tirado R. (2022). Greenhouse gas emissions from global production and use of nitrogen synthetic fertilisers in agriculture. Sci. Rep. 12, 14490. doi: 10.1038/s41598-022-18773-w
Mer J. L. and Roger P. (2001). Production, oxidation, emission and consumption of methane by soils: A review. Eur. J. Soil Sci. 37, 25–50. doi: 10.1016/S1164-5563(01)01067-6
Murphy A., Runion G., Prior S., Torbert H., Sibley J., Fain G., et al. (2019). Effects of fertilizer placement on greenhouse gas emissions from a sun and shade grown ornamental crop. J. Environ. Horticulture 37, 74–80. doi: 10.24266/0738-2898-37.3.74
Murphy A. M., Runion G. B., Prior S. A., Torbert H. A., Sibley J. L., Fain G. B., et al. (2021). Effects of Growth Substrate on Greenhouse Gas emissions from three annual species. J. Environ. Horticulture 39, 53–61. doi: 10.24266/0738-2898-39.2.53
Nottingham A. T., Turner B. L., Winter K., van der Heijden M. G. A., and Tanner E. V. J. (2010). Arbuscular mycorrhizal mycelial respiration in a moist tropical forest. New Phytol. 186, 957–967. doi: 10.1111/j.1469-8137.2010.03226.x
Pataki D. E., Ehleringer J. R., Flanagan L. B., Yakir D., Bowling D. R., Still C. J., et al. (2003). The application and interpretation of Keeling plots in terrestrial carbon cycle research. Global Biogeochemical Cycles 17. doi: 10.1029/2001GB001850
R Core Team. (2021). R: A language and environment for statistical computing. Vienna, Austria: R Foundation for Statistical Computing. Available at: https://www.R-project.org/.
Rankin T., Roulet N., Humphreys E., Peichl M., and Järveoja J. (2023). Partitioning autotrophic and heterotrophic respiration in an ombrotrophic bog. Front. Earth Sci. 11. doi: 10.3389/feart.2023.1263418
Rankin T. E., Roulet N. T., and Moore T. R. (2022). Controls on autotrophic and heterotrophic respiration in an ombrotrophic bog. Biogeosciences 19, 3285–3303. doi: 10.5194/bg-19-3285-2022
Reddy D. M. R. S., Svistoonoff S., Breuillin F., Wegmuller S., Bucher M., and Reinhardt D. (2009). “Development and Function of the Arbuscular Mycorrhizal Symbiosis in Petunia,” in Petunia. Eds Gerats T. and Strommer J.. (New York: Springer-Verlag).
Regina K., Syväsalo E., Hannukkala A., and Esala M. (2004). Fluxes of N2O from farmed peat soils in Finland. Eur. J. Soil Sci. 55, 591–599. doi: 10.1111/j.1365-2389.2004.00622.x
Säurich A., Tiemeyer B., Don A., Fiedler S., Bechtold M., Amelung W., et al. (2019). Drained organic soils under agriculture — The more degraded the soil the higher the specific basal respiration. Geoderma 355. doi: 10.1016/j.geoderma.2019.113911
Scanlon D. and Moore T. R. (2000). Carbon Dioxide production from peatlands soil profiles: the influence of temperature, oxic/anoxic conditions and substrate. Soil Sci. 165, 153–160. doi: 10.1097/00010694-200002000-00006
Schmilewski G. (2008). The role of peat in assuring the quality of growing media. Mires Peat 3. doi: 10.19189/001c.128252
Sharma B., He H., and Roulet N. T. (2025). CO2 emitted from peat use in horticulture supports a lower emission factor. Carbon Manage. 16. doi: 10.1080/17583004.2025.2468476
Sharma B., Moore T. R., Knorr K.-H., Teickner H., Douglas P. M. J., and Roulet N. T. (2024). Horticultural additives influence peat biogeochemistry and increase short-term CO2 production from peat. Plant Soil. 550 (1), 449–464. doi: 10.1007/s11104-024-06685-9
Stix J., Lucic G., and Malowany K. (2017). Near real-time field measurements of δ13C in CO2 from volcanoes. Bull. Volcanology 79. doi: 10.1007/s00445-017-1144-6
Taft H. E., Cross P. A., Edwards-Jones G., Moorhouse E. R., and Jones D. L. (2017). Greenhouse gas emissions from intensively managed peat soils in an arable production system. Agriculture Ecosyst. Environ. 237, 162–172. doi: 10.1016/j.agee.2016.11.015
Torn M. S., Swanston C. W., Castanha C., and Trumbore S. E. (2009). “Storage and Turnover of Organic Matter Soil,” in Biophysico-Chemical Processes Involving Natural Nonliving Organic Matter in Environmental Systems. (Hoboken, NJ: Wiley-Interscience).
Van Iersel M. W. (2003). Carbon use efficiency depends on growth respiration, maintenance respiration, and relative growth rate. A case study with lettuce. Plant Cell Environ. 26, 1441–1449. doi: 10.1046/j.0016-8025.2003.01067.x
Wacker L., Christl M., and Synal H. A. (2010). Bats: A new tool for AMS data reduction. Nuclear Instruments and Methods in Physics Research Section B: Beam Interactions with Materials and Atoms 268 (7-8), 976–979.
Wang Y., Paul S. M., Jocher M., Espic C., Alewell C., Szidat S., et al. (2021). Soil carbon loss from drained agricultural peatland after coverage with mineral soil. Sci. Total Environ. 800, 149498. doi: 10.1016/j.scitotenv.2021.149498
Keywords: growing media, peat decomposition, horticulture, GHG emissions, respiration
Citation: Sharma B, Moore TR and Roulet NT (2025) Carbon balance and greenhouse gas emissions from horticultural plants grown in peat-based growing media. Front. Hortic. 4:1655432. doi: 10.3389/fhort.2025.1655432
Received: 27 June 2025; Accepted: 28 October 2025;
Published: 20 November 2025.
Edited by:
Chris Blok, Wageningen University and Research, NetherlandsReviewed by:
Ain Kull, University of Tartu, EstoniaKristopher Criscione, Virginia Polytechnic Institute and State University, United States
Copyright © 2025 Sharma, Moore and Roulet. This is an open-access article distributed under the terms of the Creative Commons Attribution License (CC BY). The use, distribution or reproduction in other forums is permitted, provided the original author(s) and the copyright owner(s) are credited and that the original publication in this journal is cited, in accordance with accepted academic practice. No use, distribution or reproduction is permitted which does not comply with these terms.
*Correspondence: Bidhya Sharma, YmlkaHlhLnNoYXJtYUBtYWlsLm1jZ2lsbC5jYQ==; Nigel T. Roulet, bmlnZWwucm91bGV0QG1jZ2lsbC5jYQ==