 Manu Priya
 Hilary A. Sandler
 Peter Jeranyama
 Harsh Nayyar
 Giverson Mupambi
- 1Cranberry Station, University of Massachusetts-Amherst, East Wareham, MA, United States
- 2Department of Botany, Panjab University, Chandigarh, India
Introduction: Agrivoltaic (AV) systems, which integrate solar energy generation with crop production on the same piece of land, offer a sustainable solution for optimizing land-use efficiency. However, the impact of shading induced by solar panels on crop growth, physiology, and metabolic activities of cranberry is not known. Understanding these interactions is essential for assessing the feasibility of AV systems in cranberry production.
Methods: In this study we evaluated eco-physiological and biochemical crop responses on a commercial ‘Howes’ cranberry bog grown under an agrivoltaics system using different row spacings in the year immediately following installation. Following installation of fixed tilt solar panels at a height of 3.0 m above the plant canopy, four shading treatments were evaluated: an uncovered control area and row spacings of 9.0 m, 7.0 m, and 5.0 m, corresponding to 30%, 35%, and 37% shading respectively. The shading effect was also evaluated at three different fruit developmental stages (green, blush, and full-red stage). Using microclimate sensors installed in the treatment areas, key eco-physiological and biochemical parameters, including leaf gas exchange, chlorophyll, anthocyanin, and antioxidant content, electrolyte leakage, proline and trehalose accumulation, were assessed.
Results: While moderate shading (30% and 35%) alleviated environmental stress, as reflected by improved leaf water status and reduced electrolyte leakage, these same treatments suppressed key physiological and metabolic functions, including photosynthetic activity, carbon reserve accumulation, and the biosynthesis of stress-related osmolytes and antioxidant compounds. Under higher shading (37%), these reductions were even more pronounced, indicating a potential threshold beyond which the benefits of shading are outweighed by declines in assimilate production and secondary metabolism.
Discussion: These findings highlight a trade-off between the stress-mitigating benefits of shading and the alterations in key physiological and metabolic processes under agrivoltaic systems. Minimizing these trade-offs by optimizing row spacing in agrivoltaics systems is critical to maintain cranberry physiological status. Since commercial cranberry is grown as a continuous plant canopy (no interrow spaces for equipment travel), damage caused by the installation process likely impacted crop response evaluated in the first year; multi-year studies are needed to fully understand the dynamics of a dual-use system. Notably, this work provides the first direct measurements of proline, trehalose content, and electrolyte leakage in cranberry grown under AV conditions, offering new insight into their physiological adjustments to shading.
1 Introduction
The global transition toward sustainable land use has necessitated the critical need for integrated systems that can simultaneously address food security and renewable energy production (Weselek et al., 2019, 2021; Agostini et al., 2021). Agrivoltaics (AV), the practice of co-locating photovoltaic (PV) solar panels along with crop cultivation, has emerged as an innovative and transformative approach for enhancing land-use efficiency while improving agricultural sustainability (Elamri et al., 2018; Barron-Gafford et al., 2019). The AV systems create complex interactions between solar infrastructure and crop eco-physiology by altering microclimatic conditions, particularly light availability (Poorter et al., 2019; Giudice et al., 2021; Schweiger and Pataczek, 2023; Yajima et al., 2023). While AV systems have been explored across a variety of crops, ranging from high-light demanding annuals to some perennials, research remains limited on their feasibility to shade-tolerant crops such as cranberry (Vaccinium macrocarpon Ait.) (Mupambi et al., 2021).
Cranberry is a low-growing perennial fruit crop of considerable economic importance, primarily cultivated in the United States and Canada (Eastwood, 1856; White, 1870; Gleason and Cronquist, 1990). The crop is agronomically and ecologically valuable due to the high antioxidant contents and growing demand in the international nutraceutical market (Eck, 1990). Taxonomically, the crop belongs to the Ericaceae family and exhibits prostrate growth habit with slow vegetative growth (Gleason and Cronquist, 1990). These ecological features suggest a potential compatibility with AV systems, where spatial and temporal shading from PV panels may not necessarily hinder, and may even enhance yield and productivity in cranberry. However, the extent to which altered light quality and quantity under AV installations may affect cranberry productivity and physiology has yet to be systematically characterized (Mupambi et al., 2021).
Agrivoltaics has been shown to influence plant eco-physiological processes by altering the quality and intensity of light, reducing evapotranspiration, and regulating temperature fluctuations (Loik et al., 2017; Kirimura et al., 2022). These changes directly affect photosynthetic rate, stomatal conductance, and water use efficiency (WUE), with each being a critical determinant of plant performance both in optimal and stressful situations (Ravi et al., 2014; Barron-Gafford et al., 2019; Giudice et al., 2021). Light-mediated alterations in AV can extend to primary and secondary metabolism, including osmolyte accumulations, the biosynthesis of flavonoids, anthocyanins, and other phenolic compounds, and total non-structural carbohydrates (TNC) which play crucial roles in determining fruit quality, stress tolerance, and postharvest attributes (Ferrara et al., 2023; Juillion et al., 2023). Previous studies in related berry crops such as blackcurrant and strawberries have shown that moderate shade can enhance or stabilize the accumulation of these bioactive compounds, yet such responses are highly species-specific and climate dependent (Djordjevic et al., 2015; Wolske et al., 2021; Petrakis et al., 2024).
The physiological and biochemical responses of cranberry to agrivoltaics-induced microclimate changes, particularly under varying degrees of shade generated by different row spacing of solar panels, remains an open question with significant implications for fruit quality and marketable yield value. While agrivoltaics implications have been investigated in other perennial crop systems, there is relatively limited information on their impact on cranberry, which would potentially respond differently due to their own distinct phenology and ecological patterns (Mupambi et al., 2021). Given the rising interest in dual land-use systems for food and energy production, understanding how varying levels of solar-induced shading affect cranberry photosynthesis, water status, osmotic adjustment, and metabolic processes is timely and of agricultural significance.
To address this knowledge gap, we conducted a preliminary field experiment to evaluate the impact of solar panel-induced shading (0% (control), 30%, 35%, and 37%) on cranberry var ‘Howes’ across three fruit stages. We specifically examined 1) How shading intensity influences photosynthetic functions and water balance and 2) Whether agrivoltaic shading modulates osmolyte accumulation (proline, trehalose content in leaves) and carbohydrate reserves, and 3) How light changes affect the biosynthesis of secondary metabolites such as phenolics, flavonoids, and anthocyanins in fruits.
2 Materials and methods
2.1 Trial site description and treatments
The study was conducted on a commercially established ‘Howes’ cranberry bog located in Plymouth, Massachusetts, USA (41° 57’ N and 70° 40’ W). Typically, AV arrays are installed at a single uniform spacing across the production area to maximize economic efficiency and assist in the logistics of construction. Working collaboratively with the grower and the installer, arrays with different spacings were installed on three separate but proximal farm sections to permit evaluation of this dual-use situation. Four treatments were evaluated: an uncovered control and three different row spacings (9.0 m, 7.0 m, and 5.0 m) with fixed panels on steel poles, installed 3.0 m above the plant canopy (Figure 1). The spacing was based on guidelines from the Massachusetts Department of Agricultural Resources for agrivoltaics projects. Having north to south orientation, the solar array installation began at the start of winter in November 2023 (northern hemisphere), with construction completed by March 2024. The bog was managed under normal commercial cultural practices for irrigation, pest, and fertilizer management during the study (Ghantous et al., 2024).
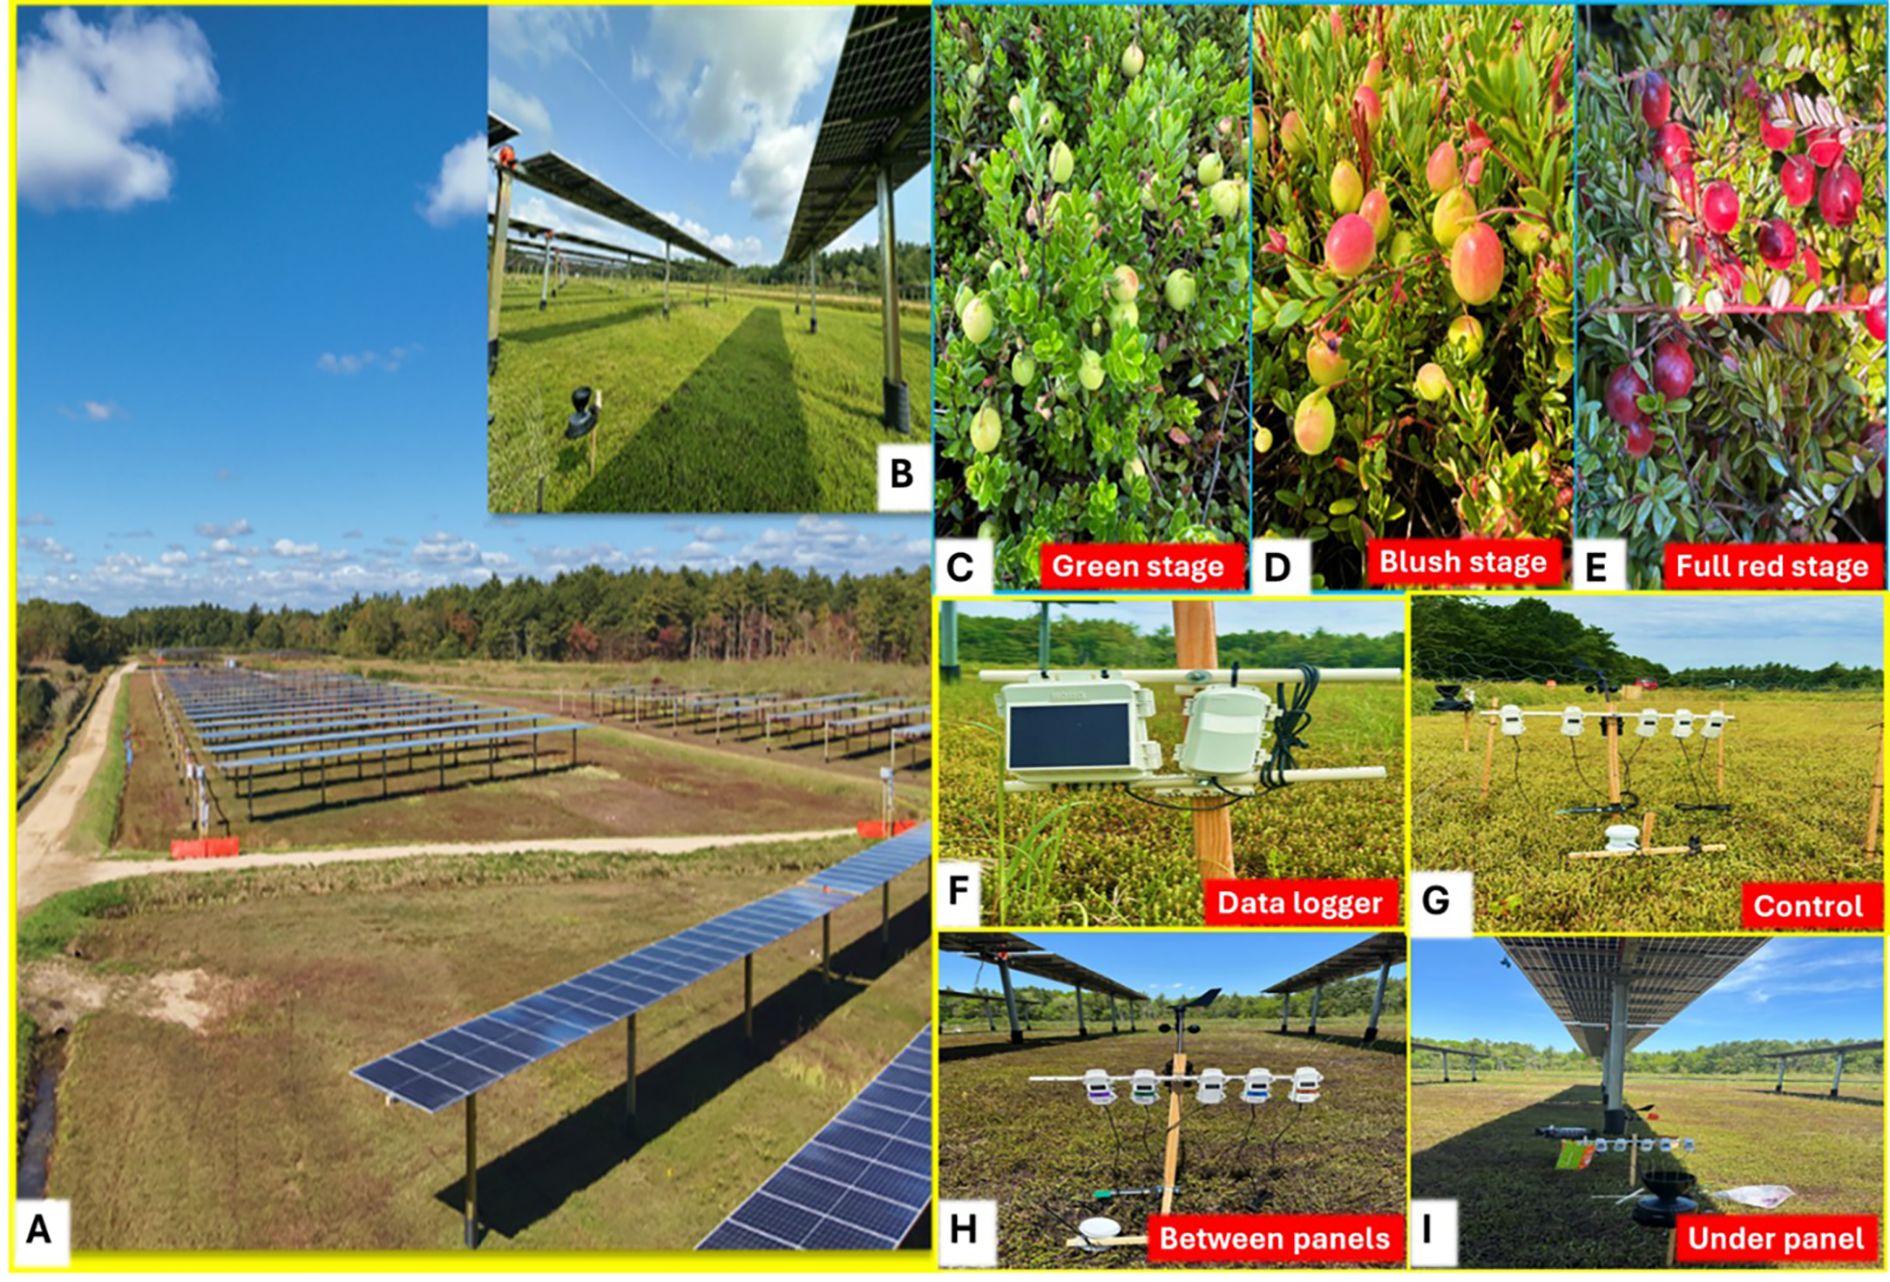
Figure 1. (A) Illustrates the installation of solar panels over a cranberry bog in an experiment to assess the impact on perennial fruit crops in temperate climate, (B) shows the enlarged view of shading from solar panels. This integrated system, commonly known as agrivoltaics, exemplifies the intersection of renewable energy generation and crop production. Evaluated fruit stages of cranberry: green (C) blush (D) and full-red stage (E). Environmental sensors were installed with a data logger (F) to monitor the microclimate in control area without panels (G) between the panels (H) and under the panels (I) in all the treatments. Picture: Manu Priya, UMass Cranberry Station, MA, USA.
Based on previous experience and data collections by Mupambi et al. (2021), sampling both under and between solar panels provided the best representation for quantifying the impact of solar panel-induced shading on cranberry vines and fruit growing under agrivoltaics. Thus, for each shading treatment, four measurements or samples were collected under the panels and four between the panels for all the parameters, while eight samples were collected for the control area. For data analysis, these subsamples were combined (n=8) to represent the overall response for each shading treatment. However, for leaf area index (LAI), five samples were collected beneath the panels, five between the panels, and ten from the control plots to better represent canopy structure, as this parameter is typically more spatially variable than physiological or biochemical traits. Sampling times also varied depending on the parameter measured. Total non-structural carbohydrates (TNC) were determined at harvest, when fruit maturity was complete. The leaf area index was measured once at the end of the growing season to best capture final canopy development, while biomass and upright density were measured at the beginning of the season prior to fruit set. All other physiological and biochemical parameters were measured at three fruit development stages (green, blush, and full red) (Figure 1). For these variables, growth stage was included as the second main effect in the statistical evaluation, in addition to shading treatment.
2.2 Light measurement
Changes in light conditions under AV were measured by installing photosynthetically active radiation (PAR) sensors (Onset Computer Corporation, Bourne, MA, USA) at canopy height (10 cm above ground) underneath the solar panels, between solar panels, and in the control area (no solar panels). Depending on the angle of the sun, the area underneath and between solar panels is shaded at different times during the day, resulting in two different microclimatic zones. The sensors were connected to an advanced cloud data logger, and the measurements were retrieved via the HoboLink web-based platform (Onset Computer Corporation, Bourne, MA, USA). An automated data logger collected data from the sensors at 15-min intervals. The sensors were installed during the green stage (25 June 2024) and removed before the bog was harvested on 3 October 2024. As mentioned in section (2.1.) four treatments were evaluated with different row spacings (9.0 m, 7.0 m and 5.0 m); these spacings resulted in mean shading levels of 30%, 35%, and 37%, respectively, as determined by cumulative PAR measurements relative to the control. The shading percentage was computed following established methods based on time-integrated PAR data (Marrou et al., 2013a, b; Elamri et al., 2018). The shading percentage for each treatment was calculated as:
Daily Light Integral (DLI, mol m−2 d−1) were also calculated from continuous PAR (photosynthetically active radiation) measurements recorded at 15-minute intervals. The calculation followed the equation:
Where, [PARi = sum of all PAR readings for the day, in micromoles per square meter per second (μmolm-2s-1), and Δt is the length of measurement interval in seconds.
2.3 Ecophysiological measurements
2.3.1 Leaf area index and biomass
The canopy leaf area index (LAI) was measured by a LAI-2000 plant canopy analyzer (LI-COR Inc. USA) in each treatment at the end of the season. The measurements were taken 10 cm below the canopy and were repeated ten times for each treatment (five under the panels and five between the panels), including unshaded control. The above-ground biomass was quantified by measuring the total number and weight of cranberry uprights during the green fruit stage of growing the season. Sampling was conducted using 180 cm2 circular quadrat and all uprights, comprising both vegetative and flowering vertical stems, were cut at ground level and combined into a single sample. The total number of uprights was recorded, upright density was calculated, and samples were weighed to determine biomass after drying at 60°C for at least 48 h in an oven.
2.3.2 Photosynthesis and leaf gas exchange
Photosynthesis and leaf gas exchange measurements were collected at the three fruit stages (green, blush, and full-red stage) between 10:00 and 12:00 h. Spot readings were taken underneath solar panels, in between solar panels, and in the unshaded control area (no solar panels). Measurements were made using a portable photosynthesis system (LICOR, LI-6800-Portable Photosynthesis System, Lincoln, NE, USA). The LI-6800 functions as an open gas exchange system, quantifying photosynthesis and transpiration by assessing differences in CO2 and water vapor concentrations between air entering and exiting the leaf chamber.
2.3.3 Relative leaf water content
RLWC was determined using the method of Barrs and Weatherley (1962) at three different fruit stages (green, blush, and full red). The leaf tissue (100 mg) from the top 5 cm of cranberry uprights was collected from the control and the three shading treatments. After measuring fresh weight, the leaves were immersed in distilled water in a petri dish for 2 h, removed, surface dried using blotting papers, and re-weighed (turgid weight, TW). The leaves were then oven-dried at 110°C for 24 h and weighed again for dry weight (DW). The relative leaf water content was calculated as follows:
2.3.4 Electrolyte leakage
Electrolyte leakage was measured as an indicator of physiological responses of plants to the altered microclimatic conditions under agrivoltaics using modified methods of Lutts et al. (1996) and Kaushal et al. (2013). The top 5 cm cranberry uprights (this represented current season growth) were collected from plants grown under control and the three shading treatments during the green, blush, and full-red fruit stages. For each treatment, including control, 100 mg leaf segments (from uprights) washed with deionized water were placed in closed vials containing deionized water (10 mL) and incubated overnight at 25°C. Electrical conductivity of the bathing solution (C1) was determined after 24 h using a conductivity meter (Fischer Brand Traceable Conductivity Meter). Samples were then put in a boiling water bath for 10–15 min, and the final conductivity reading (C2) was obtained upon equilibration at 25°C. The electrolyte leakage (EL) was calculated as follows:
2.4 Leaf biochemical analysis
2.4.1 Chlorophyll content
The assay was performed using the protocol from Barnes et al. (1992) and Shinano et al. (1996) with some modifications. We collected 50 mg of fresh leaf tissue from top 5 cm cranberry uprights in the control and the three shading treatments during green, blush and full-red stages. From each treatment including control, weighed leaf tissue was placed into test tubes, and 4 mL of dimethyl sulfoxide (DMSO) was added to the test tubes. The test tubes were kept in the dark until the chlorophyll had been extracted from leaf tissue. Absorbance was taken at 663 nm (chlorophyll a) and 645 nm (chlorophyll b) using a spectrophotometer (Thermo Scientific Genesys 150 UV-Visible) with DMSO as a blank.
The chlorophyll content was measured as follows:
Chlorophyll concentration (mg/g) (chl/fw):
2.4.2 Anthocyanin content
Anthocyanin content in cranberry leaves was estimated by using protocol from Mehrtens et al. (2005) and Taghavi et al. (2022) with minor modifications at three fruit stages (green, blush and full red). For each treatment including control, 100 mg fresh leaf tissue from the top 5 cm cranberry uprights were homogenized in 3 mL of methanol containing 1% HCL (Methanol: HCL) = 9:1 ratio. The homogenate was incubated at 4°C for 24 h to facilitate complete pigment extraction. After incubation, the mixture was centrifuged at 10,000 rpm for 30 min. Filtered extract (1 mL) was diluted to final volume of 5 mL, using two buffers 0.4 M sodium acetate (pH 4.5) and 0.025 M HCL (pH 1.0), mixed in equal proportions. The absorbance of supernatants was measured at 530 nm and 657 nm using a UV visible spectrophotometer. The anthocyanin content (Q) was calculated using the following formula:
2.4.3 Proline estimation
The proline content was quantified following the method described by Bates et al. (1973) at three fruit stages (green, blush and full red). For each treatment including control, 100 mg fresh leaves from the top 5 cm of cranberry uprights were homogenized in 5 ml of 3% aqueous sulfosalicylic acid. The homogenate was centrifuged at 10,000 rpm, and the resulting supernatant was used for proline estimation. The reaction mixture consisted of 2 ml supernatant, 2 ml acid ninhydrin and 2 ml of glacial acetic acid. The reaction mixture was then incubated at 100 °C for 1 h, followed by rapid cooling in an ice bath to terminate the reaction. Proline was extracted with 4 ml of toluene, and the absorbance was measured at 520 nm using a spectrophotometer.
2.4.4 Trehalose estimation
Trehalose content was measured using anthrone method of Trevelyan and Harrison (1956) and Brin (1966) with slight modifications. For all treatments, 100 mg fresh cranberry leaves from the top 5 cm of uprights were collected at three fruit stages (green, blush and full red) and extracted using phosphate buffer (pH ~7.0), and the extract was centrifuged to obtain a clear supernatant. For the estimation, 0.1 mL of the supernatant was mixed with 2 mL of 0.5 M trichloroacetic acid (TCA). To this reaction mixture, 4 mL of freshly prepared anthrone reagent (0.2 g anthrone in 100 mL of cold 95% H2SO4) was added. The mixture was incubated until a yellowish-green color developed, indicating the presence of trehalose. Absorbance was recorded at 620 nm using a UV-visible spectrophotometer. Trehalose concentration was calculated using a standard curve generated with known concentration of trehalose and expressed as µg/g fresh weight.
2.4.5 Total non-structural carbohydrates
Cranberry uprights were collected once during harvest at full-red stage and were dried in an oven at constant temperature of 60°C for up to 48 h. For sugars and starch estimation, 50 mg of the oven-dried plant material was homogenized in 5 ml of 80% hot ethanol and centrifuged at 5,000 rpm for 10 min. For each treatment, eight samples were prepared. The supernatant was decanted off. The residue was extracted twice with 3 mL of 80% ethanol and re-centrifuged to ensure complete recovery of soluble sugars. The supernatant was pooled and evaporated in porcelain evaporating dish on a boiling water bath. The dried supernatant was diluted with 5 ml of 20% ethanol and used for the estimation of total sugars and reducing sugars.
Total sugars were quantified by the phenol-sulfuric acid method as described by Yemm and Willis (1954). Further, reducing sugars were estimated according to the dinitro-salicyclic acid (DNSA) method of Sumner (1925). Remaining residue pellets from centrifugation were used to estimate starch content by acid hydrolysis method given by McReedy et al. (1950).
2.5 Fruit phytochemical screening
2.5.1 Plant material and extractions
Cranberry fruits were collected at three different stages: green, blush, and full red. The fruits were freeze-dried using Labconco™ FreeZone™ 6L Console Freeze Dryers, -84 °C, 115V US Models and used to prepare extracts for the analysis of antioxidant activity, total phenolics, and flavonoid content in methanol extracts, following the method of Swain and Hillis (1959) with some modifications. For each treatment, 20 mg of freeze-dried fruit was mixed with 2 mL of ice-cold 95% methanol (MeOH) and vortexed thoroughly. The mixtures were incubated at 4°C for 12 h, then centrifuged at 10,000 rpm for 30 min using a Thermoscientific Sorvall X Pro Series centrifuge. The resulting supernatants were collected and stored at -20°C for further analysis.
2.5.2 Total phenolic content
The assay was performed using protocols by Ainsworth and Gillespie (2007) and Bouyahya et al. (2016) with minor modifications. For analysis, 0.1 ml of the prepared extract, standard or 95% (V/V) methanol blank, was added in test tubes. Further, 0.2 mL of 10% (V/V) Folin-Ciocalteau reagent was added into each tube and mixed well. The tubes were allowed to stand for 5 min. This was followed by the addition of 0.8 ml of 7.5% sodium carbonate aqueous solution to each tube and vortexed thoroughly. The volume in each tube was standardized to 2 mL using distilled water, mixed well, and the tubes were allowed to stand for 2 h. Absorbance was measured using a spectrophotometer at 765 nm against methanol as a blank.
Total phenolic content was quantified using gallic acid (GAE) as a reference. A standard curve was prepared using different concentrations of gallic acid in 95% methanol. The results were expressed as milligrams of gallic acid equivalents per gram of dry sample (mgGAE/gDW).
2.5.3 Total flavonoid content
The assay was performed for each treatment following the protocol of Chatattikun and Choabchalard (2013) and Sandip et al. (2014) with some modifications. In the first step, 0.5 mL of the prepared extract solution was mixed with 1.5 mL of 95% methanol (to enhance the solubility of flavonoids). Subsequently, 0.1 mL of 10% aluminum chloride (for complex formation with flavonoids) and 0.1 mL of 1M potassium acetate (CH3COOK) (to maintain pH stability) were added to the mixture. Finally, 2.8 mL of deionized water was added (to adjust the final volume) to bring the total volume to 5 mL. The mixture was incubated at room temperature for 40 min to allow the formation of the aluminum-flavonoid complex with yellow coloration. After incubation, the absorbance was measured at 415 nm using a spectrophotometer; 95% methanol was used as a blank.
Quercetin (QE) was used as the reference standard for quantification of flavonoids. A standard curve was prepared using different concentrations of quercetin in 95% methanol. The results were expressed as milligrams of quercetin equivalents per gram of dry sample (mgQE/gDW).
2.5.4 Antioxidant capacity
2.5.4.1 (2,2-diphenyl-1-picrylhydrazyl) radical scavenging assay
The free radical scavenging activity of methanolic extracts was quantified following the method described by McCune and Johns (2002) with some modifications. For the assay, 0.1 ml of prepared extract was added to test tubes containing 2.9 ml of 0.1 mM DPPH solution in methanol. The test tubes were kept in the dark for 10 min for a reaction to occur. After incubation, the absorbance was measured at 517 nm using a UV-visible spectrophotometer to determine the free radical scavenging activity of the methanolic extract. A control was prepared using 0.1 mL of 95% methanol mixed with 2.9 mL of DPPH solution.
Results were calculated as % inhibition using the formula below:
2.5.4.2 Ferric reducing antioxidant power assay
The reducing power of methanol extract of freeze-dried fruit samples was determined using the FRAP assay based on the procedure described by Benzie and Strain (1996) and Thaipong et al. (2006) with slight modification. FRAP working reagent [300 mM acetate buffer (3.1 g C2H3NaO2·3H2O and 16 mL C2H4O2), pH 3.6, 10 mM TPTZ (2, 4, 6-tripyridyl-s-triazine) solution in 40 mM HCl, and 20 mM FeCl3·6H2O] was freshly prepared following the kit (Sigma-Aldrich, St. Louis, MO, USA) instructions. For the assay, 2.85 mL of FRAP reagent was pipetted into each test tube, followed by the addition of 0.15 mL of methanolic extract. The contents were mixed thoroughly and incubated for 30 min at 37°C in the dark to allow for a complete reaction.
The absorbance of the resulting, blue-colored complex was measured at 593 nm using a spectrophotometer. The standard curve was prepared using different concentrations of Trolox. The antioxidant capacity was expressed as milligrams of Trolox (TE) equivalents per gram of dry sample (mg TE/gDW), based on a standard calibration curve prepared with Trolox.
2.5.5 Statistical analysis
Statistical significance for all the experimental results was determined using SAS Enterprise guide 8.3 and SAS 9.4 (SAS institute Inc., Cary, NC, USA) statistical packages. Data was subjected to test for normal distribution. Depending on the parameter, data were analyzed using either one-way ANOVA (when treatment was the only factor) or two-way ANOVA (when both treatment and growth stage were included as main effects). For any significant main effect or interaction, the similarity among the treatments was estimated using Fischer’s least significant difference test. Any significance for values of means was tested within a confidence level of p< 0.05.
For each shading treatment, four samples were collected under the panels and four between the panels. These eight sub-samples were averaged to generate a single composite value per treatment for statistical analysis. For leaf area index, five under-panel and five between-panel samples were collected to improve representation of canopy structure, given the higher spatial variability of this parameter. This approach ensured that “n” was based on independent treatment replicates rather than sub-sample counts, thereby preventing inflation of the effective sample size. Reported means therefore represent treatment-level replicates, with under- and between-panel samples combined to characterize the overall plant response.
3 Results
3.1 Light measurements
Cranberry vines in the unshaded control consistently received the highest daily maximum PAR, with values frequently exceeding 1500 µmol m−2 s−1 on clear days (e.g., 1826 µmol m−2 s−1 on July 8th; 1666 µmol m−2 s−1 on August 3rd) (Figure 2). In contrast, shaded treatments showed a reduction of PAR values corresponding to row spacing. At 9-m spacing (30% shade), recorded daily maximum PAR ranged from 97 to 1477 µmol m−2 s−1, while at 7-m spacing (35% shade) values ranged from 101 to 1408 µmol m−2 s−1 (Figure 2). The greatest reduction was observed in the 5-m spacing (37% shade) with maximum values recorded between 98-1406 µmol m−2 s−1, whereas on overcast days PAR values declined further, reaching as low as 252 µmol m−2 s−1 (e.g., September 19). Closer row spacing resulted in reduced PAR availability, with the most consistent and substantial shading effect occurring with the 5-m spacing treatment. These spacings resulted in mean shading levels of 30%, 35%, and 37%, respectively, as determined by cumulative PAR measurements relative to the control. Hereafter, we will refer to the treatments relative to their shading percentage rather than the space interval as the shading percentage is more informational with regards to the physiology parameters measured.

Figure 2. (a) Daily maximum photosynthetically active radiation (PAR) recorded from July to October 2024 under varied row spacings corresponding to different shading treatments on a commercial cranberry farm in Massachusetts: control (0% shade), 9 m (30% shade), 7 m (35% shade), and 5 m (37% shade). Data represent peak daily PAR values (µmol m−2 s−1), illustrating the gradient of light availability across treatments and the seasonal variability in solar radiation, (b) Daily Light Integral (DLI; mol m−2 d−1) calculated from 15-minute PAR measurements under control (unshaded), 30%, 35%, and 37% shading treatments from July to October.
Furthermore, the Daily Light Integral (DLI) was calculated from 15-minute interval PAR data to quantify cumulative light availability under each shading treatment. Across the experimental season (July-October), DLI under the control (unshaded) treatment was highest. Shading treatments reduced DLI, with the highest reduction observed under 37% shading treatment (Figure 2). Daily values fluctuated substantially with the weather, ranging from<3 mol m−2 d−1 on overcast days in September to >47 mol m−2 d−1 on clear midsummer days. Despite this variability, shaded plots consistently exhibited lower DLI compared with the control (Figure 2).
3.2 Physiological parameters
3.2.1 Leaf area index, upright density, and biomass
Leaf Area Index (LAI) and biomass (measured in terms of number and weight of total uprights) were influenced by shading from the solar panels. LAI in full sunlight (control) was higher than in the 35% and 37% shading treatments; LAI in the 30% shading was higher than the most shaded treatment (p<0.0001; Figure 3).

Figure 3. Leaf area index (a), total upright density (b), and total upright weight (c) of cranberry vines under different shading treatments in an agrivoltaic system in Massachusetts. Bars represent means (n=8) with standard errors. Bars with similar letters are not significantly different according to Fisher’s LSD test (p< 0.05).
The number of uprights per unit area differed significantly among shading treatments (p< 0.0001; Figure 3). Upright density was highest in the control and 30% shade treatments, which did not differ from each other, while values declined significantly at 35% shade and were lowest at 37% shade. In a similar manner, total upright biomass also varied significantly with shading (p< 0.0001; Figure 3). Biomass was highest in control and the 30% shade treatment; lower biomass was measured for vines grown under 35% and 37% shade.
3.2.2 Photosynthesis and leaf gas exchange
There was no significant stage x shade interaction for photosynthesis, but main effects of shade (Table 1). Photosynthetic activity declined with increased shading, with the highest reduction noticed at 37% shade (Figure 4). In contrast, both transpiration and stomatal conductance showed significant stage x shade interaction (Table 1), hence data is presented as effects of shade and stage for transpiration and stomatal conductance (Table 2). The effect of shading on transpiration (E) and stomatal conductance (gs) also varied by fruit developmental stage (p< 0.001; Table 1). At the green stage, E and gs were highest under control and declined with increasing shade (Table 2). At the blush stage, transpiration reached its maximum absolute value but was reduced at all shading levels, while at full-red stage, both E and gs declined relative to the other stages, with the lowest values recorded under 37% shade (Table 2).

Table 1. Analysis of variance (ANOVA) with TYPE III sum of sum of squares (MS= Mean Square) for ‘Howes’ cranberry under an agrivoltaic system for leaf gas exchange parameters.

Figure 4. Mean photosynthetic rate of Massachusetts cranberry vines under different shading treatments, averaged across fruit developmental stages (green, blush, and full red). Means with similar letters are not significantly different according to Fisher’s LSD test (p< 0.05).

Table 2. Effect of shading treatments under agrivoltaics on leaf gas exchange parameters of Massachusetts cranberry vines measured at the green, blush, and full-red fruit stages.
Collectively, these findings indicate that while photosynthesis is primarily suppressed by shade intensity independent of stage, transpiration and stomatal conductance exhibit clear stage-dependent sensitivity to shading, with the strongest reductions observed during later stages of fruit development.
3.2.3 Relative leaf water content and electrolyte leakage
Relative leaf water content was significantly influenced by shading (p< 0.0001; Table 3) but was not affected by developmental stage nor the stage x shade interaction. RLWC increased as shade intensity increased, reaching maximum levels under 37% shade (Figure 5). This pattern indicates enhanced leaf water status under reduced irradiance, likely reflecting lower transpirational demand in shaded plants.
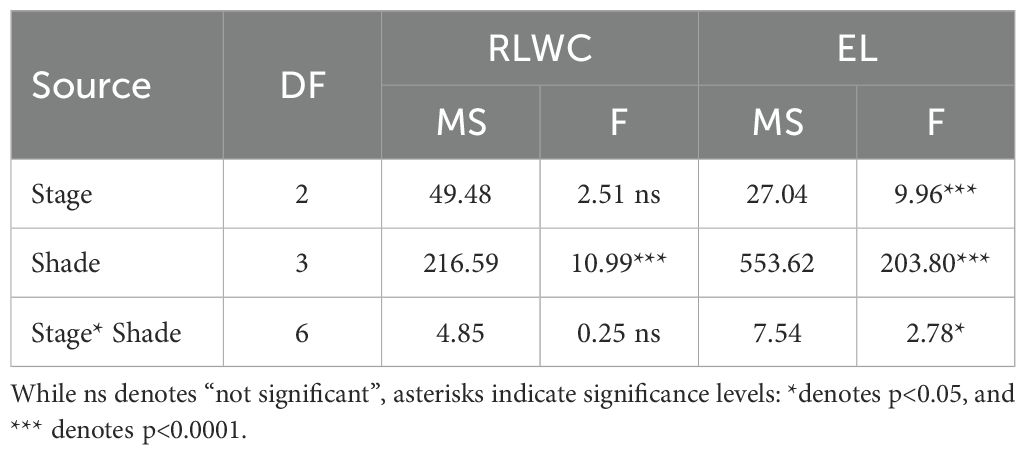
Table 3. Analysis of variance (ANOVA) with TYPE III sum of sum of squares (MS= Mean Square) for Massachusetts ‘Howes’ cranberry under an agrivoltaic system for relative leaf water content (RLWC) and electrolyte leakage (EL).

Figure 5. Mean RLWC (± SE) of Massachusetts cranberry under varying shade levels, averaged across cranberry fruit ripening stages. Means (n=8) with similar letters are not significantly different according to Fisher’s LSD (p< 0.05).
In contrast, the effect of shading on electrolyte leakage varied by developmental stage as well as shading treatment and showed significant shade x stage interaction (Table 3). Across all stages compared to the unshaded control, higher shading levels (35-37%) were consistently associated with reduced EL, indicating improved membrane stability under lower irradiance. At the green stage, EL was greatest in control and 30% shading but declined at 35% and 37% shade (Figure 6). Similar shade-dependent reductions were observed at the blush (Figure 6) and full-red stages (Figure 6). These results demonstrate that shade effects on membrane stability varied by developmental stage, with moderate to high shading (35-37%) showing the greatest reduction in EL. These findings suggest that agrivoltaic shading may alleviate photo-oxidative and heat stress, thereby enhancing cellular membrane integrity in cranberry vines.
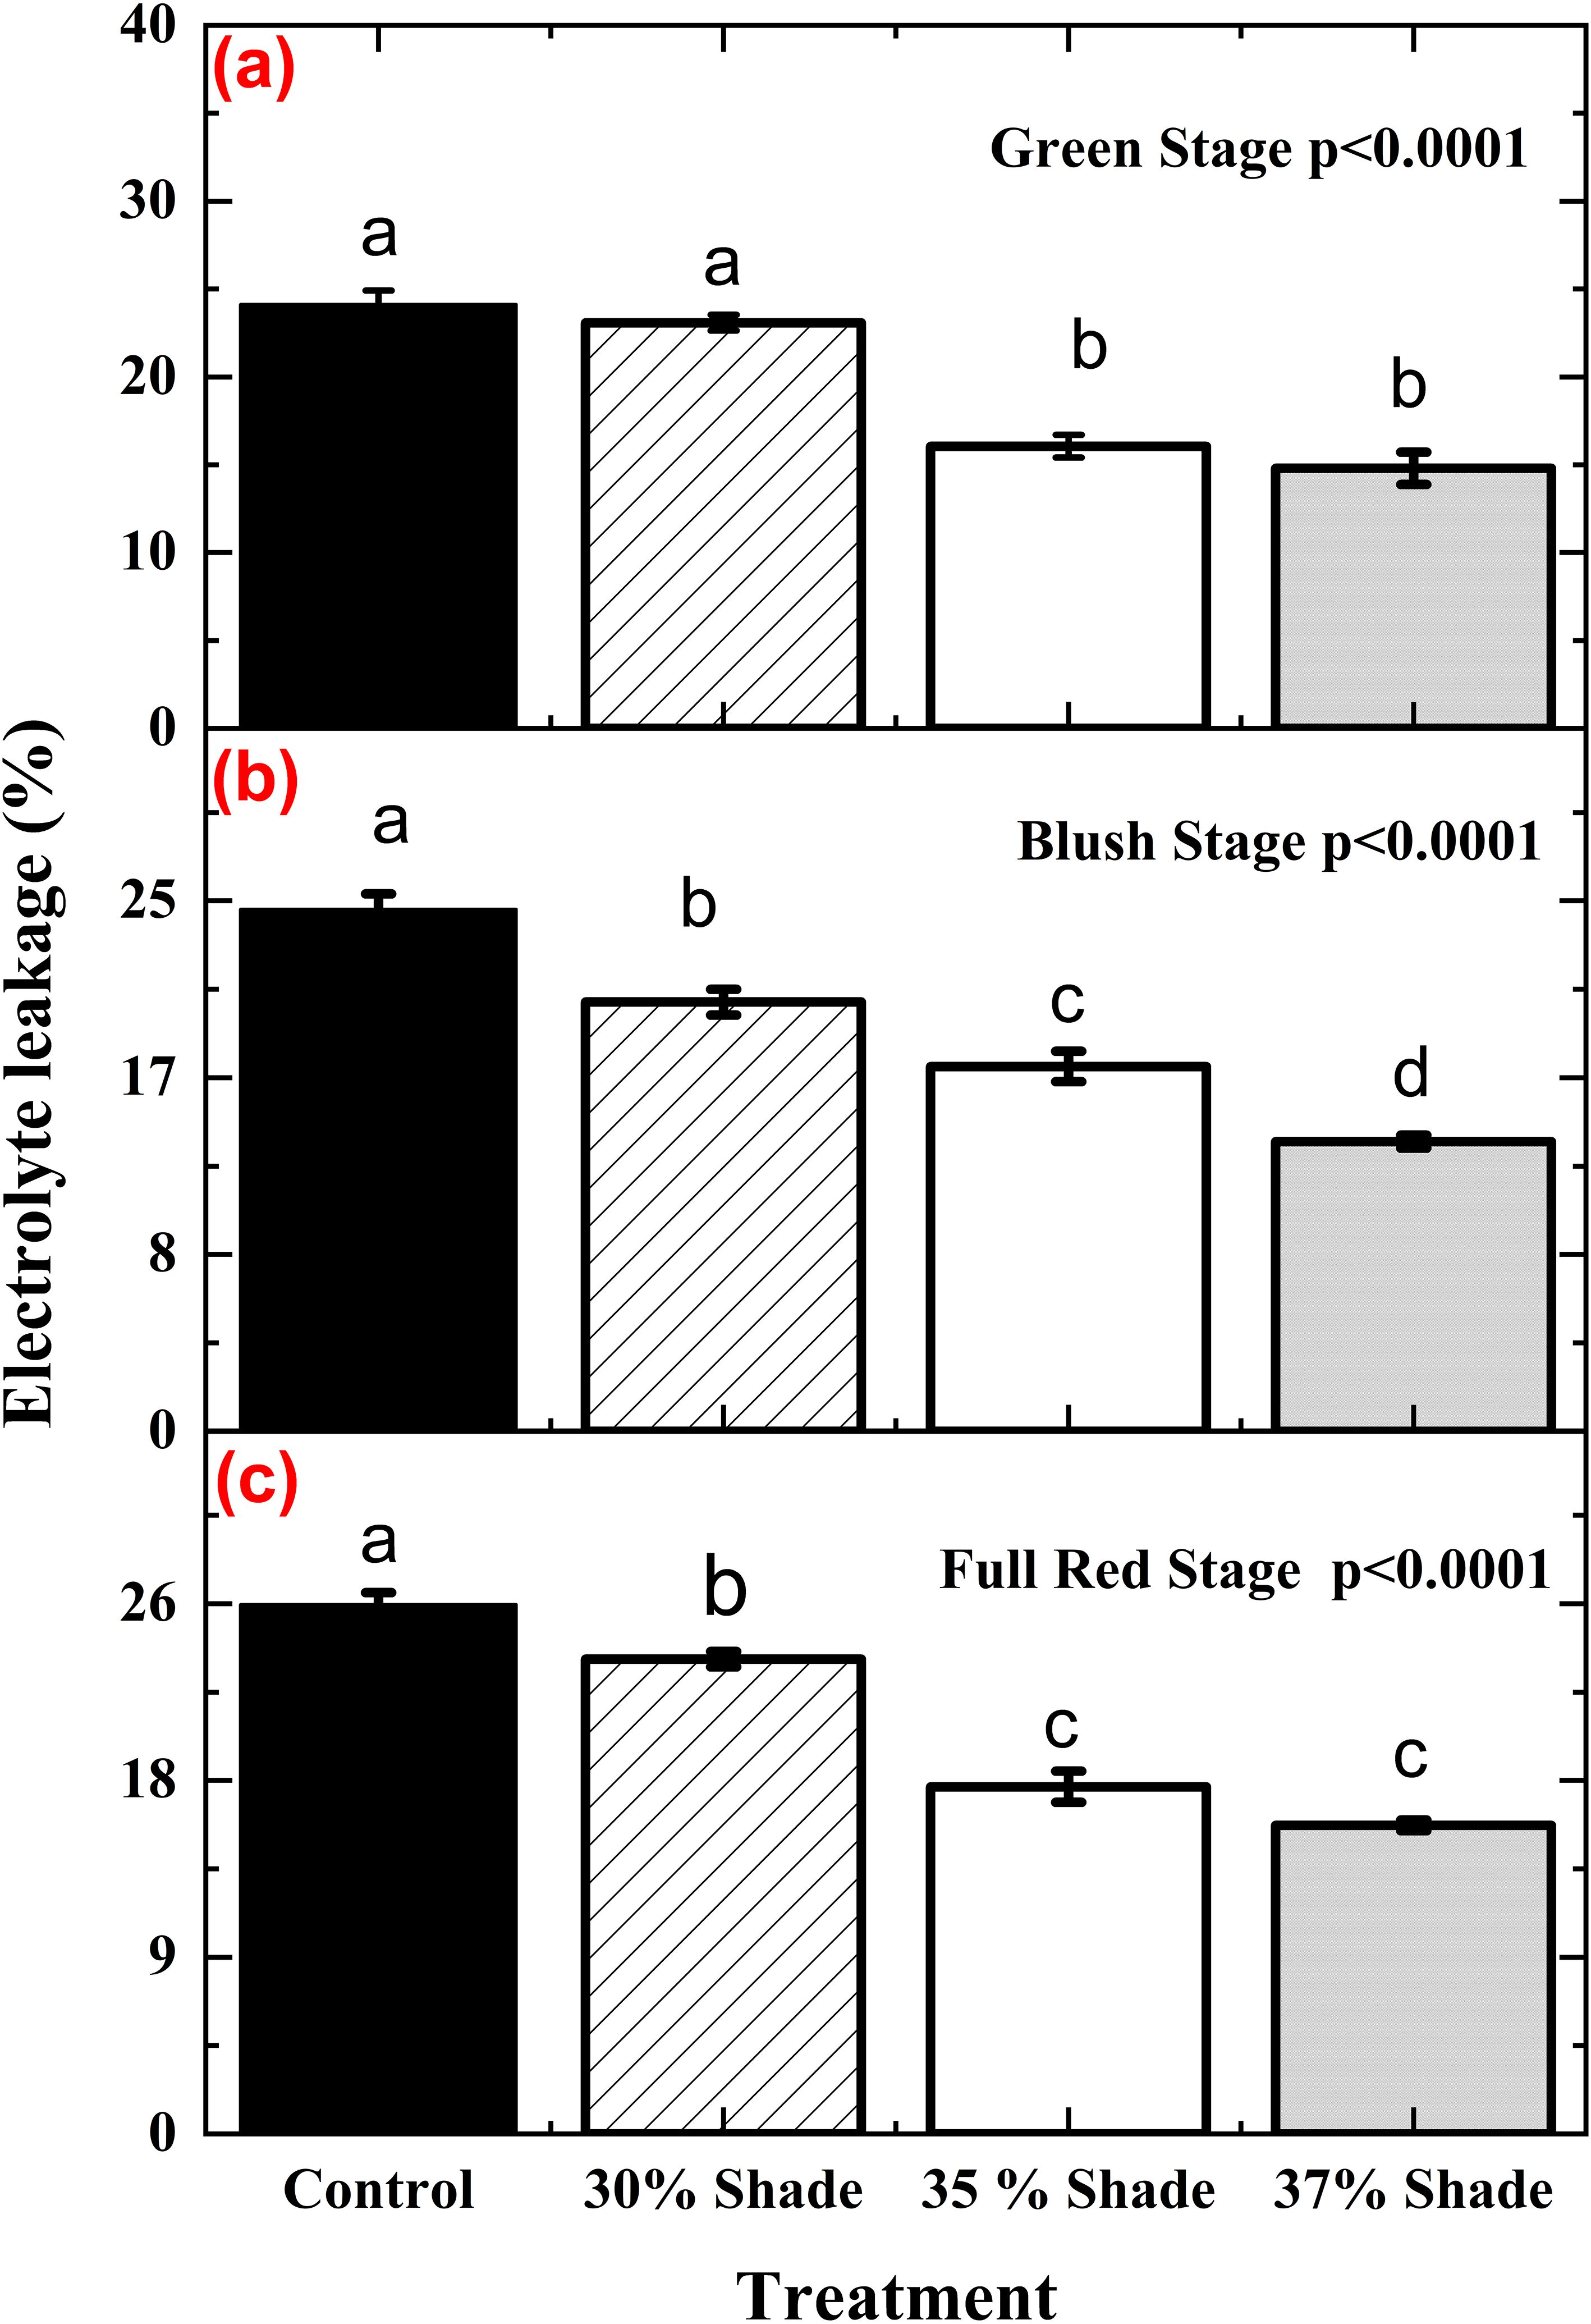
Figure 6. Electrolyte leakage (EL), an indicator of membrane stability, in Massachusetts cranberry vines under different shading treatments at the green (a), blush (b), and full-red (c) fruit stages in an agrivoltaic system. Treatments included control (no panels), 30% shade, 35% shade, and 37% shade. Means (n=8) with similar letters are not significantly different according to Fisher’s LSD test (p< 0.05).
3.3 Biochemical analysis (leaves)
3.3.1 Leaf chlorophyll and anthocyanin content
The effect of shading on both chlorophyll and anthocyanin content varied significantly with phenological stage (stage x shade interaction, p< 0.0001; Table 4). Chlorophyll concentration was highest at the green stage and declined progressively through blush and full-red stages, reflecting chlorophyll degradation during ripening (Table 5). Within the green stage, chlorophyll decreased with increasing shade (37%), with all treatment means separating statistically. At the blush stage, control and 30% shade treatments had significantly higher chlorophyll than 35% and 37% shade, which did not differ from each other. During full-red stage, chlorophyll values were lowest overall, with all shade treatments forming a common group significantly lower than the control (Table 5).

Table 4. Analysis of variance (ANOVA) with TYPE III sum of sum of squares (MS= Mean Square) for Massachusetts ‘Howes’ cranberry under an agrivoltaic system for leaf chlorophyll and anthocyanin content.

Table 5. Effect of different shading treatments on chlorophyll and leaf anthocyanin content in Massachusetts cranberry vines at green, blush, and full-red stage under various shading treatments.
At the green stage, anthocyanin content declined with shade, with control higher than 30% and 35% shade, and the 37% shade treatment exhibiting the lowest concentration. At the blush stage, anthocyanins content was reduced with increasing shade. At the full-red stage, anthocyanin levels were highest in control and decreased as shading increased, with means separating statistically (Table 5).
These results demonstrate that light environment and developmental stage interact strongly to regulate pigment accumulation in cranberry leaves. Chlorophyll content was reduced as shading increased and as fruit maturation progressed; although anthocyanin accumulation progressed with fruit maturation, the pigment concentration was consistently suppressed by reduced irradiance.
3.3.2 Proline and trehalose content
Both proline and trehalose contents were significantly influenced by developmental stage and shading (p< 0.0001; Table 6), whereas the stage x shade interaction was not significant. Proline concentrations decreased with increasing shade, with the highest values in control and the lowest at 37% shade (Figure 7). Independently, proline increased with fruit maturity, rising from the green stage to a maximum at the full-red stage (Figure 7).
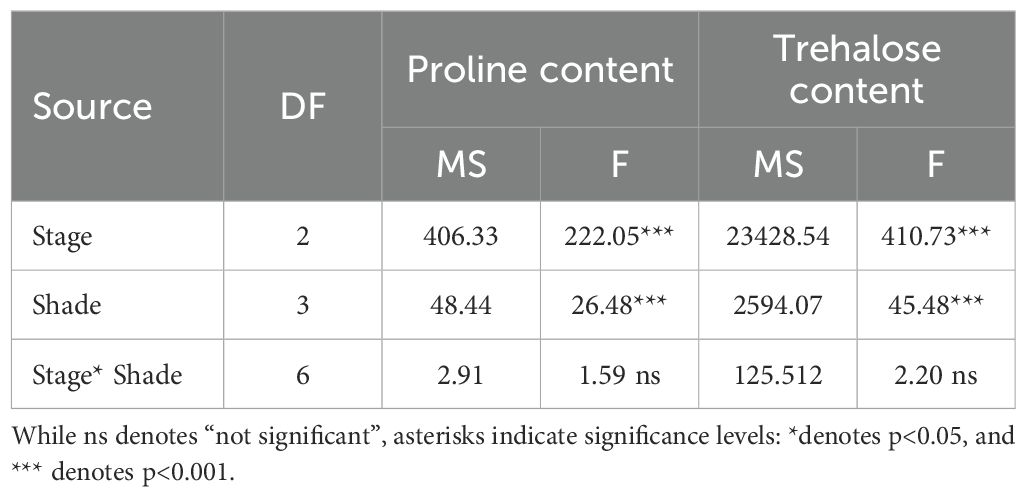
Table 6. Analysis of variance (ANOVA) with TYPE III sum of sum of squares (MS= Mean Square) for Massachusetts ‘Howes’ cranberry under an agrivoltaic system for proline and trehalose content.

Figure 7. Mean proline content (a) under varying shade levels and (b) at different fruit developmental stages for Massachusetts cranberry grown under AV. Data represents mean (± SE) for each significant main effect. Means with similar letters are not significantly different at p<0.05 according to Fisher’s LSD.
Trehalose followed a similar pattern: concentration declined as shading increased (Figure 8), while fruit development was associated with a strong accumulation, with the highest values recorded at the full-red stage (Figure 8).

Figure 8. Mean trehalose content (a) under varying shade levels and (b) at different fruit developmental stages for Massachusetts cranberry grown under AV. Data represents mean (± SE) for each significant main effect. Means with similar letters are not significantly different at p<0.05 according to Fisher’s LSD.
These findings suggested that both metabolites are affected by shade intensity and developmental stage, but shade-induced reductions occur consistently across all stages, as reflected by the absence of significant interaction.
3.3.3 Total non-structural carbohydrates
As a main effect, shading affected total non-structural carbohydrate (p< 0.05 for all parameters; Table 7). Total sugar content for the control and 30% shade was higher than the 37% shading treatment; the 35% shading treatment was similar to all other treatments. Reducing sugar content and starch content were the highest in the unshaded control treatment. The 37% shading treatment had the lowest value with the remaining two treatments falling in between (Table 7).

Table 7. Effect of shading treatments on non-structural carbohydrate content (total sugars, reducing sugars, and starch content) of Massachusetts cranberry vines grown under three shading treatments.
3.4 Phytochemical screening (fruits)
3.4.1 Total phenolics, flavonoids, and antioxidants
Total phenolics, total flavonoid content, and antioxidant activity (DPPH and FRAP assay) in fruits followed a consistent and progressive trend across developmental stages and shading treatments. These biochemical constituents were lowest at the green stage, increased at the blush stage, and reached their highest levels at the full red stage.
3.4.1.1 Total phenolics
Analysis of variance indicated that both phenological stage and shade treatment affected total phenolic concentration (p< 0.001 for both; Table 8), whereas their interaction was not significant. The highest phenolic concentrations were measured in the control fruit grown under control (Figure 9), while reductions were observed with increasing shade intensity (37% shade). Across shading treatments (Figure 9), control fruit grown under full sun (control) exhibited the highest phenolic concentrations, and values declined with increasing shade intensity. Fruit grown under 35% and 37% shade showed lower phenolic concentrations compared with the control and 30% shade.

Table 8. Analysis of variance (ANOVA) with TYPE III sum of sum of squares (MS= Mean Square) for Massachusetts ‘Howes’ cranberry under an agrivoltaic system for total phenolics and total flavonoids.

Figure 9. Total phenolic content in Massachusetts cranberry fruit under AV (a) under various shadings and (b) at various phenological stages. Means with similar letters are not significantly different according to Fisher’s LSD (p<0.05).
Developmental stage also strongly influenced phenolic content. Concentrations increased progressively from the green stage to the blush stage and highest were recorded at the full-red stage, reflecting enhanced biosynthesis during ripening (Figure 9). Because the stage x shade interaction was not significant, these shading effects were consistent across all developmental stages. Taken together, these data indicate that light availability is a key determinant of phenolic accumulation, especially during the later stages of fruit ripening. Although fruit maturity inherently enhances phenolic biosynthesis, increasing shade reduces phenolic content.
3.4.1.2 Total flavonoids
Th effect of shading treatment on total flavonoid content varied by fruit stage (p< 0.001; Table 8). Overall, values increased with fruit maturation but declined under higher shade levels at each stage (Figure 10). Across all stages, a similar pattern was observed: the control consistently showed the highest flavonoid content, followed by reductions with increasing shade. At the green stage, values under 35% and 37% shade were significantly lower than the control (Figure 10). Similarly, during blush stage, flavonoids declined as shading increased (Figure 10). At the full-red stage, shading again reduced flavonoid accumulation, with 35% and 37% shade showing the lowest values (Figure 10).

Figure 10. Total flavonoid content of Massachusetts cranberry grown under different shading treatments at green stage (a), blush stage (b) and full-red stage (c) fruit under various shading treatments. Treatments were control (no panels), 30% shade, 35% shade, and 37% shade. Means with similar letters are not significantly different according to Fisher’s LSD (p< 0.05).
These findings demonstrate that while flavonoid content naturally increases with maturity, shading consistently limits accumulation, with the strongest reductions under 35-37% shade. Despite the overall increase in flavonoid content with fruit maturation, the lowest concentrations were consistently observed in shaded fruit, indicating that reduced light availability limits flavonoid biosynthesis throughout ripening. These results demonstrate that flavonoid accumulation is strongly regulated by developmental stage but is also light-dependent, with solar panel shading constraining biosynthesis, particularly under higher shading intensities.
3.4.1.3 Total antioxidant activity (DPPH and FRAP assay)
The influence of agrivoltaic shading on cranberry fruit antioxidant activity, measured by DPPH radical scavenging and FRAP assays, varied across developmental stages (stage x shade interaction: DPPH, p< 0.05; FRAP, p< 0.0001; Table 9). In both assays, antioxidant capacity increased strongly with ripening, reaching maximum levels at the full-red stage, consistent with the accumulation of phenolics and anthocyanins during fruit maturation (Table 10). The two assays quantify different aspects of antioxidant function: DPPH assesses free radical scavenging, while FRAP measures reducing capacity. Despite these differences, both assays showed similar overall trends. Antioxidant activity increased from the green to the full-red stage in all treatments, but shading consistently suppressed this response (Table 10). Control fruit maintained the highest activity, 30% shade showed only slight reductions, and 35-37% shade resulted in significant decreases. The suppressive effect of shading was evident from the green stage onward and became more pronounced at later stages.

Table 9. Analysis of variance (ANOVA) with TYPE III sum of sum of squares (MS= Mean Square) for Massachusetts ‘Howes’ cranberry under an agrivoltaic system for antioxidant activity (DPPH and FRAP assay).

Table 10. Effect of different shading treatments on antioxidant activity (DPPH and FRAP assay) in cranberry fruits at green, blush, and full red stage under agrivoltaics settings.
FRAP exhibited a stronger stage x shade interaction than DPPH, suggesting that the compounds contributing to reducing capacity were more sensitive to shading than those driving radical scavenging activity. Collectively, these results demonstrate that while cranberry antioxidant activity naturally increases during ripening, moderate to high shading (≥35%) constrains this increase. This suggests that reduced light availability limits the biosynthesis or accumulation of antioxidant compounds in cranberry fruit.
4 Discussion
4.1 Agrivoltaic shading alters light availability and photosynthetic function
The installation of an agrivoltaic system on a cranberry bog markedly reduced the incident light, particularly under narrower interrow-spacing, where PAR was reduced by 35-37% compared to unshaded control plots. In rice, Lee et al. (2023) documented midday PAR reductions of up to 57% under AV installations, while Mohammedi et al. (2023) reported that conventional opaque photovoltaic panels reduced PAR by up to 86%. Such studies highlight the severity of AV-induced shading across different agronomic systems. This substantial reduction in irradiance impaired photosynthetic function, as evidenced by concurrent reductions in net photosynthetic rate, stomatal conductance, and transpiration in the current study. These reductions were most pronounced at the full-red stage, indicating that light limitation exerts increasingly restrictive effects on photosynthetic processes as fruit maturation progresses. Such patterns align with prior studies on light-sensitive fruit and forage crops exposed to shading from photovoltaic modules. Excessive shading decreased solar radiation intercepted by the canopy, affecting photosynthetic electron transport and key enzyme activity, and consequently resulted in insufficient photosynthetic product synthesis and supply capacity in leaves (Dong et al., 2015). In maize (Zea mays L.), Ramos-Fuentes et al. (2023) found that dynamic agrivoltaic (29-38% shading), AVhalf and AVfull (30-56%) shading, resulted in reduced photosynthetic activity and stomatal conductance. Similarly, the simulated shading intensity (40-50% in the central rows in apple trees) indicates that trees under the agrivoltaic panels received roughly half of the incident radiation throughout the season (Juillion et al., 2024). Given that approximately 45-50% of incoming solar energy lies within the photosynthetically active radiation (PAR) spectrum (Juillion et al., 2024), this translates to a proportional reduction in PAR availability, which has direct implications for photosynthetic activity and plant performance under the system. In kiwifruit (Actinidia chinensis deliciosa, cv. Jin Yan) also, transpiration rate and photosynthesis declined progressively with higher shading intensities (Jiang et al., 2022). Since PAR availability was substantially reduced under AV shading, the diminished carbon assimilation and transpiration can be attributed to limited light input, suggesting physiological performance of plants is strongly coupled to reductions in PAR under agrivoltaics.
Beyond PAR, the present study also quantified Daily Light Integral (DLI) to capture cumulative light supply over each 24-h period. Although shading treatments consistently reduced DLI relative to the control, the values remained within or near the generally reported optimum range for many horticultural crops (Faust and Logan, 2018). However, the reductions were sufficient to limit carbon assimilation compared with the control, but not low enough to cause severe light deprivation or irreversible physiological disruption. This explains why photosynthetic rates and carbohydrate accumulation were lower under agrivoltaic (AV) shading, while plants still maintained functional activity throughout the growing season. In this context, DLI serves as a useful integrative indicator, showing that agrivoltaic shading moderates light supply without necessarily driving it below the physiological threshold required to sustain growth and development. The present findings align with those reported by Masabni et al. (2016) for tomato and chilli pepper, where DLI values were 20.4 and 12.1 mol m−2 d−1 under 50% and 70% shade treatments, respectively, compared with 52.5 mol m−2 d−1 under full sun. These results indicated that the 50% and 70% shade treatments reduced DLI to approximately 60% and 77%, respectively, relative to full-sun conditions (Masabni et al., 2016).
In our study, shading also reduced the net photosynthetic rate in cranberry, particularly during full-red stage, where photosynthetic activity declined by up to 47% under 37% shade relative to unshaded control. This decline likely reflects both reduced light availability for carbon fixation and downregulation of stomatal conductance and chlorophyll biosynthesis. Such reductions are consistent with findings in other shade-sensitive crops grown under AV systems. For example, rice and soybean (Glycine max L.) exhibited decreases in photosynthetic efficiency accompanied by yield reductions of 13-30% and 18-20%, respectively, under panel-induced shading (Lee et al., 2023). In sweet corn (Zea mays subsp. mays), Susanti et al. (2023) reported that a 50% shade treatment led to suppressed photosynthetic rate, particularly in genotypes with low-shade tolerance, due to compromised light interception and chlorophyll content. Similar physiological responses have been documented in fruit crop species. Kiwifruit exposed to 30-38% shading under AV installations exhibited a marked reduction in photosynthesis (Jiang et al., 2022).
We observed reductions in cranberry stomatal conductance and transpiration that were most pronounced at the full-red stage under higher shading levels (35-37%), suggesting that the elevated carbon and water demand during fruit maturation intensifies the physiological sensitivity to light limitation. These findings are consistent with broader evidence from agrivoltaic (AV) systems, where panel-induced shading alters microclimate and plant-water relations. The observed reduction in transpiration under AV systems may indicate improved WUE under reduced evaporative demand, as previously shown in lettuce (Lactuca sativa spp.) (Marrou et al., 2013b), agave (Agave americana) (Ravi et al., 2014), and kiwifruit (Jiang et al., 2022). In lettuce, Marrou et al. (2013b) observed a 10-30% reduction in evapotranspiration (ET) under AV installations, attributing this to decreased irradiance and vapor pressure deficit. These effects were particularly evident when PAR availability was maintained at 50-70% of full sunlight. In a perennial fruit crop, Jiang et al. (2022) assessed the effects of 19%, 30%, and 38% shading in kiwifruit. They found that while increased shading improved relative humidity and reduced canopy temperature, it concurrently suppressed both transpiration and photosynthesis, indicating a physiological trade-off between water conservation and carbon assimilation. Likewise, in maize, Ramos-Fuentes et al. (2023) reported that varying degrees of shading within AV systems produced corresponding reductions in stomatal conductance. In a recent study by Magarelli et al. (2025a), stomatal conductance varied distinctly between the low shade (LS) and high shade (HS) treatments in grapevine agrivoltaic system, with LS showing the highest IQR and median values, while HS displayed the lowest. Taken together, these studies underscore a consistent trend: while moderate AV shading can improve water status and microclimate, it may also constrain gas exchange and photosynthetic efficiency, particularly during stages of elevated metabolic demand.
4.2 Shading modulates leaf pigment composition: effects on chlorophyll and anthocyanins
Shading altered the biochemical content in cranberry leaves. Chlorophyll content declined at the green stage under 35% and 37% shading, by 39% and 49% respectively, compared to the unshaded control (Table 5, Figure 11). This suggests a developmental sensitivity to light limitation, likely reflecting a suppression of chlorophyll biosynthesis and light-harvesting complex protein expression, which are both tightly regulated by light changes. The observed decline in chlorophyll under shaded conditions may represent an adaptive response to reduced photon flux, aimed at reallocating resources away from excess pigment production when light capture is constrained. The reduction in chlorophyll at 35-37% shading is consistent with the shading threshold proposed for fruit crops in a recent critical review synthesis of agrivoltaic systems (Magarelli et al., 2024), which concluded that >30% shade alters leaf morpho-physiology and depresses photosynthetic capacity. Comparable reductions in chlorophyll under agrivoltaic systems have been reported in Brassica rapa (pak choi) and Brassica napus (rape) (Hsiao et al., 2023), as well as in sweet corn and kiwifruit (Susanti et al., 2023; Jiang et al., 2022), underscoring the sensitivity of this response across crops. In grapevine estimated chlorophyll concentration was higher in HS and LS leaves compared to full sun FS (Magarelli et al., 2025a). Furthermore, in Mediterranean viticulture, agrivoltaic shading improved the microclimate and strongly increased yield (+277%) in grapevine (Magarelli et al., 2025b). These divergent responses highlight that shade-induced pigment acclimation is not directionally conserved across species. Architectural strategy, latitude, background climate, and spectral composition of shade likely contribute to these differences.
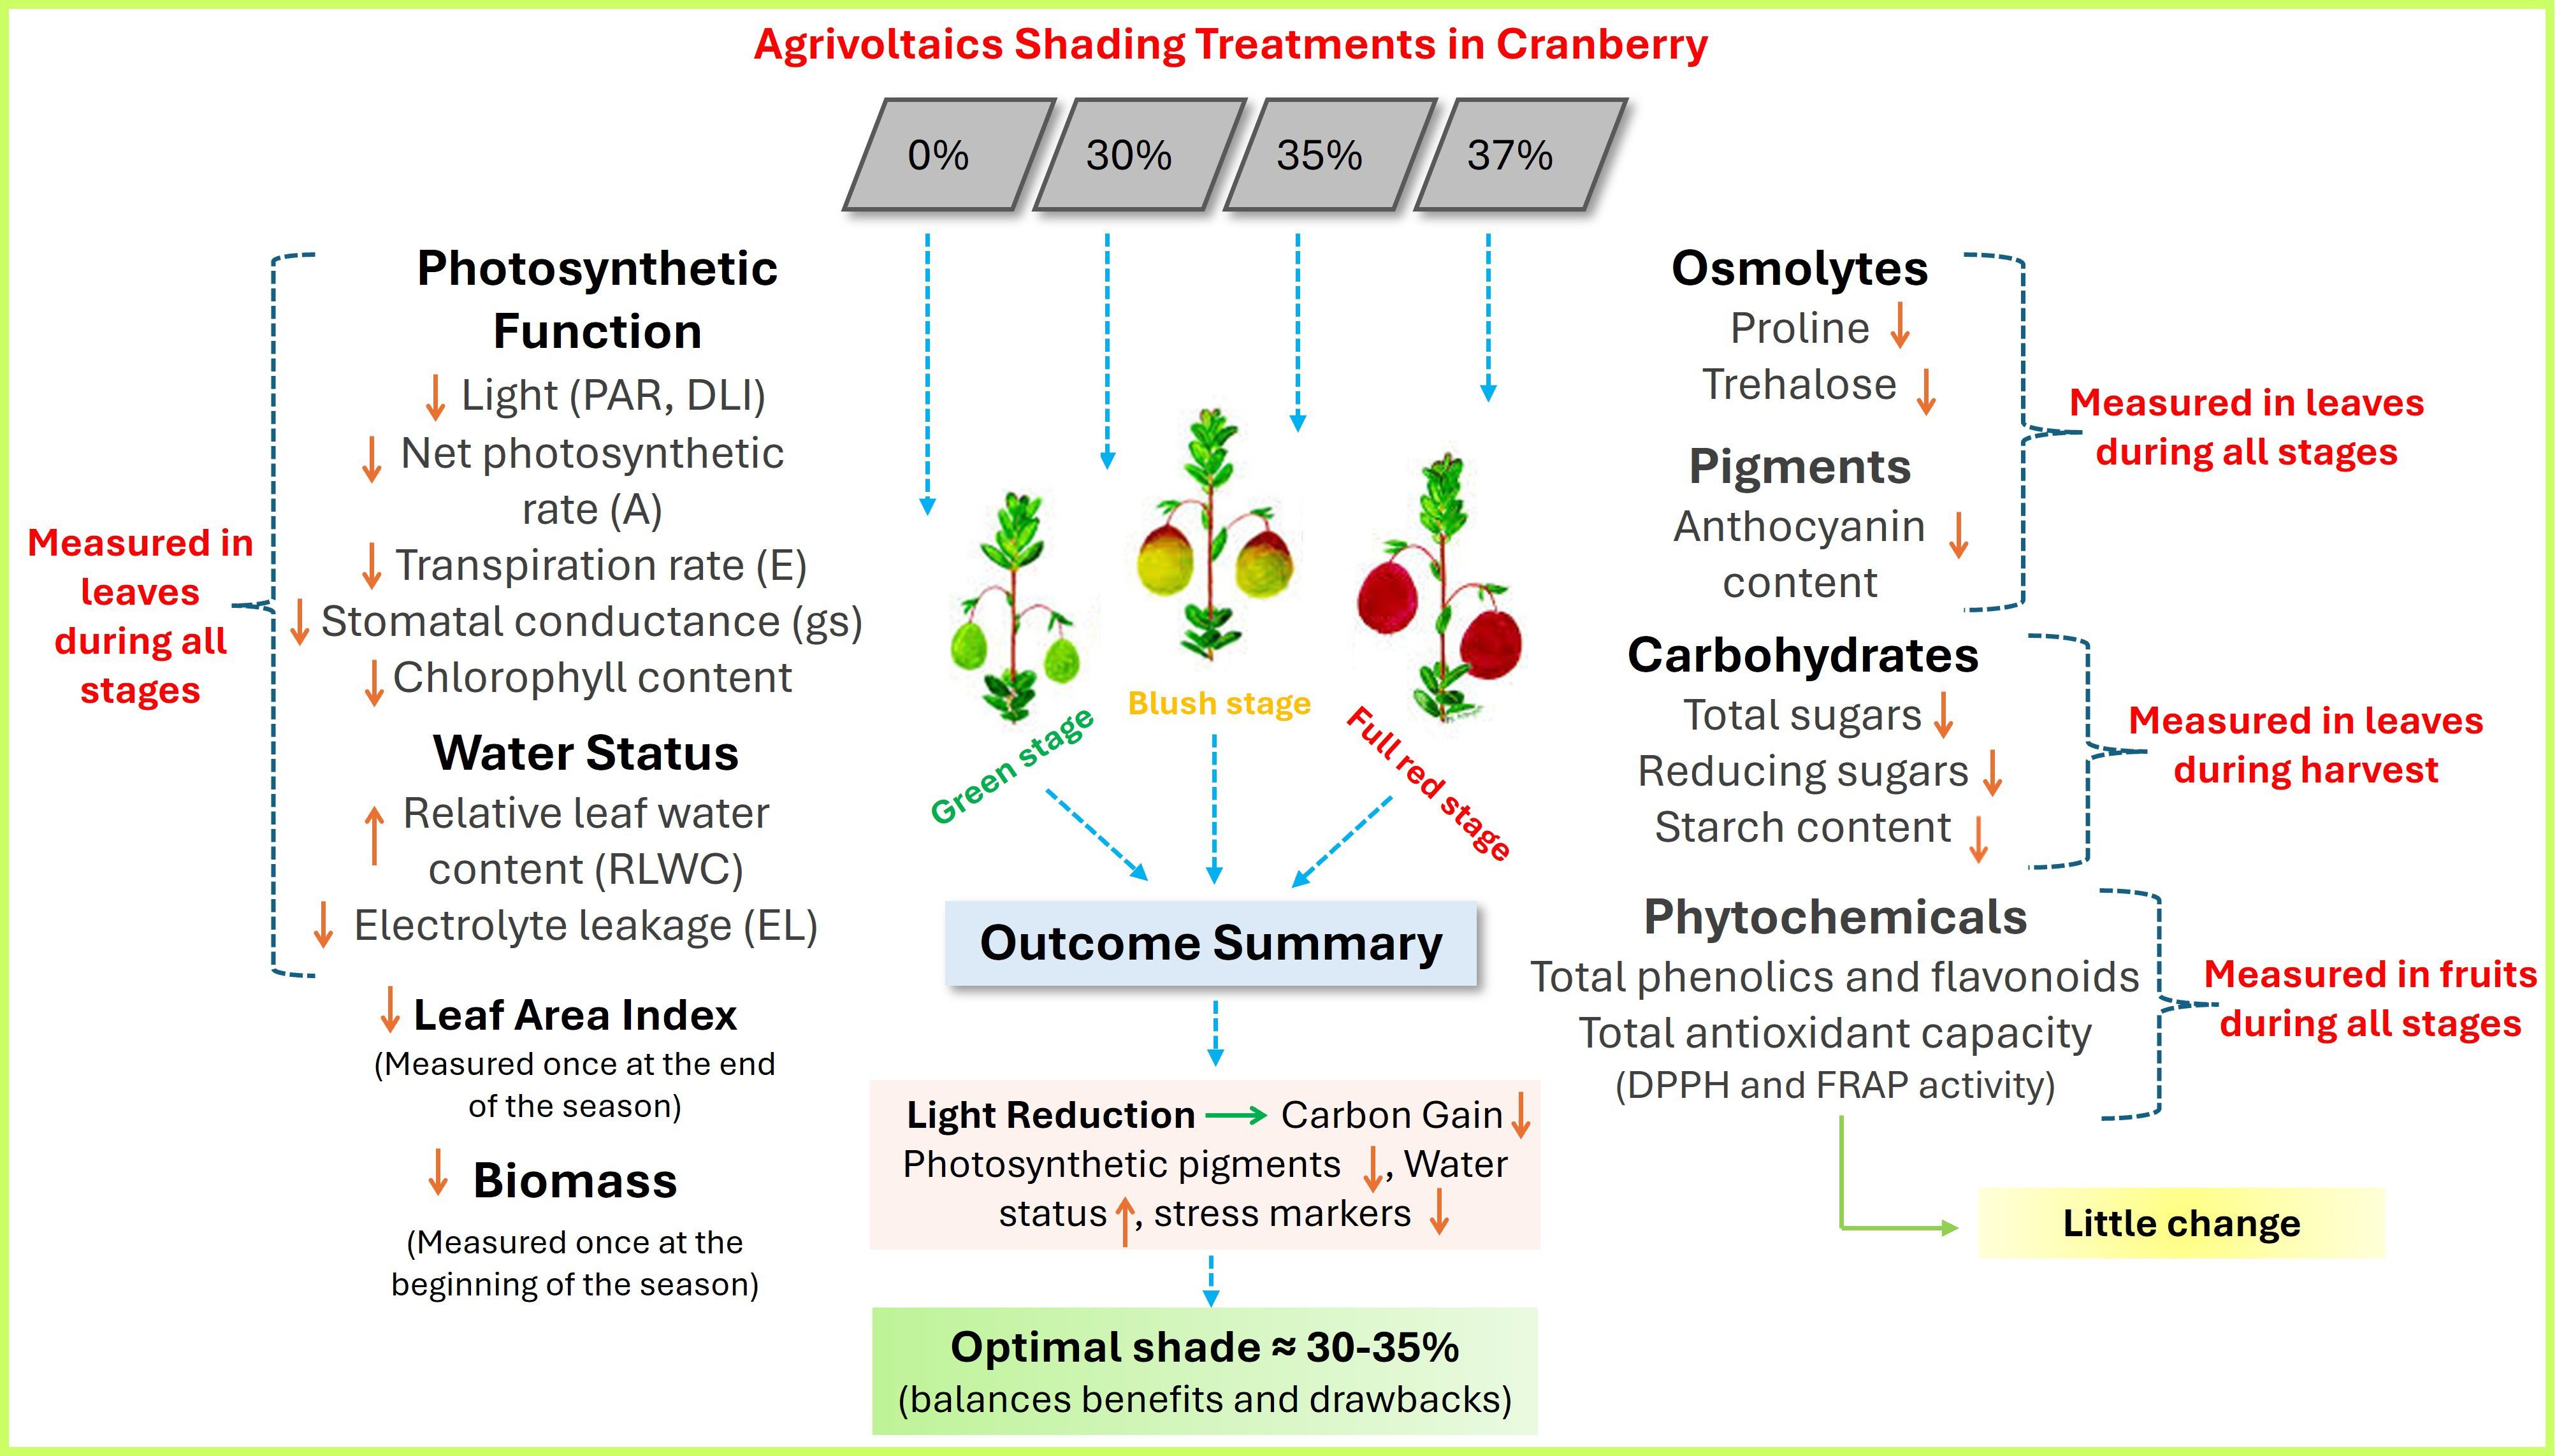
Figure 11. Summary of observed responses in key agronomic (physiological and biochemical) parameters of Howes cranberry (Vaccinium macrocarpon) in Massachusetts, USA under agrivoltaic shading. Arrows represent increases (↑) or decreases (↓) in measured values relative to unshaded control conditions.
In addition to chlorophyll, shading also influenced pigment-based photoprotective mechanisms. While leaf anthocyanin content increased with fruit maturity, concentrations were reduced at all shade levels when compared to the unshaded control (Table 5). Unlike fruit anthocyanins, which contribute primarily to pigmentation and consumer appeal, leaf anthocyanins play a critical role in light attenuation, antioxidant defense, and photoprotection (Gould et al., 2010). Their decline under shading likely reflects a reduced need for photoprotective mechanisms in environments with diminished UV and PAR exposure. This trend is consistent with previous observations in grape (Vitis vinifera) (Ferrara et al., 2023), black currant (Wolske et al., 2021), and broccoli (Moon and Ku, 2023), where anthocyanin content was significantly suppressed under moderate to heavy shading (35-75%).
Collectively, these results suggest that while AV systems may offer microclimatic benefits such as improved water retention, they also constrain pigment accumulation in leaves. This may impair light-harvesting capacity and photoprotective responses, particularly during early developmental stages. Optimizing shading levels is therefore critical to maintaining pigment integrity and photosynthetic function in crops like cranberry.
4.3 Shading improves water status and reduces cellular stress
Although photosynthetic capacity declined under increased shading, shading enhanced plant water status, as evidenced by increased relative leaf water content (RLWC) irrespective of developmental stage (Figure 5). The elevated RLWC observed under shaded conditions suggests a reduction in transpirational water loss, likely driven by lower vapor pressure deficits and decreased stomatal conductance. These findings are consistent with prior studies demonstrating improved leaf hydration in shaded crops. For instance, Scarano et al. (2024) reported that RLWC increased for tomato under shaded conditions, suggesting improved leaf hydration under diminished light intensity and thermal stress. Similarly, Semeraro et al. (2024) observed increased leaf water content in shaded chicory plants, which was linked to improved edible biomass and nutritional quality. The findings of Ghassemi-Golezani et al. (2013) demonstrated that while shading improved RLWC across all irrigation regimes in soybean (Glycine max L.), the effect was statistically significant only under conditions of severe water stress. The elevated RLWC observed in cranberry leaves suggests that agrivoltaic systems can mitigate water stress by balancing microclimatic extremes, particularly during high-temperature periods.
In parallel, shading also conferred significant protection at the cellular level, as indicated by a marked reduction in electrolyte leakage (EL), a widely used trait for indicating membrane damage and oxidative stress. The decline in EL under 35% and 37% shading reflects enhanced membrane integrity, likely resulting from lower photo-oxidative stress (Figures 6, 11). Although no direct studies have yet quantified the impact of AV systems on EL in crops, several findings support the role of shading in mitigating membrane damage under various environmental stresses. Evidence from non-AV shading studies supports this interpretation. For instance, Cordoba-Novoa et al. (2022) observed that EL in strawberry (Fragaria X Ananassa) plants was significantly elevated under non-shaded, water-deficit conditions (NS-WD: 24.5%), but was markedly lower in shaded treatments, regardless of water status (S-WW, S-WD), indicating that reduced light exposure alleviates cellular stress even under drought. Their study attributed high EL under NS-WD to reactive oxygen species (ROS)-induced lipid peroxidation and membrane disruption, whereas shading attenuated this response by lowering ROS generation. Similarly, Aras et al. (2021) demonstrated that shading treatments protected cell membranes and preserved leaf water status under salinity stress in sweet cherry plants.
Although studies focused specifically on EL responses under agrivoltaic conditions are lacking, our results suggest that solar panel-induced shading in cranberry may offer comparable physiological protection, particularly under high-radiation or water-limited scenarios. Together, these physiological and biochemical responses underscore the protective role of agrivoltaic shading in alleviating abiotic stress. These results highlight that agrivoltaic shading not only improves plant water balance but also plays a critical role in maintaining cellular homeostasis by limiting light-induced oxidative damage. Therefore, optimal shading may offer dual benefits in high-radiation environments, preserving both hydration and membrane integrity. In cranberry, these effects may be particularly important during peak solar radiation periods when uncontrolled transpiration and heat stress could impair cellular function and crop performance. Furthermore, temperature interacts with light availability: warmer conditions early in the season promote anthocyanin and flavanol accumulation, while cooler nights before harvest enhance antioxidant content in cranberry (Vanden Heuvel and Autio, 2008). Importantly, excessive heat combined with intense solar radiation can impair cranberry physiology, leading to fruit scald and heat-induced tissue damage if vines are not cooled (Roper, 2006). Together, these findings demonstrate that both PAR and temperature regulate not only cranberry productivity but also secondary metabolite profiles, and that mitigating excessive radiation through shading or cooling can be critical for sustaining yield and fruit quality in high-light, high-temperature environments.
4.4 Downregulation of osmoprotectants and non-structural carbohydrates accumulation
Although agrivoltaic shading improved plant water relations, it simultaneously affected the accumulation of key osmoprotectants, including proline and trehalose, both of which play pivotal roles in cellular osmotic adjustment, redox balance, and stress signaling. No studies to date have directly quantified proline or trehalose accumulation in crops grown under agrivoltaic systems, however the consistent reduction of these osmoprotectants observed in our study particularly under 35% and 37% shading (Figures 7, 8, 11), is consistent with findings from controlled shading environments. For instance, prior findings of Semida et al. (2017), showed that free proline, soluble sugars, and total free amino acids significantly declined in cucumber (Cucumis sativus) with increasing shade levels (50-75%) compared to plants grown under light-limited but higher irradiance (25% shade). Their results suggest that higher shade levels reduce metabolic signals associated with abiotic stress, including osmolyte biosynthesis. Our findings are further supported by Narjesi et al. (2023), who showed that pomegranate (Punica granatum L.) grown under 50% white photo-selective shade nets had the lowest proline levels among all treatments, coinciding with increased relative leaf water content, lower canopy temperatures, and improved fruit quality. These results indicate that reduced PAR under shading mitigates oxidative and osmotic stress, thereby downregulating proline biosynthesis.
Similarly, Xie et al. (2023) reported that even slight shading significantly reduced proline accumulation in herbaceous peony (Paeonia spp.), a light-sensitive perennial. They also observed that leaf senescence was delayed, and net photosynthetic rate, chlorophyll, and sugar content increased under shaded conditions, while stress markers such as proline and abscisic acid (ABA) were suppressed. The authors attributed these effects to reduced photoinhibition and a more favorable hormonal balance under lower irradiance. Further, Lin et al. (2019), in a pot study involving 240 Torreya grandis seedlings under various shading and watering regimes, found that drought-induced proline accumulation was significantly lower under moderate shading (50-75%). The authors concluded that shading mitigated drought stress by moderating light and temperature extremes, thereby reducing the need for osmotic adjustment through proline biosynthesis.
Trehalose, similarly, is known to accumulate in response to dehydration and oxidative stress, and its suppression here reinforces the conclusion that shaded microclimates mitigate stress signaling at the metabolic level. Our study is among the first to report changes in proline and trehalose levels under simulated agrivoltaic shading in cranberry. These findings suggest that shading created by solar infrastructure can shift metabolic allocation away from stress tolerance mechanisms and toward maintenance of growth and hydration. This highlights a novel and underexplored benefits of agrivoltaic systems: the potential to reduce the physiological cost of stress defense by moderating environmental extremes.
In parallel, shading also led to significant reductions in total sugars, reducing sugars, and starch content, particularly under 37% shade (Table 7; Figure 11). These declines likely reflect a combination of impaired carbon assimilation due to lower PAR and altered carbohydrate partitioning in shaded tissues. Decreased starch reserves and soluble sugar pools under shade suggest limitations in source strength as well as possible shifts in sink activity during fruit development. Excessive or insufficient light intensities decrease soluble sugar content in plants, as observed in purple sweet potato (Ipomoea batatas L.), where light intensity strongly influenced secondary metabolite accumulation (Jin et al., 2023). Their findings showed that tubers exposed to 20% shade (L1) exhibited increased soluble sugar contents relative to full light (L0), but these values declined significantly under 40-80% shade (L2-L4), suggesting that excessive shading suppressed sugar accumulation, underscoring the non-linear relationship between light intensity and metabolite production. In another study, low light and high shade significantly reduced non-structural carbohydrate content in soybean stem (Hussain et al., 2019). Wang et al. (2022) showed that shading suppressed the sugar accumulation in leaf and fruit of jujube (Ziziphus jujuba Mill.), which was associated with differential transcription levels of related metabolic genes. Shading also decreased the sugar/acid ratio and decreased starch concentration. Shading from solar panels (mean shading rate of 50-55%) also decreased the sugar/acid ratio and starch concentration in apple (Juillion et al., 2024). Roper et al. (1995) reported that shading reduced the concentration of nonstructural carbohydrates in cranberry, highlighting that prolonged reductions in PAR can constrain carbon assimilation and storage. These observations support the broader consensus that PAR availability is a primary regulator of carbon allocation and carbohydrate biosynthesis in crops.
Collectively, these results indicate that while moderate shading may reduce abiotic stress, it comes at the cost of lower osmotic and energy-related metabolite accumulation. For cranberry, this trade-off may have implications for both stress resilience and fruit quality, depending on the intensity and duration of shade exposure during key developmental phase.
4.5 Accumulation of secondary metabolites in cranberry fruit
Total phenolic and flavonoid content in cranberry fruit increased as phenology progressed, reaching maximum concentrations at the full-red stage (Figures 9, 10), consistent with the stage-dependent regulation of secondary metabolism in fleshy fruits (Vvedenskaya and Vorsa, 2004). However, this accumulation was suppressed under agrivoltaic shading, particularly at higher intensities (35% and 37%), indicating a strong dependency on light availability for the biosynthesis of these compounds.
Many scientific research studies and agricultural production practices show that light conditions affect fruit quality. For instance, in blackcurrant (Ribes nigrum L.), shading lowered the levels of total phenolic and flavonoid content in most cultivars during the first cultivation season, except in the shade-tolerant variety Ometa (Djordjevic et al., 2015). Notably, seasonal variability in antioxidant responses was also observed in blackcurrant with reductions in radical scavenging activity under shading conditions. In another study, shade reduced the total phenolics and total flavonoid contents in chili pepper (Capsicum spp.), however, these metabolites increased under open field conditions (Cruz-Ricardez et al., 2023).
In contrast to the above findings, studies on strawberry cultivation under semi-transparent photovoltaic panels showed a beneficial effect on crop quality, specifically an increase in total phenolic content and free radical scavenging activity (Petrakis et al., 2024). Similarly, Chae et al. (2022) showed that antioxidant capacity, total flavonoids, and total phenolic contents of broccoli grown under an agrivoltaic system were not significantly different from those of broccoli grown in the open field. Their findings also showed that the average total phenolic content varied between spring and fall harvests, with a higher content in the fall harvests. Total phenolic content (TPC) of tomato grown under open-field and greenhouse conditions were similar (Angmo et al., 2021). However, greenhouse conditions resulted in a 35% decrease in total flavonoid content (TFC) of tomato fruit and shading reduced the TPC and TFC by 29 and 16%, respectively (Angmo et al., 2021).
Plants produce a wide range of flavonoids and related phenolic compounds in response to UV radiation. Generally, increasing UV-B radiation induces flavonoids and phenolic synthesis in brassica and barley (Olsson et al., 1998; Liu et al., 1995). It has been demonstrated in bean leaves that a high level of PAR gave a higher concentration of flavonoids compared to a low level of PAR (Cen and Bornman, 1990). The decreased level of TFC in shaded conditions is similar to the reports on Capsicum annuum L. (capsicum) where shading reduced the TPC and TFC by 35.2% and 14.6%, respectively, under greenhouse conditions (Angmo et al., 2022). Similarly, leaf flavonoid levels in pear trees were reduced under agrivoltaics, even while other factors like flowering and fruit set remained unchanged (Reher et al., 2025), suggesting a direct impact of the reduced light availability on flavonoid production in this specific crop.
In our case, the results showed that the shading provided by the solar panels resulted in reduced TPC, flavonoid content, and antioxidant activity. These findings collectively underscore the light-sensitive nature of secondary metabolite biosynthesis in cranberry, and suggest that excessive shading, while reducing abiotic stress, may affect the antioxidant profile and potential health-promoting attributes of the fruit. Therefore, the design of agrivoltaic systems must consider not only yield and physiological stress but also light-driven metabolic quality parameters.
5 Conclusions
The cumulative findings of this preliminary study reveal physiological and biochemical trade-offs exist for cranberry grown under AV production systems. While moderate shading levels (30% and 35%) clearly mitigated environmental stress, evident from improved leaf water status and reduced electrolyte leakage, these same treatments also curtailed critical aspects of physiological and metabolic performance. Specifically, reductions in photosynthetic activity, carbon reserve accumulation, and biosynthesis of stress-related osmolytes and antioxidant compounds were consistently observed under increasing shade intensity. The suppression of photosynthetic and secondary metabolic traits under high shading (37%) suggests the existence of a physiological threshold, beyond which the protective effects of shade are outweighed by functional losses in assimilate production and metabolite accumulation. This outcome is similar to trends reported in other agrivoltaic systems involving tomato, lettuce, and grape, where excessive shade reduced light interception to levels incompatible with optimal carbohydrate and pigment biosynthesis (Elamri et al., 2018; Marrou et al., 2013b).
From an applied perspective, these results underscore the necessity of site- and crop-specific optimization of agrivoltaic infrastructure, including panel height, tilt, and row spacing, to ensure that solar integration does not compromise crop productivity. For cranberry, a perennial species with light-dependent metabolite pathways, maintaining shading levels around 35% may offer the best results between stress reduction and preservation of fruit biochemical attributes. Ultimately, this study highlights the importance of a balanced agronomic strategy within dual-use systems, one that preserves the functional integrity of crop physiological processes while capitalizing on the ancillary benefits of renewable energy generation. It is important to note that this data set represents the first year of data collection, and external factors may have influenced the outcomes. During this period, site construction activities may have induced transient stress or atypical plant responses. Notably, the solar panels were in a fixed tilt position, without solar tracking capability, and were not yet connected to the electrical grid, limiting their functionality and potential microclimatic effects.
Although this study reports results from a single growing season, the focus was on physiological and biochemical responses rather than yield. Such traits respond directly to environmental conditions within a single season and thus provide valuable insights into how agrivoltaic systems influence cranberry growth and fruit quality. These initial findings establish a critical foundation by identifying the physiological and biochemical pathways most affected by shading.
Given these limitations, multiyear studies (at least 2–3 seasons) are essential to assess long-term trends, plant acclimatization, yield stability, and the full agronomic and economic viability of cranberry cultivation under AV systems. Future research should also explore the optimization of panel design (adjustable height, spacing, and tracking systems), integration of grid connectivity, and modeling of light dynamics to support dual-use systems that maximize both energy generation and cranberry production. Long-term studies integrating plant physiology, microclimatic shifts, metabolite accumulation and energy efficiency are necessary to develop sustainable, and profitable dual-use systems tailored to perennial fruit crops like cranberry.
Data availability statement
The raw data supporting the conclusions of this article will be made available by the authors, without undue reservation.
Author contributions
MP: Conceptualization, Investigation, Methodology, Writing – original draft, Writing – review & editing. HS: Writing – review & editing. PJ: Writing – review & editing. HN: Writing – review & editing. GM: Conceptualization, Funding acquisition, Supervision, Writing – review & editing.
Funding
The author(s) declare financial support was received for the research and/or publication of this article. This material is based upon work supported by the U.S. Department of Energy Office of Energy Efficiency and Renewable Energy (EERE) under the Solar Energy Technologies Office Award Number DE-EE0009374.
Conflict of interest
The authors declare that the research was conducted in the absence of any commercial or financial relationships that could be construed as a potential conflict of interest.
Generative AI statement
The author(s) declare that no Generative AI was used in the creation of this manuscript.
Any alternative text (alt text) provided alongside figures in this article has been generated by Frontiers with the support of artificial intelligence and reasonable efforts have been made to ensure accuracy, including review by the authors wherever possible. If you identify any issues, please contact us.
Publisher’s note
All claims expressed in this article are solely those of the authors and do not necessarily represent those of their affiliated organizations, or those of the publisher, the editors and the reviewers. Any product that may be evaluated in this article, or claim that may be made by its manufacturer, is not guaranteed or endorsed by the publisher.
References
Agostini A., Colauzzi M., and Amaducci S. (2021). Innovative agrivoltaic systems to produce sustainable energy: An economic and environmental assessment. Appl. Energy. 281, 116102. doi: 10.1016/j.apenergy.2020.116102
Ainsworth E. A. and Gillespie K. M. (2007). Estimation of Total Phenolic Content and Other Oxidation Substrates in Plant Tissues Using Folin–Ciocalteu Reagent. Nat. Protoc. 2, 875–877. doi: 10.1038/nprot.2007.102
Angmo P., Dolma T., Phuntsog N., Chaurasia O. P., and Stobdan T. (2022). Effect of shading and high temperature amplitude on yield and phenolic contents of greenhouse capsicum (Capsicum annuum L.). OARJBP. 4, 030–039. doi: 10.53022/oarjbp.2022.4.1.0053
Angmo P., Phuntsog N., Namgail D., Chaurasia O. P., and Stobdan T. (2021). Effect of shading and high temperature amplitude in greenhouse on growth, photosynthesis, yield and phenolic contents of tomato (Lycopersicum esculentum Mill.). Physiol. Mol. Biol. Plants. 27, 1539–1546. doi: 10.1007/s12298-021-01032-z
Aras S., Keles H., and Bozkurt E. (2021). Shading treatments improved plant growth and physiological responses of sweet cherry plants subjected to salt stress. Alinteri J. Agric. Sci. 36, 66–70. doi: 10.47059/alinteri/v36i1/ajas21011
Barnes J. D., Balaguer L., Manrique E., Elvira S., and Davison A. W. (1992). A reappraisal of the use of DMSO for the extraction and determination of chlorophylls a and b in lichens and higher plants. Environ. Exp. Bot. 32, 85–100. doi: 10.1016/0098-8472(92)90034-Y
Barron-Gafford G. A., Pavao-Zuckerman M. A., Minor R. L., Sutter L. F., Barnett-Moreno I., Blackett D. T., et al. (2019). Agrivoltaics provide mutual benefits across the food–energy–water nexus in drylands. Nat. Sustain. 2, 848–855. doi: 10.1038/S41893-019-0364-5
Barrs H. D. and Weatherley P. E. (1962). A re-examination of the relative turgidity technique for estimating water deficits in leaves. Aust. J. Biol. Sci. 15, 413–428. doi: 10.1071/BI9620413
Bates L. S., Waldren R. P. A., and Teare I. D. (1973). Rapid determination of free proline for water-stress studies. Plant Soil. 39, 205–207. doi: 10.1007/BF00018060
Benzie I. F. and Strain J. J. (1996). The ferric reducing ability of plasma (FRAP) as a measure of “antioxidant power”: the FRAP assay. Anal. Biochem. 239, 70–76. doi: 10.1006/abio.1996.0292
Bouyahya A., Abrini J., El-Baabou A., Bakri Y., and Dakka N. (2016). Determination of phenol content and antibacterial activity of five medicinal plants ethanolic extracts from North-West of Morocco. J. Plant Pathol. Microbiol. 7, 2. doi: 10.4172/2157-7471.1000342
Brin M. (1966). “[89] Transketolase: Clinical aspects,” in Methods in enzymology, vol. 9. (New York, NY, USA: Academic Press), 506–514. doi: 10.1016/0076-6879(66)09101-8
Cen Y. P. and Bornman J. F. (1990). The response of bean plants to UV-B radiation under different irradiances of background visible light. J. Exp. Bot. 41, 1489–1495. doi: 10.1093/jxb/41.11.1489
Chae S. H., Kim H. J., Moon H. W., Kim Y. H., and Ku K. M. (2022). Agrivoltaic systems enhance farmers’ profits through broccoli visual quality and electricity production without dramatic changes in yield, antioxidant capacity, and glucosinolates. Agronomy 12, 1415. doi: 10.3390/agronomy12061415
Chatattikun M. and Choabchalard A. (2013). Phytochemical screening and free radical scavenging activities of orange baby carrot and carrot (Daucus carota Linn) root crude extracts. J. Chem. Pharm. Res. 5, 97–102.
Cordoba-Novoa H. A., Pérez-Trujillo M. M., Cruz Rincón B. E., Flórez-Velasco N., Magnitskiy S., and Moreno Fonseca L. P. (2022). Shading reduces water deficits in strawberry (Fragaria X Ananassa) plants during vegetative growth. Int. J. Fruit Sci. 22, 725–740. doi: 10.1080/15538362.2022.2114056
Cruz-Ricardez D. D. L., Lagunes-Espinoza L. D. C., Ortiz-García C. F., Hernández-Nataren E., Soto-Hernández R. M., and Acosta-Pech R. G. (2023). Phenology, yield, and phytochemicals of Capsicum spp. in response to shading. Bot. Sci. 101, 865–882. doi: 10.17129/botsci.3234
Djordjevic B., Šavikin K., Djurovic D., Veberic R., Mikulič Petkovšek M., Zdunić G., et al. (2015). Biological and nutritional properties of blackcurrant berries (Ribes nigrum L.) under conditions of shading nets. J. Sci. Food Agric. 95, 2416–2423. doi: 10.1002/jsfa.6962
Dong T., Li J., Zhang Y., Korpelainen H., Niinemets Ü., and Li C. (2015). Partial shading of lateral branches affects growth, and foliage nitrogen-and water-use efficiencies in the conifer Cunninghamia lanceolata growing in a warm monsoon climate. Tree Physiol. 35, 632–643. doi: 10.1093/treephys/tpv036
Eastwood B. (1856). The Cranberry and its Culture: A Complete Manual for the Cultivation of the Cranberry (New York, NY, USA: Orange Judd and Company), 1–150. doi: 10.5962/bhl.title.40596
Elamri Y., Cheviron B., Lopez J. M., Dejean C., and Belaud G. (2018). Water budget and crop modelling for agrivoltaic systems: Application to irrigated lettuces. Agric. Water Manage. 208, 440–453. doi: 10.1016/j.agwat.2018.07.001
Faust J. E. and Logan J. (2018). Daily light integral: A research review and high-resolution maps of the United States. HortScience 53, 1250–1257. doi: 10.21273/HORTSCI13144-18
Ferrara G., Boselli M., Palasciano M., and Mazzeo A. (2023). Effect of shading determined by photovoltaic panels installed above the vines on the performance of cv. Corvina (Vitis vinifera L.). Sci. Hortic. 308, 111595. doi: 10.1016/j.scienta.2022.111595
Ghantous K., Sylvia M. M., and Gauvin D. (2024). Cranberry Chart Book 2024–2026: Management Guide for Massachusetts. Available online at: https://hdl.handle.net/20.500.14394/9464 (Accessed July 8, 2025).
Ghassemi-Golezani K., Bakhshy J., Zehtab-Salmasi S., and Moghaddam M. (2013). Changes in leaf characteristics and grain yield of soybean (Glycine max L.) in response to shading and water stress. Int. J. Biosci. 3, 71–79. doi: 10.12692/ijb/3.2.71-79
Giudice B. D., Stillinger C., Chapman E., Martin M., and Riihimaki B. (2021). “Residential Agrivoltaics: Energy Efficiency and Water Conservation in Urban Landscape,” in 2021 IEEE Green Technologies Conference (GreenTech), Denver, CO, USA. 237–244. doi: 10.1109/GreenTech48523.2021.00046
Gleason H. A. and Cronquist A. (1990). Manual of Vascular Plants of Northeastern United States and Adjacent Canada (Brooklyn, NY: NY Botanical Garden Pub), 910.
Gould K. S., Dudle D. A., and Neufeld H. S. (2010). Why some stems are red: cauline anthocyanins shield photosystem II against high light stress. J. Exp. Bot. 61, 2707–2717. doi: 10.1093/jxb/erq106
Hsiao C. L., Wang C. Y., and Hsu Y. T. (2023). Effect of simulated photovoltaic roofs on the yield and nitrate content of pak choi and rape. HortScience. 58, 1297–1305. doi: 10.21273/HORTSCI17240-23
Hussain S., Iqbal N., Rahman T., Liu T., Brestic M., Safdar M. E., et al. (2019). Shade effect on carbohydrates dynamics and stem strength of soybean genotypes. Environ. Exp. Bot. 162, 374–382. doi: 10.1016/j.envexpbot.2019.03.011
Jiang S., Tang D., Zhao L., Liang C., Cui N., Gong D., et al. (2022). Effects of different photovoltaic shading levels on kiwifruit growth, yield and water productivity under “agrivoltaic” system in Southwest China. Agric. Water Manage. 269, 107675. doi: 10.1016/j.agwat.2022.107675
Jin Z., Wang Y., Si C., Kumar S., Nie L., and Khan M. N. (2023). Effects of shading intensities on the yield and contents of anthocyanin and soluble sugar in tubers of purple sweet potato. Crop Sci. 63, 3013–3024. doi: 10.1002/csc2.21076
Juillion P., Lopez G., Fumey D., Lesniak V., Génard M., and Vercambre G. (2024). Combining field experiments under an agrivoltaic system and a kinetic fruit model to understand the impact of shading on apple carbohydrate metabolism and quality. Agrofor Syst. 98, 1–18. doi: 10.1007/s10457-024-00845-0
Juillion P., Lopez G., Verambre G., Génard M., Lesniak V., and Fumey D. (2023). “Specific leaf area and photosynthesis of apple trees under a dynamic agrivoltaic system,” in AgriVoltaics Conference Proceedings. 2. doi: 10.52825/agripv.v2i.999
Kaushal N., Awasthi R., Gupta K., Gaur P., Siddique K. H., and Nayyar H. (2013). Heat-stress-induced reproductive failures in chickpea (Cicer arietinum) are associated with impaired sucrose metabolism in leaves and anthers. Funct. Plant Biol. 40, 1334–1349. doi: 10.1071/FP13082
Kirimura M., Takeshita S., Matsuo M., Zushi K., Gejima Y., Honsho C., et al. (2022). Effects of agrivoltaics (photovoltaic power generation facilities on farmland) on growing condition and yield of komatsuna, mizuna, kabu, and spinach. Environ. Control Biol. 60, 117–127. doi: 10.2525/ecb.60.117
Lee S., Lee J. H., Jeong Y., Kim D., Seo B. H., Seo Y. J., et al. (2023). Agrivoltaic system designing for sustainability and smart farming: Agronomic aspects and design criteria with safety assessment. Appl. Energy. 341, 121130. doi: 10.1016/j.apenergy.2023.121130
Lin J., Zhang R., Hu Y., Song Y., Hänninen H., and Wu J. (2019). Interactive effects of drought and shading on Torreya grandis seedlings: physiological and growth responses. Trees 33, 951–961. doi: 10.1007/s00468-019-01831-8
Liu L., Gitz Iii D. C., and McClure J. W. (1995). Effects of UV-B on flavonoids, ferulic acid, growth and photosynthesis in barley primary leaves. Physiol. Plant 93, 725–733. doi: 10.1111/j.1399-3054.1995.tb05123.x
Loik M. E., Carter S. A., Alers G., Wade C. E., Shugar D., Corrado C., et al. (2017). Wavelength-selective solar photovoltaic systems: powering greenhouses for plant growth at the food-energy-water nexus. Earths Futur. 5, 1044–1053. doi: 10.1002/2016EF000531
Lutts S., Kinet J. M., and Bouharmont J. (1996). NaCl-induced senescence in leaves of rice (Oryza sativa L.) cultivars differing in salinity resistance. Ann. Bot. 78, 389–398. doi: 10.1006/anbo.1996.0134
Magarelli A., Mazzeo A., Ali S. A., and Ferrara G. (2025a). Shading enhanced microclimate variability, photomorphogenesis and yield components in a grapevine agrivoltaic system in semi-arid Mediterranean conditions in Puglia region, southeastern Italy. Sci. Hortic. 350, 114311. doi: 10.1016/j.scienta.2025.114311
Magarelli A., Mazzeo A., and Ferrara G. (2024). Fruit crop species with agrivoltaic systems: a critical review. Agronomy 14, 722. doi: 10.3390/agronomy14040722
Magarelli A., Mazzeo A., and Ferrara G. (2025b). Exploring the Grape Agrivoltaic System: Climate Modulation and Vine Benefits in the Puglia Region, Southeastern Italy. Horticulturae 11, 160. doi: 10.3390/horticulturae11020160
Marrou H., Dufour L., and Wery J. (2013a). How does a shelter of solar panels influence water flows in a soil-crop system? Eur. J. Agron. 50, 38–51. doi: 10.1016/j.eja.2013.05.004
Marrou H., Guilioni L., Dufour L., Dupraz C., and Wery J. (2013b). Microclimate under agrivoltaic systems: is crop growth rate affected in the partial shade of solar panels? Agric. For Meteorol. 177, 117–132. doi: 10.1016/j.agrformet.2013.04.012
Masabni J., Sun Y., Niu G., and Del Valle P. (2016). Shade effect on growth and productivity of tomato and chili pepper. HortTechnology 26, 344–350. doi: 10.21273/HORTTECH.26.3.344
McCune L. M. and Johns T. (2002). Antioxidant activity in medicinal plants associated with the symptoms of diabetes mellitus used by the Indigenous Peoples of the North American boreal forest. J. Ethnopharmacol. 82, 197–205. doi: 10.1016/S0378-8741(02)00180-0
McReedy R. M., Guggolz J., Silviera V., and Owens H. S. (1950). Determination of starch and amylose in vegetables. Anal. Chem. 22, 1156. doi: 10.1021/ac60045a016
Mehrtens F., Kranz H., Bednarek P., and Weisshaar B. (2005). The Arabidopsis transcription factor MYB12 is a flavonol-specific regulator of phenylpropanoid biosynthesis. Plant Physiol. 138, 1083–1096. doi: 10.1104/pp.104.058032
Mohammedi S., Dragonetti G., Admane N., and Fouial A. (2023). The impact of agrivoltaic systems on tomato crop: a case study in Southern Italy. Processes. 11, 3370. doi: 10.3390/pr11123370
Moon H. W. and Ku K. M. (2023). The effect of additional shading utilizing agri-photovoltaic structures on the visual qualities and metabolites of broccoli. Front. Plant Sci. 14. doi: 10.3389/fpls.2023.1111069
Mupambi G., Sandler H. A., and Jeranyama P. (2021). “Installation of an agrivoltaic system influences microclimatic conditions and leaf gas exchange in cranberry,” in IX International Symposium on Light in Horticulture, Vol. 1337. 117–124. doi: 10.17660/ActaHortic.2022.1337.16
Narjesi V., Fatahi Moghadam J., and Ghasemi-Soloklui A. A. (2023). Effects of photo-selective shade net color and shading percentage on reducing sunburn and increasing the quantity and quality of pomegranate fruit. Int. J. Hortic. Sci. Technol. 10, 25–38. doi: 10.22059/ijhst.2022.343648.567
Olsson L. C., Veit M., Weissenböck G., and Bornman J. F. (1998). Differential flavonoid response to enhanced UV-B radiation in Brassica napus. Phytochemistry. 49, 1021–1028. doi: 10.1016/S0031-9422(98)00062-4
Petrakis T., Ioannou P., Kitsiou F., Kavga A., Grammatikopoulos G., and Karamanos N. (2024). Growth and physiological characteristics of strawberry plants cultivated under greenhouse-integrated semi-transparent photovoltaics. Plants. 13, 768. doi: 10.3390/plants13060768
Poorter H., Niinemets Ü., Ntagkas N., Siebenkäs A., Mäenpää M., Matsubara S., et al. (2019). A meta-analysis of plant responses to light intensity for 70 traits ranging from molecules to whole plant performance. New Phytol. 223, 1073–1105. doi: 10.1111/NPH.15754
Ramos-Fuentes I. A., Elamri Y., Cheviron B., Dejean C., Belaud G., and Fumey D. (2023). Effects of shade and deficit irrigation on maize growth and development in fixed and dynamic agrivoltaic systems. Agric. Water Manage. 280, 108187. doi: 10.1016/j.agwat.2023.108187
Ravi S., Lobell D. B., and Field C. B. (2014). Tradeoffs and synergies between biofuel production and large solar infrastructure in deserts. Environ. Sci. Technol. 48, 3021–3030. doi: 10.1021/es404950n
Reher T., Willockx B., Schenk A., Bisschop J., Huyghe Y., Nicolaï B. M., et al. (2025). Agrivoltaic cultivation of pears under semi-transparent panels reduces yield consistently and maintains fruit quality in Belgium. Agron. Sustain Dev. 45, 25. doi: 10.1007/s13593-025-01019-0
Roper T. (2006). “The physiology of cranberry yield,” in Wisconsin Cranberry Crop Management Newsletter (University of Wisconsin–Madison, Department of Horticulture), 1–21. Available online at: www.hort.wisc.edu/cran (Accessed August 8, 2025).
Roper T. R., Klueh J., and Hagidimitriou M. (1995). Shading timing and intensity influences fruit set and yield in cranberry. HortScience 30, 525–527. doi: 10.21273/HORTSCI.30.3.525
Sandip P., Shreewardhan R., Sandeephan M., Abhay C., and Debjani D. (2014). Phytochemical evaluation and free radical scavenging potential of Hugonia Mystax (L) Leaf Extract. Bionano Frontier. 7, 20.
Scarano A., Semeraro T., Calisi A., Aretano R., Rotolo C., Lenucci M. S., et al. (2024). Effects of the agrivoltaic system on crop production: the case of tomato (Solanum lycopersicum L.). Appl. Sci. 14, 3095. doi: 10.3390/app14073095
Schweiger A. H. and Pataczek L. (2023). How to reconcile renewable energy and agricultural production in a drying world. Plants People Planet. 5, 650–661. doi: 10.1002/ppp3.10371
Semeraro T., Scarano A., Curci L. M., Leggieri A., Lenucci M., Basset A., et al. (2024). Shading effects in agrivoltaic systems can make the difference in boosting food security in climate change. Appl. Energy. 358, 122565. doi: 10.1016/j.apenergy.2023.122565
Semida W. M., Ammar M. S., and El-Sawah N. A. (2017). Effects of shade level and microenvironment on vegetative growth, physiological and biochemical characteristics of transplanted cucumber (Cucumis sativus). Arch. Agric. Environ. Sci. 2, 361–368. doi: 10.26832/24566632.2017.020421
Shinano T., Lei T. T., Kawamukai T., Inoue M. T., Koike T., and Tadano T. (1996). Dimethylsulfoxide method for the extraction of chlorophylls a and b from the leaves of wheat, field bean, dwarf bamboo, and oak. Photosynthetica. 32, 409–415.
Sumner J. B. (1925). A more specific reagent for the determination of sugar in urine. J. Biol. Chem. 65, 393–395. doi: 10.1016/S0021-9258(18)84848-7
Susanti E. D., Chozin M. A., Ritonga A. W., and Sulistyowati D. (2023). Identification of morpho-physiological and yield traits of sweet corn hybrids at various shade levels. Caraka Tani J. Sustain Agric. 38, 327–338. doi: 10.20961/carakatani.v38i2.62128
Swain T. and Hillis W. E. (1959). The phenolic constituents of Prunus domestica. I. The quantitative analysis of phenolic constituents. J. Sci. Food Agric. 10, 63–68. doi: 10.1002/jsfa.2740100110
Taghavi T., Patel H., Akande O. E., and Galam D. C. A. (2022). Total anthocyanin content of strawberry and the profile changes by extraction methods and sample processing. Foods 11, 1072. doi: 10.3390/foods11081072
Thaipong K., Boonprakob U., Crosby K., Cisneros-Zevallos L., and Byrne D. H. (2006). Comparison of ABTS, DPPH, FRAP, and ORAC assays for estimating antioxidant activity from guava fruit extracts. J. Food Compos. Anal. 19, 669–675. doi: 10.1016/j.jfca.2006.01.003
Trevelyan W. E. and Harrison J. (1956). Studies on yeast metabolism. 5. The trehalose content of baker's yeast during anaerobic fermentation. Biochem. J. 62, 177. doi: 10.1042/bj0620177b
Vanden Heuvel J. E. and Autio W. R. (2008). Early-season air temperature affects phenolic production in ‘Early Black’cranberry fruit. HortScience 43, 1737–1741. doi: 10.21273/HORTSCI.43.6.1737
Vvedenskaya I. O. and Vorsa N. (2004). Flavonoid composition over fruit development and maturation in American cranberry, Vaccinium macrocarpon Ait. Plant Sci. 167, 1043–1054. doi: 10.1016/j.plantsci.2004.06.001
Wang Y., Ren S., Li X., Luo X., and Deng Q. (2022). Shading inhibits sugar accumulation in leaf and fruit of jujube (Ziziphus jujuba Mill.). Horticulturae 8, 592. doi: 10.3390/horticulturae8070592
Weselek A., Bauerle A., Hartung J., Zikeli S., Lewandowski I., and Högy P. (2021). Agrivoltaic system impacts on microclimate and yield of different crops within an organic crop rotation in a temperate climate. Agron. Sustain Dev. 41, 59. doi: 10.1007/s13593-021-00714-y/Published
Weselek A., Ehmann A., Zikeli S., Lewandowski I., Schindele S., and Högy P. (2019). Agrophotovoltaic systems: applications, challenges, and opportunities. A Rev Agron. Sustain Dev. 39, 35. doi: 10.1007/s13593-019-0581-3
Wolske E., Chatham L., Juvik J., and Branham B. (2021). Berry quality and anthocyanin content of ‘Consort’ black currants grown under artificial shade. Plants. 10, 766. doi: 10.3390/plants10040766
Xie A., Lv M., Zhang D., Shi Y., Yang L., Yang X., et al. (2023). Effects of slight shading in summer on the leaf senescence and endogenous hormone and polyamine contents in herbaceous peony. Sci. Rep. 13, 18714. doi: 10.1038/s41598-023-46192-y
Yajima D., Toyoda T., Kirimura M., Araki K., Ota Y., and Nishioka K. (2023). Agrivoltaic system: Estimation of photosynthetic photon flux density under solar panels based on solar irradiation data using all-climate solar spectrum model. Clean Eng. Technol. 12, 100594. doi: 10.1016/j.clet.2022.100594
Keywords: sustainable agriculture, photosynthesis, metabolites, antioxidants, phenolics, flavonoids, proline content, trehalose
Citation: Priya M, Sandler HA, Jeranyama P, Nayyar H and Mupambi G (2025) Impact of shading following installation of agrivoltaic systems on eco-physiological and biochemical attributes of “Howes” cranberry in Massachusetts. Front. Hortic. 4:1695943. doi: 10.3389/fhort.2025.1695943
Received: 30 August 2025; Accepted: 10 November 2025; Revised: 07 November 2025;
Published: 25 November 2025.
Edited by:
Giuseppe Ferrara, University of Bari Aldo Moro, ItalyReviewed by:
Cristian Silvestri, University of Tuscia, ItalyYeong Yuh Lee, Agency for Science, Technology and Research (ASTAR), Singapore
Copyright © 2025 Priya, Sandler, Jeranyama, Nayyar and Mupambi. This is an open-access article distributed under the terms of the Creative Commons Attribution License (CC BY). The use, distribution or reproduction in other forums is permitted, provided the original author(s) and the copyright owner(s) are credited and that the original publication in this journal is cited, in accordance with accepted academic practice. No use, distribution or reproduction is permitted which does not comply with these terms.
*Correspondence: Manu Priya, bXByaXlhQHVtYXNzLmVkdQ==; Giverson Mupambi, Z211cGFtYmlAdW1hc3MuZWR1