 Murray A. Rudd
- Environment Department, University of York, York, UK
Diverse natural and social science research is needed to support policies to recover and sustain healthy oceans. While a wide variety of expert-led prioritization initiatives have identified research themes and priorities at national and regional scale, over the past several years there has also been a surge in the number of scanning exercises that have identified important environmental research questions and issues “from the bottom-up.” From those questions, winnowed from thousands of contributions by scientists and policy-makers around the world who participated in terrestrial, aquatic and domain-specific horizon scanning and big question exercises, I identified 657 research questions potentially important for informing decisions regarding ocean governance and sustainability. These were distilled to a short list of 67 distinctive research questions that, in an internet survey, were ranked by 2179 scientists from 94 countries. Five of the top 10 research priorities were shared by respondents globally. Despite significant differences between physical and ecological scientists' priorities regarding specific research questions, they shared seven common priorities among their top 10. Social scientists' priorities were, however, much different, highlighting their research focus on managerial solutions to ocean challenges and questions regarding the role of human behavior and values in attaining ocean sustainability. The results from this survey provide a comprehensive and timely assessment of current ocean research priorities among research-active scientists but highlight potential challenges in stimulating crossdisciplinary research. As ocean and coastal research necessarily becomes more transdisciplinary to address complex ocean challenges, it will be critical for scientists and research funders to understand how scientists from different disciplines and regions might collaborate and strengthen the overall evidence base for ocean governance.
Introduction
Oceans provide critical, multi-dimensional support for life on earth (Costello et al., 2010; Halpern et al., 2012) and, given their role in Earth sustainability (Rockström et al., 2009; Griggs et al., 2013), will play a central role in society's shift toward a more sustainable future. Oceans, however, face serious threats on multiple fronts due to over-exploitation of marine life (Jackson et al., 2001; Lewison et al., 2014), changes in upland land use, hydrological cycles and pollution (Derraik, 2002; Small and Nicholls, 2003; Crossland et al., 2005; Camargo and Alonso, 2006; Lotze et al., 2006; Dahms, 2014), climate change and its associated effects on sea level rise, ocean temperature redistribution and acidification (Hoegh-Guldberg, 1999; Caldeira and Wickett, 2003; Church and White, 2006; Heip et al., 2011; Doney et al., 2012; Balmaseda et al., 2013; Kroeze et al., 2013; Achterberg, 2014; Hollowed and Sundby, 2014), and other emerging challenges (Keeling et al., 2010; Cole et al., 2011; Ramirez-Llodra et al., 2011; Gramling, 2014). Further, ocean governance has special challenges associated with political and legal arrangements within and beyond areas of national jurisdiction (Berkes et al., 2006; Warner, 2014), monitoring marine environmental and ecological conditions (Katsanevakis et al., 2012), limited knowledge regarding the links between ocean environmental conditions and ecological structure, function and services (Balvanera et al., 2006; Heip et al., 2009; Armstrong et al., 2012; Liquete et al., 2013), and understanding how various governance interventions affect goods and services that oceans provide humans (Rudd, 2004; Schlüter et al., 2013). These issues may strongly impact food security and livelihood viability for hundreds of millions of people who depend on ocean resources (Allison et al., 2009; Garcia and Rosenberg, 2010; Johnson et al., 2013).
There is a crucial need for targeted natural and social science research that builds our understanding of earth processes, helps identify possible solutions to critical challenges, and provides the knowledge needed to catalyze transformational changes in human behavior (Hackmann and St. Clair, 2012; Pahl-Wostl et al., 2013). A variety of efforts to identify ocean research priorities have been undertaken in the past at national and regional levels, often through agency-led approaches that draw on eminent scientists for advice (e.g., International Ocean Discovery Program, 2011; European Marine Board, 2013; Expert Panel on Canadian Ocean Science, 2013; National Oceanic and Atmospheric Administration, 2013). In recent years, an increasing number of bottom-up, participatory horizon scanning and “big question” exercises have also taken place. Those efforts, while usually not ocean-specific (but see Fissel et al., 2012; Feary et al., 2013; Rees et al., 2013; Parsons et al., 2014), represent the collective insights of thousands of scientists and have identified many important ocean- and coastal-oriented research questions (Sutherland et al., 2006, 2009, 2013b; Pretty et al., 2010; Fleishman et al., 2011; Rudd et al., 2011; Boxall et al., 2012; Ingram et al., 2013). With ongoing international efforts to set ocean research direction for the coming decades (e.g., the USA Decadal Survey of Ocean Sciences 2015 [nas-sites.org/dsos2015/] and Future Earth [www.futureearth.info/]) it is timely to take stock of the opinions of scientists and policy-makers who participated in the numerous bottom-up horizon scanning and big question exercises. This could help ensure that the full spectrum of ocean research needs have been considered during the formulation of the high-level directives that will shape global ocean research funding over the next decade or more.
Understanding differences in research priorities among scientists from different disciplines (Rudd and Lawton, 2013) and regions (Cooke et al., 2010) is particularly important given the need to provide balanced science advice to policy-makers and to bring crossdisciplinary research insights specifically to bear on cross-cutting ocean challenges. The need for crossdisciplinary collaboration between scientists from different disciplines and between scientists, policy-makers, and members of society is widely recognized in earth systems sustainability research (Hackmann and St. Clair, 2012; Mooney et al., 2013; Pahl-Wostl et al., 2013). The growing move toward transdisciplinary research (Thompson Klein, 2004; Spruijt et al., 2014) is well-recognized in the environmental field (Pohl, 2005; Hirsch Hadorn et al., 2006; Jolibert and Wesselink, 2012; Sutherland et al., 2012b; Bremer and Glavovic, 2013; Lawton and Rudd, 2013; Pennington et al., 2013) and will likely become increasingly important as scientists are called on to provide various types of science advice (Singh et al., 2014; Spruijt et al., 2014) that help address society's most pressing and complex problems (Lubchenco, 1998; Defries et al., 2012).
In this synthesis, I identified 657 important research questions from prior big question and horizon scanning research identification exercises (henceforth simply scanning exercises—see Sutherland et al. (2011b), for a methodological summary) and distilled those to a set of 67 core questions. Those questions, drawn from across the physical, ecological and social sciences, relate to challenges ranging from basic environmental science needs to society's relationship with a changing ocean. I then used those questions in an internet survey of international scientists who have recently worked on ocean-related issues, assessed their research priorities, and tested how their disciplinary background and other potentially salient demographic and professional characteristics were associated with those priorities. This paper emphasizes the methodological approach used for the study and its key findings; in-depth analysis of particular research priorities, scientists views on their role at the science-policy interface, and opinions about potential solutions to pressing ocean challenges are left to future analyses.
Methods
Research Question Identification
I examined 28 different reports and articles that over the last 8 years identified research questions or issues with potential salience to ocean sustainability. Those included: 13 general (i.e., non-marine) big question exercises (Sutherland et al., 2006, 2009, 2012b, 2013b; Morton et al., 2009; Brown et al., 2010; Pretty et al., 2010; Fleishman et al., 2011; Kark et al., 2011; Rudd et al., 2011; Boxall et al., 2012; Braunisch et al., 2012; Ingram et al., 2013) and five specific to coastal and marine issues (Fissel et al., 2012; Feary et al., 2013; Rees et al., 2013; Parsons et al., 2014; Vugteveen et al., 2014); six annual horizon scanning exercises (Sutherland et al., 2008, 2010, 2011a, 2012a, 2013a, 2014); and four ocean-specific reports that identified important research questions and that were based on expert opinions (Heip et al., 2011; Heip and McDonough, 2012; Snelgrove et al., 2012; Borja et al., 2013).
In aggregate, the research scanning exercises solicited at least 10,409 candidate questions from over 5700 contributors globally (see Data Sheet 2 in the Supplementary Material for a summary of all 28 exercises). Candidate questions were accepted from individuals and organizations in open and inclusive solicitation processes (Sutherland et al., 2011b), with much effort expended by research teams to draw candidate questions from as wide a range of sources as possible. Of the 10,409 candidate questions, there were a total of 1961 marine-oriented questions submitted by at least 461 contributors. Typically in these exercises the candidate questions were winnowed initially by the core research team for each exercise, with a focus on reducing question redundancy and eliminating questions outside the scope of the exercise. A reduced pool of candidate questions would then undergo further editing, combining or revision at an in-person workshop where experts (typically between 15 and 50 individuals) winnowed candidate questions to a final list of priority research questions (typically between 40 and 100) or horizon scanning issue (between 15 and 25). In total, the 28 exercises I examined resulted in final selection of 1020 questions and issues from non-marine scanning exercises, and 202 from the oceans-focused scanning exercises. These were complemented by another 125 questions and issues identified in the four expert opinion-based reports.
The non-marine scanning exercises were authored by 605 individuals, of whom 46 appeared to have primary expertise in coastal and marine research. Of those 46, 30 had natural science backgrounds, 13 were from social sciences, and three from other disciplines; 28 worked in academia and 18 had other professional affiliations. Of 330 research questions or issues identified in these articles that were potentially relevant for oceans, 50 were retained and incorporated into the final questions used in this survey.
In the five marine-oriented scanning exercises, 107 co-authors contributed to the final publications. Of those, 98 appeared to be coastal and marine research specialists; 80 were from the natural sciences, 10 from the social sciences, and 8 from other fields. A total of 83 were from academia and 15 had other affiliations; the average h-index of marine co-authors on these publications ranged from 7 to 26 (based on Google Scholar and calculated with Publish or Perish, www.harzing.com/pop.htm). Of 202 research questions or issues identified in those five articles, 20 were retained as final questions for this survey.
The expert opinion-based articles were co-authored by 42 scientists; 41 of those authors were from academia and were individuals whose primary expertise was in coastal and marine research in the natural sciences. The average h-index for authors in those reports ranged from 21 to 26. Of 125 research questions or issue identified in these articles, 13 were retained as final questions in this survey.
In summary, from 22 of 28 of these publications I identified 657 research questions or issues of potential relevance for this survey (research questions from 6 of the exercises were redundant or regional in nature). These were collated, coded qualitatively according to pre-defined and emergent themes, and distilled into 67 research questions (Table 1) that were relatively evenly distributed across major disciplines (i.e., the physical, ecological, and social sciences) and were used as the basis for this international survey of scientists working on coastal and ocean issues.
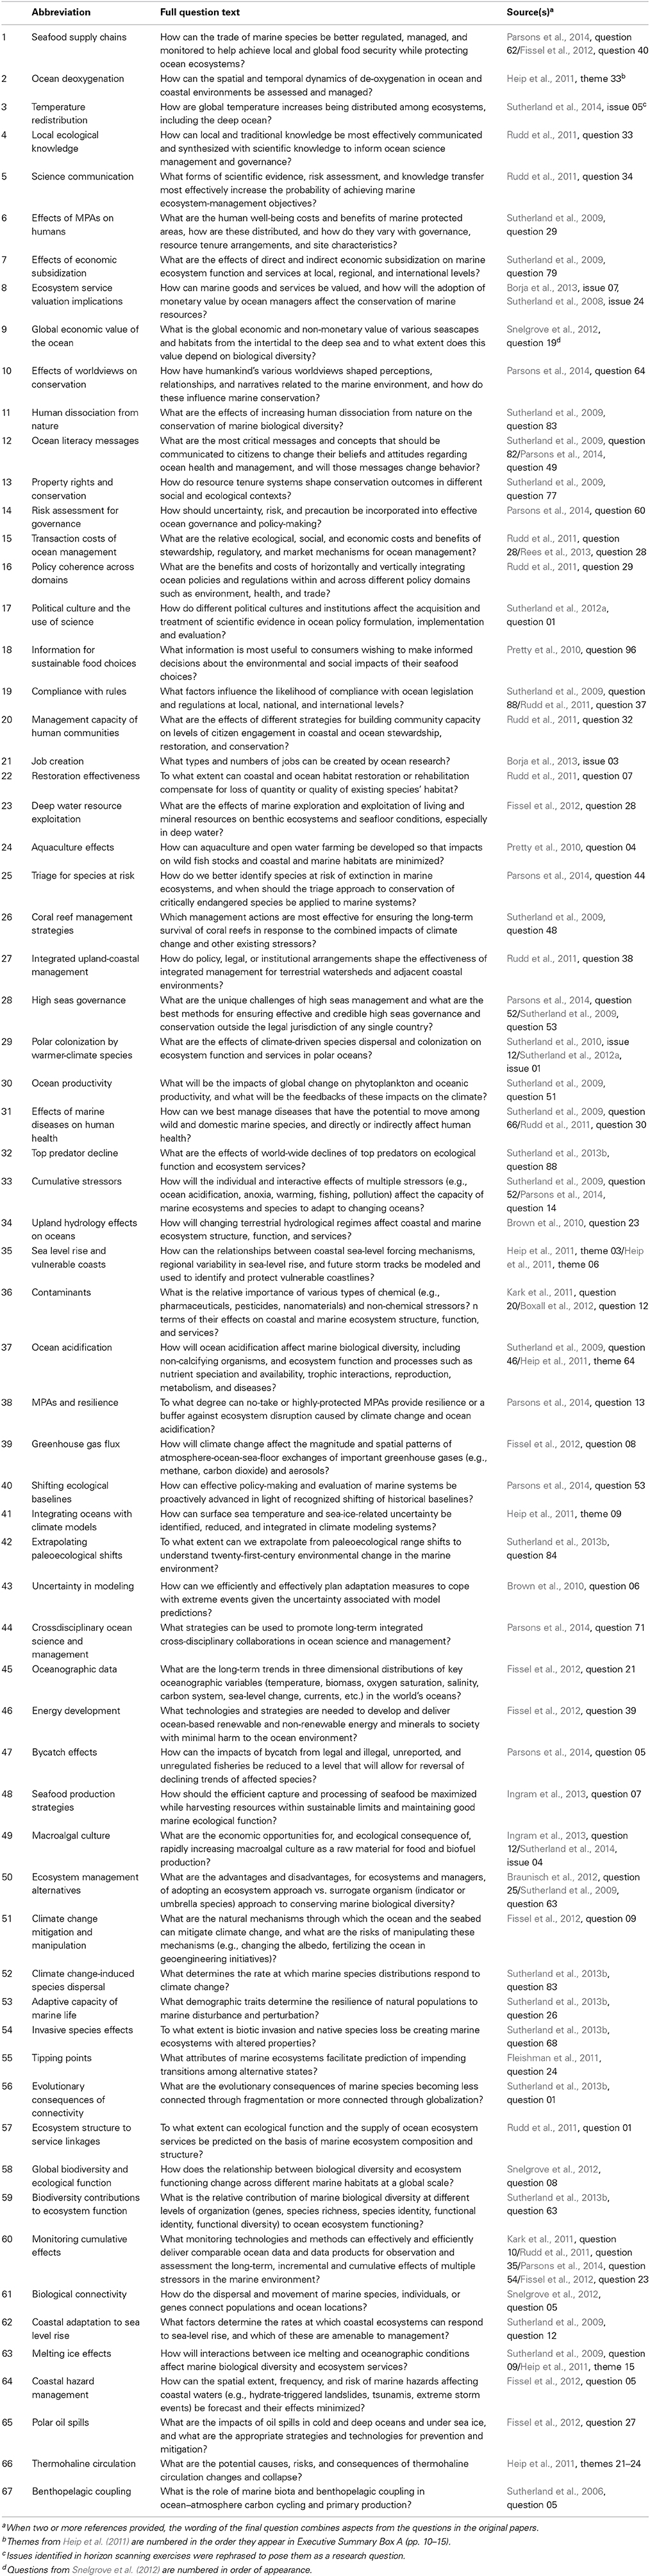
Table 1. Final list of [unranked] research questions synthesized from 22 research scanning exercises.
Survey Design
The objective of the internet survey was to collect information necessary to fully rank the 67 research questions for each individual scientist, thus allowing subsequent comparisons of respondents' priorities according to demographic or professional factors. Practically, the only way to rank this many items is with Best-Worst Scaling (BWS) (Finn and Louviere, 1992), an approach that has been used in other research prioritization ranking studies (Rudd and Lawton, 2013; Rudd and Fleishman, 2014; Rudd et al., 2014). In order to ensure that all respondents saw each of the 67 questions at least twice, 36 BWS ranking tasks were needed. Sawtooth Software's (2009) experimental design generator was used to create 300 survey versions to which respondents were randomly assigned. That combination of 300 survey versions was, in combination, the most efficient of 1000 randomly generated design combinations that were tested.
Respondents were asked in the sequence of 36 BWS ranking tasks to choose, in their opinion, the most and least important from among subsets of only 4 of the 67 research questions at a time. At the end of the 36 BWS ranking tasks, respondents were shown a list of the 10 questions that, based on their own answers to the BWS tasks, they ranked as most important and the 10 they ranked as least important. Each respondent was asked how well those ranking results from the BWS exercise corresponded to their actual priorities (excellent, good, fair, poor). Each respondent's three top-ranked research questions were used to further query individuals on the reasons they ranked those questions highly and what single advance could best help answer the question (for brevity, not reported here). Additional information was collected on demographic and professional characteristics of respondents. An experimental series of ratings regarding respondents' attitudes toward knowledge production and cooperation between scientists and policy-makers (Lawton and Rudd, 2014) was also collected but again, for brevity, is not reported here. The survey (Data Sheet 1 in the Supplementary Material) was approved in February 2014 by the Environment Department's Research Ethics Committee at University of York.
Sample
The sample frame for the survey was research-active scientists with expertise in coastal and ocean science relevant to the sustainable management of oceans. I used an ISI Web of Science search to construct a sample by identifying authors of articles from appropriate journals and for whom email contact information was available. The Web of Science search was restricted to journals with a 2012 impact factor of greater than 0.5 and targeted journals for which the primary focus was marine-oriented and potentially relevant to ocean sustainability. Only research articles published between 2011 and late-2013 were used.
In the initial screening, I found 17,127 articles (from 64 journals) with author contact information. I screened out irrelevant articles based on titles, but comprehensive abstract evaluation was not possible, so some engineers, naval architects, mathematicians and freshwater specialists were retained in the sample (they could self-screen in the survey itself). After the removal of duplicate emails, 16,402 unique individuals with email contact information remained. Invitations with one-click survey hyperlinks were emailed to potential respondents. Following standard survey protocol (Dillman et al., 2009), five contact points were used to distribute the internet-based survey; these included a pre-survey notice (without a survey link), first survey distribution and, for respondents who had not yet completed the survey at time milestones, a short reminder, second survey distribution, and final notice. The survey opened on 15 February 2014 and closed 19 March 2014.
Data Analysis
With Hierarchical Bayesian (HB) analysis (Sawtooth Software, 2009), ranking scores, measured as the likelihood of being chosen the most important among all 67 research questions, were calculated for all 67 questions for each individual that completed the survey. Essentially, the HB process borrows information about how an individual's research priorities differ from the sample mean to adjust the mix of individual preferences and sample average in the next model iteration. I used standard Sawtooth HB options, setting prior variance for each parameter to 2 (with 5 degrees of freedom) and ran 20,000 iterations for burn-in and a further 10,000 iterations for coefficient calculation.
The ranking scores represent the likelihood of a research question being chosen as most important and sum to 100. A question with mean ranking score of 2.0 can be interpreted as being twice as important to a survey respondent as an item with mean of 1.0. When 67 research questions are ranked randomly, the mean likelihood of any question being chosen most important is 1.493 (= 100/67).
Fitness scores (root likelihood * 1000) are a measure of a single respondent's ranking consistency across BWS ranking tasks (Sawtooth Software, 2009) and were calculated for each respondent who completed the survey. Based on a model using this study's experimental design and with n = 2100+ simulated respondents who answered all BWS ranking tasks randomly, a respondent's fitness score should be above 380 if, in this four-option 36-task BWS design, that person is to be classified as non-random responder with 95% confidence.
The final dataset for this analysis thus consisted of respondent-specific demographic and professional variables (age, articles published, career length, major discipline, level of education, gender, region of residence, sector of work, and, for government employees, whether they were scientists or non-scientists), survey-related variables (time to complete the survey, self-reported accordance of BWS ranking results with respondents' “true” priorities, and fitness score calculated based on respondents' consistency in answering BWS ranking tasks), and a vector of 67 ranking scores per respondent. Fitness score was also divided into deciles to permit testing of how relative fitness level was associated with specific levels of other covariates. No information gathered from partially completed survey responses was used in the analysis.
After the HB analysis, the 67 research questions were sorted by overall median rank order for the sample as a whole and differences in median ranking score for salient demographic, professional, and survey-specific variables were calculated. For each of the 67 research questions, I tested for differences in median ranking scores with a Kruskall–Wallis test (alpha level 0.01) and significant differences (alpha level 0.01) in median rank among factor levels with Tukey–Kramer post-hoc comparisons. Friedman tests were used to identify significant differences in median ranking scores for adjacent ranked research questions (alpha level 0.01). Differences in median fitness scores among disciplines and other factors were compared with Kruskall–Wallis tests (alpha level 0.01) and Tukey–Kramer post-hoc comparisons (alpha level 0.01). Pearson χ2 tests were used to test for differences in fitness among different levels of demographic and professional factors.
Results
Survey Response
After accounting for bounced emails, multiple email addresses for single authors, long-term leave and retirements, and respondent self-screening from the survey (i.e., respondents who lacked suitable experience), 14,309 surveys were distributed to scientists who were potentially members of the sample frame. A total of 2187 respondents (15.3%) completed the full survey; another 1425 (10.0%) partially completed the survey.
Survey completion time, from the time the survey was first accessed until the completed survey was submitted, ranged from 9 min to 30 days with a median completion time of 50.4 min. Only one factor, region of residence, exhibited significant differences among levels (Kruskall–Wallis H = 53.6, 6 d.f., p < 0.01): respondents from Africa and the Middle East (AME) took significantly longer (p < 0.01) to complete the survey than respondents from either Australia, New Zealand and South Pacific (ANZSP) or North America (NA).
Survey Respondents
Fitness scores were calculated for each survey respondent. Mean and median fitness for the sample was 521.3 and 522.5, respectively; the null hypothesis that fitness score was normally distributed was rejected (Shapiro–Wilk W = 1.000, p < 0.01). For the simulated survey (n = 2139 random responders), the mean ranking score was 1.493 and the hypothesis of a normal distribution could not be rejected at the 1% level (Shapiro–Wilk W = 0.97, p = 0.0864). Median fitness score for the simulated respondents was 321.4, with 95% of observations (i.e., 2.5 and 97.5% quantiles) lying between the range of 286.3 and 380.3. The medians of real (522.5) and simulated (321.4) samples were significantly different (Kruskal–Wallis H = 3185.1, 1 d.f., p < 0.01). Note that 55 respondents from the survey had fitness scores less than 380.3, the upper limit of the 95% confidence bound for random responders, so it is likely that some respondents taking this survey responded randomly during their BWS ranking tasks. Table 2 provides a summary of key demographic, professional, and survey-specific variables for respondents who completed the survey (n = 2187).
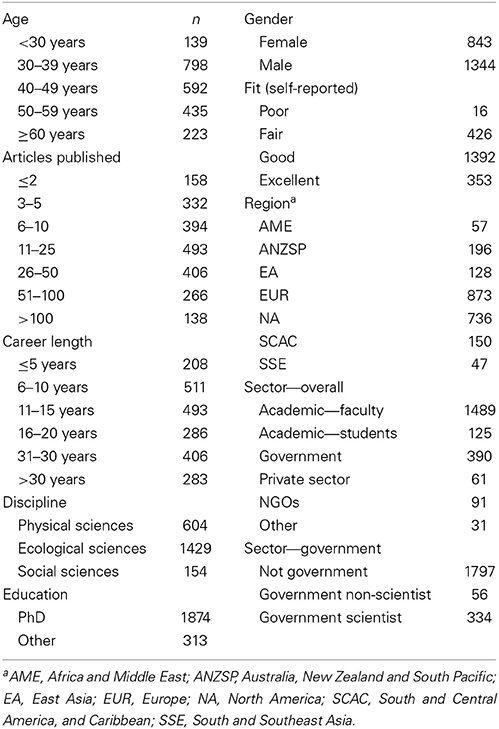
Table 2. Demographic characteristics of survey respondents (n = 2187).
Fitness Scores
Higher levels of median fitness score (i.e., higher levels of respondents' internal consistency in making BWS comparisons) were associated with higher levels of self-reported fit between the survey's objective ranking of an individual's priorities and their subjective priorities. Other significant factors related to experience and expertise (articles published, career length, and, potentially, being a government scientist) and region of residence (Table 3). The developed-developing world divide was notable, with respondents from the AME, EA, and SSE regions having consistently lower fitness scores than respondents from NA, ANZSP, Europe (EUR), and South and Central America and Caribbean (SCAC) (Figure 1) (the boxplot shows median fitness, a box from the 1st to 3rd quartiles, whiskers with end caps extending to the 2.5 and 97.5% quantiles, and a notch on box denoting the 95% confidence interval for the median).
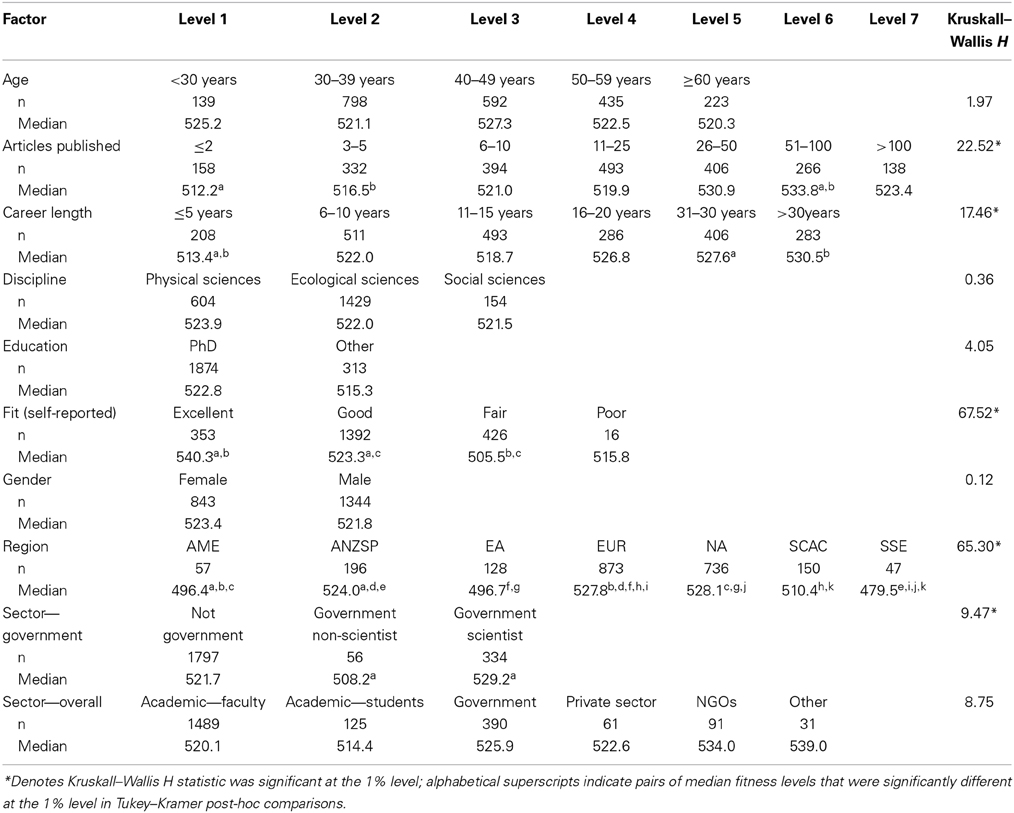
Table 3. Differences in median fitness score for respondents belonging to different demographic and professional categories.
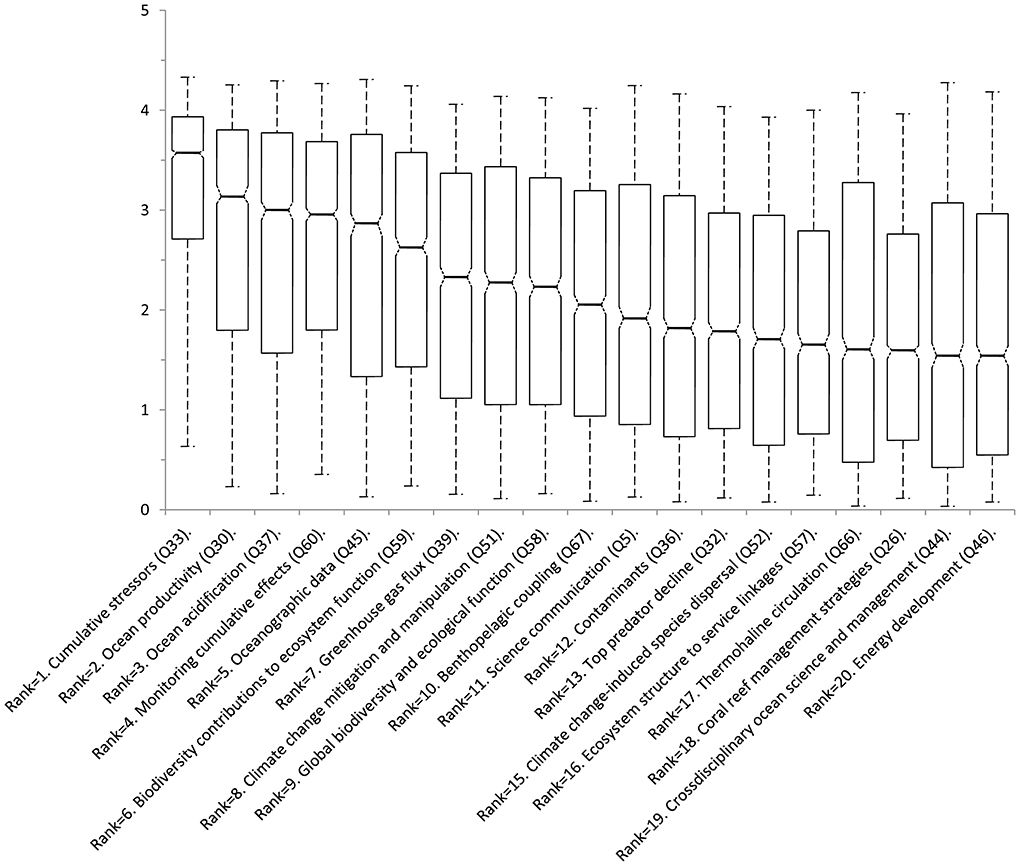
Figure 1. Box plot of median ranking score for the 20 research questions ranked, in aggregate, as highest priority.
Research Priorities
An exploratory latent class analysis suggested that three main factors influenced respondents' ranking of research questions: disciplinary background; region of residence; and survey fitness scores. The influence of those factors on overall priority rank was examined in more detail for individual research questions. For the top-ranked question (cumulative stressors, Q33), for example, discipline (Figure 2), region (Figure 3), and fitness level were all significantly associated with median ranking score (Table 4); increasing career length and female gender were also significantly associated with median ranking score. Similar findings for other potentially divisive questions (not reported here for brevity), suggest that maintaining a primary focus on respondents' disciplinary association, region of residence, and level of consistency in making BWS comparisons during the survey is appropriate.
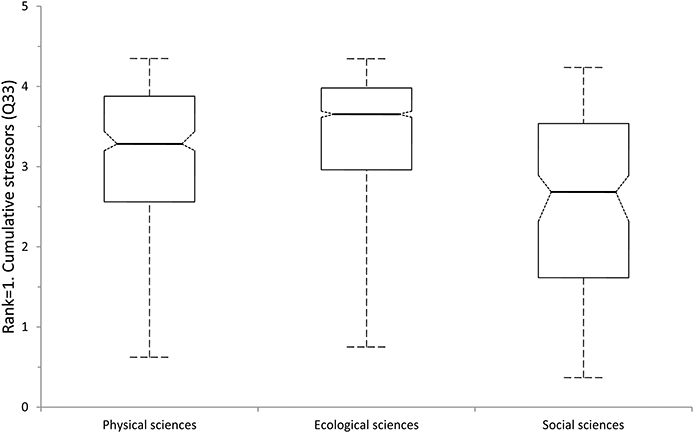
Figure 2. Box plot of median ranking score for top-ranked question (cumulative stressors) for each of three disciplinary categories.
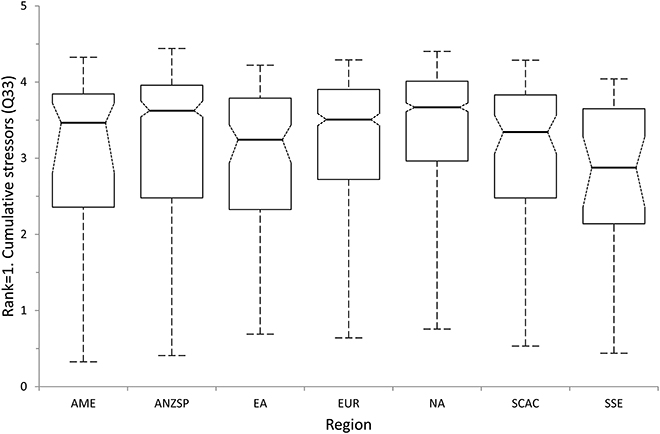
Figure 3. Box plot of median ranking score for top-ranked question (cumulative stressors) for each of seven regions.
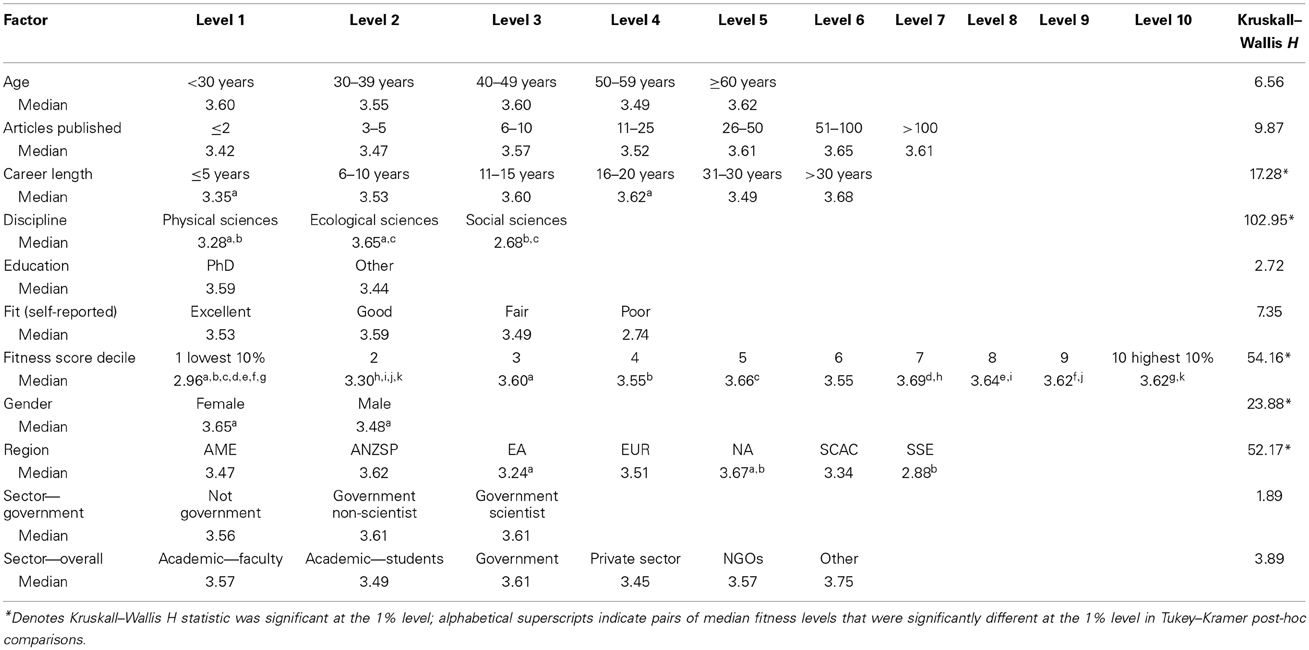
Table 4. Median ranking score for research questions in aggregate rank order and with differences in rank by disciplinary category.
Table 5 shows the full list of 67 research questions ordered by aggregate median ranking score for all 2187 survey respondents and broken down by respondents' major discipline. The median ranking scores for each pair of research questions adjacent in rank order (i.e., moving down column 1) were compared with Friedman tests. For example, the Friedman test statistic (S = 126.3) listed for the top-ranked cumulative stressor question indicates that the median ranking score for that question was significantly greater (p < 0.01) than the median for the second-ranked ocean productivity question. Ocean productivity, in turn, had a significantly higher median than ocean acidification (S = 10.15, p < 0.01). Other significant gaps in medians for adjacent questions occur between questions ranked 4 and 5, 6 and 7, 9 and 10 (Figure 4 shows median scores for the top 20 questions), 42 and 43, 46 and 47, 56 and 57, and, near the bottom of the rankings, between 63 and 64, and 66 and 67.
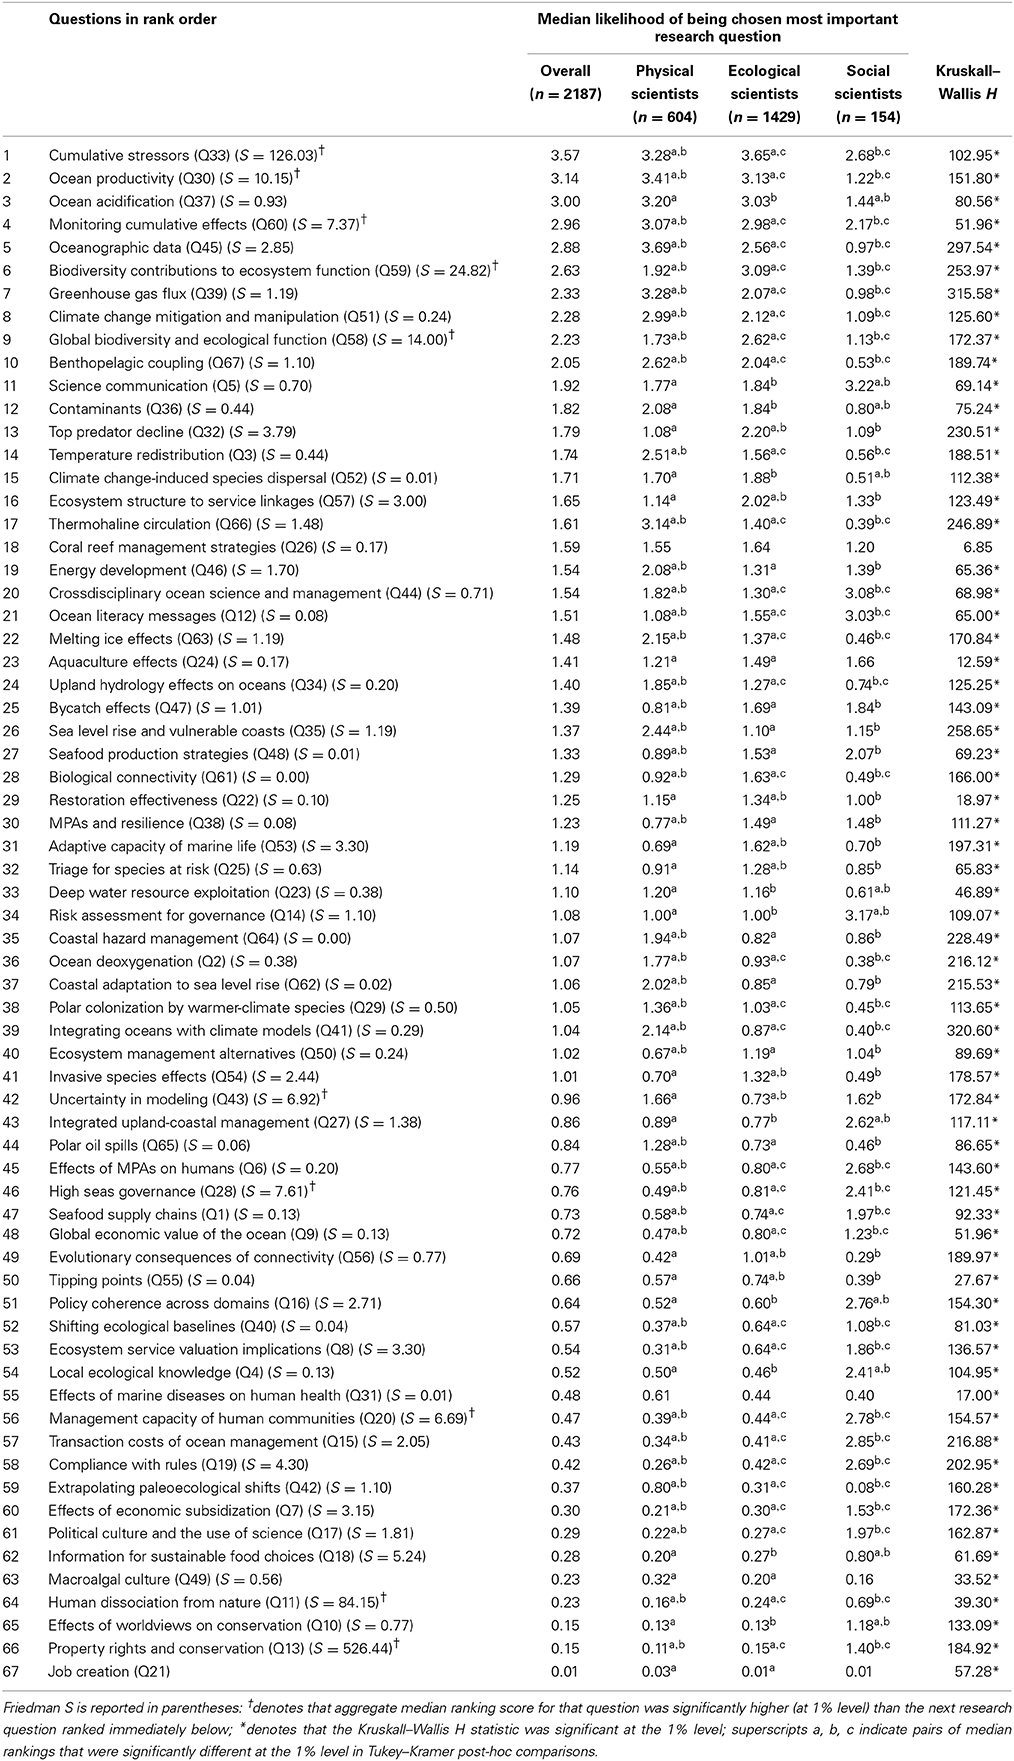
Table 5. Differences in median ranking score for the top-ranked question (cumulative stressors) by respondents belonging to different demographic and professional categories.
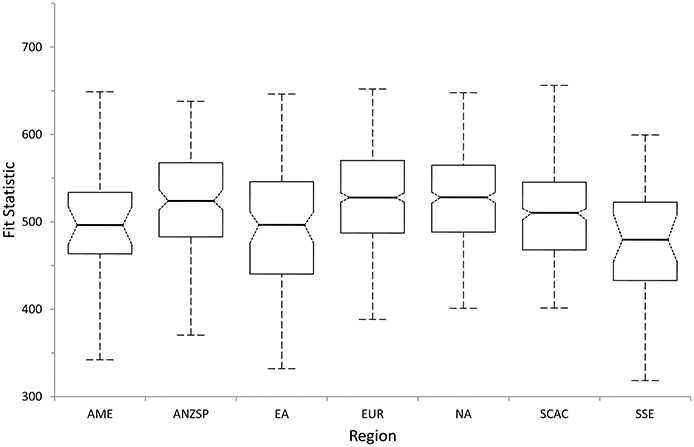
Figure 4. Box plot of median fitness score for respondents from each of seven regions.
Table 5 also shows results from the comparisons of median ranking across the three major disciplines. In the preliminary latent class analysis, I found that the research priorities of physical (n = 508) and applied scientists (n = 96), and ecological scientists (n = 1422) and respondents with “other” disciplinary affiliations (n = 7), were statistically indistinguishable, so I combined those groups and henceforth refer to them simply as physical (n = 604) and ecological scientists (n = 1429). Note that equality of median ranking scores for the three disciplines could not be rejected for only a single research question (coral reef management strategies, ranked 18). For the majority of research questions, Kruskall–Wallis statistics were highly significant and there were significant differences in median ranking scores among at least two of the disciplines (from Tukey–Kramer post-hoc comparisons).
The top 20 research questions for each major discipline are shown in Table 6. For physical and ecological scientists, seven of the top 10 research questions are shared between the disciplines; a higher proportion of more disciplinary-oriented questions appeared lower in rank, between 11 and 20. The research priorities for social scientist respondents are much different than for both groups of natural science respondents, with only one question (cumulative stressors) in the top 10 shared across all three groups.
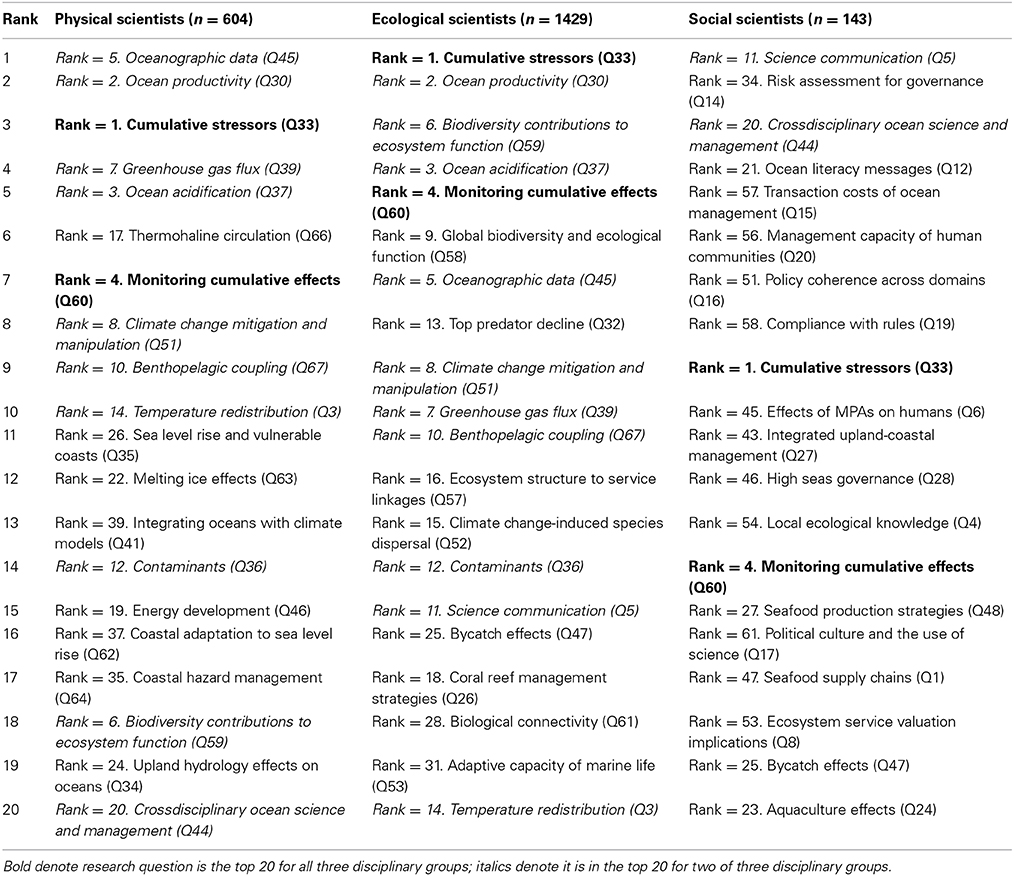
Table 6. Comparison of 20 top ranked questions by disciplinary category.
The differences in research priorities were much less pronounced when respondents were grouped according to their region of residence. Five of the top 10 research questions were shared among all seven regions (Table 7) and even the regions with low numbers of respondents (i.e., AME, n = 57; East Asia [EA], n = 71; and South and Southeast Asia [SSE], n = 19) had similar patterns of research priorities compared to the larger groups. This highlights the relative importance of disciplinary background relative to area of residence in shaping scientists' research priorities.
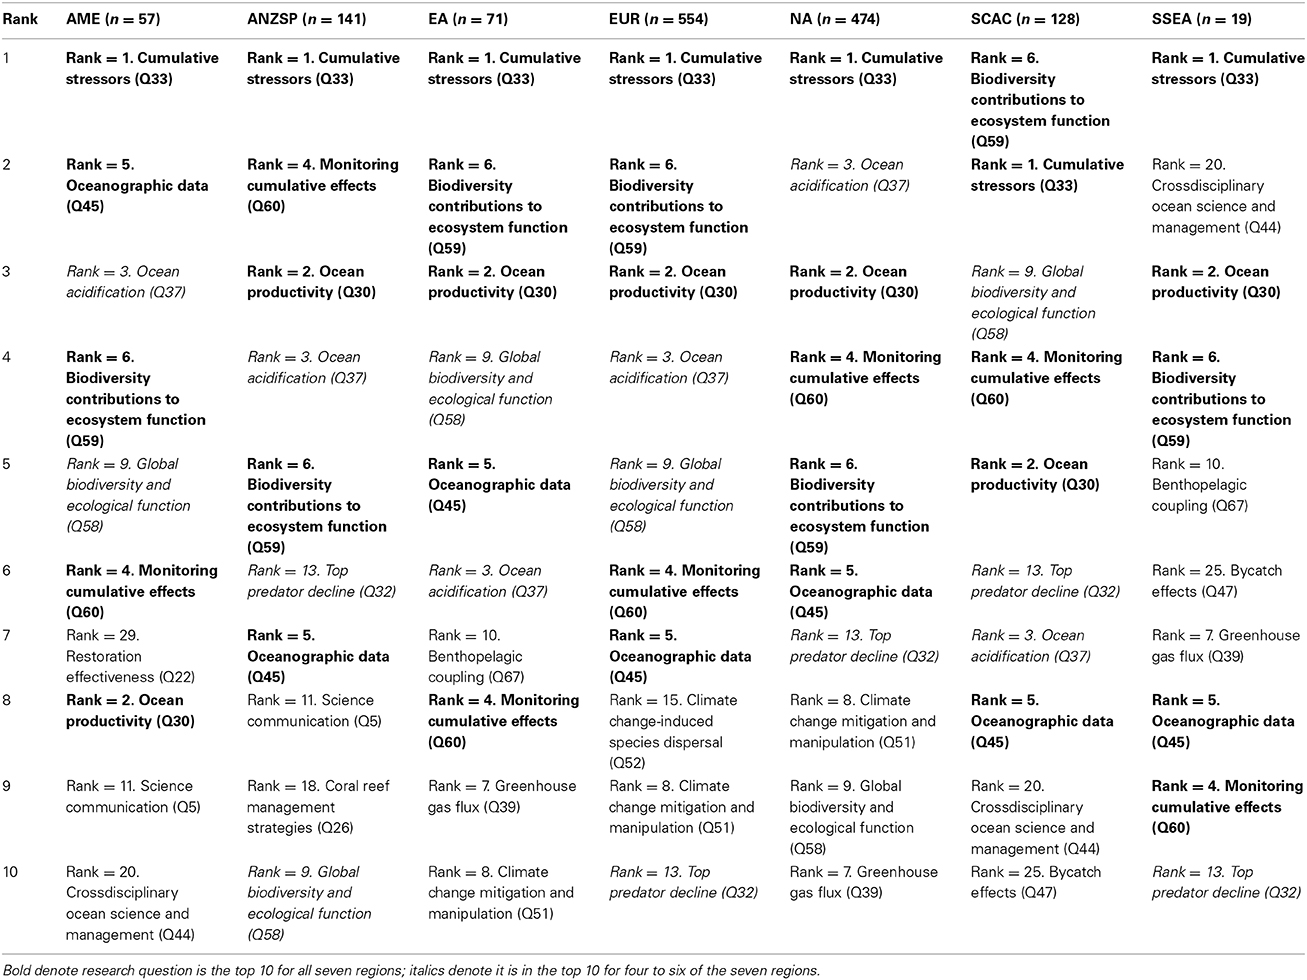
Table 7. Comparison of 10 top ranked questions by respondents' region of residence.
Region was closely associated with respondent fitness level. A contingency table shows Pearson chi-square test residuals of fitness deciles by region of residence (Table 8). The proportions of actual vs. expected respondents per cell is, in aggregate, significantly different (χ2 = 132.69, 54 d.f., p < 0.01), with disproportionately high levels (residual > 2) of respondents from AME, EA, SCAC, and SSE in the lowest decile of fitness. That is, respondents from developing regions had higher proportions of random respondents.
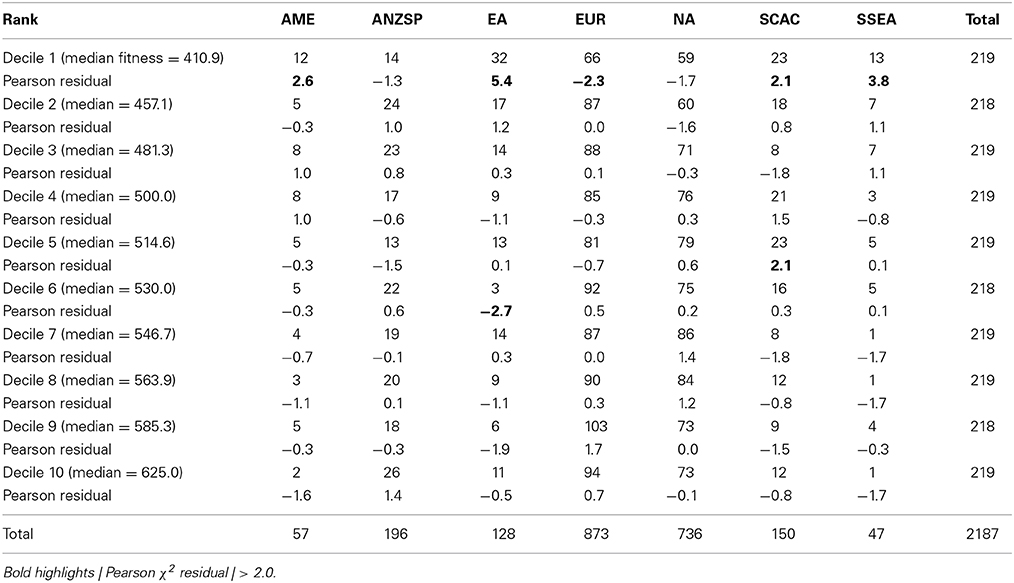
Table 8. Contingency table of residuals from Pearson χ2 tests comparing respondents' fitness level (decile) by region of residence.
Discussion
None of the 67 research questions distilled from the 28 publications I examined for this study are unimportant; the questions identified in the scanning exercises had been through an extensive, bottom-up process that involved widespread solicitation of research questions needed to inform environmental policy-making and systematic vetting of those submissions (Sutherland et al., 2011b). They were supplemented for this survey with important research questions identified by experts in ocean and coastal research, and published in other reports or articles. While the question “To what extent can we extrapolate from paleoecological range shifts to understand 21st-century environmental change in the marine environment?” was, for instance, ranked as 59th in overall priority by survey respondents, this question was deemed important enough to receive major focus of the International Ocean Discovery Program's (2011) science plan for 2013–2023. All 67 research questions are important precisely because of the level of vetting that they had already been through prior to being included in this survey. Clearly, however, some research questions rose to the top of the priorities list and were viewed by international scientists as topics worthy of great scrutiny and effort because of their potential importance for understanding and solving ocean sustainability challenges.
Survey Respondents
While 15.3% is a modest survey completion rate [e.g., in a 2011 coastal scientists' survey, Rudd and Lawton (2013) obtained a 35.2% response rate], completing 36 BWS tasks was arduous and contributed to the relatively high proportion of incomplete surveys. In addition, the sample likely included authors without appropriate ocean-related expertise who simply ignored survey invitations. Given the breadth of expertise represented by the respondents who completed the survey (i.e., respondents represented approximately 36,000 person-years of ocean research experience and accounted for 68,000 ocean-relevant publications), the sample provided a rich source of information about research priorities. It was not, however, possible to test for self-selection bias because no general characterization of the sample frame as a whole was possible. The over-representation of developed country scientists in prior scanning exercises has been noted (Cooke et al., 2010; Boxall et al., 2012), but their concerns focused on the composition of workshop participants who finalized the lists of important questions. In this survey, the sample was based on an ISI Web of Science search; as such, the sample was dominated by developed country researchers who are the source of the majority of published articles in the higher-impact journals from which I drew the sample. This reflects a broad trend, with great disparities in scientific publishing between scientists from developed and developing countries (King, 2004). While the developed country scientists were active and knowledgeable, there may be important research issues for which these rankings do not reflect the perspectives of scientists from developing countries.
There were certainly some random BWS responders in this survey but, based on fitness scores, it appears that most scientists who completed the survey took the ranking tasks seriously, were attentive, and answered questions with a relatively high level of consistency. Random responders were proportionally more likely to be from developing regions, with East Asian respondents being the relatively most likely to belong to the lowest fitness level. It may be that some of the respondents from developing regions were challenged interpreting technical English research questions from outside their own discipline.
Research Priorities
Results from this survey highlight the degree to which research priorities vary among scientists, particularly along disciplinary divides between respondents from the natural and social sciences. Among the physical and ecological scientists, it is important to highlight that, despite clear disciplinary tendencies, seven of the top 10 priority questions were, in fact, shared by the two groups: cumulative stressors (ranked 1 overall), ocean productivity (ranked 2), ocean acidification (ranked 3), monitoring cumulative effects (ranked 4), oceanographic data (ranked 5), greenhouse gas flux (ranked 7), and climate change mitigation and manipulation (ranked 8).
Only the cumulative stressors question, top-ranked in aggregate, was among the top 10 priorities for social scientists; many of the high priority questions for social scientists were low in the ranking order for natural scientists. Why should social scientists' priorities be so different? It is useful to bear in mind that the rationale behind the research scanning exercises is based on the premise that science can be aligned with policy-makers' needs (Rudd, 2011); if policy challenges can be clearly articulated, then aligned natural and social sciences can be brought to bear that builds understanding about natural systems and human behavior to help solve salient policy problems. At one level, social scientists work to understand human behavior and systems just as natural scientists focus on environmental and ecological systems; they are neutral information providers for policy-makers who need to make decisions on issues beyond the realm of science. This is a relatively traditional view among environmental scientists providing science advice to policy-makers (e.g., Rice, 2011). This perspective of social science is implicit, for example, in NOAA's current research plan, which emphasizes a major science challenge in acquiring and incorporating “knowledge of human behavior to enhance our understanding of the interaction between human activities and the Earth system” (National Oceanic and Atmospheric Administration, 2013, p. 19). In this survey, the question on the effects of MPAs on humans (rank 45 overall, rank 10 for social scientists) is an example where social scientists might conduct empirical research that directly complements natural science research and helps form a neutral, crossdisciplinary information package for decision-makers.
At a higher level, social scientists are also interested in the purposive aspects of environmental management (i.e., knowledge about better practices) and normative aspects of society's relationship with the environment (i.e., how transformational knowledge about learning processes and value changes can catalyze sustainable solutions) (Hirsch Hadorn et al., 2006). There is recent evidence that environmental scientists are increasingly interested in interpreting, integrating, and advocating science by engaging in the policy process (Singh et al., 2014). The results from this survey suggest that many social scientists' top-ranked priorities (recall Table 6—questions on science communication [ranked 1], risk assessment for governance [ranked 2], and ocean literacy messages [ranked 4], for example) fall into this higher-level category. It is important to understand that this does not necessarily mean that social scientists are mandating advocacy, but just that it is possible, and necessary, in the view of many social scientists, to focus research on the behavioral processes, management options, and societal values that constrain or stimulate real transformations toward ocean sustainability.
These higher level research priorities are reflected in some recent national research strategies. For example, NOAA highlights that “Integrating different disciplines, including natural and social sciences, is essential to develop a more holistic understanding of the Earth system… [and that] more and more, mission success depends on a holistic understanding of how natural phenomena are intertwined with human behavior and institutions” (National Oceanic and Atmospheric Administration, 2013, p. 19). The European Environment Agency (2014, p. 25) emphasizes that “Persistent problems such as loss of biodiversity, loss of ecosystem resilience, pollution, overexploitation of resources, and climate change are deeply embedded in our 21st century societal structures, cultures, values and practices… [and that maintaining] our seas will also depend on fundamental shifts in the systems that fulfill our societal needs, coupled with a wider re-evaluation of our values, and how we interact with nature and its resources.”
While the results from this survey could, given the large divergence in priorities among natural and social scientists, be interpreted as highlighting great challenges for crossdisciplinary ocean research cooperation, it is also possible to take the position that these patterns of priorities are not actually contradictory. If producers and users of scientific evidence understand that some social scientists focus on research questions that provide information needed to inform policy (as most natural scientists do), but that other social scientists focus on building understanding of the ways and means to transform existing practices (Hirsch Hadorn et al., 2006), then is could be possible to increase systems understanding, catalyze new thinking among scientists (e.g., Pennington et al., 2013) and increase the likelihood that real action will be taken to help improve ocean health and sustainability. It is important to note that the challenge of designing and implementing crossdisciplinary ocean research that supports decision-making for ocean sustainability was, in fact, the third highest research priority among social scientists in this survey.
Crossdisciplinary cooperation, long-term networking across disciplines, accounting for human agency and institutional structure in research, developing large suites of comparative case studies, and redefining what research excellence means are all crucial for sustainability science that aims to address global environmental change (Pahl-Wostl et al., 2013). Crossdisciplinary research teams will also likely increasingly involve social scientists studying their own team's research processes, dynamics and performance (Pennington et al., 2013), and the academic and policy impact of their collaborative research (Hampton and Parker, 2011; Emmett and Zelko, 2014). The drive to better document research impacts (Donovan, 2007; Bielak et al., 2008; Holmes and Clark, 2008) may also prompt increasing research on scientists' level of policy engagement more generally (e.g, Lawton and Rudd, 2013; Singh et al., 2014). Measures to more effectively deal with modern challenges that exhibit uncertainty along multiple dimensions are needed. The results from this survey demonstrate that some scientists are willing and able to engage in this type of research now but that there are others who may not be or are satisfied to remain in more traditional scientific roles. As Pahl-Wostl et al. (2013, p. 46) note, “Viable methodologies that generate interdisciplinary knowledge and integrate different knowledge cultures are not developed in the abstract, but in practice.” Funding availability and the socio-political environment within which scientists work obviously plays a crucial role in creating an enabling environment for ocean-relevant sustainability science.
Conclusion
The results from this survey present the “bottom-up” view of scientists working on a wide variety of coastal and ocean challenges around the world. The view of scientists, however, does not reflect the research priorities of society as a whole or government policy-makers, in particular. In the future it would be valuable to repeat a simpler variant of this survey with a variety of stakeholders and policy-makers, so that the level of alignment between those groups and scientists could be assessed (e.g., Rudd and Fleishman, 2014), potentially on a periodic (e.g., 5 year) basis so as to track changing priorities over time.
It would also be valuable to systematically compile and compare existing ocean research priorities among government and other organizations. Understanding the range of priorities across industry, society and government could provide some indication for scientists as to how their scientific priorities align with societal needs. For example, the World Bank's “Indispensable Ocean” report, drawn up by a blue ribbon panel that included industry, academic, and government members (Hoegh-Guldberg et al., 2013), emphasized the emerging role of public-private partnerships to address ocean challenges. In Europe, there is an increasing emphasis on productive seas and marine knowledge (European Environment Agency, 2014) as drivers of “blue growth” in the economy (European Commission, 2012). In an ocean infrastructure priorities report (Committee on an Ocean Infrastructure Strategy for U.S. Ocean Research in 2030, 2011). Key research themes included enabling stewardship of the environment, protecting life and property, and promoting sustainable economic vitality. These high-level reports point to an increasingly held view of the ocean as a driver of economic and social well-being, and the importance of safety and security. If that vision of oceans' contributions to human well-being is to be realized, it is critical that ocean health is maintained and restored. As the European Environment Agency (2014, p. 25) highlights, “Our seas are rapidly changing while our dependence on them is growing. We do not fully understand the complex interactions of natural and human-driven changes. But we do know that we are not yet on the path to achieving healthy, clean and productive seas.”
Active scientists are among the best positioned individuals to understand the true scope of ocean challenges, to highlight emerging threats to ocean health and their possible effects on human well-being, and to help identify technologies, management and governance systems that either help or hinder transformations to ocean sustainability. The results from this survey highlighted the priorities of scientists from 94 countries and, I hope, provide insights as to how research scanning results can be synthesized and used to target ocean research on questions that, if answered, would be central to achieving ocean sustainability.
Conflict of Interest Statement
The author declares that the research was conducted in the absence of any commercial or financial relationships that could be construed as a potential conflict of interest.
Acknowledgments
I sincerely thank the many individuals who took valuable time away from their normal duties to complete this [rather onerous] survey and contribute many thoughtful and insightful comments about ocean research needs and potential solutions for some daunting challenges.
Supplementary Material
The Supplementary Material for this article can be found online at: http://www.frontiersin.org/journal/10.3389/fmars.2014.00036/abstract
References
Achterberg, E. P. (2014). Grand challenges in marine biogeochemistry. Front. Mar. Sci. 1:7. doi: 10.3389/fmars.2014.00007
Allison, E. H., Perry, A. L., Badjeck, M.-C., Neil Adger, W., Brown, K., Conway, D., et al. (2009). Vulnerability of national economies to the impacts of climate change on fisheries. Fish Fish. 10, 173–196. doi: 10.1111/j.1467-2979.2008.00310.x
Armstrong, C. W., Foley, N. S., Tinch, R., and Van Den Hove, S. (2012). Services from the deep: steps towards valuation of deep sea goods and services. Ecosyst. Serv. 2, 2–13. doi: 10.1016/j.ecoser.2012.07.001
Balmaseda, M. A., Trenberth, K. E., and Källén, E. (2013). Distinctive climate signals in reanalysis of global ocean heat content. Geophys. Res. Lett. 40, 1754–1759. doi: 10.1002/grl.50382
Balvanera, P., Pfisterer, A. B., Buchmann, N., He, J.-S., Nakashizuka, T., Raffaelli, D., et al. (2006). Quantifying the evidence for biodiversity effects on ecosystem functioning and services. Ecol. Lett. 9, 1146–1156. doi: 10.1111/j.1461-0248.2006.00963.x
Berkes, F., Hughes, T. P., Steneck, R. S., Wilson, J. A., Bellwood, D. R., Crona, B., et al. (2006). Globalization, roving bandits, and marine resources. Science 311, 1557–1558. doi: 10.1126/science.1122804
Bielak, A. T., Campbell, A., Pope, S., Schaefer, K., and Shaxson, L. (2008). “From science communication to knowledge brokering: the shift from ‘Science Push’ to ‘Policy Pull’,” in Communicating Science in Social Contexts, eds D. Cheng, M. Claessens, T. Gascoigne, J. Metcalfe, B. Schiele, and S. Shi (Dordrecht: Springer), 201–226.
Borja, A., Marques, J.-C., Olabarria, C., and Quintino, V. (2013). Marine research in the Iberian Peninsula: a pledge for better times after an economic crisis. J. Sea Res. 83, 1–8. doi: 10.1016/j.seares.2013.07.004
Boxall, A. B. A., Rudd, M. A., Brooks, B. W., Caldwell, D. J., Choi, K., Hickmann, S., et al. (2012). Pharmaceuticals and personal care products in the environment: what are the big questions? Environ. Health Perspect. 120, 1221–1229. doi: 10.1289/ehp.1104477
Braunisch, V., Home, R., Pellet, J., and Arlettaz, R. (2012). Conservation science relevant to action: a research agenda identified and prioritized by practitioners. Biol. Conserv. 153, 201–210. doi: 10.1016/j.biocon.2012.05.007
Bremer, S., and Glavovic, B. (2013). Exploring the science–policy interface for Integrated Coastal Management in New Zealand. Ocean Coast. Manag. 84, 107–118. doi: 10.1016/j.ocecoaman.2013.08.008
Brown, L. E., Mitchell, G., Holden, J., Folkard, A., Wright, N., Beharry-Borg, N., et al. (2010). Priority water research questions as determined by UK practitioners and policy makers. Sci. Total Environ. 409, 256–266. doi: 10.1016/j.scitotenv.2010.09.040
Caldeira, K., and Wickett, M. E. (2003). Anthropogenic carbon and ocean pH. Nature 425, 365–365. doi: 10.1038/425365a
Camargo, J. A., and Alonso, Á. (2006). Ecological and toxicological effects of inorganic nitrogen pollution in aquatic ecosystems: a global assessment. Environ. Int. 32, 831–849. doi: 10.1016/j.envint.2006.05.002
Church, J. A., and White, N. J. (2006). A 20th century acceleration in global sea-level rise. Geophys. Res. Lett. 33, L01602. doi: 10.1029/2005GL024826
Cole, M., Lindeque, P., Halsband, C., and Galloway, T. S. (2011). Microplastics as contaminants in the marine environment: a review. Mar. Pollut. Bull. 62, 2588–2597. doi: 10.1016/j.marpolbul.2011.09.025
Committee on an Ocean Infrastructure Strategy for U. S. Ocean Research in 2030. (2011). Critical Infrastructure for Ocean Research and Societal Needs in 2030. Washington, DC: The National Academies Press.
Cooke, S. J., Danylchuk, A. J., Kaiser, M. J., and Rudd, M. A. (2010). Is there a need for a ‘100 questions exercise’ to enhance fisheries and aquatic conservation, policy, management and research? Lessons from a global 100 questions exercise on conservation of biodiversity. J. Fish Biol. 76, 2261–2286. doi: 10.1111/j.1095-8649.2010.02666.x
Costello, M. J., Coll, M., Danovaro, R., Halpin, P., Ojaveer, H., and Miloslavich, P. (2010). A census of marine biodiversity knowledge, resources, and future challenges. PLoS ONE 5:e12110. doi: 10.1371/journal.pone.0012110
Crossland, C. J., Baird, D., Ducrotoy, J. P., Lindeboom, H., Buddemeier, R. W., Dennison, W. C., et al. (2005). “The coastal zone–a domain of global interactions,” in Coastal Fluxes in the Anthropocene, eds C. J. Crossland, H. H. Kremer, H. J. Lindeboom, J. I. Marshall Crossland, and M. D. A. Le Tissier (Berlin; Heidelberg: Springer), 1–37.
Dahms, H. U. (2014). The grand challenges in marine pollution research. Front. Mar. Sci. 1:9. doi: 10.3389/fmars.2014.00009
Defries, R. S., Ellis, E. C., Stuart Chapin, F., Matson, P. A., Turner, B. L., Agrawal, A., et al. (2012). Planetary opportunities: a social contract for global change science to contribute to a sustainable future. Bioscience 62, 603–606. doi: 10.1525/bio.2012.62.6.11
Derraik, J. G. B. (2002). The pollution of the marine environment by plastic debris: a review. Mar. Pollut. Bull. 44, 842–852. doi: 10.1016/S0025-326X(02)00220-5
Dillman, D. A., Smyth, J. D., and Christian, L. M. (2009). Internet, Mail, and Mixed-Mode Surveys: the Tailored Design Method, 3rd Edn. New York, NY: John Wiley & Sons.
Doney, S. C., Ruckelshaus, M., Emmett Duffy, J., Barry, J. P., Chan, F., English, C. A., et al. (2012). Climate change impacts on marine ecosystems. Annu. Rev. Mar. Sci. 4, 11–37. doi: 10.1146/annurev-marine-041911-111611
Donovan, C. (2007). Future pathways for science policy and research assessment: metrics vs peer review, quality vs impact. Sci. Public Policy 34, 538–542. doi: 10.3152/030234207X256529
Emmett, R., and Zelko, F. (eds.). (2014). Minding the Gap: Working Across Disciplines in Environmental Studies. Munich: Rachel Carson Center for Environment and Society.
European Commission. (2012). Blue Growth: Opportunities for Marine and Maritime Sustainable Growth. Luxembourg: Publications Office of the European Union.
European Environment Agency. (2014). Marine Messages. Luxembourg: Publications Office of the European Union.
Expert Panel on Canadian Ocean Science. (2013). Ocean Science in Canada: Meeting the Challenge, Seizing the Opportunity. Ottawa, ON: Council of Canadian Academies.
Feary, D. A., Burt, J. A., Bauman, A. G., Al Hazeem, S., Abdel-Moati, M. A., Al-Khalifa, K. A., et al. (2013). Critical research needs for identifying future changes in Gulf coral reef ecosystems. Mar. Pollut. Bull. 72, 406–416. doi: 10.1016/j.marpolbul.2013.02.038
Finn, A., and Louviere, J. J. (1992). Determining the appropriate response to evidence of public concern: the case of food safety. J. Public Policy Mark. 11, 12–25.
Fissel, D., Babin, M., Bachmayer, R., Denman, K., Dewailly, E., Gillis, K. M., et al. (2012). 40 Priority Research Questions for Ocean Science in Canada. Ottawa, ON: Council of Canadian Academies; The Core Group on Ocean Science in Canada.
Fleishman, E., Blockstein, D. E., Hall, J. A., Mascia, M. B., Rudd, M. A., Scott, J. M., et al. (2011). Top 40 priorities for science to inform US conservation and management policy. Bioscience 61, 290–300. doi: 10.1525/bio.2011.61.4.9
Garcia, S. M., and Rosenberg, A. A. (2010). Food security and marine capture fisheries: characteristics, trends, drivers and future perspectives. Philos. Trans. R. Soc. B 365, 2869–2880. doi: 10.1098/rstb.2010.0171
Gramling, C. (2014). Seafloor mining plan advances, worrying critics. Science 344, 463. doi: 10.1126/science.344.6183.463
Griggs, D., Stafford-Smith, M., Gaffney, O., Rockström, J., Öhman, M. C., Shyamsundar, P., et al. (2013). Sustainable development goals for people and planet. Nature 495, 305–307. doi: 10.1038/495305a
Hackmann, H., and St. Clair, A. L. (2012). Transformative Cornerstones of Social Science Research for Global Change. Paris: International Social Science Council.
Halpern, B. S., Longo, C., Hardy, D., Mcleod, K. L., Samhouri, J. F., Katona, S. K., et al. (2012). An index to assess the health and benefits of the global ocean. Nature 488, 615–620. doi: 10.1038/nature11397
Hampton, S. E., and Parker, J. N. (2011). Collaboration and productivity in scientific synthesis. Bioscience 61, 900–910. doi: 10.1525/bio.2011.61.11.9
Heip, C., Barange, M., Danovaro, R., Gehlen, M., Grehan, A., Meysman, F., et al. (2011). “Climate Change and Marine Ecosystem Research: Synthesis of European Research on the Effects of Climate Change on Marine Environments.” Ostend: Marine Board, European Science Foundation.
Heip, C., Hummel, H., Van Avesaath, P., Appeltans, W., Arvanitidis, C., Aspden, R., et al. (2009). Marine Biodiversity and Ecosystem Functioning Dublin. Ireland: Printbase.
Heip, C., and McDonough, N. (2012). Marine Biodiversity: a Science Roadmap for Europe. Ostend: European Marine Board.
Hirsch Hadorn, G., Bradley, D., Pohl, C., Rist, S., and Wiesmann, U. (2006). Implications of transdisciplinarity for sustainability research. Ecol. Econ. 60, 119–128. doi: 10.1016/j.ecolecon.2005.12.002
Hoegh-Guldberg, O. (1999). Climate change, coral bleaching and the future of the world's coral reefs. Mar. Freshw. Rese. 50, 839–866. doi: 10.1071/MF99078
Hoegh-Guldberg, O., Aqorau, T., Arnason, R., Chansiri, T., Del Rio, N., Demone, H., et al. (2013). Indispensable Ocean. Washington, DC: Global Partnership for Oceans.
Hollowed, A. B., and Sundby, S. (2014). Change is coming to the northern oceans. Science 344, 1084–1085. doi: 10.1126/science.1251166
Holmes, J., and Clark, R. (2008). Enhancing the use of science in environmental policy-making and regulation. Environ. Sci. Policy 11, 702–711. doi: 10.1016/j.envsci.2008.08.004
Ingram, J. S. I., Wright, H. L., Foster, L., Aldred, T., Barling, D., Benton, T., et al. (2013). Priority research questions for the UK food system. Food Secur. 5, 617–636. doi: 10.1007/s12571-013-0294-4
International Ocean Discovery Program. (2011). Illuminating Earth's Past, Present and Future: The Science Plan for the International Ocean Discovery Program 2013–2023. Washington, DC: Integrated Ocean Drilling Program Management International.
Jackson, J. B. C., Kirby, M. X., Berger, W. H., Bjorndal, K. A., Botsford, L. W., Bourque, B. J., et al. (2001). Historical overfishing and the recent collapse of coastal ecosystems. Science 293, 629–637. doi: 10.1126/science.1059199
Johnson, A. E., Cinner, J. E., Hardt, M. J., Jacquet, J., Mcclanahan, T. R., and Sanchirico, J. N. (2013). Trends, current understanding and future research priorities for artisanal coral reef fisheries research. Fish Fish. 14, 281–292. doi: 10.1111/j.1467-2979.2012.00468.x
Jolibert, C., and Wesselink, A. (2012). Research impacts and impact on research in biodiversity conservation: the influence of stakeholder engagement. Environ. Sci. Policy 22, 100–111. doi: 10.1016/j.envsci.2012.06.012
Kark, S., Levin, N., and Shanas, U. (2011). The Top Research Questions and Horizon Scanning Topics for Biodiversity Conservation Policy in Israel. Jerusalem: The Hebrew University of Jerusalem.
Katsanevakis, S., Weber, A., Pipitone, C., Leopold, M., Cronin, M., Scheidat, M., et al. (2012). Monitoring marine populations and communities: methods dealing with imperfect detectability. Aquat. Biol. 16, 31–52. doi: 10.3354/ab00426
Keeling, R. F., Körtzinger, A., and Gruber, N. (2010). Ocean deoxygenation in a warming world. Annu. Rev. Mar. Sci. 2, 199–229. doi: 10.1146/annurev.marine.010908.163855
Kroeze, C., Hofstra, N., Ivens, W., Löhr, A., Strokal, M., and Van Wijnen, J. (2013). The links between global carbon, water and nutrient cycles in an urbanizing world–the case of coastal eutrophication. Curr. Opin. Environ. Sustain. 5, 566–572. doi: 10.1016/j.cosust.2013.11.004
Lawton, R. N., and Rudd, M. A. (2013). Crossdisciplinary research contributions to the United Kingdom's National Ecosystem Assessment. Ecosyst. Serv. 5, 149–159. doi: 10.1016/j.ecoser.2013.07.009
Lawton, R. N., and Rudd, M. A. (2014). A narrative policy approach to environmental conservation. Ambio. doi: 10.1007/s13280-014-0497-8. [Epub ahead of print].
Lewison, R. L., Crowder, L. B., Wallace, B. P., Moore, J. E., Cox, T., Zydelis, R., et al. (2014). Global patterns of marine mammal, seabird, and sea turtle bycatch reveal taxa-specific and cumulative megafauna hotspots. Proc. Natl. Acad. Sci. U. S. A. 111, 5271–5276. doi: 10.1073/pnas.1318960111
Liquete, C., Piroddi, C., Drakou, E. G., Gurney, L., Katsanevakis, S., Charef, A., et al. (2013). Current status and future prospects for the assessment of marine and coastal ecosystem services: a systematic review. PLoS ONE 8:e67737. doi: 10.1371/journal.pone.0067737
Lotze, H. K., Lenihan, H. S., Bourque, B. J., Bradbury, R. H., Cooke, R. G., Kay, M. C., et al. (2006). Depletion, degradation, and recovery potential of estuaries and coastal seas. Science 312, 1806–1809. doi: 10.1126/science.1128035
Lubchenco, J. (1998). Entering the century of the environment: a new social contract for science. Science 279, 491–497. doi: 10.1126/science.279.5350.491
Mooney, H. A., Duraiappah, A., and Larigauderie, A. (2013). Evolution of natural and social science interactions in global change research programs. Proc. Natl. Acad. Sci. U.S.A. 110, 3665–3672. doi: 10.1073/pnas.1107484110
Morton, S. R., Hoegh-Guldberg, O., Lindenmayer, D. B., Harriss Olson, M., Hughes, L., Mcculloch, M. T., et al. (2009). The big ecological questions inhibiting effective environmental management in Australia. Austral Ecol. 34, 1–9. doi: 10.1111/j.1442-9993.2008.01938.x
National Oceanic and Atmospheric Administration. (2013). Environmental Understanding to Ensure America's Vital and Sustainable Future Research and Development at NOAA: Five-Year Research and Development Plan 2013-2017. Washington, DC: National Oceanic and Atmospheric Administration.
Pahl-Wostl, C., Giupponi, C., Richards, K., Binder, C., De Sherbinin, A., Sprinz, D., et al. (2013). Transition towards a new global change science: requirements for methodologies, methods, data and knowledge. Environ. Sci. Policy 28, 36–47. doi: 10.1016/j.envsci.2012.11.009
Parsons, E. C. M., Favaro, B., Aguirre, A. A., Bauer, A. L., Blight, L. K., Cigliano, J. A., et al. (2014). Seventy-one important questions for the conservation of marine biodiversity. Conserv. Biol. doi: 10.1111/cobi.12303. [Epub ahead of print].
Pennington, D. D., Simpson, G. L., Mcconnell, M. S., Fair, J. M., and Baker, R. J. (2013). Transdisciplinary research, transformative learning, and transformative science. Bioscience 63, 564–573. doi: 10.1525/bio.2013.63.7.9
Pohl, C. (2005). Transdisciplinary collaboration in environmental research. Futures 37, 1159–1178. doi: 10.1016/j.futures.2005.02.009
Pretty, J., Sutherland, W. J., Ashby, J., Auburn, J., Baulcombe, D., Bell, M., et al. (2010). The top 100 questions of importance to the future of global agriculture. Int. J. Agric. Sustain. 8, 219–236. doi: 10.3763/ijas.2010.0534
Ramirez-Llodra, E., Tyler, P. A., Baker, M. C., Bergstad, O. A., Clark, M. R., Escobar, E., et al. (2011). Man and the last great wilderness: human impact on the deep sea. PLoS ONE 6:e22588. doi: 10.1371/journal.pone.0022588
Rees, S., Fletcher, S., Glegg, G., Marshall, C., Rodwell, L., Jefferson, R., et al. (2013). Priority questions to shape the marine and coastal policy research agenda in the United Kingdom. Mar. Policy 38, 531–537. doi: 10.1016/j.marpol.2012.09.002
Rice, J. C. (2011). Advocacy science and fisheries decision-making. ICES J. Mar. Sci. 68, 2007–2012. doi: 10.1093/icesjms/fsr154
Rockström, J., Steffen, W., Noone, K., Persson, Å., Chapin, F. S., Lambin, E. F., et al. (2009). A safe operating space for humanity. Nature 461, 472–475. doi: 10.1038/461472a
Rudd, M. A. (2004). An institutional framework for designing and monitoring ecosystem-based fisheries management policy experiments. Ecol. Econ. 48, 109–124. doi: 10.1016/j.ecolecon.2003.10.002
Rudd, M. A. (2011). How research-prioritization exercises affect conservation policy. Conserv. Biol. 25, 860–866. doi: 10.1111/j.1523-1739.2011.01712.x
Rudd, M. A., Ankley, G. T., Boxall, A. B. A., and Brooks, B. W. (2014). International scientists' priorities for research on pharmaceuticals and personal care products in the environment. Integr. Environ. Assess. Manag. doi: 10.1002/ieam.1551. [Epub ahead of print].
Rudd, M. A., Beazley, K. F., Cooke, S. J., Fleishman, E., Lane, D. E., Mascia, M. B., et al. (2011). Generation of priority research questions to inform conservation policy and management at a national level. Conserv. Biol. 25, 476–484. doi: 10.1111/j.1523-1739.2010.01625.x
Rudd, M. A., and Fleishman, E. (2014). Policymakers' and scientists' ranks of research priorities for resource-management policy. Bioscience 64, 219–228. doi: 10.1093/biosci/bit035
Rudd, M. A., and Lawton, R. N. (2013). Scientists' prioritization of global coastal research questions. Mar. Policy 39, 101–111. doi: 10.1016/j.marpol.2012.09.004
Sawtooth Software (2009). The CBC/HB System for Hierarchical Bayes Estimation Version 5.0 Technical Paper. Sequim, WA: Sawtooth Software, Inc.
Schlüter, A., Wise, S., Schwerdtner Mánez, K., De Morais, G., and Glaser, M. (2013). Institutional change, sustainability and the sea. Sustainability 5, 5373–5390. doi: 10.3390/su5125373
Singh, G. G., Tam, J., Sisk, T. D., Klain, S. C., Mach, M. E., Martone, R. G., et al. (2014). A more social science: barriers and incentives for scientists engaging in policy. Front. Ecol. Environ. 12, 161–166. doi: 10.1890/130011
Small, C., and Nicholls, R. J. (2003). A global analysis of human settlement in coastal zones. J. Coast. Res. 19, 584–599. Available online at: http://www.jstor.org/stable/4299200
Snelgrove, P., Miloslavich, P., Amaral-Zettler, L., Archambault, P., Balasubramanian, S. T., Brinkman, R., et al. (2012). Life in a Changing Ocean: Providing Tools for Sustainable Ocean Use (Scientific Synopsis). St. John's, NL: Life in a Changing Ocean.
Spruijt, P., Knol, A. B., Vasileiadou, E., Devilee, J., Lebret, E., and Petersen, A. C. (2014). Roles of scientists as policy advisers on complex issues: a literature review. Environ. Sci. Policy 40, 16–25. doi: 10.1016/j.envsci.2014.03.002
Sutherland, W. J., Adam, W. M., Aronson, R. B., Aveling, R., Blackburn, T. M., Broad, S., et al. (2009). One hundred questions of importance to the conservation of global biological diversity. Conserv. Biol. 23, 557–567. doi: 10.1111/j.1523-1739.2009.01212.x
Sutherland, W. J., Armstrong-Brown, S., Armsworth, P. R., Brereton, T., Brickland, J., Campbell, C. D., et al. (2006). The identification of 100 ecological questions of high policy relevance in the UK. J. Appl. Ecol. 43, 617–627. doi: 10.1111/j.1365-2664.2006.01188.x
Sutherland, W. J., Aveling, R., Bennun, L., Chapman, E., Clout, M., Côté, I. M., et al. (2012a). A horizon scan of global conservation issues for 2012. Trends Ecol. Evol. 27, 12–18. doi: 10.1016/j.tree.2011.10.011
Sutherland, W. J., Aveling, R., Brooks, T. M., Clout, M., Dicks, L. V., Fellman, L., et al. (2014). A horizon scan of global conservation issues for 2014. Trends Ecol. Evol. 29, 15–22. doi: 10.1016/j.tree.2013.11.004
Sutherland, W. J., Bailey, M. J., Bainbridge, I. P., Brereton, T., Dick, J. T. A., Drewitt, J., et al. (2008). Future novel threats and opportunities facing UK biodiversity identified by horizon scanning. J.Appl. Ecol. 45, 821–833. doi: 10.1111/j.1365-2664.2008.01474.x
Sutherland, W. J., Bardsley, S., Bennun, L., Clout, M., Côté, I. M., Depledge, M. H., et al. (2011a). Horizon scan of global conservation issues for 2011. Trends Ecol. Evol. 26, 10–16. doi: 10.1016/j.tree.2010.11.002
Sutherland, W. J., Bardsley, S., Clout, M., Depledge, M. H., Dicks, L. V., Fellman, L., et al. (2013a). A horizon scan of global conservation issues for 2013. Trends Ecol. Evol. 28, 16–22. doi: 10.1016/j.tree.2012.10.022
Sutherland, W. J., Bellingan, L., Bellingham, J. R., Blackstock, J. J., Bloomfield, R. M., Bravo, M., et al. (2012b). A collaboratively-derived science-policy research agenda. PLoS ONE 7:e31824. doi: 10.1371/journal.pone.0031824
Sutherland, W. J., Clout, M., Côté, I. M., Daszak, P., Depledge, M. H., Fellman, L., et al. (2010). A horizon scan of global conservation issues for 2010. Trends Ecol. Evol. 25, 1–7. doi: 10.1016/j.tree.2009.10.003
Sutherland, W. J., Fleishman, E., Mascia, M. B., Pretty, J., and Rudd, M. A. (2011b). Methods for collaboratively identifying research priorities and emerging issues in science and policy. Methods Ecol. Evol. 2, 238–247. doi: 10.1111/j.2041-210X.2010.00083.x
Sutherland, W. J., Freckleton, R. P., Godfray, H. C. J., Beissinger, S. R., Benton, T., Cameron, D. D., et al. (2013b). Identification of 100 fundamental ecological questions. J. Ecol. 101, 58–67. doi: 10.1111/1365-2745.12025
Thompson Klein, J. (2004). Prospects for transdisciplinarity. Futures 36, 515–526. doi: 10.1016/j.futures.2003.10.007
Vugteveen, P., Van Katwijk, M. M., Rouwette, E., and Hanssen, L. (2014). How to structure and prioritize information needs in support of monitoring design for Integrated Coastal Management. J. Sea Res. 86, 23–33. doi: 10.1016/j.seares.2013.10.013
Keywords: research priorities, oceans research, marine research, crossdisciplinarity, transdisciplinarity, horizon scanning, big questions, best-worst scaling
Citation: Rudd MA (2014) Scientists' perspectives on global ocean research priorities. Front. Mar. Sci. 1:36. doi: 10.3389/fmars.2014.00036
Received: 15 June 2014; Paper pending published: 29 July 2014;
Accepted: 11 August 2014; Published online: 27 August 2014.
Edited by:
Julian Clifton, University of Western Australia, AustraliaReviewed by:
Ben Milligan, University College London, UKMarcus Geoffrey Haward, University of Tasmania, Australia
Todd C. Stevenson, University of Washington, USA
Copyright © 2014 Rudd. This is an open-access article distributed under the terms of the Creative Commons Attribution License (CC BY). The use, distribution or reproduction in other forums is permitted, provided the original author(s) or licensor are credited and that the original publication in this journal is cited, in accordance with accepted academic practice. No use, distribution or reproduction is permitted which does not comply with these terms.
*Correspondence: Murray A. Rudd, Environment Department, University of York, Heslington, York YO10 5DD, UK e-mail:bXVycmF5LnJ1ZGRAeW9yay5hYy51aw==