 Ahmed A. Shibl
 Mohamed F. Haroon
 David K. Ngugi
 Luke R. Thompson
 Ulrich Stingl
- 1Marine Microbial Ecology Lab, Red Sea Research Center, King Abdullah University of Science and Technology, Thuwal, Saudi Arabia
- 2Department of Pediatrics, University of California, San Diego, CA, USA
The marine picocyanobacteria Prochlorococcus represent a significant fraction of the global pelagic bacterioplankton community. Specifically, in the surface waters of the Red Sea, they account for around 91% of the phylum Cyanobacteria. Previous work suggested a widespread presence of high-light (HL)-adapted ecotypes in the Red Sea with the occurrence of low-light (LL)-adapted ecotypes at intermediate depths in the water column. To obtain a more comprehensive dataset over a wider biogeographical scope, we used a 454-pyrosequencing approach to analyze the diversity of the Prochlorococcus rpoC1 gene from a total of 113 samples at various depths (up to 500 m) from 45 stations spanning the Red Sea basin from north to south. In addition, we analyzed 45 metagenomes from eight stations using hidden Markov models based on a set of reference Prochlorococcus genomes to (1) estimate the relative abundance of Prochlorococcus based on 16S rRNA gene sequences, and (2) identify and classify rpoC1 sequences as an assessment of the community structure of Prochlorococcus in the northern, central and southern regions of the basin without amplification bias. Analyses of metagenomic data indicated that Prochlorococcus occurs at a relative abundance of around 9% in samples from surface waters (25, 50, 75 m), 3% in intermediate waters (100 m) and around 0.5% in deep-water samples (200–500 m). Results based on rpoC1 sequences using both methods showed that HL II cells dominate surface waters and were also present in deep-water samples. Prochlorococcus communities in intermediate waters (100 m) showed a higher diversity and co-occurrence of low-light and high-light ecotypes. Prochlorococcus communities at each depth range (surface, intermediate, deep sea) did not change significantly over the sampled transects spanning most of the Saudi waters in the Red Sea. Statistical analyses of rpoC1 sequences from metagenomes indicated that the vertical distribution of Prochlorococcus in the water column is correlated with physicochemical gradients: temperature and oxygen are positively correlated with HL II (R2 = 0.71, p ≤ 0.05) while Chl a concentration, nutrient concentrations and salinity correlate with the prevalence of LL clades.
Introduction
The Red Sea is a poorly explored oligotrophic marine environment with distinct physicochemical properties that are very different from the neighboring Gulf of Aqaba (Klinker et al., 1978; Labiosa et al., 2003). The long, narrow main basin is enclosed from the northern end by the Suez Canal and Gulf of Aqaba and from the southern end by the Bab Al Mandab, reducing the water inflow to negligible levels during most of the year (Edwards, 1987; Da Silva et al., 1994). Continuous exposure to solar irradiation causes surface waters to reach high temperatures (23–32°C; Raitsos et al., 2013) and the water column below the surface layer to remain nearly isothermal almost year round (Edwards, 1987). The combination of minimal precipitation in the Arabian region with high evaporation rates (Morcos, 1970) renders the main basin extremely saline (from 36 to 41 psu) (Edwards, 1987). Remote sensing of chlorophyll (Chl) a (a proxy for phytoplankton biomass), surface temperature and wind data revealed that the succession of phytoplankton biomass follows a specific seasonality, controlled by the effects of mixing that weaken the stratification across meridional domains of the Red Sea (Brewin et al., 2013; Raitsos et al., 2013). The southern Red Sea is the most productive region of the basin, as reflected by the peak in Chl a levels during autumn (Raitsos et al., 2013). This is likely due to the influx of colder waters with higher nutrient concentrations from the Gulf of Aden through the strait of Bab Al Mandab (Raitsos et al., 2013). These pronounced environmental gradients in the Red Sea play an important role in shaping the connectivity patterns of reef fish (Nanninga et al., 2014; Robitzch et al., 2015), coral community structure (Sawall et al., 2014), and benthos composition (Giles et al., 2015). Also, the bacterial diversity and community structure in the northeastern part of the Red Sea follows the surface temperature-salinity gradient across the basin (Ngugi et al., 2011; Ngugi and Stingl, 2012). Still, the impact of these environmental gradients on the fine-scale community structure of the most abundant microorganisms is still largely unknown.
Ngugi et al. (2011) reported that the picocyanobacteria of the genus Prochlorococcus are the most abundant photosynthetic microorganisms in the Red Sea. The distribution patterns of Prochlorococcus (Chisholm et al., 1988) and their phylogenetic sister group Synechococcus (Waterbury et al., 1985) are closely tied to environmental parameters and gradients (Scanlan et al., 2009; Biller et al., 2015). They are usually the most abundant photosynthetic microorganisms in oceans between 45°N and 45°S (Olson et al., 1990; Johnson et al., 2006). Despite broad differences in their distribution patterns across water columns and in their genetic diversity, both genera play important roles in the microbial food web and contribute considerably to global primary production (Li, 1994; Scanlan and West, 2002; Jardillier et al., 2010). The density of Prochlorococcus cells is usually high in the epipelagic zone of oligotrophic, tropical and subtropical waters where they receive sufficient light energy. Their high abundance in low-nutrient environments is attributed to their high surface-area-to-volume ratio (Chisholm et al., 1992), an enhanced capacity to harvest sunlight (Partensky et al., 1993; Hess et al., 2001) and their ability to readily fix carbon at extremely low light intensities (Ting et al., 2002). In addition to these physiological advantages, the high genetic microdiversity that forms distinct subgroups within the genus permits their distribution in marine habitats with different environmental conditions (Moore et al., 1998). These phylogenetically closely related subgroups have several different physiological and genetic traits that render them well adapted to their respective (micro-) environment, (Partensky et al., 1999; Biller et al., 2015). Prochlorococcus are divided into high-light (HL)-adapted and low-light (LL)-adapted clades (Moore et al., 1998; West and Scanlan, 1999; Rocap et al., 2002). The HL clade typically occupies surface waters or mixed surface layers, while the LL clade grows at substantially lower light intensities and usually dominates deeper waters (Goericke and Repeta, 1993). HL and LL-adapted Prochlorococcus cells have distinctly variable ratios of unique divinyl derivatives of Chl a and b molecules, which allow them to efficiently absorb light at intensities much lower than without them (Moore et al., 1998; Ting et al., 2002). These clades are further resolved, according to sequences of their rRNA intergenic transcribed spacer (ITS) region, into several phylogenetically distinct HL (I, II, HNLCs, and VI) and LL (I-VII and NC1) ecotypes (Rocap et al., 2002; Martiny et al., 2009; Lavin et al., 2010; Rusch et al., 2010; West et al., 2011; Huang et al., 2012). In a recent study of the Pacific Ocean, Prochlorococcus HL-adapted clades were further resolved into sub-ecotype levels. Consistent with previous findings, seasonality influenced the large-scale community composition but interestingly, the spatial distribution of the HL sub-ecotypes had additional different environmental drivers. HL II sub-ecotypes showed less diverse niche differentiation than HL I sub-ecotypes, suggesting that unmeasured variables in the oligotrophic ocean may be critical for the partitioning of these populations (Larkin et al., 2016). Culture-independent methods and oceanic metagenomes continue to reveal previously unknown Prochlorococcus groups, indicating that the full extent of their diversity remains to be defined (Lavin et al., 2010; Rusch et al., 2010; Huang et al., 2012). Metagenomic analyses of natural Prochlorococcus subpopulations in the surface ocean showed a high genomic diversity that followed a clear biogeographic pattern. Gene frequencies of the variable genome significantly correlated with environmental parameters, indicating that this diversity is not randomly distributed (Kent et al., 2016). An extensive analysis of single-cell genomes showed that fine-scale sequence diversity is present even among coexisting subpopulations of Prochlorococcus within the same drop of seawater (Kashtan et al., 2014).
To date, the majority of available information on their microdiversity and distribution has come from the analyses of 16S rRNA genes and ITS sequences (Rocap et al., 2002; Brown and Fuhrman, 2005; Johnson et al., 2006; Zinser et al., 2006). High sequence similarity and/or length discrepancies in these approaches have revealed the need for other less conserved protein-coding genes as markers to analyze the community structure of Prochlorococcus. Although several candidate genes like psbB (encoding a chlorophyll-binding protein), cpeB (encoding β-phycoerythrin), and the nitrogen regulator ntcA (Urbach et al., 1998; Steglich et al., 2003; Penno et al., 2006), have been assayed in the past, the single-copy gene encoding the gamma subunit of DNA-directed RNA polymerase, rpoC1, has been established as a robust functional gene marker of picocyanobacterial communities (Palenik, 1994; Toledo and Palenik, 1997; Ferris and Palenik, 1998; Ma et al., 2004; Jameson et al., 2008, 2010; Gutiérrez-Rodríguez et al., 2014). Phylogenetic analyses of rpoC1 gene fragments and comparisons with data obtained from restriction fragment length polymorphism (RFLP) of rpoC1 from samples with a variety of light intensities in the Atlantic Ocean led to the detection of putative novel lineages within the LL and HL clades (Jameson et al., 2008, 2010). More recently, quantitative polymerase chain reaction (qPCR) assays based on rpoC1 were used to detect novel picocyanobacterial genotypes related to the LL I ecotype from the Costa Rica Dome. Spatial differences in picocyanobacterial populations and their taxonomic resolution have been linked to the strong interannual variability of the dome, a shallow oxycline and the water body's environmental gradients (Gutiérrez-Rodríguez et al., 2014).
Because of their importance in global oceans and current predictions of possible impact of climate change on their community structure (Duarte, 2014), the biogeographical distribution of Prochlorococcus ecotypes, their seasonal variability, and their adaptation to increased water temperatures has received considerable attention (Partensky et al., 1999; Schattenhofer et al., 2009; Flombaum et al., 2013). The Red Sea is a unique example of a warm and highly saline marine ecosystem. Analyzing Prochlorococcus microdiversity and distribution in its water column may help deduce the effects of climate change. So far, only limited information on the biogeography of Prochlorococcus in the main basin of the Red Sea is available (Shibl et al., 2014), as previous studies have focused only on the Gulf of Aqaba (Lindell and Post, 1995; Steglich et al., 2003; Fuller et al., 2005). In this study, we report the first detailed analysis of the community structure of Prochlorococcus in the water column of the northern, central and southern regions of the main basin of the Red Sea using shotgun metagenomics and PCR-based high-throughput sequencing based on the rpoC1 marker gene. Using the data of both approaches, we investigate correlations between the microdiversity of Prochlorococcus and the unusual physicochemical parameters of the Red Sea.
Materials and Methods
Sample Collection
Water-column samples from the Red Sea were collected in September-October 2011 for pyrotag sequencing and metagenomic shotgun sequencing as part of the third R/V Aegaeo KAUST Red Sea Expedition (KRSE 2011). For pyrotag sequencing, sampling sites consisted of 22 expanded transects from the coast to the open ocean across the Red Sea basin and 20 L seawater was collected at depths of 10, 25, 50, 100, 200, and 500 m (or the deepest possible depth at shallower stations); for metagenomic shotgun sequencing, 20 L seawater samples were collected from the same depths but only from eight stations (Figure 1). We used a rosette sampler outfitted with 12 Niskin bottles (10 L/bottle) for water and a CTD (conductivity, temperature, and depth) unit with additional sensors (SBE 9/11+, Sea-Bird Electronics, Bellevue, WA, USA) to capture salinity, temperature, chlorophyll a and dissolved oxygen readings (Tables S1, S2) from the collected water samples; suspended particles were removed by a 5.0 μm prefilter and presumably freely suspended cells were captured by subsequent filtration onto 1.2 and 0.1 μm filters (mixed cellulose ester, Millipore). Each filter was immediately sealed inside sterile re-sealable bags and frozen at −20°C while onboard the vessel. Filtrate from the 0.1 μm filter was frozen at −20°C and nutrients measurements were obtained by flow injection analysis at Woods Hole Oceanographic Institute (for silicate) and at the UCSB Marine Science Institute (nitrate and phosphate).
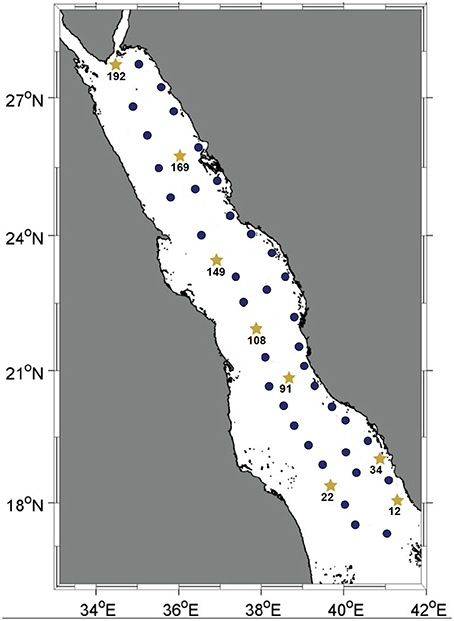
Figure 1. Map of the Red Sea basin. Solid dark-blue circles indicate stations where the water column was sampled for pyrotag sequencing of the Prochlorococcus rpoC1 gene fragment. Yellow stars represent the stations where the water column was sampled for further metagenomic shotgun sequencing. All water samples were collected during KRSE2011 onboard the R/V Aegaeo.
DNA Extraction and rpoC1 Pyrosequencing
Total DNA was extracted from the 0.1 μm filters using a protocol modified from Rusch et al. (2007). In brief, the aqueous DNA extracts (after the chloroform–isoamyl–alcohol extraction step) were washed with 10 mM TE buffer (10 mM Tris-HCl; 1 mM Na-EDTA, pH 8.0; Wright et al., 2009) and concentrated using Amicon ultracentrifugation tubes (10 kDa, Millipore) as described by the manufacturer. The purity of the extracted DNA was assessed with 1% agarose gel electrophoresis and quantified using Quant-iT PicoGreen (Molecular Probes, Invitrogen, Carlsbad, CA) as described by the manufacturer. The picocyanobacterial rpoC1 gene was amplified by PCR using primers that target Prochlorococcus lineages: forward primer 5M_F (5′-GARCARATHGTYTAYTTYA-′3) and reverse primer SAC1039R (5′-CYTGYTTNCCYTCDATDATRTC-′3; Tai and Palenik, 2009; Gutiérrez-Rodríguez et al., 2014). Each PCR mixture (15 μl) contained 7.5 μl of the 2X QIAGEN Multiplex PCR Master Mix, 0.5 μl of each primer (10 μM), and 2 μl of template DNA for samples >10 ng/μl or 4 μl of template DNA for samples < 10 ng/μl. PCRs were run with the following conditions: initial denaturation at 94°C for 15 min, followed by 35 cycles at 94°C for 30 s, 35°C for 45 s, 72°C for 45 s and a final extension at 72°C for 10 min. Uniquely barcoded forward primers (annealed to Lib-L) were used for semi-nested PCRs (due to limited PCR product from the first round of PCR) that were run with 2 μl of the purified first PCR product as template. The conditions of the semi-nested PCRs were similar to the original ones, except for an annealing temperature of 40°C. Samples were then pooled at equimolar quantities (20 ng of each), followed by DNA precipitation with isopropanol. Amplicons were purified with the QIAquick Gel Extraction Kit (Qiagen, Hilden, Germany) and DNA concentrations were measured using the Qubit BR instrument (Invitrogen, Inc., Carlsbad, CA, USA) as described by the manufacturer. Pyrosequencing was performed on a Roche 454 Genome Sequencer FLX Titanium (454 Life Sciences, Branford, CT, USA) according to the manufacturer's protocol.
Pyrotag Data Processing
Resulting pyrotags were pre-processed by trimming primers and adapters and de-noised using the MOTHUR software package (Schloss et al., 2009). Chimeric sequences were detected and removed by Uchime (Edgar et al., 2011) resulting in a total of 32,437 optimized reads with predefined start and end positions that overlap in the same alignment space. MOTHUR (Schloss et al., 2009) was used for binning and preliminary taxonomic classification of the rpoC1 pyrosequencing reads at an 80% confidence level. First, we designed a reference database of rpoC1 sequences from all available Prochlorococcus genomes (Biller et al., 2014; Kashtan et al., 2014). The reference database was aligned and a pairwise distance matrix was generated in MEGA v6.06 (Tamura et al., 2013). The average nucleotide distance between all reference sequences from all available clades was calculated as 0.07 (0.02 at the amino acid level), and therefore a 93% similarity level was selected in the cluster command of MOTHUR to discriminate different OTUs, resulting in 3935 OTUs (after removing singletons) with an average length of 436 nucleotides. For downstream analyses, we selected 113 samples with a minimum of 50 retrieved sequences. Community richness and evenness for each depth sampled was estimated using the number of observed OTUs, the Chao1 estimator (Chao, 1984) and the Shannon index, and rarefaction curves based on observed OTUs and Good's coverage of the whole dataset were generated using MOTHUR (Figure S1).
A total of 38 highly represented OTUs, which were found a minimum of two times in at least 5% of our samples, were used for detailed phylogenetic analyses. Maximum likelihood and neighbor-joining trees were generated in the molecular evolutionary genetics analysis (MEGA) software v6.06 (Tamura et al., 2013) and included Prochlorococcus sequences from cultured isolates (Rocap et al., 2003; Kettler et al., 2007), single-cell amplified genomes (Malmstrom et al., 2013; Kashtan et al., 2014), metagenomic assemblies (Rusch et al., 2010), and new whole-genome assemblies ((Biller et al., 2014); Figure S2). Heat maps displaying relative abundance of Prochlorococcus bins and OTUs, as well as ordination plots with PCA calculations and variance partitioning analyses were generated using the R package (R Core Team, 2014, http://www.R-project.org; Oksanen et al., 2013; Warnes et al., 2013). Hierarchical clustering analyses on the community composition and environmental variables were performed using the “hclust” function with the “euclidean” distance measure and the “complete” agglomeration method from the stats R package (R Core Team, 2014, http://www.R-project.org).
Metagenomic Analyses and Data Processing
Metagenomic shotgun libraries of 45 samples from eight stations were constructed using the Nextera DNA library prep kit (Illumina, San Diego, CA). The libraries were sequenced on the Illumina HiSeq 2000 platform (Illumina Inc., San Diego, CA, USA) according to the manufacturer's protocol in the Biosciences Core Laboratory (BCL) at King Abdullah University of Science and Technology (KAUST). After removing the adapters, sequences were 93 bp in length and an average of 10 million reads per sample were generated (Table S3 and Thompson et al., 2016). Raw Illumina metagenomic reads were trimmed using Trimmomatic (Bolger et al., 2014) and PhiX contamination was removed using Bowtie 2 (Langmead and Salzberg, 2012). Error correction was performed by SPAdes 3.5.0 (Nurk et al., 2013) and ribosomal contamination was removed by SortMeRNA (Kopylova et al., 2012).
The 45 metagenomes were analyzed for relative abundance of Prochlorococcus taxonomic groups using GraftM v0.6.3 (http://github.com/geronimp/graftM); a hidden Markov model (HMM) was used with pplacer (Matsen et al., 2010) to identify and classify rpoC1 and 16S rRNA reads to the phylogenetic level with the highest resolution. We retrieved 73,931 Prochlorococcus rpoC1 reads and 13,821 16S rRNA reads from the metagenomes with an average of 1643 and 307 reads per metagenome, respectively. Firstly, we built custom-made reference packages specifically targeting the Prochlorococcus rpoC1 and 16S rRNA genes. These packages consisted of an alignment file with taxonomic information and a phylogenetic tree. HMM profiles were generated from the alignment file of the publicly available Prochlorococcus rpoC1 and 16S rRNA genes and the maximum-likelihood trees were constructed using MEGA v6.06 (Tamura et al., 2013) with 1000 iterations for bootstrapping. For rpoC1 sequences, correlation analyses, ordination plots with PCA calculations, variance partitioning analyses and hierarchical clustering analyses were generated with the R package (R Core Team, 2014, http://www.R-project.org; Oksanen et al., 2013; Warnes et al., 2013; Wei, 2013). For 16S rRNA gene sequences, boxplots were generated using the BoxPlotR package (Spitzer et al., 2014).
Nucleotide Sequences and Dataset Accession Numbers
The dataset generated by pyrosequencing for this study are available in the NCBI Sequence Read Archive under the accession number: SRP063380. The sequences of the rpoC1 OTUs reported in this study are available in the NCBI GenBank database under the following accession numbers: KT585635-KT585672 and KX345257-KX345280. Metagenomic reads used in this study are available in the NCBI Sequence Read Archive under the following accession numbers: SRR2102994-SRR2103038.
Results
Environmental Conditions at Sampling Sites
Seawater samples were collected at depths of 10, 25, 50, 100, 200, and 500 m (or the deepest possible at shallower stations) from 45 stations spanning the main basin of the Red Sea. Among these, eight stations representative of the southern, central and northern regions were sampled for further metagenomic and nutrient analyses (Figure 1). For each of these eight stations, the same six depths were sampled with the exception of station twelve, where its depth permitted sampling from only the three shallowest depths. The in situ temperatures at the sampling sites ranged from 21.5 to 31.2°C and the salinity ranged from 37 to 40 psu. Oxygen levels ranged between 0.6 and 4.6 mg/L, and the surface layer of the water column was nutrient-poor relative to the deeper waters, as indicated by the increase in overall nutrient concentrations with increasing depth (Tables S1, S2).
Relative Abundance of Prochlorococcus in the Red Sea based on 16S rRNA Genes
Based on the metagenomes presented in this study, the relative abundance of Prochlorococcus 16S rRNA genes decreased with increasing depth: surface samples (10, 25, and 50 m) had an average of 9.1%, intermediate waters (i.e., 100 m) had 3% and deep-water samples (i.e., 200 and 500 m) had only a detectable 0.5% relative abundance of Prochlorococcus 16S rRNA genes (Figure 2).
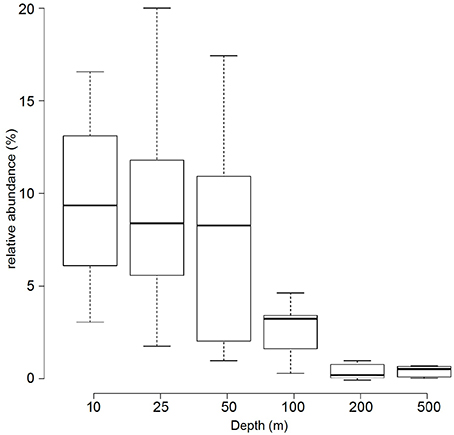
Figure 2. Relative abundance of Prochlorococcus 16S rRNA genes in metagenomic samples. The boxplot displays the relative abundance (%) of Prochlorococcus according to 16S rRNA gene fragment recruitment at different depths from the 45 sequenced metagenomes. Center lines show the medians; box limits indicate the 25th and 75th percentiles as determined by R software; whiskers extend the interquartile range from the 25th and 75th percentiles by 1.5 times.
Binning of rpoC1 Pyrotag Reads and Relative Abundances of the Bins
Grouping of 32,437 rpoC1 pyrotag sequences based on the reference database using MOTHUR resulted in four bins: “HL II,” “unclassified Prochlorococcus,” “unclassified HL,” and “unclassified LL.” The majority of reads (87%) belonged to “HL II,” 10% grouped as “unclassified Prochlorococcus,” and “unclassified HL” and “unclassified LL” made up 3 and 0.1%, respectively. All reads in all four bins matched Prochlorococcus using blastn and blastx (Altschul et al., 1990) against the NCBI database.
The relative proportions of these Prochlorococcus bins varied with depth, but these distribution patterns were consistent in water columns from the southern throughout the northern regions of the Red Sea (Figure 3). Bin “HL II” dominated the Prochlorococcus communities of surface water samples, but their relative abundance declined at 100 m as those of other bins increased. This surge in (micro)-diversity of Prochlorococcus ecotypes at 100 m depth is again followed by the occurrence of “HL II” in deeper waters, albeit at very low relative abundance.
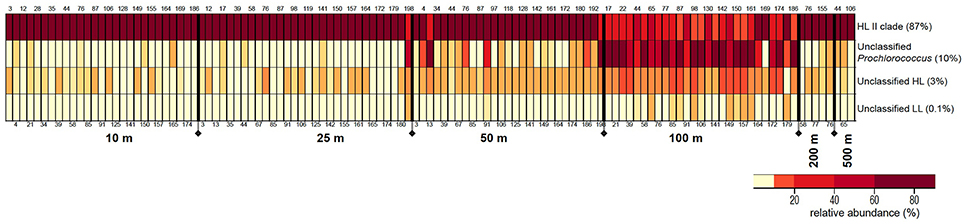
Figure 3. Distribution patterns of rpoC1 bins resulting from clustering analysis of pyrotag sequences in MOTHUR. The figure depicts relative abundances (%) of each Prochlorococcus rpoC1 bin in the samples along the different depths of the water column. The size of each bin (% of total sequences) is indicated next to it. Station numbers are displayed on the top and bottom of each column, arranged from south to north.
Phylogenetic Analysis of Highly Represented rpoC1 Pyrotag OTUs
In order to trim down the number of sequences for a detailed phylogenetic analysis, we set criteria to only include the most highly represented OTUs. These 38 selected OTUs (out of a total of 3935) came from only two out of the four bins: “HL II” (34), and “unclassified Prochlorococcus” (4). The number of sequences contained by each OTU varied and these results are displayed on the tree next to their respective accession number. The OTUs from bin “HL II” (34) clustered close to reference sequences of the HL II ecotype, and the four OTUs from bin “unclassified Prochlorococcus” fell within the LL clade (Figure 4). One of these four OTUs clustered within the LL II/III ecotype, whereas the others formed separate sequence clusters (Figure 4). Seven OTUs that were binned within “HL II” formed a separate branch distinct but closely related to HL II reference sequences. We designated this cluster as “C10” in continuation of the classification scheme used by Kashtan et al. (2014). One OTU of this group in particular (OTU15; KT585649) appeared to be relatively more represented than any other at 500 m (Figure S3).
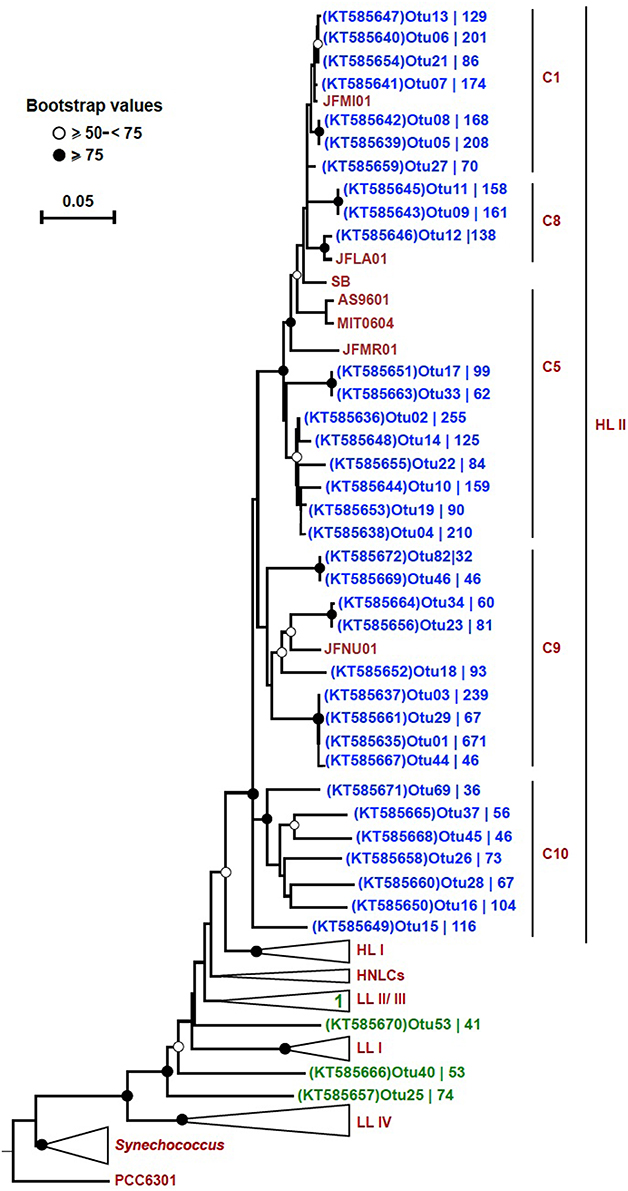
Figure 4. Neighbor-joining tree of 38 highly represented rpoC1 OTUs. The phylogenetic tree was constructed using the p-distance model and 1000 bootstrap replicates. Reference sequences were obtained from ~50 Prochlorococcus and 10 Synechococcus strains (CC9311, CC9902, CC9605, RCC307, RS9916, RS9917, WH5701, WH7803, WH7805, and WH8102). All 38 OTUs (blue: “HL II” and green: “unclassified Prochlorococcus”) from this study are shown on the tree except for “OTU31 (KT585662),” which fell within the collapsed LL II/III ecotypes. Bootstrap values are indicated on each node by symbols, and the scale bar indicates estimated sequence divergence. The outgroup used on the tree is the rpoC1 sequence of the Synechococcus elongatus strain PCC6301. The branches representing major clades of Prochlorococcus with reference sequences are collapsed (except for HL II) to facilitate visualization. The branch labels (C1, C8, C5, and C9) within the HL II clade are based on Kashtan et al. (2014). C10 refers to a group of sequences that were preliminary binned in “HL II,” but did not cluster together with any reference sequences. The accession number of each OTU and the number of sequences contained in them is shown.
The relative abundance of each of the 38 OTUs across all samples is displayed in Figure S3. While the four LL OTUs were mostly restricted to 100 m samples, the HL II-affiliated OTUs were spread out across all other sampled depths. The distribution of OTUs within different regions of the Red Sea was homogeneous and did not follow an obvious biogeographical pattern.
Phylogenetic Analysis of OTUs in Bins “Unclassified HL” and “Unclassified Prochlorococcus”
While the large majority of OTUs (3367) were binned in “HL II,” 458 and 105 OTUs were grouped in bins “unclassified Prochlorococcus” and “unclassified HL,” respectively. As their phylogenetic position might be of interest, we analyzed those OTUs with a minimum of 10 reads further, despite not being very abundant and not meeting our criteria for highly represented OTUs as described above. Only 5 OTUs were binned in “unclassified LL.” These OTUs contained less than 10 reads each and were therefore excluded from the analysis. OTUs grouped as “unclassified HL” based on the analysis in MOTHUR as presented in Figure 3, clustered either among HL II or LL clades (Figure S4). Most of those OTUs had their highest representation at 50 m and four had their highest representation in the 100 m samples (Figure S5). These four OTUs were phylogenetically closely related to LL reference sequences and clearly represent LL ecotypes that were misclassified in the binning algorithm. OTUs grouped as “unclassified Prochlorococcus” clustered exclusively among reference sequences of LL clades (Figure S4) and had their highest representation at 100 m (Figure S5) and represent LL ecotypes.
Prochlorococcus rpoC1 Microdiversity and Distribution
According to the Shannon index, the Chao1 estimator and observed OTUs (Sobs), the alpha diversity metrics of the pyrotag dataset varied at different depths. Samples from the surface (10, 25, and 50 m) had the highest values for the Chao1 nonparametric estimator of richness (3100, 3500, and 3200, respectively) and for Shannon evenness (6.9, 6.9, and 7, respectively). Among the deeper waters (100, 200, and 500 m), the 100 m samples had both, the highest richness (1600), and evenness (6.55) values. The Chao1 richness estimator was higher for 200 m (1000) than for 500 m (750), while the Shannon index of evenness was higher at 200 m (4.9) than at 500 m (5.4). In surface samples, the number of observed OTUs ranged from 2125–2500 to 1155 at 100 m to 187 at 200 m to 250 at 500 m (Figure S1).
Fragment Recruitment from Metagenomes and Correlations with Environmental Parameters
To circumvent the PCR-bias that may result from the amplification and pyrosequencing of the rpoC1 gene, we analyzed Prochlorococcus populations based on rpoC1 sequences retrieved from metagenomes. Community composition based on the metagenomic reads and the pyrotag data showed a similar pattern, although the increased microdiversity of Prochlorococcus in the 100 m samples was less prevalent (Figure S6). The hierarchical clustering of the samples according to the rpoC1 metagenomic reads and pyrotags community structure shows a consistent divergent clustering of Prochlorococcus communities in surface waters (10, 25, 50 m) and 100 m samples. Deep-water samples (200, 500 m) clustered within the surface samples based on the pyrotag community structure, but formed a separate cluster with the metagenome recruits (Figure S7). Principal component analysis (PCA) was used to generate ordination plots to visualize the relationship between environmental parameters and the community structure of Prochlorococcus in the water column. For the metagenome recruits, one plot includes all stations and depths where PC1 explains 88.64% of the variation while the other concentrates on surface samples (10, 25, and 50 m) where PC1 explains 92.8% of the variation (Figure 5). There was no clear difference in the community structure of coastal or open-water samples in terms of their correlation with physicochemical properties. Generally, the samples clustered according to their depth, although the 100 m samples did not cluster very closely and were spread out between surface and deeper samples (Figure 5A). Partitioning of samples from 200 to 500 m is suggestive of a strong correlation with high salinity and high levels of nitrate, phosphate and silicate (Figure 5A). Based on the pyrotag data, the deep-water samples displayed different partitioning by clustering within the surface samples, but still correlated strongly with the nutrients (Figure S8A). With both methods, surface samples showed no clear geographical pattern and temperature appeared to influence their distribution more than nutrient levels (nitrate, phosphate and silicate). The presence of unclassified groups positively correlated with nitrate, phosphate, silicate and Chl a concentrations but negatively correlated with temperature and oxygen levels (Figure 5B and Figure S8B). The correlation matrix showed that the HL II ecotype was positively correlated to temperature (R2 = 0.71, p ≤ 0.05) and oxygen (R2 = 0.48, p ≤ 0.05) but negatively correlated to nutrients (p ≤ 0.05) while LL ecotypes showed a strong positive correlation with Chl a concentration (p ≤ 0.05) (Figure S9). The highest percent of variance explained was by the overlapping effects of salinity and temperature (20.2%) as well as salinity and oxygen (18.5%), followed by the four factors combined (10.7%) (Figure S10A). In contrast, for the pyrotag data, different combinations of factors displayed the highest percent of variance explained; 28.9% for temperature and chlorophyll a followed by temperature alone (18.8%) and then temperature in combination with salinity (7.1%) (Figure S10B).
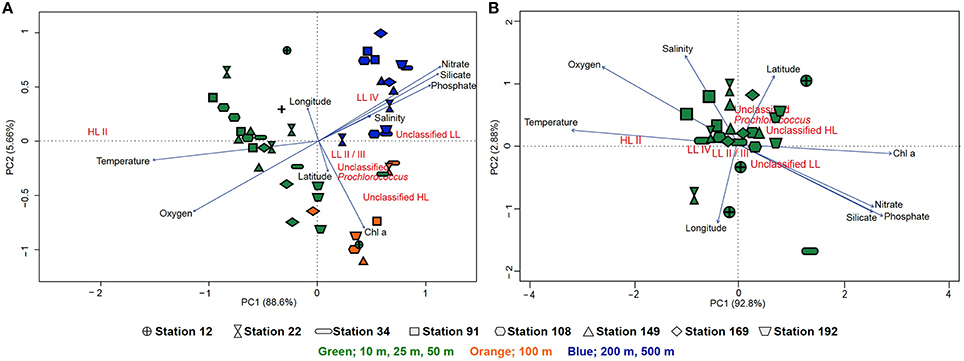
Figure 5. Principal component analysis of the Prochlorococcus population based on the rpoC1 reads recruited from the metagenomes via GraftM. (A) Ordination plot of physicochemical parameters and the community structure of Prochlorococcus from all stations and depths. (B) Ordination plot of physicochemical parameters and the community structure of Prochlorococcus from only surface samples (10, 25, and 50 m). The lengths of the lines represent the strength of the correlation, symbols indicate the different stations (arranged from south to north) from which the metagenomic samples were obtained and colors indicate depth (green: 10, 25, and 50 m, orange: 100 m and blue: 200–500 m) where samples were collected.
Discussion
Prochlorococcus is one of the most important primary producers in marine ecosystems (Partensky et al., 1999). The diversity and distribution of Prochlorococcus ecotypes depends on the physicochemical properties of the water column (Ferris and Palenik, 1998; West and Scanlan, 1999). Therefore, increasing seawater temperatures, as a result of climate change, might alter the biogeography of these communities. The Red Sea with its warm and saline waters provides an exciting opportunity to investigate how Prochlorococcus communities might change with increasingly harsh environmental conditions. Ngugi et al. (2011) analyzed the surface bacterial diversity of the northern and central Red Sea using 16S rRNA sequences and reported the predominance of HL Prochlorococcus (and SAR11) OTUs, but there is a lack of information on the community composition of Prochlorococcus across the whole main basin using data analyses that are based on the wide range of currently available cultured representatives and genomes. Community analyses of picophytoplankton were conducted in the neighboring Gulf of Aqaba (Lindell and Post, 1995; Fuller et al., 2005). Being much narrower and shorter than the main basin, the Gulf of Aqaba experiences stronger mixing patterns and drastic changes in nutrient concentrations throughout its water column (Badran, 2001; Rasul and Stewart, 2015). Previous studies in the Gulf of Aqaba also focused on seasonal dynamics of picophytoplankton (Al-Najjar et al., 2007; Post et al., 2011) or clone libraries of marker genes to explore the diversity of Synechococcus (Fuller et al., 2003; Lindell et al., 2005; Mühling et al., 2005). Here, we fill the gap on the lack of knowledge on Prochlorococcus across the main basin of the Red Sea by using pyrotag sequencing of the rpoC1 marker gene, which is able to highly resolve Prochlorococcus communities into subclades (Palenik, 1994; Toledo and Palenik, 1997; Ferris and Palenik, 1998). In addition, we apply shotgun metagenomic sequencing to bypass the bias introduced by PCR-based methods.
In a previous study from the northern Red Sea, taxonomic classification of bacterial 16S rRNA pyrotags from 10 m samples collected in spring (March) indicated a relative abundance of Prochlorococcus of 18% (Ngugi et al., 2011). Here, a fragment recruitment analysis based on 16S rRNA genes from metagenomes of samples collected in fall (September/October) showed that surface samples (10, 25, and 50 m) had a relative abundance of Prochlorococcus of 9%, which decreased over depth (100–200 m), and was still detectable at 500 m (Figure 2), The vertical distribution is in good agreement with previous studies from different marine environments (Johnson et al., 2006; Zwirglmaier et al., 2008). The difference of our data with (Ngugi et al., 2011) might reflect season effects and/or biases of the different methodological approaches. In general, most of the Prochlorococcus communities in this study were dominated by organisms related to the HL clade. The HL clade is divided into subpopulations based on their genomic backbone (Kashtan et al., 2014) or phylogenetic placement and association with physicochemical parameters (Larkin et al., 2016). The pyrotag data presented in this study show a predominance of sequences from the HL II ecotype in the water column. The HL II ecotype has been described to be abundant in tropical oceans with strongly stratified waters (Bouman et al., 2011), similar to the conditions in the Red Sea. While the binning and preliminary classification worked well for HL II sequences, the resolution and accuracy of the placement of non-HL II sequences in the three other bins (“unclassified Prochlorococcus, unclassified HL, unclassified LL”) was less satisfactory, due to the lack of representative sequences. All OTUs in the “unclassified Prochlorococcus” and some OTUs in the “unclassified HL” bins were represented most strongly at 100 m and represent LL ecotypes.
The high representation of HL and LL ecotypes at 100 m at all stations supports the hypothesis that this particular niche may support the stable co-occurrence of distinct Prochlorococcus subpopulations (Figures S3, S5, S6). Environmental conditions, including light irradiances, at 100 m are likely to result in similar fitness levels of both HL and LL cells, reflected by the strong correlation of HL clades with temperature and weak correlation with Chl a concentration, but a weak correlation of LL clades with temperature and strong correlation with Chl a concentration (Figure S9). The co-occurrence of HL and LL clades at intermediate depths (i.e., 100 m) has been reported before in several ocean bodies, and most likely reflects natural transition zones for high-light and low-light clades. Additional factors that might add to this pattern are deep-mixing events (West and Scanlan, 1999), seasonal physical perturbations (Penno et al., 2006), down-welling of surface waters (Garczarek et al., 2007), or the ability of HL-adapted Prochlorococcus populations to respond rapidly to changes in irradiance (Malmstrom et al., 2010).
Sequences from the HL II ecotype were less represented at 100 m, but were present again at 200 m and 500 m (Figure 3). Despite its typically greater abundance in the photic zones of water masses (Partensky et al., 1999), Prochlorococcus HL II has also been reported in the aphotic zone of the Western Pacific (Jiao et al., 2013). Similarly, Prochlorococcus and Synechococcus were recently reported in all mesopelagic (i.e., ~600 m) metagenomic samples collected across oceans globally (Sunagawa et al., 2015). Their presence in deeper waters may be attributed to attachment to sinking aggregates, rather than a physiological adaptation to the aphotic zone, ultimately providing deeper layers of the water column with an energy source (Lochte and Turley, 1988).
Phylogenetic Affiliation of Highly Represented rpoC1 OTUs
We could confirm that the rpoC1 gene marker reflects the established genetic microdiversity and phylogeny of Prochlorococcus based on ITS sequences, as shown in the respective phylogenetic trees (Figure S2). From the 38 unique OTU sequences used for phylogenetic inference, 27 clustered together with reference sequences of the HL II clade. Seven OTUs that were classified as “HL II” formed a separate branch closely related to HL II sequences that we designated as C10 in continuation of the classification scheme used by Kashtan et al. (2014). In a previous study in the Red Sea (Shibl et al., 2014), we detected HL VI in low proportions at 100 m based on ITS sequences, but because there are no rpoC1 reference sequences for this group, we cannot confirm that C10 represents the HL VI ecotype. Still, based on the phylogenetic position of this cluster, distinct from reference sequences of HL II (Figure 4), and our previous ITS data, we suspect that these seven OTUs might belong to HL VI. The HL VI ecotype, which was discovered in the South China Sea based on ITS sequences that cluster closely to those of HL II (Huang et al., 2012), had maximum relative abundance at 100 m in the Western Pacific (Jiao et al., 2013). In addition, some “unclassified HL” OTUs with lower abundance formed a separate cluster from reference sequences and C10, corroborating the likely presence of another HL-adapted population in the water column (Figure S4).
Cultured isolates and genome sequences of the Prochlorococcus LL clade are relatively poorly represented in databases, although some studies have unraveled putative novel lineages that occupy deeper regions of different oceans (Martiny et al., 2009; Lavin et al., 2010; Huang et al., 2012). In our dataset, four highly represented OTUs (from 38) were affiliated with the LL clade, one of which clustered within the LL II/III ecotype, while three formed monophyletic branches (Figure 4). Similar to these four OTUs, 12 “unclassified Prochlorococcus” and four “unclassified HL” OTUs with lower sequence coverage were distributed among the LL clade (Figure S4). All of these LL-affiliated and “unclassified Prochlorococcus” OTUs had their highest representation at 100 m (Figures S3, S5), represent LL ecotypes, and contribute to the diversity at this depth. No rpoC1 reference sequences are publically available from novel LL ecotypes that were purely defined based on ITS sequences (Martiny et al., 2009; Lavin et al., 2010). However, previous identification of ITS clones from the Red Sea that affiliated with the non-cultured group (NC1; Shibl et al., 2014) suggests that some rpoC1 OTUs in the LL clade reported in this study could be attributed to NC1. It has already been suggested that NC1 is polyphyletic (Martiny et al., 2009), which could explain the occurrence of several independent branches in the tree (Figure 4).
Correlation of Distribution Patterns of Prochlorococcus with Environmental Parameters
The slow influx of waters from the Strait of Bab Al Mandab (south) and the Gulf of Aqaba (north) appears to have a negligible influence on the distribution pattern of Prochlorococcus ecotypes across the water column in the surface southern, central and northern regions. The Prochlorococcus community composition in the Red Sea is highly similar among all sampled water columns, however varies according to depth (Figure S6). The Prochlorococcus community structure of surface samples and 100 m samples cluster separately in both, pyrotag data and metagenome data (Figures S7A,C). A difference between the two datasets was observed in the placement of the deep-water samples, which clustered among the surface samples (pyrotag data), or separately from surface and 100 m samples (metagenome recruits). Clustering of our samples from both datasets according to the prevailing physicochemical parameters shows a clear structuring according to depths, separated into surface, 100 m, and deep-water samples (Figures S7B,D). In all cases, the AGNES agglomerative coefficient value (Kaufman and Rousseeuw, 2009) that measures separation between clusters was high, but clearly additional data and more sampling points will result in a higher resolution.
As shown with both datasets, the Prochlorococcus community composition of the 100 m samples correlated well with chlorophyll, where the taxonomic composition could be a feature of the deep chlorophyll maximum layer at this depth (Figure 5A and Figure S8A). Most of the surface samples (10, 25, and 50 m) clustered together with no distinct biogeographical pattern, indicative of the homogeneity of the Prochlorococcus community in the surface waters of the Red Sea (Figure 5B and Figure S8B). A few outliers collected from southern stations were an exception, where the influx of a foreign water mass from the Indian Ocean (Churchill et al., 2015) may have affected the community.
Conclusions
In this study, we expand the knowledge of the niche partitioning of HL and LL adapted Prochlorococcus populations in the basin of the understudied oligotrophic Red Sea, which is characterized by warm and saline waters. To elucidate the microdiversity within the genus, we applied 454-pyrotag sequencing and fragment recruitments of metagenomes using the marker gene rpoC1 from coastal and open-water samples. The methods used in this study provide a robust water-column dataset to address the diversity and distribution of Prochlorococcus ecotypes throughout the Red Sea. Results indicated a high microdiversity of Prochlorococcus ecotypes at 100 m relative to other sampled depths in the water column. The detected microdiversity of Prochlorococcus ecotypes and their distribution across the same depths of different geographical locations within the Red Sea seems homogenous. Phylogenetic analysis of highly represented rpoC1 OTUs revealed a dominance of HL II in addition to genotypes that could belong to recently identified ecotypes of the HL and LL clades. Community profiling and quantitative analysis of rpoC1 relative gene abundance from 45 metagenomes revealed the clustering of samples according to depth and a strong relationship between ecotypic distribution and temperature and oxygen levels. More reference sequences belonging to less abundant ecotypes will allow for a higher phylogenetic resolution and more accurate classification of pyrotags and metagenomic reads. Combinatorial effects of measured environmental parameters and additional parameters that were not captured in this study seem to influence the overall Prochlorococcus distribution in the Red Sea. Additional representative genomes from the Red Sea and more sensitive molecular tools will aid in detecting possible subtle population differences such as single-nucleotide variations, and might reveal a higher microdiversity within populations.
Author Contributions
AS collected the samples, did the DNA extractions, ran the analyses, and wrote the first draft. MH was responsible for the metagenomic analyses, helped with other bioinformatics tasks, and edited the paper. DN helped with all bioinformatics tasks, and edited the paper. LT collected the samples, did the DNA extractions, optimized PCR protocols and edited the paper. US initiated the study, and edited the paper. All authors approved the final version of the manuscript.
Conflict of Interest Statement
The authors declare that the research was conducted in the absence of any commercial or financial relationships that could be construed as a potential conflict of interest.
Acknowledgments
We thank AbdulAziz Al-Suwailem and the scientists, captain and crew of the R/V Aegaeo from the KAUST Red Sea Expedition 2011, the Coastal and Marine Resources Core Lab (CMRC) and the Biosciences Core Laboratory (BCL) at KAUST for their logistical and technical support. We also thank Benjamin Woodcroft and Joel Boyd for their help with GraftM. This study was supported by the SABIC Career Development Chair from KAUST to US.
Supplementary Material
The Supplementary Material for this article can be found online at: http://journal.frontiersin.org/article/10.3389/fmars.2016.00104
Table S1. Overview of the physicochemical characteristics of stations sampled for metagenomic shotgun sequencing and analysis during the KAUST Red Sea Expedition (KRSE) in 2011.
Table S2. Overview of the physicochemical characteristics of all the stations and depths sampled during the KAUST Red Sea Expedition (KRSE) in 2011.
Table S3. Overview of the numbers of raw reads and reads after quality control (QC reads) for each metagenomic sample used in this study.
Figure S1. Alpha diversity indices of the six sampled depths from stations sampled for pyrotag sequencing. (A) Community richness was estimated using the number of observed OTUs and the Chao1 estimator. Community diversity was calculated using the Shannon index. Analyses were performed and the results are plotted in the R environment (R Core Team, 2014, www.R-project.org). (B) Rarefaction curve based on the observed OTUs (Sobs). (C) Rarefaction curve based on the Good's coverage for the pyrotags. Both curves were generated using the MOTHUR software package (Schloss et al., 2009).
Figure S2. Phylogenetic trees for Prochlorococcus and Synechococcus reference sequences of ITS and rpoC1 generated using MEGA (Tamura et al., 2013). (A) Neighbor-joining tree of 16S-23S rRNA ITS sequences constructed using p-distance and 1000 bootstrap iterations. Sequences were retrieved from all lineages available to date that represent the major phylogenetic ecotypes of Prochlorococcus and 10 Synechococcus strains (CC9311, CC9902, CC9605, RCC307, RS9916, RS9917, WH5701, WH7803, WH7805, and WH8102). The HL II branch contains ITS sequences obtained from the 96 single-cells sequenced by Kashtan et al. (2014) is collapsed for easier representation, as is the Synechococcus branch. Solid black circles represent bootstrap values higher than 80% and the scale bar indicates estimated sequence divergence. Accession numbers for ITS sequences of strains that do not have a sequenced genome are shown in brackets. The Synechococcus elongatus strain PCC6301 was used as the outgroup. (B) Neighbor-joining tree of rpoC1 sequences constructed using p-distance and 1000 bootstrap iterations. The sequences were retrieved from all lineages available to date that represent the major phylogenetic clades of Prochlorococcus and 10 Synechococcus strains (CC9311, CC9902, CC9605, RCC307, RS9916, RS9917, WH5701, WH7803, WH7805, and WH8102). The HL II branch contains rpoC1 sequences obtained from the 96 single-cells sequenced by Kashtan et al. (2014) and is collapsed for easier representation, as is the Synechococcus branch. Solid black circles represent bootstrap values greater than 80% and the scale bar indicates estimated sequence divergence. Accession numbers for rpoC1 sequences of strains that do not have a sequenced genome are shown in brackets. The Synechococcus elongatus strain PCC6301 was used as the outgroup.
Figure S3. Heat map of the distribution of abundance for the highly represented 38 rpoC1 OTUs that were found a minimum of two times in at least 5% of our samples. The hierarchical clustering of the sampled stations and depths are shown on the left side of the map. The colors of the fonts denote OTUs that belong to the “HL II” (blue) and “unclassified Prochlorococcus” (green). The bracket on the right side highlights the clustering of 100 m samples where OTUs of the bin “unclassified Prochlorococcus” were mostly detected. The heat map was generated in the R environment (R Core Team, 2014, www.R-project.org).
Figure S4. Neighbor-joining tree of highly represented OTUs (see Figure 4), as well as OTUs that belong to the “unclassified Prochlorococcus” (green fonts) and the “unclassified HL” bins (violet fonts). The phylogenetic tree was constructed using the p-distance model and 1000 bootstrap replicates. Reference sequences were obtained from ~50 Prochlorococcus and 10 Synechococcus strains (CC9311, CC9902, CC9605, RCC307, RS9916, RS9917, WH5701, WH7803, WH7805, and WH8102). Bootstrap values are indicated on each node by symbols, and the scale bar indicates estimated sequence divergence. The outgroup used on the tree is the rpoC1 sequence of the Synechococcus elongatus strain PCC6301. Branches representing major clades of Prochlorococcus that do not contain any OTUs from this study are collapsed. The branch labels (C1, C8, C5, and C9) within the HL II clade are based on Kashtan et al. (2014). C10 refers to a group of sequences that were preliminary binned in “HL II,” but did not cluster together with any reference sequences. Accession numbers and the number of sequences contained in each OTU are shown.
Figure S5. Heat map of the relative abundances for selected rpoC1 OTUs that belong to the “unclassified Prochlorococcus” group (green) and the “unclassified HL” group (violet). Each column displays the relative abundance of a given OTU, labeled by station number and depth. The heat map was generated in the R environment (R Core Team, 2014, www.R-project.org).
Figure S6. Prochlorococcus community structure in the water column of the Red Sea according to (A) recruited rpoC1 metagenomic reads and (B) rpoC1 pyrotag reads. The x-axis displays the station numbers from north to south and depths. The red box highlights the samples from 100 m where a higher number of LL-affiliated reads were retrieved, forming a co-occurrence with HL-affiliated reads.
Figure S7. Hierarchical clustering of different stations with respect to their community composition and environmental variables using both datasets, metagenome recruits (A, B) and pyrotags (C, D). The clustering method “complete” and the “Euclidean” distance measure were used in the analyses. The AGNES agglomerative coefficient (0-1) measures separation between clusters. Branch colors indicate depth (green: 10, 25, and 50 m, orange: 100 m and blue: 200–500 m) from which samples were collected.
Figure S8. Principal component analysis of the Prochlorococcus population based on rpoC1 pyrotags. (A) Ordination plot of physicochemical parameters and the community structure of Prochlorococcus from all stations and depths. (B) Ordination plot of physicochemical parameters and the community structure of Prochlorococcus from surface samples only (10, 25, and 50 m). The lengths of the lines represent the strength of the correlation, numbers indicate the different stations and colors indicate depth (green: 10, 25, and 50 m, orange: 100 m and blue: 200–500 m) where samples were collected.
Figure S9. Correlation matrix for Prochlorococcus ecotypes based on the rpoC1 reads recruited from the metagenomes and environmental parameters with color-keyed correlation coefficients, r, displaying positive correlations in blue and negative correlations in red. The size and color intensity of each circle is proportional to the strength of the correlation. The p-values according to Spearman's rank are indicated in the squares where 0 = < 0.0001. All values of the environmental parameters were log10 transformed and the correlation matrix was calculated and visualized using the corrplot package in the R environment.
Figure S10. Venn diagrams for rpoC1 sequences based on (A) reads from metagenomic data and (B) pyrotag data showing the percent of variance explained by temperature, salinity, oxygen and chlorophyll a as well as the overlapping effects of each pair of factors. The amount of variation not explained by the complete model (i.e., residuals) is also provided. The “varpart” function is based on redundancy analysis (rda) and uses adjusted R2 to express explained variation.
References
Al-Najjar, T., Badran, M. I., Richter, C., Meyerhoefer, M., and Sommer, U. (2007). Seasonal dynamics of phytoplankton in the Gulf of Aqaba, Red Sea. Hydrobiologia 579, 69–83. doi: 10.1007/s10750-006-0365-z
Altschul, S. F., Gish, W., Miller, W., Myers, E. W., and Lipman, D. J. (1990). Basic local alignment search tool. J. Mol. Biol. 215, 403–410. doi: 10.1016/S0022-2836(05)80360-2
Badran, M. I. (2001). Dissolved oxygen, chlorophyll a and nutrients: seasonal cycles in waters of the Gulf of Aquaba, Red Sea. Aquat. Ecosyst. Health Manag. 4, 139–150. doi: 10.1080/14634980127711
Biller, S. J., Berube, P. M., Berta-Thompson, J. W., Kelly, L., Roggensack, S. E., Awad, L., et al. (2014). Genomes of diverse isolates of the marine cyanobacterium Prochlorococcus. Sci. Data 1:140034. doi: 10.1038/sdata.2014.34
Biller, S. J., Berube, P. M., Lindell, D., and Chisholm, S. W. (2015). Prochlorococcus: the structure and function of collective diversity. Nat. Rev. Microbiol. 13, 13–27. doi: 10.1038/nrmicro3378
Bolger, A. M., Lohse, M., and Usadel, B. (2014). Trimmomatic: a flexible trimmer for Illumina sequence data. Bioinformatics 30, 2114–2120. doi: 10.1093/bioinformatics/btu170
Bouman, H. A., Ulloa, O., Barlow, R., Li, W. K., Platt, T., Zwirglmaier, K., et al. (2011). Water-column stratification governs the community structure of subtropical marine picophytoplankton. Environ. Microbiol. Rep. 3, 473–482. doi: 10.1111/j.1758-2229.2011.00241.x
Brewin, R. J., Raitsos, D. E., Pradhan, Y., and Hoteit, I. (2013). Comparison of chlorophyll in the Red Sea derived from MODIS-Aqua and in vivo fluorescence. Remote Sens. Environ. 136, 218–224. doi: 10.1016/j.rse.2013.04.018
Brown, M., and Fuhrman, J. (2005). Marine bacterial microdiversity as revealed by internal transcribed spacer analysis. Aquat. Microb. Ecol. 41, 15–23. doi: 10.3354/ame041015
Chao, A. (1984). Nonparametric estimation of the number of classes in a population. Scand. J. Stat. 11, 265–270.
Chisholm, S. W., Frankel, S. L., Goericke, R., Olson, R. J., Palenik, B., Waterbury, J. B., et al. (1992). Prochlorococcus marinus nov. gen. nov. sp.: an oxyphototrophic marine prokaryote containing divinyl chlorophyll a and b. Arch. Microbiol. 157, 297–300. doi: 10.1007/BF00245165
Chisholm, S. W., Olson, R. J., Zettler, E. R., Goericke, R., Waterbury, J. B., and Welschmeyer, N. A. (1988). A novel free-living prochlorophyte abundant in the oceanic euphotic zone. Nature 334, 340–343. doi: 10.1038/334340a0
Churchill, J. H., Bower, A. S., McCorkle, D. C., and Abualnaja, Y. (2015). The transport of nutrient-rich Indian Ocean water through the Red Sea and into coastal reef systems. J. Mar. Res. 72, 165–181. doi: 10.1357/002224014814901994
Da Silva, A., Young, C., and Levitus, S. (1994). Algorithms and Procedures. Vol. 1, Atlas of Surface Marine Data 1994. NOAA Atlas NESDIS 6, 83.
Duarte, C. M. (2014). Global change and the future ocean: a grand challenge for marine sciences. Front. Mar. Sci. 1:63. doi: 10.3389/fmars.2014.00063
Edgar, R. C., Haas, B. J., Clemente, J. C., Quince, C., and Knight, R. (2011). UCHIME improves sensitivity and speed of chimera detection. Bioinformatics 27, 2194–2200. doi: 10.1093/bioinformatics/btr381
Edwards, F. J. (1987). “Climate and oceanography,” in Red Sea, eds S. M. Head and A. J. Edwards (Oxford: Pergamon Press), 45–69.
Ferris, M. J., and Palenik, B. (1998). Niche adaptation in ocean cyanobacteria. Nature 396, 226–228. doi: 10.1038/24297
Flombaum, P., Gallegos, J. L., Gordillo, R. A., Rincón, J., Zabala, L. L., Jiao, N., et al. (2013). Present and future global distributions of the marine Cyanobacteria Prochlorococcus and Synechococcus. Proc. Natl. Acad. Sci. U.S.A. 110, 9824–9829. doi: 10.1073/pnas.1307701110
Fuller, N. J., Marie, D., Partensky, F., Vaulot, D., Post, A. F., and Scanlan, D. J. (2003). Clade-specific 16S ribosomal DNA oligonucleotides reveal the predominance of a single marine Synechococcus clade throughout a stratified water column in the Red Sea. Appl. Environ. Microbiol. 69, 2430–2443. doi: 10.1128/AEM.69.5.2430-2443.2003
Fuller, N. J., West, N. J., Marie, D., Yallop, M., Rivlin, T., Post, A. F., et al. (2005). Dynamics of community structure and phosphate status of picocyanobacterial populations in the Gulf of Aqaba, Red Sea. Limnol. Oceanogr. 50, 363–375. doi: 10.4319/lo.2005.50.1.0363
Garczarek, L., Dufresne, A., Rousvoal, S., West, N. J., Mazard, S., Marie, D., et al. (2007). High vertical and low horizontal diversity of Prochlorococcus ecotypes in the Mediterranean Sea in summer. FEMS Microbiol. Ecol. 60, 189–206. doi: 10.1111/j.1574-6941.2007.00297.x
Giles, E. C., Saenz-Agudelo, P., Hussey, N. E., Ravasi, T., and Berumen, M. L. (2015). Exploring seascape genetics and kinship in the reef sponge Stylissa carteri in the Red Sea. Ecol. Evol. 5, 2487–2502. doi: 10.1002/ece3.1511
Goericke, R., and Repeta, D. J. (1993). Chlorophylls a and b and divinyl chlorophylls a and b in the open subtropical North Atlantic Ocean. Mar. Ecol. Prog. Ser. 101, 307–307. doi: 10.3354/meps101307
Gutiérrez-Rodríguez, A., Slack, G., Daniels, E. F., Selph, K. E., Palenik, B., and Landry, M. R. (2014). Fine spatial structure of genetically distinct picocyanobacterial populations across environmental gradients in the Costa Rica Dome. Limnol. Oceanogr. 59, 705–723. doi: 10.4319/lo.2014.59.3.0705
Hess, W. R., Rocap, G., Ting, C. S., Larimer, F., Stilwagen, S., Lamerdin, J., et al. (2001). The photosynthetic apparatus of Prochlorococcus: insights through comparative genomics. Photosynthesis Res. 70, 53–71. doi: 10.1023/A:1013835924610
Huang, S., Wilhelm, S. W., Harvey, H. R., Taylor, K., Jiao, N., and Chen, F. (2012). Novel lineages of Prochlorococcus and Synechococcus in the global oceans. ISME J. 6, 285–297. doi: 10.1038/ismej.2011.106
Jameson, E., Joint, I., Mann, N. H., and Mühling, M. (2008). Application of a novel rpoC1-RFLP approach reveals that marine Prochlorococcus populations in the Atlantic gyres are composed of greater microdiversity than previously described. Microb. Ecol. 55, 141–151. doi: 10.1007/s00248-007-9259-5
Jameson, E., Joint, I., Mann, N. H., and Mühling, M. (2010). Detailed analysis of the microdiversity of Prochlorococcus populations along a North-South Atlantic Ocean transect. Environ. Microbiol. 12, 156–171. doi: 10.1111/j.1462-2920.2009.02057.x
Jardillier, L., Zubkov, M. V., Pearman, J., and Scanlan, D. J. (2010). Significant CO2 fixation by small prymnesiophytes in the subtropical and tropical northeast Atlantic Ocean. ISME J. 4, 1180–1192. doi: 10.1038/ismej.2010.36
Jiao, N., Luo, T., Zhang, R., Yan, W., Lin, Y., Johnson, Z., et al. (2013). Presence of Prochlorococcus in the aphotic waters of the western Pacific Ocean. Biogeosci. Discuss. 10, 9345–9371. doi: 10.5194/bgd-10-9345-2013
Johnson, Z. I., Zinser, E. R., Coe, A., McNulty, N. P., Woodward, E. M. S., and Chisholm, S. W. (2006). Niche partitioning among Prochlorococcus ecotypes along ocean-scale environmental gradients. Science 311, 1737–1740. doi: 10.1126/science.1118052
Kashtan, N., Roggensack, S. E., Rodrigue, S., Thompson, J. W., Biller, S. J., Coe, A., et al. (2014). Single-cell genomics reveals hundreds of coexisting subpopulations in wild Prochlorococcus. Sci. 344, 416–420. doi: 10.1126/science.1248575
Kaufman, L., and Rousseeuw, P. J. (2009). Finding Groups in Data: An Introduction to Cluster Analysis, Vol. 344. New York, NY: John Wiley & Sons.
Kent, A. G., Dupont, C. L., Yooseph, S., and Martiny, A. C. (2016). Global biogeography of Prochlorococcus genome diversity in the surface ocean. ISME J. doi: 10.1038/ismej.2015.265. [Epub ahead of print].
Kettler, G. C., Martiny, A. C., Huang, K., Zucker, J., Coleman, M. L., Rodrigue, S., et al. (2007). Patterns and implications of gene gain and loss in the evolution of Prochlorococcus. PLoS Genet. 3:e231. doi: 10.1371/journal.pgen.0030231
Klinker, J., Reiss, Z., Kropach, C., Levanon, I., Harpaz, H., and Shapiro, Y. (1978). Nutrients and biomass distribution in the Gulf of Aqaba (Elat), Red Sea. Mar. Biol. 45, 53–64. doi: 10.1007/BF00388977
Kopylova, E., Noé, L., and Touzet, H. (2012). SortMeRNA: fast and accurate filtering of ribosomal RNAs in metatranscriptomic data. Bioinformatics 28, 3211–3217. doi: 10.1093/bioinformatics/bts611
Labiosa, R. G., Arrigo, K. R., Genin, A., Monismith, S. G., and van Dijken, G. (2003). The interplay between upwelling and deep convective mixing in determining the seasonal phytoplankton dynamics in the Gulf of Aqaba: evidence from SeaWiFS and MODIS. Limnol. Oceanogr. 48, 2355–2368. doi: 10.4319/lo.2003.48.6.2355
Langmead, B., and Salzberg, S. L. (2012). Fast gapped-read alignment with Bowtie 2. Nat. Methods 9, 357–359. doi: 10.1038/nmeth.1923
Larkin, A. A., Blinebry, S. K., Howes, C., Lin, Y., Loftus, S. E., Schmaus, C. A., et al. (2016). Niche partitioning and biogeography of high light adapted Prochlorococcus across taxonomic ranks in the North Pacific. ISME J. doi: 10.1038/ismej.2015.244. [Epub ahead of print].
Lavin, P., González, B., Santibánez, J., Scanlan, D. J., and Ulloa, O. (2010). Novel lineages of Prochlorococcus thrive within the oxygen minimum zone of the eastern tropical South Pacific. Environ. Microbiol. Rep. 2, 728–738. doi: 10.1111/j.1758-2229.2010.00167.x
Li, W. K. W. (1994). Primary productivity of prochlorophytes, cyanobacteria, and eucaryotic ultraphytoplankton: measurements from flow cytometric sorting. Limnol. Oceanogr. 39, 169–175. doi: 10.4319/lo.1994.39.1.0169
Lindell, D., Penno, S., Al-Qutob, M., David, E., Rivlin, T., Lazar, B., et al. (2005). Expression of the nitrogen stress response gene ntcA reveals nitrogen sufficient Synechococcus populations in the oligotrophic northern Red Sea. Limnol. Oceanogr. 50:1932. doi: 10.4319/lo.2005.50.6.1932
Lindell, D., and Post, A. F. (1995). Ultraphytoplankton succession is triggered by deep winter mixing in the Gulf of Aqaba (Eilat), Red Sea. Limnol. Oceanogr. 40, 1130–1141. doi: 10.4319/lo.1995.40.6.1130
Lochte, K., and Turley, C. M. (1988). Bacteria and cyanobacteria associated with phytodetritus in the deep sea. Nature 333, 67–69. doi: 10.1038/333067a0
Ma, Y., Jiao, N. Z., and Zeng, Y. H. (2004). Natural community structure of cyanobacteria in the South China Sea as revealed by rpoC1 gene sequence analysis. Lett. Appl. Microbiol. 39, 353–358. doi: 10.1111/j.1472-765X.2004.01588.x
Malmstrom, R. R., Coe, A., Kettler, G. C., Martiny, A. C., Frias-Lopez, J., Zinser, E. R., et al. (2010). Temporal dynamics of Prochlorococcus ecotypes in the Atlantic and Pacific oceans. ISME J. 4, 1252–1264. doi: 10.1038/ismej.2010.60
Malmstrom, R. R., Rodrigue, S., Huang, K. H., Kelly, L., Kern, S. E., Thompson, A., et al. (2013). Ecology of uncultured Prochlorococcus clades revealed through single-cell genomics and biogeographic analysis. ISME J. 7, 184–198. doi: 10.1038/ismej.2012.89
Martiny, A. C., Tai, A. P., Veneziano, D., Primeau, F., and Chisholm, S. W. (2009). Taxonomic resolution, ecotypes and the biogeography of Prochlorococcus. Environ. Microbiol. 11, 823–832. doi: 10.1111/j.1462-2920.2008.01803.x
Matsen, F. A., Kodner, R. B., and Armbrust, E. V. (2010). pplacer: linear time maximum-likelihood and Bayesian phylogenetic placement of sequences onto a fixed reference tree. BMC Bioinformatics 11:538. doi: 10.1186/1471-2105-11-538
Moore, L. R., Rocap, G., and Chisholm, S. W. (1998). Physiology and molecular phylogeny of coexisting Prochlorococcus ecotypes. Nature 393, 464–467. doi: 10.1038/30965
Morcos, S. A. (1970). Physical and chemical oceanography of the Red Sea. Oceanogr. Mar. Biol. Annu. Rev. 8:202.
Mühling, M., Fuller, N. J., Millard, A., Somerfield, P. J., Marie, D., Wilson, W. H., et al. (2005). Genetic diversity of marine Synechococcus and co-occurring cyanophage communities: evidence for viral control of phytoplankton. Environ. Microbiol. 7, 499–508. doi: 10.1111/j.1462-2920.2005.00713.x
Nanninga, G. B., Saenz-Agudelo, P., Manica, A., and Berumen, M. L. (2014). Environmental gradients predict the genetic population structure of a coral reef fish in the Red Sea. Mol. Ecol. 23, 591–602. doi: 10.1111/mec.12623
Ngugi, D. K., Antunes, A., Brune, A., and Stingl, U. (2011). Biogeography of pelagic bacterioplankton across an antagonistic temperature–salinity gradient in the Red Sea. Mol. Ecol. 21, 388–405. doi: 10.1111/j.1365-294X.2011.05378.x
Ngugi, D. K., and Stingl, U. (2012). Combined analyses of the ITS loci and the corresponding 16S rRNA genes reveal high micro- and macrodiversity of SAR11 populations in the Red Sea. PLoS ONE 7:e50274. doi: 10.1371/journal.pone.0050274
Nurk, S., Bankevich, A., Antipov, D., Gurevich, A. A., Korobeynikov, A., Lapidus, A., et al. (2013). Assembling single-cell genomes and mini-metagenomes from chimeric MDA products. J. Comput. Biol. 20, 714–737. doi: 10.1089/cmb.2013.0084
Oksanen, J., Blanchet, F. G., Kindt, R., Legendre, P., Minchin, P. R., O'Hara, R. B., et al. (2013). Package ‘Vegan’. Community Ecology Package, Version, 2(9).
Olson, R. J., Chisholm, S. W., Zettler, E. R., Altabet, M. A., and Dusenberry, J. A. (1990). Spatial and temporal distributions of prochlorophyte picoplankton in the North Atlantic Ocean. Deep Sea Res. Part A. Oceanogr. Res. Papers 37, 1033–1051. doi: 10.1016/0198-0149(90)90109-9
Palenik, B. (1994). Cyanobacterial community structure as seen from RNA polymerase gene sequence analysis. Appl. Environ. Microbiol. 60, 3212–3219.
Partensky, F., Hess, W. R., and Vaulot, D. (1999). Prochlorococcus, a marine photosynthetic prokaryote of global significance. Microbiol. Mol. Biol. Rev. 63, 106–127.
Partensky, F., Hoepffner, N., Li, W. K., Ulloa, O., and Vaulot, D. (1993). Photoacclimation of Prochlorococcus sp. (Prochlorophyta) strains isolated from the North Atlantic and the Mediterranean Sea. Plant Physiol. 101, 285–296.
Penno, S., Lindell, D., and Post, A. F. (2006). Diversity of Synechococcus and Prochlorococcus populations determined from DNA sequences of the N-regulatory gene ntcA. Environ. Microbiol. 8, 1200–1211. doi: 10.1111/j.1462-2920.2006.01010.x
Post, A. F., Penno, S., Zandbank, K., Paytan, A., Huse, S. M., and Welch, D. M. (2011). Long term seasonal dynamics of Synechococcus population structure in the Gulf of Aqaba, Northern Red Sea. Front. Microbiol. 2:131. doi: 10.3389/fmicb.2011.00131
Raitsos, D. E., Pradhan, Y., Brewin, R. J., Stenchikov, G., and Hoteit, I. (2013). Remote sensing the phytoplankton seasonal succession of the Red Sea. PLoS ONE 8:e64909. doi: 10.1371/journal.pone.0064909
Rasul, N. M., and Stewart, I. C. (eds.). (2015). The Red Sea: The Formation, Morphology, Oceanography and Environment of a Young Ocean Basin. Berlin: Springer-Verlag.
R Core Team (2014). R: A Language and Environment for Statistical Computing. Vienna: R Foundation for Statistical Computing.
Robitzch, V. S., Lozano-Cortés, D., Kandler, N. M., Salas, E., and Berumen, M. L. (2015). Productivity and sea surface temperature are correlated with the pelagic larval duration of damselfishes in the Red Sea. Mar. Pollut. Bull. 105, 566–574. doi: 10.1016/j.marpolbul.2015.11.045
Rocap, G., Distel, D. L., Waterbury, J. B., and Chisholm, S. W. (2002). Resolution of Prochlorococcus and Synechococcus ecotypes by using 16S-23S ribosomal DNA internal transcribed spacer sequences. Appl. Environ. Microbiol. 68, 1180–1191. doi: 10.1128/AEM.68.3.1180-1191.2002
Rocap, G., Larimer, F. W., Lamerdin, J., Malfatti, S., Chain, P., Ahlgren, N. A., et al. (2003). Genome divergence in two Prochlorococcus ecotypes reflects oceanic niche differentiation. Nature 424, 1042–1047. doi: 10.1038/nature01947
Rusch, D. B., Halpern, A. L., Sutton, G., Heidelberg, K. B., Williamson, S., Yooseph, S., et al. (2007). The Sorcerer II global ocean sampling expedition: northwest Atlantic through eastern tropical Pacific. PLoS Biol. 5:e77. doi: 10.1371/journal.pbio.0050077
Rusch, D. B., Martiny, A. C., Dupont, C. L., Halpern, A. L., and Venter, J. C. (2010). Characterization of Prochlorococcus clades from iron-depleted oceanic regions. Proc. Natl. Acad. Sci. U.S.A. 107, 16184–16189. doi: 10.1073/pnas.1009513107
Sawall, Y., Al-Sofyani, A., Kürten, B., Al-Aidaroos, A. M., Hoang Xuan, B., Marimuthu, N., et al. (2014). Coral communities, in contrast to fish communities, maintain a high assembly similarity along the large latitudinal gradient along the Saudi Red Sea coast. J. Ecosyst. Ecogr. 4, 1–7. doi: 10.4172/2157-7625.1000s4-003
Scanlan, D. J., Ostrowski, M., Mazard, S., Dufresne, A., Garczarek, L., Hess, W. R., et al. (2009). Ecological genomics of marine picocyanobacteria. Microbiol. Mol. Biol. Rev. 73, 249–299. doi: 10.1128/MMBR.00035-08
Scanlan, D. J., and West, N. J. (2002). Molecular ecology of the marine cyanobacterial genera Prochlorococcus and Synechococcus. FEMS Microbiol. Ecol. 40, 1–12. doi: 10.1111/j.1574-6941.2002.tb00930.x
Schattenhofer, M., Fuchs, B. M., Amann, R., Zubkov, M. V., Tarran, G. A., and Pernthaler, J. (2009). Latitudinal distribution of prokaryotic picoplankton populations in the Atlantic Ocean. Environ. Microbiol. 11, 2078–2093. doi: 10.1111/j.1462-2920.2009.01929.x
Schloss, P. D., Westcott, S. L., Ryabin, T., Hall, J. R., Hartmann, M., Hollister, E. B., et al. (2009). Introducing mothur: open-source, platform-independent, community-supported software for describing and comparing microbial communities. Appl. Environ. Microbiol. 75, 7537–7541. doi: 10.1128/AEM.01541-09
Shibl, A. A., Thompson, L. R., Ngugi, D. K., and Stingl, U. (2014). Distribution and diversity of Prochlorococcus ecotypes in the Red Sea. FEMS Microbiol. Lett. 356, 118–126. doi: 10.1111/1574-6968.12490
Spitzer, M., Wildenhain, J., Rappsilber, J., and Tyers, M. (2014). BoxPlotR: a web tool for generation of box plots. Nat. Methods 11, 121–122. doi: 10.1038/nmeth.2811
Steglich, C., Post, A. F., and Hess, W. R. (2003). Analysis of natural populations of Prochlorococcus spp. in the northern Red Sea using phycoerythrin gene sequences. Environ. Microbiol. 5, 681–690. doi: 10.1046/j.1462-2920.2003.00456.x
Sunagawa, S., Coelho, L. P., Chaffron, S., Kultima, J. R., Labadie, K., Salazar, G., et al. (2015). Structure and function of the global ocean microbiome. Science 348, 1261359. doi: 10.1126/science.1261359
Tai, V., and Palenik, B. (2009). Temporal variation of Synechococcus clades at a coastal Pacific Ocean monitoring site. ISME J. 3, 903–915. doi: 10.1038/ismej.2009.35
Tamura, K., Stecher, G., Peterson, D., Filipski, A., and Kumar, S. (2013). MEGA6: molecular evolutionary genetics analysis version 6.0. Mol. Biol. Evol. 30, 2725–2729. doi: 10.1093/molbev/mst197
Thompson, L. R., Williams, G. J., Haroon, M. F., Shibl, A., Larsen, P., Shorenstein, J., et al. (2016). Metagenomic covariation along densely sampled environmental gradients in the Red Sea. bioRxiv. doi: 10.1101/055012
Ting, C. S., Rocap, G., King, J., and Chisholm, S. W. (2002). Cyanobacterial photosynthesis in the oceans: the origins and significance of divergent light-harvesting strategies. Trends Microbiol. 10, 134–142. doi: 10.1016/S0966-842X(02)02319-3
Toledo, G., and Palenik, B. (1997). Synechococcus diversity in the California current as seen by RNA polymerase (rpoC1) gene sequences of isolated strains. Appl. Environ. Microbiol. 63, 4298–4303.
Urbach, E., Scanlan, D. J., Distel, D. L., Waterbury, J. B., and Chisholm, S. W. (1998). Rapid diversification of marine picophytoplankton with dissimilar light-harvesting structures inferred from sequences of Prochlorococcus and Synechococcus (Cyanobacteria). J. Mol. Evol. 46, 188–201. doi: 10.1007/PL00006294
Warnes, G. R., Bolker, B., Bonebakker, L., Gentleman, R., Huber, W., Liaw, A., et al. (2013). gplots: Various R Programming Tools for Plotting Data. R Package Version 2.12.(1)
Waterbury, J. B., Willey, J. M., Franks, D. G., Valois, F. W., and Watson, S. W. (1985). A cyanobacterium capable of swimming motility. Science 230, 74–76. doi: 10.1126/science.230.4721.74
Wei, T. (2013). Corrplot: Visualization of a Correlation Matrix. R Package Version 0.73. Available online at: http://CRAN.R-project.org/package=corrplot
West, N. J., Lebaron, P., Strutton, P. G., and Suzuki, M. T. (2011). A novel clade of Prochlorococcus found in high nutrient low chlorophyll waters in the South and Equatorial Pacific Ocean. ISME J. 5, 933–944. doi: 10.1038/ismej.2010.186
West, N. J., and Scanlan, D. J. (1999). Niche-partitioning of Prochlorococcus populations in a stratified water column in the eastern North Atlantic Ocean. Appl. Environ. Microbiol. 65, 2585–2591.
Wright, J. J., Lee, S., Zaikova, E., Walsh, D. A., and Hallam, S. J. (2009). DNA extraction from 0.22 μM Sterivex filters and cesium chloride density gradient centrifugation. J. Vis. Exp. e1352. doi: 10.3791/1352. Available online at: http://www.jove.com/details.php?id=1352
Zinser, E. R., Coe, A., Johnson, Z. I., Martiny, A. C., Fuller, N. J., Scanlan, D. J., et al. (2006). Prochlorococcus ecotype abundances in the North Atlantic Ocean as revealed by an improved quantitative PCR method. Appl. Environ. Microbiol. 72, 723–732. doi: 10.1128/AEM.72.1.723-732.2006
Zwirglmaier, K., Jardillier, L., Ostrowski, M., Mazard, S., Garczarek, L., Vaulot, D., et al. (2008). Global phylogeography of marine Synechococcus and Prochlorococcus reveals a distinct partitioning of lineages among oceanic biomes. Environ. Microbiol. 10, 147–161. doi: 10.1111/j.1462-2920.2007.01440.x
Keywords: Prochlorococcus, microbial ecology, Red Sea, rpoC1 gene, metagenomics, pyrosequencing, marine microbiology, marine science
Citation: Shibl AA, Haroon MF, Ngugi DK, Thompson LR and Stingl U (2016) Distribution of Prochlorococcus Ecotypes in the Red Sea Basin Based on Analyses of rpoC1 Sequences. Front. Mar. Sci. 3:104. doi: 10.3389/fmars.2016.00104
Received: 06 November 2015; Accepted: 07 June 2016;
Published: 24 June 2016.
Edited by:
Marcelino T. Suzuki, Sorbonne Universités and Centre National de la Recherche Scientifique, FranceReviewed by:
Tom O. Delmont, University of Chicago, USARex Malmstrom, DOE Joint Genome Institute, USA
Copyright © 2016 Shibl, Haroon, Ngugi, Thompson and Stingl. This is an open-access article distributed under the terms of the Creative Commons Attribution License (CC BY). The use, distribution or reproduction in other forums is permitted, provided the original author(s) or licensor are credited and that the original publication in this journal is cited, in accordance with accepted academic practice. No use, distribution or reproduction is permitted which does not comply with these terms.
*Correspondence: Ulrich Stingl, dWxpLnN0aW5nbEBrYXVzdC5lZHUuc2E=; dWxpc3RpbmdsQGdtYWlsLmNvbQ==