 Jasmin P. Heiden
 Kai Bischof2
 Scarlett Trimborn
- 1EcoTrace, Biogeosciences Department, Alfred Wegener Institute for Polar and Marine Research, Bremerhaven, Germany
- 2Faculty 02: Biology/Chemistry, Marine Botany, University of Bremen, Bremen, Germany
It is largely unknown how rising atmospheric CO2 concentrations and changes in the upper mixed layer depth, with its subsequent effects on light availability will affect phytoplankton physiology in the Southern Ocean. Linking seasonal variations in the availability of CO2 and light to abundances and physiological traits of key phytoplankton species could aid to understand their abilities to acclimate to predicted future climatic conditions. To investigate the combined effects of CO2 and light on two ecologically relevant Antarctic diatoms (Fragilariopsis curta and Odontella weisflogii) a matrix of three light intensities (LL = 20, ML = 200, HL = 500 μmol photons m−2 s−1) and three pCO2 levels (low = 180, ambient = 380, high = 1000 μatm) was applied assessing their effects on growth, particulate organic carbon (POC) fixation and photophysiology. Under ambient pCO2, POC production rates were highest already at low light in Fragilariopsis, indicating saturation of photosynthesis, while in Odontella highest rates were only reached at medium irradiances. In both species ocean acidification did not stimulate, but rather inhibited, growth and POC production under low and medium light. This effect was, however, amended under high growth irradiances. Low pCO2 levels inhibited growth and POC production in both species at low and medium light, and further decreased absolute electron transport rates under high light. Our results suggest that Southern Ocean diatoms were sensitive to changes in pCO2, showing species-specific responses, which were further modulated by light intensity. The two diatom species represent distinct ecotypes and revealed discrete physiological traits that matched their seasonal occurrence with the related physical conditions in Antarctic coastal waters.
Introduction
Concentrations of atmospheric carbon dioxide (CO2) are predicted to rise from 400 μatm today to over 750 μatm by the end of this century affecting carbonate chemistry in ocean surface waters by increasing dissolved inorganic carbon availability and decreasing pH (IPCC, 2014). This will potentially affect the physiology and ecology of primary producers (Tortell et al., 2008; Trimborn et al., 2013, 2014). Elevated concentrations of CO2 in surface waters can be beneficial to phytoplankton, because at present-day the amount of aqueous CO2 accounts for ~1% within the total inorganic carbon pool (Zeebe and Wolf-Gladrow, 2001). As the enzyme Ribulose-1,5- bisphosphate carboxylase–oxygenase (RubisCO) requires CO2 as substrate for the production of particulate organic carbon (POC) during photosynthesis, most phytoplankton, including several Southern Ocean (SO) species, operate so-called carbon concentrating mechanisms (CCMs) (Reinfelder, 2011; Trimborn et al., 2013). CCMs are energetically costly as they include active transport of CO2 and bicarbonate () across cell membranes, operation of the enzyme carbonic anhydrase (CA, interconverting CO2 and ) and prevention of diffusive CO2 efflux (Raven and Johnston, 1991; Hopkinson et al., 2011). Increasing pCO2 in surface waters will lead to an increase in the fraction of aqueous CO2 available to phytoplankton, allowing cells to potentially down-regulate their CCMs, which can save up to ~20% of CCM-related energy expenditures (Hopkinson et al., 2011; Reinfelder, 2011). Down-regulation of CCMs is expected to promote growth through energy savings especially under limiting conditions such as light- or iron-limitation (Hopkinson et al., 2011). Increased CO2 concentrations have been shown to influence Southern Ocean phytoplankton growth and community composition (Tortell et al., 2008; Feng et al., 2010; Hoppe et al., 2013). Laboratory studies on Antarctic phytoplankton species, however, did not find stimulating effects by elevated pCO2 on growth (Boelen et al., 2011; Hoppe et al., 2015).
Alongside elevated atmospheric CO2 concentrations, sea surface temperatures are on the rise, thus influencing water column stratification. The expected outcome is a shallower upper-mixed layer (UML), in which phytoplankton cells become exposed to higher mean light intensities (Boyd et al., 2015b). As major parts of the Southern Ocean are generally assumed to be light limited, these changes could be beneficial for phytoplankton species (Mitchell and Brody, 1991; Mitchell and Holm-Hansen, 1991; Nelson and Smith, 1991). Yet, increased westerly winds (predicted trends for the Southern Annular Mode) could lead to opposite effects, causing a deepening of the UML (Hauck et al., 2015) thereby decreasing light availability to phytoplankton and thus creating an unfavorable environment.
The amount of available light is substantial for phytoplankton growth and photosynthesis. Light limiting conditions can be stressful for phytoplankton species as light-harvesting has to become more efficient in order to sustain electron transport between photosystems (MacIntyre et al., 2002; Dubinsky and Stambler, 2009) and thereby generation of energy equivalents necessary for carbon fixation in the Calvin-Benson-Cycle (Falkowski and Raven, 2007). If the generation of energy equivalents and carbon fixation through photosynthesis gets restricted by a deficit in excitation energy capture, the energy demands within the phytoplankton cell cannot be met, leading to reduced metabolic rates (Shi et al., 2015).
Oversaturating light intensities on the other hand can lead to photoinactivation of photosystem II (PSII) reaction centers and, when not fully counteracted by repair mechanisms, can cause photoinhibition and cell damage (Murata et al., 2007; Raven, 2011). Therefore, most phytoplankton species possess various dissipation pathways such as non-photochemical quenching (NPQ). The NPQ involves pigment de-epoxidation that can be induced within seconds upon changes in light intensity (Krause and Weis, 1991; Müller et al., 2001). Antarctic diatoms rely on the xanthophyll cycle for photoprotection (Kropuenske et al., 2009; Arrigo et al., 2010; Mills et al., 2010) involving the pigment diadinoxanthin (DD), which can be de-epoxidised to diatoxanthin (DT), thereby dissipating excess energy captured by light-harvesting pigments (reviewed in Goss and Lepetit, 2014). The adjustment of the functional absorption cross section of PSII (σPSII) rather than the number of photosynthetic units per cell is considered to act as an important photoacclimation strategy particularly in polar diatoms (Kropuenske et al., 2009, 2010; Strzepek et al., 2012). Photoacclimation strategies of polar phytoplankton could be related to species-specific occurrences during the season, as changes in vertical mixing with its effects on light availability influence the seasonal succession of phytoplankton species (Mitchell and Holm-Hansen, 1991; Garibotti et al., 2005).
Next to light availability, also the partial pressure of CO2 (pCO2) of Antarctic coastal waters substantially varies over the season with reported values from 190 to 560 μatm (Kapsenberg et al., 2015). During winter time, sea ice prevents gas exchange between ocean surface waters and the atmosphere, causing the pCO2 to exceed atmospheric levels after sea-ice retreat in spring (Sweeney, 2003; Arrigo et al., 2008). While in spring the UML is deep and phytoplankton needs to cope with light-limiting conditions, during summer the increasing surface warming creates a stable and shallow upper water body with high irradiances (Mitchell and Holm-Hansen, 1991; Nelson and Smith, 1991). Solar irradiances increase during the season promoting phytoplankton blooms. Through high rates of photosynthetic carbon fixation, especially towards the end of the bloom, pCO2 can be drawn down to or even below pre-industrial values in Antarctic surface waters (Sweeney, 2003; Arrigo et al., 2008; Kapsenberg et al., 2015). Thus light and pCO2 are important factors influencing phytoplankton in Antarctic coastal waters, which unlike the open waters of the Southern Ocean display high iron concentrations and thus exhibit regular and extensive bloom events over the season (Holm-Hansen et al., 1989; Martin et al., 1990; Prézelin et al., 2000; Garibotti et al., 2003; de Jong et al., 2012). The frequent occurrence of pronounced blooms in coastal waters and their immense productivity make them very important for the global carbon cycle and thus important to study (Comiso et al., 1993; Arrigo et al., 2008).
At present it is largely unknown what the combined effects of pCO2 and light on Southern Ocean phytoplankton physiology are. For various temperate phytoplankton species, elevated CO2 concentrations in combination with low light were found to stimulate growth and carbon fixation, while the combination with high light showed reduced primary production and increased light stress in a natural phytoplankton community from the South China Sea (Gao et al., 2012). Whether similar responses can be expected for Southern Ocean phytoplankton species remains yet unclear. Studies on the combined effects of light and pCO2 on Antarctic phytoplankton are sparse and results are diverging. The diatom Proboscia alata showed elevated particulate organic carbon content with increasing pCO2 when combined with a high constant irradiance, whereas the opposite was true for low light conditions (Hoogstraten et al., 2012). For the Antarctic diatom Chaetoceros brevis, growth remained unaffected by pCO2 irrespective of the dynamic light regime applied (Boelen et al., 2011). Yet, in the diatom C. debilis, under dynamic light, elevated pCO2 decreased primary production (Hoppe et al., 2015). Experiments on multiple stressors including not only pCO2 and light, but also temperature, nutrients and iron, found that light increased growth, when nutrients were not limiting, while pCO2 did not have any effect (Xu et al., 2014; Boyd et al., 2015a). There are great differences in the definition of high and potentially stressful irradiances that are used in studies investigating effects of constant irradiances in temperate and Antarctic phytoplankton species (125 to 380 μmol photons m−2 s−1; Kropuenske et al., 2010; Mills et al., 2010; Norici et al., 2011; Hoogstraten et al., 2012). However, applied irradiances often are below the extremes that phytoplankton cells can encounter in shallow mixed coastal waters with reported values of integrated daily mean irradiances ranging between 77 and 740 μmol photons m−2 s−1 under constant light in a 16:8 light:dark cycle (Lancelot et al., 1993; Moline and Prézelin, 1996; Venables et al., 2013). Studies on fluctuating light regimes applied higher irradiances which reach levels between 250 and 1200 μmol photons m−2 s−1. Yet, exposure to these high irradiances occured for short and repeated periods (Kropuenske et al., 2009; Mills et al., 2010; Boelen et al., 2011; Xu et al., 2014; Boyd et al., 2015a; Hoppe et al., 2015). In a future ocean, the mixed layer depth of Antarctic coastal waters may decrease potentially implying higher integrated daily irradiances including longer periods of light exposure that phytoplankton encounter (Boyd et al., 2015b). Therefore, it is important to study also the effects of exposure to very high and persisting light conditions on phytoplankton physiology.
This study aims to investigate the interactive effects of pCO2 and light availability on two Antarctic bloom-forming species typically occurring within spring (Fragilariopsis curta) and summer (Odontella weisflogii) in iron replete Antarctic coastal waters (Martin et al., 1990; Garibotti et al., 2005; Annett et al., 2010; de Jong et al., 2012). To better understand their physiological responses under different light and CO2 scenarios a matrix of three pCO2 conditions (low = 180, ambient = 380 and high = 1000 μatm) was applied in order to span the range of late-bloom to future ocean acidification (OA) conditions. These were combined with light conditions chosen to represent low, medium and high irradiances (LL = 20, ML = 200 and HL = 500 μmol photons m−2 s−1, respectively). The physiological responses of both species were studied on growth, carbon fixation, pigment content and photophysiology. We aimed to investigate whether increased pCO2 levels, at limiting light conditions, may promote growth and productivity due to lowered energy expenditures for CCM operation. Also we tested whether high pCO2 in conjunction with high light availability may synergistically trigger light stress. This study further tried to link the seasonal occurrence of the two phytoplankton species with respect to their physiological characteristics.
Materials and Methods
Culture Conditions
Semi-continuous cultures of the two diatom species Fragilariopsis curta (isolated from the Weddell Sea by Thomas Mock during ANT XVI/3 in 1999) and Odontella weisflogii (isolated in the Atlantic sector of the Southern Ocean by Bank Beszteri during ANT-XXIX/5, 2013) were grown at 4°C in sterile-filtered (0.2 μm) unbuffered natural Antarctic seawater (30.2) enriched with silicate, trace metals and vitamins according to F/2 medium (Guillard and Ryther, 1962). Nitrate and phosphate were added in concentrations reflecting the Redfield N:P ratio of 16:1, 100 and 6.25 μmol L−1 respectively (Redfield, 1958).
Based on photosynthesis-irradiance-curves (PE-curves) with both species acclimated to ambient pCO2 and 150 μmol photons m−2 s−1 light treatments were chosen. Both species were grown in triplicates under low, medium and high light (LL = 20, ML = 200, HL = 500 μmol photons m−2 s−1) conditions at a 16:8 h light:dark light cycle using light-emitting diodes (LED) lamps (SolarStinger LED SunStrip Marine Daylight, Econlux). The three light treatments were further continuously bubbled through a frit with humidified air of the three CO2 partial pressures (pCO2) of 180, 380, and 1000 μatm (low, ambient and high pCO2). A gas flow controller (CGM 2000, MCZ Umwelttechnik) was used to generate the CO2 gas mixtures from CO2-free air (<1 ppmv CO2, Nitrox CO2 RP280, Domnick Hunter ltd.) and pure CO2 (Air Liquide Deutschland ltd., Germany). Triplicates of both species were exposed to all light and pCO2 treatment combinations. All replicates of one experimental treatments were run in parallel.
For each light treatment chlorophyll a (Chl a) fluorescence was calibrated against cell number and pH, allowing us to monitor the status of the culture using fluorescence alone. Cultures were grown in 1 L glass bottles (custom made), kept in exponential phase and harvested at cell densities of 224,000 ± 97,000 and 732 ± 170 cells per mL for the small Fragilariopsis (~5 μm) and the much larger Odontella (>50 μm) respectively to prevent drift of carbonate chemistry.
Only during the pre-acclimation phase to all experimental conditions of at least 10 days, cultures were diluted two to three times using pre-equilibrated medium. During the main experiment, cells grew for 3.8 ± 1.7 days until all parameters were sampled.
Carbonate Chemistry
The pH was measured every other day and at the final sampling day using a pH-ion meter (pH-Meter 827, Metrohm), calibrated (3 point calibration) with National Institute of Standards and Technology-certified buffer systems. The pH remained constant at 8.39 ± 0.03, 8.02 ± 0.03, and 7.76 ± 0.02 for the low, ambient and high pCO2 treatments respectively (Table 1). Total Alkalinity (TA) was measured by duplicate potentiometric titrations (TW alpha plus, SI Analytics, Brewer et al., 1986) of filtrated samples (Whatman GF/F glass fiber filters, ~ 0.6 mm), having been stored at 4°C in 150 mL borosilicate bottles until analysis. Certified reference material (CRMs provided by Prof. A. Dickson, Scripps, USA; batch no. 111; reproducibility ±13 μmol kg−1) was used to correct TA for systematic errors. Dissolved inorganic carbon (DIC) samples were sterile-filtered (0.2 μm) and stored at 4°C in 5 mL gas-tight borosilicate bottles without headspace until analysis. DIC was measured colourimetrically in duplicates with a QuAAtro autoanalyzer (Seal Analytical, Stoll et al., 2001). The analyzer was calibrated with NaHCO3 solutions (salinity of 35, achieved by NaCl addition) with concentrations ranging between 1800 and 2300 mmol DIC kg−1. Certified reference materials (reproducibility ± 8 μmol kg−1) were used to correct for errors in instrument performance such as baseline drifts. The carbonate system was calculated based on TA, pH, silicate, phosphate, temperature and salinity using the CO2Sys program (results shown in Table 1, Pierrot et al., 2006) choosing the equilibrium constant of Mehrbach et al. (1973) refitted by Dickson and Millero (1987).
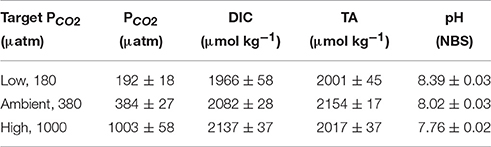
Table 1. Dissolved inorganic carbon concentrations (DIC) and partial pressure of CO2 (pCO2) were calculated from total alkalinity (TA), pH, silicate, phosphate, temperature, and salinity using the CO2Sys program (Pierrot et al., 2006).
Growth
Samples for cell counts of every treatment were fixed with acid Lugol's solution (10% final concentration) and stored at 3°C in the dark until analysis. Cells were counted on an inverted light microscope (Axio Observer.D1; Zeiss) after sedimentation for 24 h in 10 mL Utermöhl chambers (Hydro-Bios). Growth rates were determined from samples taken right after at the beginning of the experiment (N0) and at the day of sampling (Nfin) and for each sample >400 cells were counted. Cell specific growth rate (μ, day−1) was calculated as
where Δt is the incubation duration in days.
Particulate Organic Carbon and Particulate Organic Nitrogen
Particulate organic carbon (POC) and nitrogen (PON) were determined from gently filtered (<20 mmHg) subsamples of each treatment using pre-combusted GF/F filters (15h, 200°C; Whatman). Samples were stored at −20°C and defrosted prior to analysis (>12 h, 60°C), acidified with 0.1 mol HCl L−1 and dried over night at 60°C. Samples were analyzed using an elemental analyzer (EURO EA Elemental Analyzer, Euro Vector). Contents of POC and PON were corrected using blank measurements and normalized to filtered volume and cell densities to yield cell quotas. Production rates of POC and PON, were calculated by multiplication of the cellular quota with the specific growth rate of the respective treatment.
Pigments
Pigment concentrations of chlorophyll a, chlorophyll c2, fucoxanthin, diadino- and diatoxanthin were determined using High-Performance-Liquid-Chromatography (HPLC). Samples were gently filtered onto GF/F (Whatman) filters, immediately frozen and stored at −80°C for later analysis. Pigments were extracted in 90:10 acetone:water for 24 h at 4°C in the dark and filtered (4 mm nylon syringe filters, 0.45 μm pore size, NalgeneC; Labware) prior to analysis. Analyses were performed on a LaChromElite® system consisting of a chilled autosampler L-2200, a DAD detector L-2450 (VWR-Hitachi International GmbH) and a Spherisorb ODS-2 column (25 cm × 4.6 mm, 5 μm particle size; Waters). The system used a LiChrospher® 100 RP-18 guard cartridge for pigment separation applying a gradient following Wright et al. (1991) detecting peaks at 440 nm which were identified and quantified via co-chromatography of pigment standards obtained from DHI Lab Products (ORT, Denmark) using the software EZChrom Elite ver. 3.1.3.
From concentrations of diadinoxanthin (DD) and its de-epoxidised equivalent diatoxanthin (DT) the de-epoxidation state (DES) was calculated according to
Chlorophyll a Fluorescence
Photophysiological parameters were measured using a Fast Repetition Rate fluorometer (FRRf, FastOcean PTX; Chelsea Technologies) in combination with a FastAct Laboratory system (Chelsea Technologies). Measurements were conducted at growth temperature (4°C). Samples were dark-acclimated for 10 min prior to measurement. The duration of the dark acclimation phase was chosen after pre-testing different time intervals (5, 10, 20, 30 min) to ensure that all photosystem II (PS II) reaction centers were fully oxidized and non-photochemical quenching was relaxed. Excitation wavelength of the fluorometer's LED was 450 nm with an automated adjustment of the light intensity (between 0.66 and 1.2 × 10²² photons m−2 s−1). The single turnover mode was used with 100 flashlets saturation phase on a 2 μs pitch and 40 flashlets relaxation phase on a 40 μs pitch in order to cumulatively saturate PS II. Estimation of minimum (F0) and maximum chlorophyll a (Chl a) fluorescence (Fm) was based on iterative algorithms for induction (Kolber et al., 1998) and relaxation phase (Oxborough et al., 2012). Minimum and maximum Chl a fluorescence were used to calculate the apparent maximum quantum yield of photochemistry in PS II (Fv/Fm) according to the following equation:
Additional Chl a fluorescence measurements of every treatment were performed in response to increasing incident irradiances (E) generating photosynthesis-irradiance-curves (PE-curves; irradiances ranged between 0 and 1800 μmol photons m−2 s−1) using 15 steps with an acclimation duration of 5 min per light step and six subsequent Chl a fluorescence measurements. From these fluorescence measurements, the light-adapted minimum (F′) and maximum () fluorescence of the single turnover acquisition was estimated. The effective PSII quantum yield under ambient light (/) was derived according to the equation (/F′)/ (Genty et al., 1989). Absolute electron transport rates (absETR, e− PSII−1 s−1) at the different light steps of the PE-curve were calculated as (Suggett et al., 2004, 2009; Huot and Babin, 2010):
where σPSII is the functional absorption cross section of PSII photochemistry (in nm2 quanta−1) and E denotes the instantaneous irradiance (μmol photons m−2 s−1). Light-use characteristics were analyzed by fitting irradiance-dependent ETRs according to Ralph and Gademann (2005), including maximum absolute ETR (ETRm), minimum saturating irradiance (IK) and maximum light utilization efficiency (α). The PE-Curve was followed by another 10 min of dark acclimation with single turnover flashlets in order to assess PSII recovery (yield recovery). Yield recovery was calculated from the Fv/Fm measured before and after the PE-curve and given as % of the initial Fv/Fm (before the PE-curve). Non-photochemical quenching (NPQ, Equation 5) was calculated following the Stern-Volmer equation.
From the single turnover measurement of dark-adapted cells, also the time constant for electron transport at the acceptor side of PSII (τQa, μs), the connectivity factor of adjacent PSII light-harvesting pigment matrices (p, dimensionless) and the concentration of functional PSII reaction centers ([RCII], nmol m−3), were derived according to Oxborough et al. (2012), using FastPro8 software (Version 1.0.50, Kevin Oxborough, CTG Ltd.).
Statistics
All data are given as replicate means (n = 3) ± SE. To test for significant differences between treatments, two-way analyses of variance (ANOVA) with additional normality (Shapiro-Wilk) and post hoc (Holm–Sidak method) tests were performed (α = 0.05). In addition to this, to test for direct effects between two particular treatments standard t-tests were used. All statistical analyses were carried out with SigmaPlot 12.3 (SysStat Software Inc.). Different letters in figures and tables indicate statistical differences between treatments based on post-hoc tests.
Results
Growth Rates
Despite the large difference in cell size both investigated species showed comparable growth rates (Figures 1A,B). Several studies, investigating polar diatom species, of very different cell sizes, reported growth rates that are comparable to those found in this study (Gilstad and Sakshaug, 1990; Kropuenske et al., 2009; Arrigo et al., 2010; Boelen et al., 2011; Petrou et al., 2014). Hence, within polar diatoms growth rates generally seem not to be greatly affected by cell size, but much more by abiotic factors such as temperature and light availability. Growth rates of Fragilariopsis curta (Fragilariopsis) generally increased from low (LL) to medium light (ML) conditions and slightly decreased toward high light (HL, Figure 1A). At ambient pCO2 (380 μatm), Fragilariopsis increased growth by 20% from LL to ML, whereas it decreased growth by 58% between ML and HL conditions. Under high pCO2 (1000 μatm), no significant light effects were detectable in growth. At low pCO2 (180 μatm), however, a strong increase in growth (86%) occurred between LL and ML, with no detectable changes from ML to HL. There were no overall trends with increasing pCO2 discernible within all light treatments. At LL, growth of Fragilariopsis was suppressed in low pCO2 treatments compared to the other two pCO2 treatments, whereas at ML both low and high pCO2 treatments grew less than the ambient treatment, yet only the former was statistically significant. The reverse pattern occurred at HL, exhibiting decreased growth at ambient pCO2, 22% compared to low and 39% toward high pCO2 treatments.
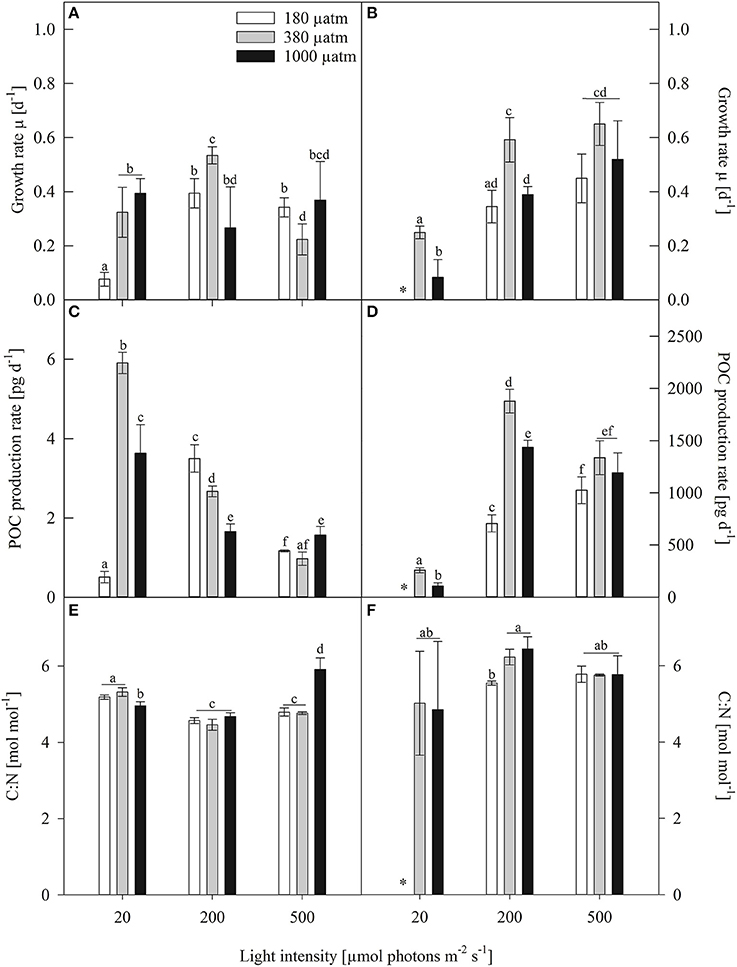
Figure 1. Growth rates (μ, d−1), particulate organic carbon production (POC, pg d−1) and cellular carbon to nitrogen ratio (C:N, mol mol−1) of (A,C,E) Fragilariopsis and (B,D,F) Odontella acclimated to different light (LL = 20, ML = 200, HL = 500 μmol photons m−2 s−1) and pCO2 (low = 180, ambient = 380 and high = 1000 μatm) conditions. Values represent mean ± SE (n = 3). Odontella did not grow at low light in combination with low pCO2 as indicated by *. Statistical differences between two treatments (p = 0.05) derived from post-hoc tests are indicated by different letters.
In Odontella weisflogii, (Odontella), in the ambient and high pCO2 treatments growth increased from LL to ML by 58% and 79%, respectively, yet both pCO2 treatments showed no changes between ML and HL (Figure 1B). Within the low pCO2 treatments, no light effects on growth were found from ML to HL, yet at LL despite several attempts Odontella could not grow. At LL and ML, growth of Odontella decreased from ambient to high pCO2. No differences between pCO2 treatments were detectable at HL. At ML and HL, low pCO2 acclimated cells grew slower than the ones acclimated to ambient pCO2 while they reached similar growth rates as cells grown at high pCO2.
Elemental Composition
The production rate of particulate organic carbon (POC) revealed species-specific trends (Figures 1C,D). In Fragilariopsis, at ambient pCO2 POC production significantly decreased (84%) from LL to HL. Under high pCO2, POC production decreased by 51% from LL to ML and showed no further changes from ML to HL. Under low pCO2, POC production increased about 86% from LL to ML and decreased about 67% from ML to HL. At LL, POC production rates increased about 91% from low to ambient pCO2 and decreased by 39% in response to high pCO2. At ML, POC production decreased about 53% from low to high pCO2, whereas at HL no differences between pCO2 treatments were found.
In Odontella, POC production rates increased from LL to ML by 86 and 93% at ambient and high pCO2, respectively. At ambient pCO2, POC production rates decreased from ML to HL. Within high and low pCO2 treatments, no changes were detected between ML and HL. At LL and ML, the ambient pCO2 treatments had higher POC production rates than high pCO2 treatments. Low pCO2 treatments revealed lower POC production rates at ML, when compared to the two other pCO2 treatments. No differences between pCO2 treatments were observed at HL.
In Fragilariopsis, the ratio of cellular carbon to nitrogen (C:N, mol mol−1) showed effects of both light and pCO2. Under all three pCO2 treatments C:N ratios decreased from LL to ML, but increased from ML to HL under high pCO2 (Figure 1E). Under LL, effects of pCO2 became evident as C:N ratios were reduced under high compared to low and ambient pCO2, whereas the opposite was true under HL with increased C:N ratios under high pCO2. Odontella, however, showed no effects of light on the C:N ratio (Figure 1F). Only under ML, the ratio of C:N increased from low to ambient pCO2 with no further increase toward high pCO2.
Chl a Fluorescence-Based Physiology
Photosynthesis-irradiance curves (PE-curves; Figure 2) displayed a strong light effect as maximum electron transport rates (ETRm), light saturation point (IK) and light use efficiency (α, Table 2) increased with increasing irradiance in both Fragilariopsis and Odontella, but there were no differences in Ik and α between LL and ML in both species. The pCO2 did not affect absolute ETRs (absETR) within LL treatments in both species (Figures 2A,B). Under ML, ETRm and α increased from low to ambient pCO2 in both species, but remained unaltered between ambient and high pCO2. Only at HL, an effect of pCO2 on absETR (Figures 2E,F) and IK (Table 2) was evident in Fragilariopsis and Odontella, with decreased ETRm and IK values in the low compared to ambient and high pCO2 treatments, respectively.
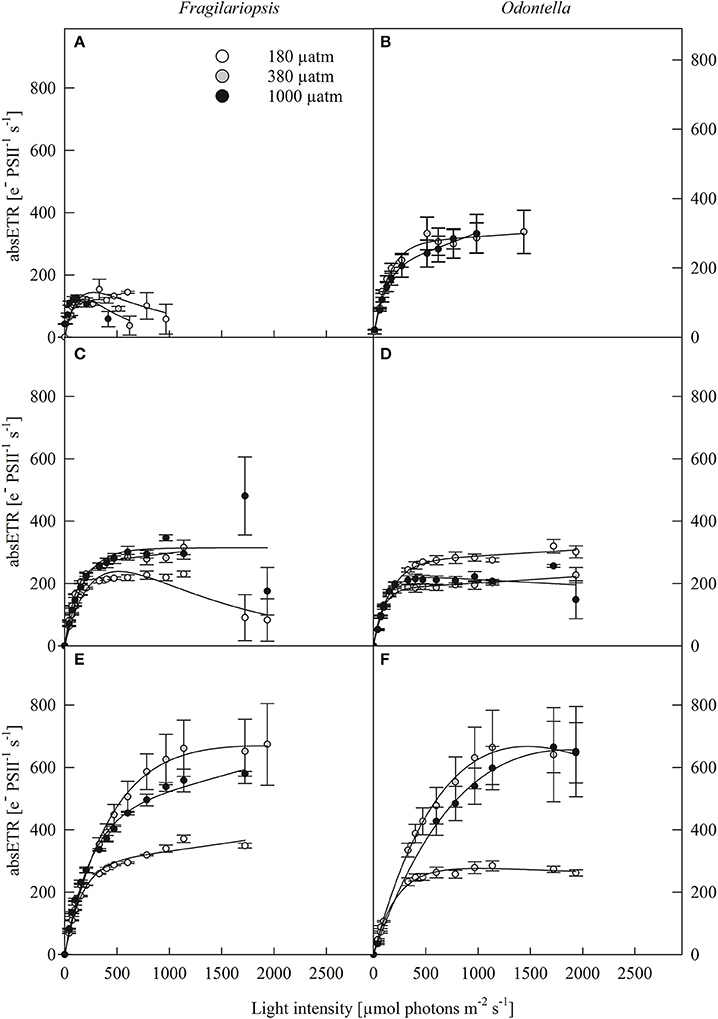
Figure 2. Absolute electron transport rates (absETR, e− PSII−1 s−1) of Fragilariopsis and Odontella acclimated to different light (LL = 20 in A,B; ML = 200 in C,D; HL = 500 μmol photons m−2 s−1 in E,F) and pCO2 (low = 180, ambient = 380 and high = 1000 μatm) conditions. Values represent mean ± SE (n = 3). Lines represent the fit following Ralph and Gademann (2005).
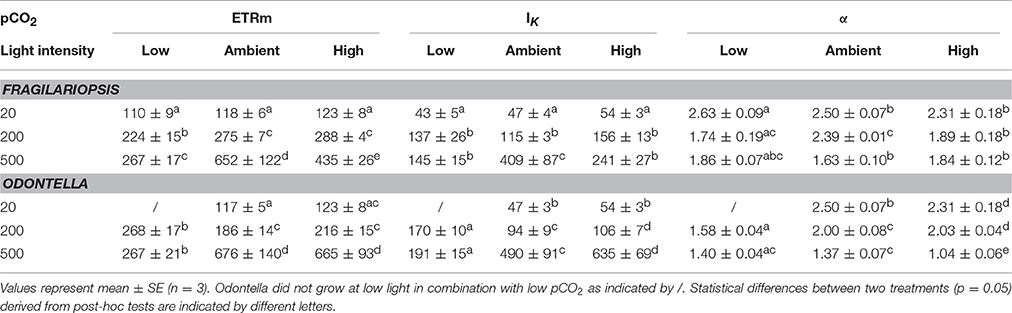
Table 2. Photosynthetic parameters from photosynthesis-irradiance curve fits based on Ralph and Gademann (2005) maximum electron transport rate (ETRm, e− PSII−1 s−1), light saturation point (IK, μmol photons m−2 s−1) and light use efficiency (α, rel. unit) were determined for Fragilariopsis and Odontella acclimated to different light (LL = 20, ML = 200, HL = 500 μmol photons m−2 s−1) and pCO2 (low = 180, ambient = 380 and high = 1000 μatm) conditions.
The maximum quantum yield (Fv/Fm) is an indicator for overall fitness and revealed species-specific patterns under the different experimental treatments (Figures 3A,B). In Fragilariopsis, Fv/Fm decreased from LL to ML and remained unchanged between ML and HL in the ambient pCO2 treatments. At LL, the low pCO2 treatments exhibited the lowest yield. Besides this, no pCO2 effects were found. In Odontella, Fv/Fm did not change between LL and ML in the ambient pCO2 treatments, whereas it decreased from LL to ML in the high pCO2 treatments. Between ML and HL, Fv/Fm decreased in all pCO2 treatments.
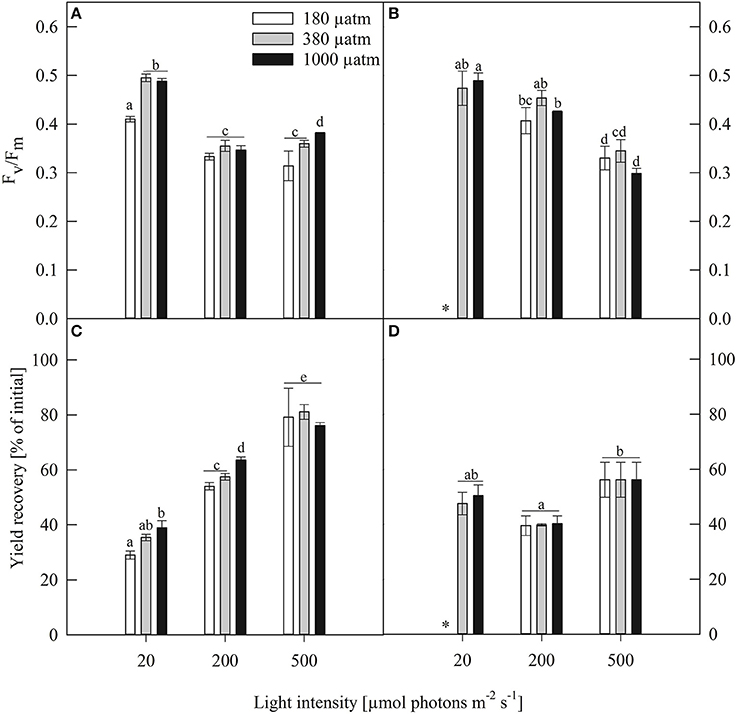
Figure 3. Maximum photosynthetic yield (Fv/Fm, rel. unit), yield recovery after short term light stress (% of initial) of (A,C) Fragilariopsis and (B,D) Odontella acclimated to different light (LL = 20, ML = 200, HL = 500 μmol photons m−2 s−1) and pCO2 (low = 180, ambient = 380 and high = 1000 μatm) conditions. Values represent mean ± SE (n = 3). Odontella did not grow at low light in combination with low pCO2 as indicated by *. Statistical differences between two treatments (p = 0.05) derived from post-hoc tests are indicated by different letters.
To test whether both species experienced short-term light stress or any damage in PSII, potentially induced during the PE-curve, a second dark acclimation phase right after the PE-curve was carried out followed by another Fv/Fm measurement, named yield recovery (given as % of initial Fv/Fm, Figures 3C,D). The two species showed diverging patterns of yield recovery. In Fragilariopsis, the recovery potential increased with increasing light intensity. In Odontella, a reversed bell shape was observed with a decrease in recovery from LL to ML and an increase from ML to HL. Yield recovery was not affected by pCO2 under all light conditions in Odontella, whereas in Fragilariopsis the recovery increased from low to high pCO2 conditions at LL and ML, but remained unaffected by pCO2 at HL.
Light Harvesting Pigment Content
Cellular pigment content generally decreased with increasing light intensity (Table 3). In both species and for all light-harvesting pigments (Chl a, Chl c2, fucoxanthin, β-carotene, Table 3), a significant decrease between LL and ML was observed in all pCO2 treatments and only minor or no decreases were observed between ML and HL conditions. Besides the light effect, Fragilariopsis showed a pCO2 effect on all light-harvesting pigments (Chl a, Chl c2, fucoxanthin and β-carotene, Table 3). To prevent repetition only the CO2-dependent change in Chl a will be described exemplarily for all light-harvesting pigments. At LL, cellular Chl a concentrations increased from low to ambient pCO2 and decreased toward high pCO2. At ML and HL, no pCO2 effects were detected. In contrast to Fragilariopsis, in Odontella cellular Chl a concentrations remained unaltered in response to changes in pCO2(Table 3).
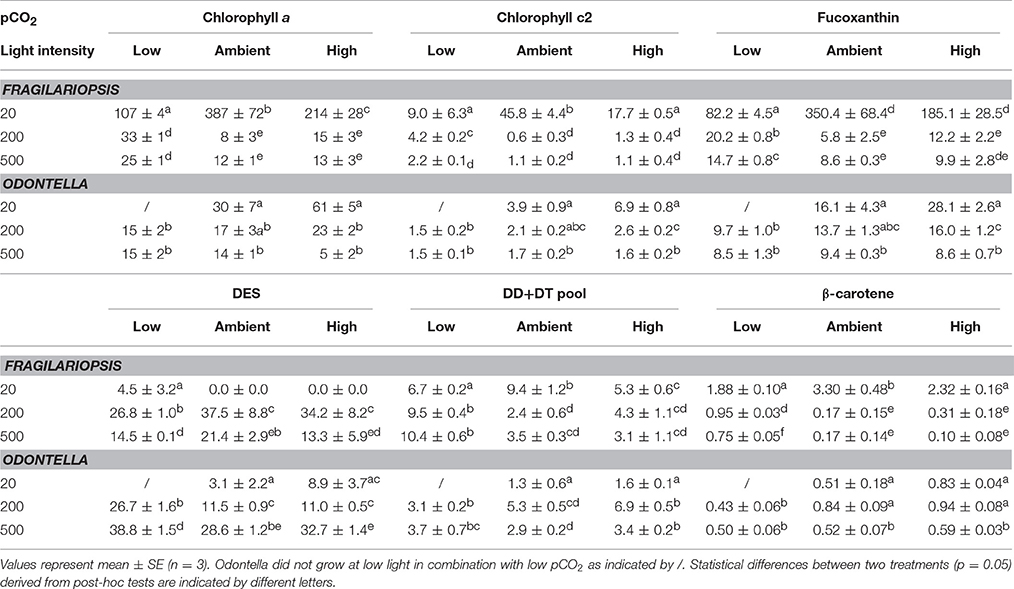
Table 3. Cellular chlorophyll a (Chl a), chlorophyll c2 (Chl c2), fucoxanthin, β-carotene, diadinoxanthin (DD) and diatoxanthin (DT) were determined for Fragilariopsis (fg cell−1) and Odontella (pg cell−1) acclimated to different light (LL = 20, ML = 200, HL = 500 μmol photons m−2 s−1) and pCO2 (low = 180, ambient = 380 and high = 1000 μatm) conditions. De-epoxidation state (DES) was calculated as [(DT/(DD+DT))*100].
Adjustments of Photosystem II
The functional absorption cross section of PSII (σPSII, Table 4), is a measure of the size of the functional “target area” of light-harvesting antenna. In Fragilariopsis, σPSII decreased with increasing light intensity, whereas there was no change detectable in Odontella. However, effects of pCO2 on σPSII were found in both species. Under low compared to ambient and high pCO2, σPSII was significantly lower at ML and HL in both diatoms.
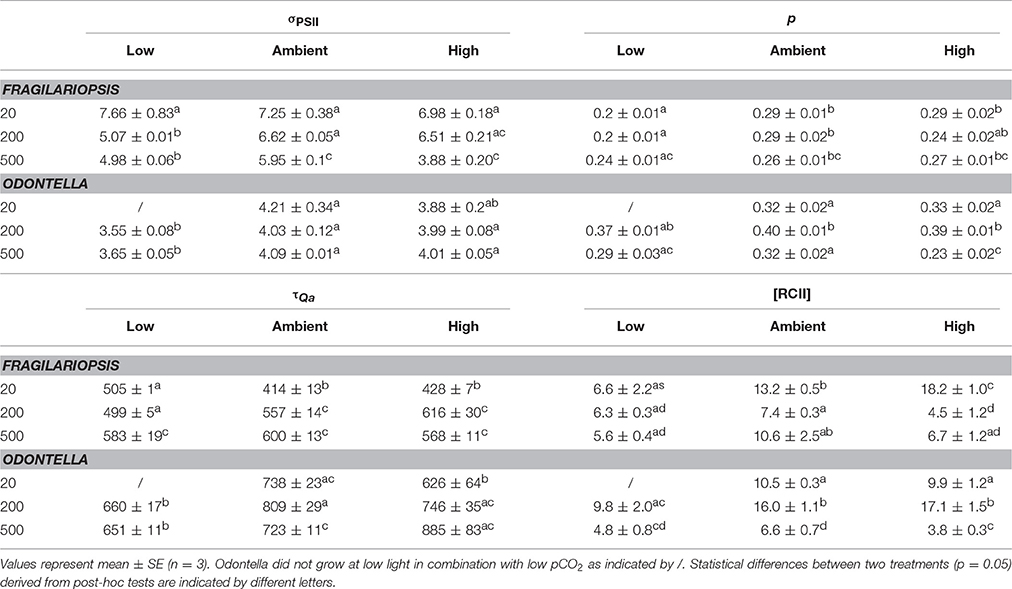
Table 4. Functional absorption cross section (σPSII, nm−2 quanta−1), the connectivity factor (p, dimensionless) of adjacent PSII light-harvesting pigment matrices, time constant for electron transport at the acceptor side of PSII (τQa, μs) and the concentration of functional PSII reaction centers ([RCII], nmol m−3) were determined for Fragilariopsis and Odontella acclimated to different light (LL = 20, ML = 200, HL = 500 μmol photons m−2 s−1) and pCO2 (low = 180, ambient = 380 and high = 1000 μatm) conditions.
Light had an influence on re-oxidation times of the primary electron acceptor Qa (τQa, Table 4), but with different effects for the two investigated species. In Fragilariopsis, at LL, low pCO2 treatments showed the highest re-oxidation times with no differences between ambient and high pCO2, whereas at ML the re-oxidation time increased from low to high pCO2, and at HL no differences between pCO2 treatments were detectable. In Odontella, at ambient pCO2, τQa decreased from ML to HL. In the high pCO2 treatments of Odontella τQa increased with light. There was no light effect present in low pCO2 treatments. When light was limiting (LL), τQa was lower at high than at ambient pCO2. At ML and HL, in Odontella τQa was less at low compared to ambient and high pCO2. At HL, the high pCO2 treatments showed a higher τQa than ambient treatments (results are insignificant due to a lack of statistical power).
The connectivity between PSIIs (p, Table 4) was influenced by pCO2 in Fragilariopsis. Low pCO2 treatments showed decreased connectivity compared to ambient and high pCO2 treatments at LL and ML. In Odontella, in all pCO2 treatments p decreased from ML to HL. At ML, p increased from low to ambient pCO2 and remained constant between ambient and high pCO2. At HL the high pCO2 treatments showed the lowest p. Yet, statistical results for Odontella were not significant.
In Fragilariopsis, the concentration of PSII reaction centers ([RCII]) varied with light, decreasing significantly between LL and ML in the ambient and high pCO2 treatments, respectively and increasing between ML and HL at ambient, but not at high pCO2 (Table 4). Only in the low pCO2 treatments, [RCII] was not altered in response to increasing light intensities. At LL, [RCII] increased with increasing pCO2 in Fragilariopsis, whereas at ML the ambient pCO2 treatments showed higher concentrations than the low pCO2 treatments and no difference from the high pCO2 treatments. Compared to Fragilariopsis, in Odontella [RCII] exhibited a different pattern with light. Concentrations of RCII increased from LL to ML in ambient and high pCO2 treatments, but decreased from ML to HL in all pCO2 treatments. At LL, [RCII] did not change in response to pCO2 in Odontella. At ML, [RCII] increased from low to ambient pCO2, but not from ambient to high pCO2. Only at HL, the low and high pCO2 treatments displayed lower concentrations of RCII than the ambient pCO2 treatments.
Cellular Protective Pigment Content
The two diatom species showed different light-dependent trends in the de-epoxidation state (DES), an indicator for the dissipation of excess light energy (Table 3). In Odontella DES increased with increasing light intensity in all pCO2 treatments, whereas Fragilariopsis showed a bell shaped pattern. DES increased from LL to ML in Fragilariopsis, and decreased toward HL in all pCO2 treatments. Besides the low pCO2 treatments, no de-epoxidation was observed in Fragilariopsis at LL. Furthermore, in Fragilariopsis at ML and HL DES was lower in the low compared to ambient pCO2 treatments. Odontella exhibited elevated DES only in the low pCO2 treatments at ML and HL.
Non-photochemical Quenching (NPQ)
The NPQ in Fragilariopsis showed an increase with increasing light intensity, while Odontella displayed a bell shaped pattern with highest quenching rates at ML (Figure 4). For the low pCO2 treatments, NPQ reached higher values at LL in Fragilariopsis and at HL in Odontella.
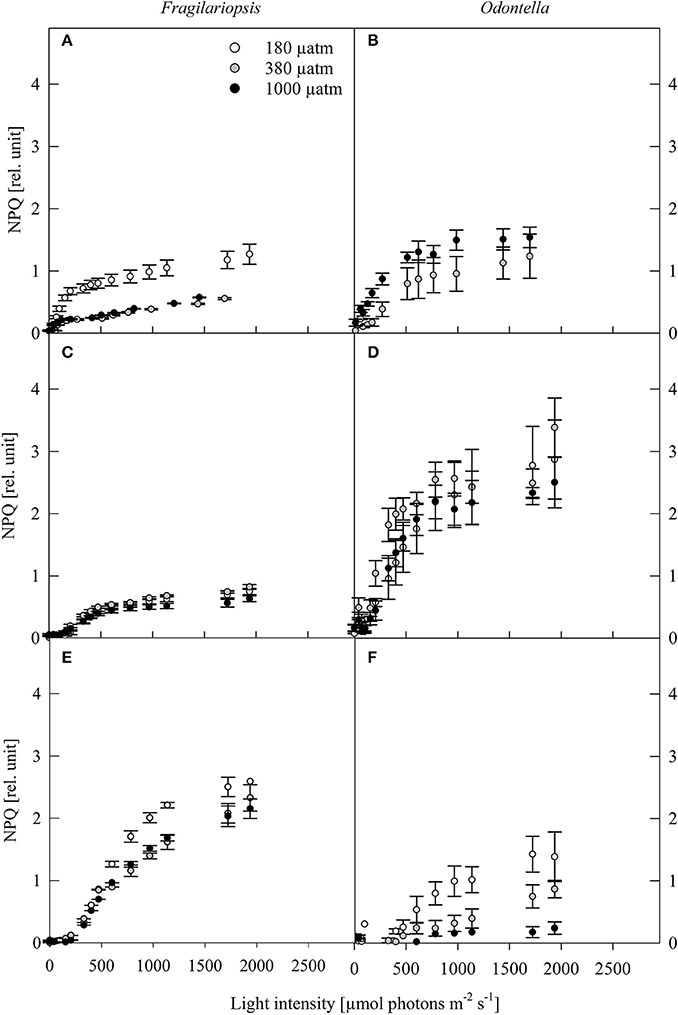
Figure 4. Non-photochemical quenching (NPQ, rel. unit) was determined in response to increasing irradiances in Fragilariopsis and Odontella acclimated to different light (LL = 20 in A,B; ML = 200 in C,D; HL = 500 μmol photons m−2 s−1 in E,F) and pCO2 (low = 180, ambient = 380 and high = 1000 μatm) conditions. Values represent mean ± SE (n = 3).
Discussion
This study investigated the physiological responses of two Antarctic key diatom species over a range of low to high light intensities in combination with low, ambient and elevated pCO2 levels. As future changes in water column stratification are considered to go in hand with ocean acidification, the potential for acclimation of Southern Ocean phytoplankton to these two factors can indicate potential future shifts in species composition. Next to climate change, light availability during summer and early spring greatly differs, with lower mean irradiances in spring (Dubinsky and Stambler, 2009) and higher incident light during summer (Mitchell and Brody, 1991; Mitchell and Holm-Hansen, 1991; Nelson and Smith, 1991). Moreover, large seasonal variation in pCO2 is frequently observed. The pCO2 in ocean surface waters is slightly elevated in early spring and can decrease tremendously during phytoplankton blooms (Sweeney, 2003; Arrigo et al., 2008). Our study was designed to link abiotic conditions to the physiological traits of phytoplankton species, in order to understand spatial and temporal distribution patterns under future light and pCO2 scenarios. The two diatom species studied here were found to occur in high abundances during different times of the year. Odontella weisflogii (Odontella) forms blooms in Antarctic coastal waters in summer (Garibotti et al., 2005; Annett et al., 2010), whereas elevated abundances of Fragilariopsis curta (Fragilariopsis) were observed rather early in season when the sea ice retreats (Garibotti et al., 2005; Annett et al., 2010). In our study, the observed physiological responses of Fragilariopsis and Odontella were clearly species-specific and varied largely in response to the applied CO2 and light scenarios and could further be related to their seasonal occurrence.
Light Optima for Photosynthesis Are Species-Specific
Under ambient pCO2, an increase in light intensity from low light (LL) to medium light (ML) stimulated growth by 42% in Odontella, with no further stimulation between ML and high light (HL, Figure 1B), indicating that growth was saturated at ML in this species. Other studies also reported that growth was stimulated by light when increased from lower to higher irradiances in various diatoms and prymnesiophytes (Bartual and Gálvez, 2002; Arrigo et al., 2010; Boelen et al., 2011). Congruently, growth of Fragilariopsis was also stimulated by 20% from LL to ML, but declined by 58% from ML to HL (Figure 1A). Such a decline at high light intensities was already found in the diatom Phaeodactylum tricornutum and the prymnesiophyte Phaeocystis antarctica (Arrigo et al., 2010; Li et al., 2014). In Fragilariopsis, particulate organic carbon (POC) production rates and quantum yield of photosynthesis (Fv/Fm), a measure of a cell's photosynthetic performance, were highest under LL and decreased from LL to ML, indicating saturation of photosynthesis already at LL conditions and an onset of light stress under ML (Figures 1C, 3A). In contrast, POC production increased from LL to ML in Odontella. This finding suggests that even under LL conditions Fragilariopsis was able to fix POC at a maximum rate while for Odontella this was only the case at ML, thus indicating species-specific light optima for photosynthesis. Despite the decrease in POC production from LL to ML in Fragilariopsis, growth increased suggesting that cell volumes might have changed. However, cell size measurements did not show any changes in both species and in all treatments (data not shown). Considering further that cell volume of Odontella was on average 2000 times larger than of Fragilariopsis (cell volumes estimated based on Hillebrand et al. (1999), data not shown) this potentially implied a much higher carbon demand in the former. For both species from ML to HL, we observed a significant decline in POC production (Figures 1C,D) and in Odontella a decrease in Fv/Fm (Figure 3B). In contrast to this observation, ETRm increased in both species from LL to HL, indicating no light saturation (Table 2). Due to this, the observed reduced POC production rates, between LL and HL in Fragilariopsis and between ML and HL in Odontella, might have resulted from a saturation of the Calvin-Benson-Cycle. The Calvin-Benson-Cycle is considered to be the rate-limiting step of photosynthesis under excessive light conditions, thus creating the demand of alternative electron pathways such as Mehler reaction, midstream oxidase pathways and cyclic electron transport around PSI to dissipate excess electrons (Behrenfeld and Milligan, 2012). Cyclic electron transport would rise the transthylakoid pH gradient and consequently lead to a higher production of ATP at the expense of NADPH and thereby would result in lower POC fixation rates (Falk and Palmqvist, 1992). Congruently with the changes in POC production the photosynthetic performance (Fv/Fm) declined from LL to ML in Fragilariopsis and from ML to HL in Odontella (Figures 1C,D, 3A,B). With increasing irradiance, Fv/Fm was commonly found to decrease in various temperate and Antarctic phytoplankton species (Boelen et al., 2011; Hoogstraten et al., 2012; Li et al., 2014) implying a lower photosynthetic capacity through photoinhibition and eventually photodamage of PSII. The observed species-specific changes in Fv/Fm may have resulted from a decreased ratio of photons absorbed per electrons generated in PSII. The amount of electrons generated depends on the cell's ability to capture light energy via light-harvesting pigments and the amount of functional PSII reaction centers. Less active PSII can result from closure of reaction centers (Schreiber, 2004) through photodamage (e.g., damage of D1 protein of PSII; Alderkamp et al., 2010), which can be an initial stage of photoacclimation process yielding reduced concentrations of PSII (Sakshaug et al., 1997).
For both diatoms, cellular concentrations of light-harvesting pigments (Ch a, Chl c2, fucoxanthin) significantly decreased similarly between LL and ML conditions, suggesting an acclimation to increased light by reducing light-harvesting pigment concentration for both species (Table 3). Yet, between ML and HL concentrations of light-harvesting pigments remained similar in both species, indicating a lower limit of pigment content for light absorption. We, however, found that concentrations of functional reaction centers ([RCII]) and Fv/Fm decreased significantly between ML and HL in Odontella while the absorption cross section of PSII (σPSII) remained unchanged (Figure 3B, Table 4). This shows that Odontella experienced stress at HL compared to ML. In comparison, Fv/Fm, [RCII] and σPSII already declined from LL to ML in Fragilariopsis (Figure 3A, Table 4). This finding suggests a higher susceptibility of this species to light stress already at moderate light intensities, yet these did not affect growth rates until HL conditions were applied.
To counteract photodamage, phytoplankton cells possess various strategies such as non-photochemical quenching (NPQ) including the operation of the xanthophyll cycle (XC), therefore dissipation of excess light energy in Odontella and Fragilariopsis was investigated via the concentrations of cellular diadinoxanthin (DD), its de-epoxidised form diatoxanthin (DT) and the de-epoxidation state (DES). An increase in DES (Table 3) with incident light is a response commonly found in phytoplankton (Casper-Lindley and Björkman, 1998; Arrigo et al., 2010; Petrou et al., 2011). NPQ increased from LL to HL in Fragilariopsis while in Odontella it increased mainly from LL to ML, but decreased from ML to HL (Figure 4). In Odontella, DES rose from LL to HL whereas there was no XC activity detectable in Fragilariopsis at LL, but there was a decrease from ML to HL (Table 3). The discrepancy in the trends of NPQ and DES from ML to HL in both species could result from smaller and much larger cellular DD+DT pools in Odontella and Fragilariopsis (−60 and +300%; Table 3), respectively under these conditions changing the general capacity for energy dissipation.
Overall, the two diatom species showed diverging responses to increasing light at ambient pCO2 during acclimation. Fragilariopsis was characterized by highest POC production rates and photosynthetic performance (Fv/Fm) under LL, but experienced light stress with increasing light intensity, as POC production rates decreased and NPQ increased from LL to HL. Hence, it showed good ability for energy dissipation even under HL conditions and thus seemed better able to cope with light stress. In comparison, Odontella showed an increase in POC production rates from LL to ML, indicating no saturation at LL. With increasing light intensities, Odontella was susceptible to light stress as POC production, Fv/Fm and NPQ declined indicating a limited potential to tolerate HL conditions.
Low pCO2 Inhibits Growth and Carbon Fixation Regardless of the Light Conditions
Phytoplankton blooms in Antarctic coastal waters occur annually and have been found to sometimes coincide with a severe drawdown of inorganic carbon through high photosynthetic carbon fixation rates in surface waters (Sweeney, 2003; Arrigo et al., 2008). In order to sustain photosynthesis under these low CO2 conditions, phytoplankton cells need to up-regulate their carbon concentrating mechanisms (CCMs) leading to increased energy demands and potentially impeding carbon fixation (Raven et al., 2014).
Low pCO2 in combination with LL was found to have the strongest impact on growth and carbon fixation in comparison to all other treatments. Under these conditions, both factors light and CO2 were limiting, causing lowest growth and POC production rates in Fragilariopsis while Odontella did not grow (Figures 1A–D). Commonly, the CCM is up-regulated under low pCO2 in order to supply CO2 to RubisCO, which is highly energy demanding (Hopkinson et al., 2011). Yet, in conjunction with LL conditions, the production of energy equivalents during photosynthesis might not be sufficient to maintain carbon fixation at a maximum, potentially causing the here observed minimal growth and POC production in Fragilariopsis. Additionally, light-harvesting pigment concentrations (Table 3), [RCII] and p (Table 4) were lowest under these conditions, indicating a small efficiency of individual PSII reactions centers with a low probability of excitation distribution among them. Furthermore, an excess of excitation energy was clearly visible as NPQ during PE-curves (Figure 4) was highest and yield recovery thereafter was lowest (Figure 3C). Overall, Fragilariopsis revealed great difficulties to grow under LL in conjunction with low pCO2. Nonetheless, it grew whereas Odontella could not cope with these highly stressful conditions. With increasing light availability the energetic constraints under LL were alleviated in both species, as potentially a larger share of photosynthetically generated energy (ATP and NADPH) was available to fuel their CCMs. Hence, at ML in conjunction with low pCO2 Odontella was able to grow and fix POC. This stimulative light effect was also found in Fragilariopsis, strongly increasing growth and POC production from LL to ML (Figures 1A,C).
Within the ML treatments, pCO2 was also found to stimulate growth rates of Odontella and Fragilariopsis by 8 and 42% from low to ambient pCO2, respectively (Figures 1A,B), suggesting optimal growth conditions for both species at ambient pCO2. A similar CO2-dependent increase in growth was previously reported for the two polar diatoms Rhizosolenia cf. alata and C. debilis (Riebesell et al., 1993; Trimborn et al., 2013). POC production was enhanced from low to ambient pCO2 levels in Odontella (Figure 1D) potentially resulting from a higher diffusive CO2 supply and therewith a lower energy demand. However, for Fragilariopsis we observed a CO2-dependent decline in POC production (Figure 1C). This decline was accompanied by a reduced capability for light absorption as cellular light-harvesting pigment concentrations were decreased at ambient compared to low pCO2 (Chl a, Chl c2, fucoxanthin, Table 3). Please note that Fragilariopsis experienced light stress already at ML when grown at ambient pCO2, hinting toward a higher susceptibility to light stress in this species. Through the down-regulation of the CCM from low to ambient pCO2, it may serve less as an energy sink and thereby increasing light stress exerted by excessive light (Gao et al., 2012). This was, however, not reflected in any change in Fv/Fm. In Odontella, under ML absETRs, ETRm, IK and α decreased from low to ambient pCO2 while POC production increased indicating that carbon uptake might not have been sufficient to saturate RubisCO and the Calvin-Benson-Cycle. The reason for this might be its higher cell volume compared to Fragilariopsis and thereby higher amount of carbon necessary to saturate the Calvin-Benson-Cycle and to sustain growth. Increased absETR under these conditions could further indicate cycling of electrons around PSI and thus generation of energy equivalents that could be funneled into carbon uptake. At HL, we observed an increase of the photosynthetic efficiency from low to ambient pCO2treatments of both species, displaying higher absETR (Figures 2E,F), ETRm, IK, α (Table 2), σPSII, τQa (Odontella only), p and [RCII] (Fragilariopsis only, Table 4) while NPQ and DD+DT pools decreased in both species, indicating lowered energy dissipation with increasing pCO2. Hence, in the low pCO2 treatments the HL was not utilized, but cells rather dissipated the excess light energy absorbed. As the CCM of both species was potentially down-regulated from low to ambient pCO2, the higher photosynthetic efficiencies as well as lowered energy dissipation at HL suggest that the CCM does not represent an important sink for excess energy under high light conditions (Gao et al., 2012).
Overall, this study revealed that low pCO2 concentrations were stressful for both Antarctic diatoms, but especially in conjunction with light limiting conditions. According to our results, the hypothesis that the regulation of the CCM aids in the dissipation of excess energy at high light intensities cannot be conclusively answered for the two species tested here.
OA Effects Are Modulated by Light Availability
Under OA, Antarctic diatoms might benefit from diffusive CO2 uptake as has been shown for temperate species (Burkhardt et al., 2001; Rost et al., 2003; Trimborn et al., 2009), decreasing the demand for CCM operation. Especially under limiting light conditions, the lowered energy demand through down-regulation of the CCM was found to stimulate growth and carbon fixation in temperate phytoplankton species (Wu et al., 2010; Li et al., 2014). Similarly, the temperate coccolithophorid Emiliania huxleyi showed increased POC production rates under OA when irradiances are low, yet under higher light intensities this effect was amended (Rokitta and Rost, 2012). In our investigated species, however, growth and POC production remained either unaffected or declined under OA and LL (Figures 1A–D) contradicting the aforementioned assumption of a stimulative effect of OA, but going in line with other findings for Antarctic phytoplankton species (Hoogstraten et al., 2012). We even observed for Fragilariopsis negative effects of OA under LL on light-harvesting pigment concentrations (Chl a, Chl c2, and fucoxanthin; Table 3) potentially compensated by an increased number of active RCII (Table 4). Interestingly, in Odontella light harvesting pigments (Chl c2, fucoxanthin, Table 3) were increased under elevated pCO2, indicating a maximization of light absorption under LL. In agreement with this, an OA-dependent induction of chlorophyll-fucoxanthin protein genes were reported for the temperate diatom Phaeodactylum tricornutum (Li et al., 2015). In addition to this, enhanced rates of mitochondrial respiration were previously reported under OA in combination with relatively LL levels in the temperate diatom Thalassiosira pseudonana (Yang and Gao, 2012). Together with the species-specific photoacclimation responses under OA, one could hypothesize that the two investigated species may have experienced higher metabolic costs, potentially causing the observed decline in POC production.
For both species, the negative OA effects were amplified under ML conditions. Next to negative responses in growth and POC production (Figures 1A–D), the two species displayed OA-dependent photoacclimation. While Odontella revealed lowered photochemical efficiencies (Figure 3B), Fragilariopsis had less active RCIIs with reduced connectivity between PSIIs (Table 4) potentially counteracted by increased light harvesting pigmentation (Chl a and fucoxanthin, Table 3). For both species, acclimation to high light conditions was indicated by a larger cellular DD+DT pool size (Table 3). This is in line with previous suggestions that down-regulated CCMs serve less as a sink for excess light energy under OA in conjunction with saturating light intensities (Gao et al., 2012). However, this positive effect of CCM operation under excessive irradiances was not found when comparing low and ambient pCO2 treatments under HL (see discussion above). Unexpectedly, this negative OA effect was alleviated under HL conditions in our two tested species. In this case, growth rates and POC production remained unaffected (Figures 1A–C). Only for Fragilariopsis, POC production was stimulated by OA and HL. For the latter, C:N ratios were also found to raise (Figure 1E). For the two coccolithophores Gephyrocapsa oceanica and Coccolithus pelagicus ssp. braarudii, OA also increased POC production rates, but C:N ratios were either stimulated (200 μmol photons m−2 s−1, Rickaby et al., 2010) or reduced (100 μmol photons m−2 s−1, Jin et al., 2013) in G. oceanica. In our study, the CO2-dependent increase in C:N ratios under HL was mainly due to lowered cellular PON content (data not shown), the underlying reason for this, however, remains unclear.
From our results, we can conclude that OA in conjunction with all tested irradiances did not lead to stimulation in growth or POC production in any of the tested species. It was, however, evident that increasing light intensities during acclimation caused OA-dependent photoacclimation responses and negatively impacted POC production. Only under HL, this OA effect was alleviated in Odontella, while in Fragilariopsis POC production was even increased, potentially resulting from a shift in carbon allocation. Congruently we cannot support the finding that a down-regulation of the CCM and consequent decrease of energy dissipation therein increases light stress under OA in conjunction with HL in these Antarctic diatoms.
Ecological Implications and Conclusion
Antarctic coastal waters were found to have high iron concentrations and form highly productive and extensive blooms over the season (Holm-Hansen et al., 1989; Martin et al., 1990; Prézelin et al., 2000; Garibotti et al., 2003; de Jong et al., 2012). Annual patterns of phytoplankton species succession and their presence in either spring or summer blooms can be related to species-specific abilities to acclimate, utilize and tolerate different light intensities. The physiological characteristics of both species we observed match well their seasonal occurrence. In line with its presence in spring (Garibotti et al., 2005; Annett et al., 2010), Fragilariopsis showed greater ability than Odontella to grow under LL conditions. Accordingly, it was characterized by highest POC production rates under limiting light as well as a good ability to endure high light stress when mixed to the water surface. Odontella was still light limited under LL, requiring higher irradiances coinciding with its occurrence in high abundances in summer when the upper mixed layer is shallow and stable (Mitchell and Holm-Hansen, 1991; Nelson and Smith, 1991). Congruently, it was able to endure longer periods of high irradiances. Yet, at the peak of a bloom when cell density is high, light is reduced and CO2 gets drawn down by high photosynthetic activity, this creates very unfavorable growth conditions for Odontella.
Strong species-specific physiological responses were apparent in response to different future climate scenarios, mimicking either OA in conjunction with increased irradiances due to shallower UML depth or OA associated with decreased daily irradiances due to deepening of the UML through increased winds. Under ML, both species experienced light stress, which was further amplified by OA. Yet, in the HL OA-scenario Fragilariopsis was able to tolerate the HL conditions. Also under the LL OA-scenario, neither of the investigated species showed an OA-dependent stimulation in growth or POC production. Hence, OA mainly showed negative effects on growth and carbon fixation in both diatom species, implying that OA could potentially reduce the strength of the biological carbon pump under the tested light scenarios.
The results of this study indicate that physiological traits can help to explain the spatial distribution of diatom species in the current Southern Ocean. We further demonstrate that the here tested future climatic scenarios could negatively affect growth and carbon fixation of both diatom species with potential implications for a future SO. Furthermore, the results of this study demonstrated that the effect of OA was strongly modulated by the irradiance regime, pointing out the need to conduct multiple stressor experiments to better understand the impact of climate change on Southern Ocean key phytoplankton species.
Author Contributions
JH acquired the presented data. JH, KB, and ST were involved in the study conception and design, the analysis and interpretation of data as well as drafting and critically revising the manuscript.
Funding
ST and JH were funded by the Helmholtz Impulse Fond (HGF Young Investigators Group EcoTrace).
Conflict of Interest Statement
The authors declare that the research was conducted in the absence of any commercial or financial relationships that could be construed as a potential conflict of interest.
The reviewer PJ and handling Editor declared their shared affiliation, and the handling Editor states that the process nevertheless met the standards of a fair and objective review
Acknowledgments
We would like to thank Britta Meyer-Schlosser and Tina Brenneis for laboratory assistance.
References
Alderkamp, A.-C., de Baar, H. J. W., Visser, R. J. W., and Arrigo, K. R. (2010). Can photoinhibition control phytoplankton abundance in deeply mixed water columns of the Southern Ocean? Limnol. Oceanogr. 55, 1248–1264. doi: 10.4319/lo.2010.55.3.1248
Annett, A. L., Carson, D. S., Crosta, X., Clarke, A., and Ganeshram, R. S. (2010). Seasonal progression of diatom assemblages in surface waters of Ryder Bay, Antarctica. Polar Biol. 33, 13–29. doi: 10.1007/s00300-009-0681-7
Arrigo, K. R., Mills, M. M., Kropuenske, L. R., Van Dijken, G. L., Alderkamp, A. C., and Robinson, D. H. (2010). Photophysiology in two major southern ocean phytoplankton taxa: Photosynthesis and growth of Phaeocystis antarctica and Fragilariopsis cylindrus under different irradiance levels. Integr. Comp. Biol. 950–966. doi: 10.1093/icb/icq021
Arrigo, K. R., van Dijken, G., and Long, M. (2008). Coastal Southern Ocean: a strong anthropogenic CO2 sink. Geophys. Res. Lett. 35, 1–6. doi: 10.1029/2008GL035624
Bartual, A., and Gálvez, J. A. (2002). Growth and biochemical composition of the diatom Phaeodactylum tricornutum at different pH and inorganic carbon levels under saturating and subsaturating light regimes. Bot. Mar. 45, 491–501. doi: 10.1515/BOT.2002.052
Behrenfeld, M. J., and Milligan, A. J. (2012). Photophysiological expressions of iron stress in phytoplankton. Ann. Rev. Mar. Sci. 5, 217–246. doi: 10.1146/annurev-marine-121211-172356
Boelen, P., van de Poll, W. H., van der Strate, H. J., Neven, I. A., Beardall, J., and Buma, A. G. J. (2011). Neither elevated nor reduced CO2 affects the photophysiological performance of the marine Antarctic diatom Chaetoceros brevis. J. Exp. Mar. Bio. Ecol. 406, 38–45. doi: 10.1016/j.jembe.2011.06.012
Boyd, P. W., Dillingham, P. W., McGraw, C. M., Armstrong, E. A., Cornwall, C. E., Feng, Y. Y., et al. (2015a). Physiological responses of a Southern Ocean diatom to complex future ocean conditions. Nat. Clim. Chang. 6, 207–213. doi: 10.1038/nclimate2811
Boyd, P. W., Lennartz, S. T., Glover, D. M., and Doney, S. C. (2015b). Biological ramifications of climate-change-mediated oceanic multi-stressors. Nat. Clim. Chang. 5, 71–79. doi: 10.1038/nclimate2441
Brewer, P. G., Bradshaw, A. L., and Williams, R. T. (1986). “Measurements of total carbon dioxide and alkalinity in the North Atlantic Ocean in 1981,” in The Changing Carbon Cycle, eds J. R. Trabalka and D. E. Reichle (New York, NY: Springer), 348–370.
Burkhardt, S., Amoroso, G., Riebesell, U., and Sultemeyer, D. (2001). CO2 and HCO3- uptake in marine diatoms acclimated to different CO2 concentrations. Limnol. Oceanogr. 46, 1378–1391. doi: 10.4319/lo.2001.46.6.1378
Casper-Lindley, C., and Björkman, O. (1998). Fluorescence quenching in four unicellular algae with different light-harvesting and xanthophyll-cycle pigments. Photosyn. Res. 56, 277–289. doi: 10.1023/A:1006037516479
Comiso, J. C., McClain, C. R., Sullivan, C. W., Ryan, J. P., and Leonard, C. L. (1993). Coastal zone color scanner pigment concentration in the Southern Ocean and relationships to geophysical surface features. J. Geophys. Res. 98, 2419–2451. doi: 10.1029/92JC02505
de Jong, J., Schoemann, V., Lannuzel, D., Croot, P., de Baar, H., and Tison, J.-L. (2012). Natural iron fertilization of the Atlantic sector of the Southern Ocean by continental shelf sources of the Antarctic Peninsula. J. Geophys. Res. 117:G01029. doi: 10.1029/2011JG001679
Dickson, A. G., and Millero, F. J. (1987). A comparison of the equilibrium constants for the dissociation of carbonic acid in seawater media. Deep Sea Res. 34, 1733–1743. doi: 10.1016/0198-0149(87)90021-5
Dubinsky, Z., and Stambler, N. (2009). Photoacclimation processes in phytoplankton: mechanisms, consequences, and applications. Aquat. Microb. Ecol. 56, 163–176. doi: 10.3354/ame01345
Falk, S., and Palmqvist, K. (1992). Photosynthetic light utilization efficiency, photosystem II heterogeneity, and fluorescence quenching in Chlamydomonas reinhardtii during the induction of the CO2-concentrating mechanism. Plant Physiol. 100, 685–691. doi: 10.1104/pp.100.2.685
Falkowski, P. G., and Raven, J. A. (2007). Aquatic Photosynthesis, 1st Edn. Princeton, NJ: Princeton University Press.
Feng, Y., Hare, C. E., Rose, J. M., Handy, S. M., DiTullio, G. R., Lee, P. A., et al. (2010). Interactive effects of iron, irradiance and CO2 on Ross Sea phytoplankton. Deep. Res. I 57, 368–383. doi: 10.1016/j.dsr.2009.10.013
Gao, K., Xu, J., Gao, G., Li, Y., Hutchins, D. A., Huang, B., et al. (2012). Rising CO2 and increased light exposure synergistically reduce marine primary productivity. Nat. Clim. Chang. 2, 519–523. doi: 10.1038/nclimate1507
Garibotti, I. A., Vernet, M., and Ferrario, M. E. (2005). Annually recurrent phytoplanktonic assemblages during summer in the seasonal ice zone west of the Antarctic Peninsula (Southern Ocean). Deep Sea Res. Part I Oceanogr. Res. Pap. 52, 1823–1841. doi: 10.1016/j.dsr.2005.05.003
Garibotti, I., Vernet, M., Kozlowski, W., and Ferrario, M. (2003). Composition and biomass of phytoplankton assemblages in coastal Antarctic waters: a comparison of chemotaxonomic and microscopic analyses. Mar. Ecol. Prog. Ser. 247, 27–42. doi: 10.3354/meps247027
Genty, B., Briantais, J.-M., and Baker, N. R. (1989). The relationship between the quantum yield of photosynthetic electron transport and quenching of chlorophyll fluorescence. Biochim. Biophys. Acta 990, 87–92. doi: 10.1016/S0304-4165(89)80016-9
Gilstad, M., and Sakshaug, E. (1990). Growth rates of ten diatom species from the Barents Sea at different irradiances and day lengths. Mar. Ecol. Prog. Ser. 64, 169–173. doi: 10.3354/meps064169
Goss, R., and Lepetit, B. (2014). Biodiversity of NPQ. J. Plant Physiol. Physiol. 172, 13–32. doi: 10.1016/j.jplph.2014.03.004
Guillard, R. R., and Ryther, J. H. (1962). Studies of marine planktonic diatoms: I. Cyclotella nana Hustedt, and Detonula confervacea (Cleve) Gran. Can. J. Microbiol. 8, 229–239. doi: 10.1139/m62-029
Hauck, J., Völker, C., Wolf-gladrow, D. A., Laufkötter, C., Vogt, M., Aumont, O., et al. (2015). On the Southern Ocean CO2 uptake and the role of the biological carbon pump in the 21st century. Glob. Biogeochem. Cycles 29, 1451–1470. doi: 10.1002/2015GB005140
Hillebrand, H., Dürselen, C.-D., Kirschtel, D., Pollingher, U., and Zohary, T. (1999). Biovolume calculation for pelagic and benthic microalgae. J. Phycol. 35, 403–424. doi: 10.1046/j.1529-8817.1999.3520403.x
Holm-Hansen, O., Mitchell, B. G., Hewes, C. D., and Karl, D. M. (1989). Phytoplankton blooms in the vicinity of Palmer Station, Antarctica. Polar Biol. 10, 49–57. doi: 10.1007/BF00238290
Hoogstraten, A., Timmermans, K. R., and de Baar, H. J. W. (2012). Morphological and physiological effects in Proboscia Alata (Bacillariophyceae) grown under different light and CO2 conditions of the modern Southern Ocean. J. Phycol. 48, 559–568. doi: 10.1111/j.1529-8817.2012.01148.x
Hopkinson, B. M., Dupont, C. L., Allen, A. E., and Morel, F. M. (2011). Efficiency of the CO2-concentrating mechanism of diatoms. Proc. Natl. Acad. Sci. U.S.A. 108, 3830–3837. doi: 10.1073/pnas.1018062108
Hoppe, C. J., Hassler, C. S., Payne, C. D., Tortell, P. D., Rost, B., and Trimborn, S. (2013). Iron limitation modulates ocean acidification effects on southern ocean phytoplankton communities. PLoS ONE 8:e79890. doi: 10.1371/journal.pone.0079890
Hoppe, C. J. M., Holtz, L., Trimborn, S., and Rost, B. (2015). Ocean acidification decreases the light-use efficiency in an Antarctic diatom under dynamic but not constant light. New Phytol. 207, 159–171. doi: 10.1111/nph.13334
Huot, Y., and Babin, M. (2010). “Overview of fluorescence protocols: theory, basic concepts, and practice,” in Chlorophyll a Fluorescence in Aquatic Sciences: Methods and Applications, eds J. D. Suggett, O. Prášil, and A. M. Borowitzka (Dordrecht: Springer), 31–74.
IPCC (2014). “Climate Change 2014: Synthesis Report,” in Contribution of Workinggroups I; II and III to the Fifth Assessment Report of the Intergovernmental Panel on Climate Change, eds R. K. Pachauri and L.A. Meyer (Geneva: IPCC), 151.
Jin, P., Gao, K., and Beardall, J. (2013). Evolutionary responses of a coccolithophorid Gephyrocapsa Oceanica to Ocean acidification. Evolution 67, 1869–1878. doi: 10.1111/evo.12112
Kapsenberg, L., Kelley, A. L., Shaw, E. C., Martz, T. R., and Hofmann, G. E. (2015). Near-shore Antarctic pH variability has implications for the design of ocean acidification experiments. Sci. Rep. 5, 9638. doi: 10.1038/srep10497
Kolber, Z. S., Prášil, O., and Falkowski, P. G. (1998). Measurements of variable chlorophyll fluorescence using fast repetition rate techniques: defining methodology and experimental protocols. Biochim. Biophys. Acta 1367, 88–106. doi: 10.1016/S0005-2728(98)00135-2
Krause, G. H., and Weis, E. (1991). Chlorophyll fluorescence and photosynthesis: the basics. Annu. Rev. Plant Physiol. Plant Mol. Biol. 42, 313–349. doi: 10.1146/annurev.pp.42.060191.001525
Kropuenske, L. R., Mills, M. M., van Dijken, G. L., Alderkamp, A.-C., Mine Berg, G., Robinson, D. H., et al. (2010). Strategies and rates of photoacclimation in two major Southern Ocean phytoplankton taxa: Phaeocystis antarctica (Haptophyta) and Fragilariopsis cylindrus (Bacillariophyceae). J. Phycol. 46, 1138–1151. doi: 10.1111/j.1529-8817.2010.00922.x
Kropuenske, L. R., Mills, M. M., van Dijken, G. L., Bailey, S., Robinson, D. H., Welschmeyer, N. A., et al. (2009). Photophysiology in two major Southern Ocean phytoplankton taxa: Photoprotection in Phaeocystis antarctica and Fragilariopsis cylindrus. Limnol. Oceanogr. 54, 1176–1196. doi: 10.4319/lo.2009.54.4.1176
Lancelot, C., Mathot, S., Veth, C., and de Baar, H. (1993). Factors controlling phytoplankton ice-edge blooms in the marginal ice-zone of the northwestern Weddell Sea during sea ice retreat 1988: field observations and mathematical modelling. Polar Biol. 13, 377–387. doi: 10.1007/BF01681979
Li, Y., Xu, J., and Gao, K. (2014). Light-modulated responses of growth and photosynthetic performance to ocean acidification in the model diatom Phaeodactylum tricornutum. PLoS ONE 9:e96173. doi: 10.1371/journal.pone.0096173
Li, Y., Zhuang, S., Wu, Y., Ren, H., Cheng, F., Lin, X., et al. (2015). Ocean acidification modulates expression of genes and physiological performance of a marine diatom. Biogeosci. Discuss. 12, 15809–15833. doi: 10.5194/bgd-12-15809-2015
MacIntyre, H. L., Kana, T. M., Anning, T., and Geider, R. J. (2002). Photoacclimation of photosynthesis irradiance response curves and photosynthetic pigments in microalgae and cyanobacteria. J. Phycol. 38, 17–38. doi: 10.1046/j.1529-8817.2002.00094.x
Martin, J. H., Gordon, R. M., and Fitzwater, S. E. (1990). Iron in Antarctic waters. Nature 345, 156–158. doi: 10.1038/345156a0
Mehrbach, C., Culberson, C. H., Hawley, J. E., and Pytkowicz, R. M. (1973). Measurement of the apparent dissociation constants of carbonic acid in seawater at atmospheric pressure. Limnol. Oceanogr. 18, 897–907. doi: 10.4319/lo.1973.18.6.0897
Mills, M. M., Kropuenske, L. R., van Dijken, G. L., Alderkamp, A.-C., Berg, G. M., Robinson, D. H., et al. (2010). Photophysiology in two Southern Ocean phytoplankton taxa: Photosynthesis of Phaeocystis antarctica (Prymnesiophyceae) and Fragilariopsis cylindrus (Bacillariophyceae) under simulated mixed-layer irradiance. J. Phycol. 46, 1114–1127. doi: 10.1111/j.1529-8817.2010.00923.x
Mitchell, B. G., and Brody, E. A. (1991). Light limitation of phytoplankton biomass and macronutrient utilization in the Southern Ocean. Limnol. Oceanogr. 36, 1662–1677. doi: 10.4319/lo.1991.36.8.1662
Mitchell, B. G., and Holm-Hansen, O. (1991). Observations and modeling of the antarctic phytoplankton crop in relation to mixing depth. Deep Sea Res. 38, 981–1007. doi: 10.1016/0198-0149(91)90093-U
Moline, M. A., and Prézelin, B. B. (1996). Long-term monitoring and analyses of physical factors regulating variability in coastal Antarctic phytoplankton biomass, in situ productivity and taxonomic composition over seasonal and interannual timescales. Mar. Ecol. Prog. Ser. 145, 143–160. doi: 10.3354/meps145143
Müller, P., Li, X. P., and Niyogi, K. K. (2001). Non-photochemical quenching. A response to excess light energy. Plant Physiol. 125, 1558–1566. doi: 10.1104/pp.125.4.1558
Murata, N., Takahashi, S., Nishiyama, Y., and Allakhverdiev, S. I. (2007). Photoinhibition of photosystem II under environmental stress. Biochim. Biophys. Acta 1767, 414–421. doi: 10.1016/j.bbabio.2006.11.019
Nelson, D. M., and Smith, W. O. (1991). The role of light and major nautrients. Limnol. Oceanogr. 36, 1650–1661. doi: 10.4319/lo.1991.36.8.1650
Norici, A., Bazzoni, A. M., Pugnetti, A., Raven, J. A., and Giordano, M. (2011). Impact of irradiance on the C allocation in the coastal marine diatom Skeletonema marinoi Sarno and Zingone. Plant Cell Environ. 34, 1666–1677. doi: 10.1111/j.1365-3040.2011.02362.x
Oxborough, K., Moore, C. M., Suggett, D. J., Lawson, T., Chan, H. G., and Geider, R. J. (2012). Direct estimation of functional PSII reaction center concentration and PSII electron flux on a volume basis: a new approach to the analysis of Fast Repetition Rate fluorometry (FRRf) data. Limnol. Oceanogr. Methods 10, 142–154. doi: 10.4319/lom.2012.10.142
Petrou, K., Hill, R., Doblin, M. A., McMinn, A., Johnson, R., Wright, S. W., et al. (2011). Photoprotection of sea-ice microalgal communities from the east antarctic pack ice. J. Phycol. 47, 77–86. doi: 10.1111/j.1529-8817.2010.00944.x
Petrou, K., Trimborn, S., Rost, B., Ralph, P. J., and Hassler, C. S. (2014). The impact of iron limitation on the physiology of the Antarctic diatom Chaetoceros simplex. Mar. Biol. 4, 925–937. doi: 10.1007/s00227-014-2392-z
Pierrot, D., Lewis, E., and Wallace, D. W. R. (2006). MS Excel Program Developed for CO2 System Calculations. Oak Ridge: Carbon Dioxide Information Analysis Center, Oak Ridge National Laboratory, US Department of Energy.
Prézelin, B. B., Hofmann, E. E., Mengelt, C., and Klinck, J. M. (2000). The linkage between Upper Circumpolar Deep Water (UCDW) and phytoplankton assemblages on the west Antarctic Peninsula continental shelf. J. Mar. Res. 58, 165–202. doi: 10.1357/002224000321511133
Ralph, P. J., and Gademann, R. (2005). Rapid light curves: a powerful tool to assess photosynthetic activity. Aquat. Bot. 82, 222–237. doi: 10.1016/j.aquabot.2005.02.006
Raven, J. A. (2011). The cost of photoinhibition. Physiol. Plant. 142, 87–104. doi: 10.1111/j.1399-3054.2011.01465.x
Raven, J. A., Beardall, J., and Giordano, M. (2014). Energy costs of carbon dioxide concentrating mechanisms in aquatic organisms. Photosynth. Res. 121, 111–124. doi: 10.1007/s11120-013-9962-7
Raven, J. A., and Johnston, A. M. (1991). Mechanisms of inorganic-carbon acquisition in marine phytoplankton and their implications for the use of other resources. Limnol. Oceanogr. 36, 1701–1714. doi: 10.4319/lo.1991.36.8.1701
Redfield, A. C. (1958). The biological control of chemical factors in the environment. Am. Sci. 64, 205–221.
Reinfelder, J. R. (2011). Carbon concentrating mechanisms in eukaryotic marine phytoplankton. Ann. Rev. Mar. Sci. 3, 291–315. doi: 10.1146/annurev-marine-120709-142720
Rickaby, R. E. M., Henderiks, J., and Young, J. N. (2010). Perturbing phytoplankton: response and isotopic fractionation with changing carbonate chemistry in two coccolithophore species. Clim. Past 6, 771–785. doi: 10.5194/cp-6-771-2010
Riebesell, U., Wolf-Gladrow, D. A., and Smetacek, V. (1993). Carbon dioxide limitation of marine phytoplankton growth rates. Nature 361, 249–251. doi: 10.1038/361249a0
Rokitta, S. D., and Rost, B. (2012). Effects of CO2 and their modulation by light in the life-cycle stages of the coccolithophore Emiliania huxleyi. Limnol. Oceanogr. 57, 607–618. doi: 10.4319/lo.2012.57.2.0607
Rost, B., Riebesell, U., Burkhardt, S., and Sültmeyer, D. (2003). Carbon acquisition of bloom-forming marine phytoplankton. Limnol. Oceanogr. 48, 55–67. doi: 10.4319/lo.2003.48.1.0055
Sakshaug, E., Bricaud, A., Dandonneau, Y., Falkowski, P. G., Kiefer, D. A., Legendre, L., et al. (1997). Parameters of photosynthesis: definations, theory and interpretation of results. J. Plankton Res. 19, 1637–1670. doi: 10.1093/plankt/19.11.1637
Schreiber, U. (2004). “Pulse-Amplitude-Modulation (PAM) fluorometry and saturation pulse method: an overview,” in Chlorophyll a Fluorescence: A Signature of Photosynthesis, eds G. C. Papageorgiou and Govindjee (Dordrecht: Springer), 279–319.
Shi, D., Li, W., Hopkinson, B. M., Hong, H., Li, D., Kao, S.-J., et al. (2015). Interactive effects of light, nitrogen source, and carbon dioxide on energy metabolism in the diatom Thalassiosira pseudonana. Limnol. Oceanogr. 60, 1805–1822. doi: 10.1002/lno.10134
Stoll, M. H. C., Bakker, K., Nobbe, G. H., and Haese, R. R. (2001). Continous-flow analysis of dissolved inorganic carbon content in seawater. Anal. Chem. 73, 4111–4116. doi: 10.1021/ac010303r
Strzepek, R. F., Hunter, K. A., Frew, R. D., Harrison, P. J., and Boyd, P. W. (2012). Iron-light interactions differ in Southern Ocean phytoplankton. Limnol. Oceanogr. 57, 1182–1200. doi: 10.4319/lo.2012.57.4.1182
Suggett, D. J., MacIntyre, H. L., and Geider, R. J. (2004). Evaluation of biophysical and optical determinations of light absorption by photosystem II in phytoplankton. Limnol. Oceanogr. Methods 2, 316–332. doi: 10.4319/lom.2004.2.316
Suggett, D. J., Moore, C. M., Hickman, A. E., and Geider, R. J. (2009). Interpretation of fast repetition rate (FRR) fluorescence: Signatures of phytoplankton community structure versus physiological state. Mar. Ecol. Prog. Ser. 376, 1–19. doi: 10.3354/meps07830
Sweeney, C. (2003). “The annual cycle of surface CO2 and O2 in the Ross Sea: a model for gas exchange on the continental shelves of Antarctica,” in Biogeochemistry of the Ross Sea, eds G. R. DiTullio and R. B. Dunbar (Washington, DC: AGU), 295–312.
Tortell, P. D., Payne, C., Gueguen, C., Strzepek, R. F., Boyd, P. W., and Rost, B. (2008). Inorganic carbon uptake by Southern Ocean phytoplankton. Limnol. Oceanogr. 53, 1266–1278. doi: 10.4319/lo.2008.53.4.1266
Trimborn, S., Brenneis, T., Sweet, E., and Rost, B. (2013). Sensitivity of Antarctic phytoplankton species to ocean acidification: Growth, carbon acquisition, and species interaction. Limnol. Oceanogr. 58, 997–1007. doi: 10.4319/lo.2013.58.3.0997
Trimborn, S., Thoms, S., Petrou, K., Kranz, S. A., and Rost, B. (2014). Photophysiological responses of Southern Ocean phytoplankton to changes in CO2 concentrations: short-term versus acclimation effects. J. Exp. Mar. Bio. Ecol. 451, 44–54. doi: 10.1016/j.jembe.2013.11.001
Trimborn, S., Wolf-Gladrow, D., Richter, K. U., and Rost, B. (2009). The effect of pCO2 on carbon acquisition and intracellular assimilation in four marine diatoms. J. Exp. Mar. Bio. Ecol. 376, 26–36. doi: 10.1016/j.jembe.2009.05.017
Venables, H. J., Clarke, A., and Meredith, M. P. (2013). Wintertime controls on summer stratification and productivity at the western Antarctic Peninsula. Limnol. Oceanogr. 58, 1035–1047. doi: 10.4319/lo.2013.58.3.1035
Wright, S. W., Jeffrey, S. W., Mantoura, R. F. C., Llewellyn, C. A., Bjornland, T., Repeta, D., et al. (1991). Improved HPLC method for the analysis of chlorophylls and carotenoids from marine phytoplankton. Mar. Ecol. Prog. Ser. 77, 183–196. doi: 10.3354/meps077183
Wu, Y., Gao, K., and Riebesell, U. (2010). CO2-induced seawater acidification affects physiological performance of the marine diatom Phaeodactylum tricornutum. Biogeosciences 7, 2915–2923. doi: 10.5194/bg-7-2915-2010
Xu, J., Gao, K., Li, Y., and Hutchins, D. A. (2014). Physiological and biochemical responses of diatoms to projected ocean changes. Mar. Ecol. Prog. Ser. 515, 73–81. doi: 10.3354/meps11026
Yang, G., and Gao, K. (2012). Physiological responses of the marine diatom Thalassiosira pseudonana to increased pCO2 and seawater acidity. Mar. Environ. Res. 79, 142–151. doi: 10.1016/j.marenvres.2012.06.002
Keywords: Southern Ocean, photophysiology, growth, carbon fixation, season, phytoplankton, CO2, climate change
Citation: Heiden JP, Bischof K and Trimborn S (2016) Light Intensity Modulates the Response of Two Antarctic Diatom Species to Ocean Acidification. Front. Mar. Sci. 3:260. doi: 10.3389/fmars.2016.00260
Received: 24 September 2016; Accepted: 25 November 2016;
Published: 15 December 2016.
Edited by:
Susana Agusti, King Abdullah University of Science and Technology, Saudi ArabiaReviewed by:
Pedro Echeveste, Pontifical Catholic University of Chile, ChilePeng Jin, King Abdullah University of Science and Technology, Saudi Arabia
Copyright © 2016 Heiden, Bischof and Trimborn. This is an open-access article distributed under the terms of the Creative Commons Attribution License (CC BY). The use, distribution or reproduction in other forums is permitted, provided the original author(s) or licensor are credited and that the original publication in this journal is cited, in accordance with accepted academic practice. No use, distribution or reproduction is permitted which does not comply with these terms.
*Correspondence: Jasmin P. Heiden, amFzbWluLmhlaWRlbkBhd2kuZGU=