- 1Department of Ocean Systems, NIOZ Royal Netherlands Institute for Sea Research and Utrecht University, Texel, Netherlands
- 2Department of Marine Microbiology and Biogeochemistry, NIOZ Royal Netherlands Institute for Sea Research and Utrecht University, Texel, Netherlands
- 3Department of Ocean Systems, NIOZ Royal Netherlands Institute for Sea Research, Texel, Netherlands
- 4Department of Earth Sciences, Faculty of Geosciences, Utrecht University, Utrecht, Netherlands
Health of tropical coral reefs depends largely on the balance between constructive (calcification and cementation) and destructive forces (mechanical-chemical degradation). Gradual increase in dissolved CO2 and the resulting decrease in carbonate ion concentration (“ocean acidification”) in ocean surface water may tip the balance toward net mass loss for many reefs. Enhanced nutrients and organic loading in surface waters (“eutrophication”), may increase the susceptibility of coral reef and near shore environments to ocean acidification. The impacts of these processes on coral calcification have been repeatedly reported, however the synergetic effects on bioerosion rates by sponges are poorly studied. Erosion by excavating sponges is achieved by a combination of chemical dissolution and mechanical chip removal. In this study, Cliona caribbaea, a photosymbiont-bearing excavating sponge widely distributed in Caribbean reef habitats, was exposed to a range of CO2 concentrations, as well as different eutrophication levels. Total bioerosion rates, estimated from changes in buoyant weights over 1 week, increased significantly with pCO2 but not with eutrophication. Observed chemical bioerosion rates were positively affected by both pCO2 and eutrophication but no interaction was revealed. Net photosynthetic activity was enhanced with rising pCO2 but not with increasing eutrophication levels. These results indicate that an increase in organic matter and nutrient renders sponge bioerosion less dependent on autotrophic products. At low and ambient pCO2, day-time chemical rates were ~50% higher than those observed at night-time. A switch was observed in bioerosion under higher pCO2 levels, with night-time chemical bioerosion rates becoming comparable or even higher than day-time rates. We suggest that the difference in rates between day and night at low and ambient pCO2 indicates that the benefit of acquired energy from photosynthetic activity surpasses the positive effect of increased pCO2 levels at night due to holobiont respiration. This implies that excavation must cost cellular energy, by processes, such as ATP usage for active Ca2+ and/or active proton pumping. Additionally, competition for dissolved inorganic carbon species may occur between bioerosion and photosynthetic activity by the symbionts. Either way, the observed changing role of symbionts in bioerosion can be attributed to enhanced photosynthetic activity at high pCO2 levels.
Introduction
The ocean serves as the largest sink of anthropogenic CO2 on earth after the atmosphere itself. Since the beginning of the industrial revolution, it has taken up ~28% of the emitted anthropogenic CO2 (Le Quéré et al., 2015). The cumulative uptake of atmospheric carbon dioxide by the ocean has increased the total marine inorganic carbon concentration, reduced pH and consequently decreased the CaCO3 saturation state. Together, these effects are termed ocean acidification (OA) and it is predicted that average surface ocean CaCO3 saturation state will have decreased by 25–50% at the end of the current century, depending on the emission scenario (Hoegh-Guldberg et al., 2007; Gattuso and Hansson, 2011; Veron, 2011; Le Quéré et al., 2013).
Eutrophication, caused by increasing release of nutrients and organic material in surface waters, represents an additional threat to near-shore and coral reef environments. Recent studies have shown that local anthropogenic disturbances, such as nutrient and organic rich run-offs from agriculture and coastal development, as well as the input of poorly treated waste waters (Gast et al., 1999; Lapointe and Mallin, 2011; Govers et al., 2014) have caused the average pCO2 of coral reefs to increase ~3.5-fold faster throughout the globe over the past 20 years compared to the open ocean. This is suggested to be caused by a shift in the metabolic balance of coral reef ecosystems (Cai et al., 2011; Cyronak et al., 2014; Yeakel et al., 2015). Such anthropogenic input also promotes growth of opportunistic organisms, such as sponges, macroalgae, turf algae and/or benthic cyanobacteria (Holmes, 2000; Kuffner and Paul, 2001; Gorgula and Connell, 2004; Vermeij et al., 2010), potentially resulting also in major shifts in benthic community compositions (Hughes, 1994; Bruno et al., 2009; De Bakker et al., 2017).
Reef bioerosion by sponges and other bioeroding organisms (Wisshak and Tapanila, 2008) plays an important role in regulating the carbonate budget of coral reefs (Perry et al., 2014). Although the negative effects of OA on production of CaCO3 (calcification) by corals are widely documented (Gattuso et al., 1998; Kleypas and Langdon, 2006; Hoegh-Guldberg et al., 2007; Ries et al., 2009; Pandolfi et al., 2011; Dove et al., 2013), its impact on biologically induced carbonate dissolution and mechanical destruction have been understudied (Zundelevich et al., 2007; Fang et al., 2013a; Wisshak et al., 2014; Enochs et al., 2015; Schönberg et al., 2017) and has so far not been quantified in combination with eutrophication.
Bioeroding sponges contribute between 60 and 90% of total macroborer activity on coral reefs and their (surface-normalized) erosion rates have been found to equal and even surpass calcification rates of hermatypic corals (MacGeachy and Stearn, 1976; Hudson, 1977; Edinger et al., 2000; Carballo et al., 2008; Perry et al., 2014). Bioeroding sponges use a combination of chemical dissolution and mechanical CaCO3 chip removal to erode coral substrate (Nasonov, 1924; Rützler and Rieger, 1973; Pomponi, 1980). It is hypothesized that specialized cells of the bioeroding sponges are able to lower the pH at selected sites to promote controlled aragonite dissolution, thereby creating cavities in which the sponge grows. The mechanisms by which sponges dissolve carbonate has however remained elusive since this etching interface is not directly accessible. Several of the most competitive bioeroding sponges harbor endosymbiotic dinoflagellate zooxanthellae and this symbiosis has been shown to enhance bioerosion in light (Hill, 1996; Fang et al., 2016). This raises the question further as to how symbionts enhance bioerosion. Geochemically, this is paradoxical because the autotrophic symbionts would tend to increase pH and enhance carbonate precipitation rather than dissolution (Garcia-Pichel et al., 2010).
If the chemical composition of the fluid at these sites is related to that of seawater, a reduction in ambient saturation state may lower energetic costs for the sponge to create a micro-environment that is undersaturated for CaCO3, in which the aragonite skeleton may subsequently dissolve and chips are dislodged. Schönberg (2008) provided a first glimpse of a pH gradient toward the etching sites using micro-sensors which may indicate that sponges do indeed alter the chemistry at the site of bioerosion. Although the underlying physiological and mechanical processes employed by the sponges to erode are currently unknown, a number of studies have shown that an increase in pCO2 of the ambient water results in increased bioerosion rates (Wisshak et al., 2012, 2013; Duckworth and Peterson, 2013; Fang et al., 2013a), suggesting that changes in seawater chemistry directly affect the saturation state at the site where the coral aragonite is dissolved.
Since eutrophication may increase effects of OA in coastal waters, we here assess the potential combined effects on bioerosion rates (both chemical and mechanical) of the sponge Cliona caribbaea Carter, 1882. C. caribbaea is found abundantly in the Caribbean and is a representative of the “Cliona viridis species complex,” including clionaids that form a symbiosis with the dinoflagellates of the genus Symbiodinium (Schönberg, 2000). These photosynthetic symbionts (zooxanthellae) provide sponges with a significant fraction of their carbon and energy via photosynthesis (Weisz et al., 2010; Fang et al., 2014). Since this affects diurnal patterns in the holobiont metabolism (Freeman and Thacker, 2011), bioerosion rates by C. caribbaea were determined at day and night.
Materials and Methods
Sample Collection
In December 2015, samples containing the bioeroding sponge Cliona caribbaea were retrieved from dead coral substrate (Diploria spp.), found at a water depth between 3 and 5 m (S = 34 and T = 28°C) at the leeward side of the island of St. Eustatius, Caribbean Netherlands (17.4890° N, 62.9736° W). Annual mean seawater temperature is 27.6°C, varying between 26.1°C in Feb-Mar and 28.2°C in Sept-Oct. Samples were collected using an air drill and hole saw (inner diameter: 40 mm) and transported submerged in ambient SW to an on-shore CO2-controlled experimental set-up. The sponge-infested cores were placed in large flow-through tanks (50 L) for 1 week to allow them to recover from collection and transport. Samples of coral skeleton without bioeroding sponges served as control substrate for the incubations. Collected cores were brushed delicately with a soft brush to remove any non-sponge organisms. The experiment lasted 1 week from December 23 to December 30 2015, excluding acclimatization to the various pCO2 scenarios, which was performed gradually over 6 days from the December 17 to December 22. Each core was photographed at the start (before acclimatization) and at the end of the experiment to assess physical variations throughout the experiment. In addition, fluorescein was released near the ostia half way through the experiment to make sure sponges were still filtering.
Experimental Setup
Sand-filtered nearshore seawater was continuously supplied to four 200-L barrels in which the pCO2 of the water was maintained at four different levels. Water from each of the four barrels was continuously pumped into nine aquaria of 12 L each, resulting in a total of 36 aquaria distributed across three tables (A, B, and C). Three different levels of dissolved organic and inorganic matter concentrations were maintained in three sets of three aquaria within each pCO2 scenario (Figure 1). All aquaria received an irradiance at levels and spectral quality similar to in-situ conditions, as provided by sunlight passing through Marine Blue filters (#131; Lee filters), and neutral density shading cloth. The aquaria were placed in a 5 cm high flow-through bath of seawater to minimize temperature fluctuations.
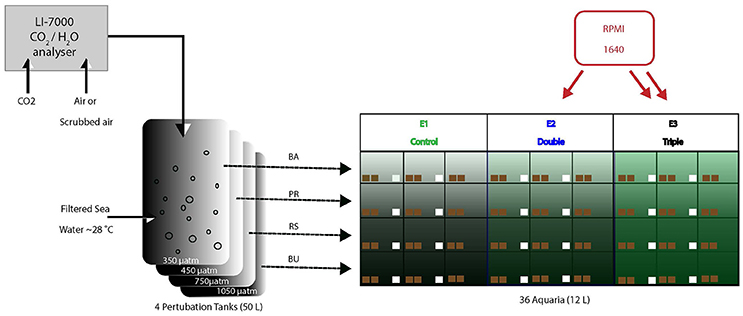
Figure 1. Experimental setup consisting of four large barrels in which the pCO2 (4 levels) is manipulated and controlled through a central CO2 sensor. From every barrel, water is pumped into 9 aquaria (12 L each). Of these 9, two groups of 3 aquaria were supplied with additional dissolved organic carbon (E1: green, E2: blue, E3: black) using peristaltic pumps. Pumps ran at different speed between E2 and E3 to deliver different concentration of RPMI. Each of the 36 aquaria contained 2 sponge bearing coral cores (brown squares) and 24 aquaria contained control cores (white squares).
Carbonate chemistry of the water in the four barrels was manipulated using a feedback control system developed in-house, consisting of a central xCO2 sensor (LICOR Inc. model LI-7000), CO2 injectors, CO2 scrubbers and a control computer. In each barrel, water was adjusted to desired pCO2 concentration via air perturbation continuously pumped at high flow (~25 l/min) through a sparger located at the bottom of the barrel to ensure rapid air-sea pCO2 equilibration. Air from the four treatment barrels was sequentially sampled and analyzed for xCO2. Measurements of xCO2 (in ppm) were converted to pCO2 (in μatm) by accounting for average hydrostatic pressure after bubble injection, water temperature and salinity and the humidity of the measurement gas stream following Dickson et al. (2007). Additionally, a zero-standard and ambient air were regularly measured to allow approximate drift-free operation. The measured pCO2 levels were compared by a central computer system to set points and adjusted by either (i) injecting small amount of pure CO2 into the circulated headspace air or (ii) recirculating the air through large soda lime-filled CO2 cartridges to remove CO2. The system allowed treatment and delivery of ~50 liters of water per hour. The four treatments included a pre-industrial scenario (PI; 280 μatm), a present-day scenario (PD; 410 μatm), and two concentrations based on scenarios for potential future atmospheres predicted for 2100 (Solomon, 2007): one based on a ‘reduced’ CO2 emission scenario (RE; 750 μatm) and one based on a ‘business-as-usual’ CO2 emission scenario (BU; 1050 μatm). Reported pCO2 is valid for the culturing temperature (i.e., slightly cooler than the treatment barrels), and estimated to be accurate to within 10 μatm.
Different amounts of dissolved organic and inorganic material were supplied from stock solutions by two 12-channel peristaltic pumps. Roswell Park Memorial Institute (RPMI) 1640 medium was used as the eutrophication supplement. RPMI is a well-known culture medium and it has been used as a growth enhancer on C. crambe sponge explants (Camacho et al., 2006). It contains sugars, inorganic salts, amino acids and vitamins and was used to simulate different levels of eutrophication in the aquaria.
The experiment aimed to provide multiples (1x, 2x, 3x) of the natural near-shore labile DOC concentrations. Labile DOC represents the portion of the total DOC pool on which sponges can feed, here ~20% of ~80 μmolC/kg (Van Duyl and Gast, 2001; De Goeij and Van Duyl, 2007). Treatments were E1: control labile DOC conditions (i.e., only ~16 μmol/kg natural labile DOC), E2: double labile DOC conditions (natural DOC + 16 μmol/kg DOC as RPMI1640) and E3: triple labile DOC conditions (natural + 32 μmol/kg RPMI 1640).
In total, 72 sponge-bearing cores and 24 control cores were collected and distributed evenly over the 12 scenarios, resulting in 2 sponge-bearing cores per aquarium and 2 control cores per scenario. Cores from increased-pCO2 scenarios were exposed to gradually increasing pCO2 over 1 week, ending with the desired pCO2 for that treatment. Addition of RPMI started as scenarios reached their desired pCO2 concentration. Subsequently, sponges were left to acclimatize to their respective carbon dioxide and eutrophication levels for a week prior to the incubations. Cores were placed in closed 0.5 L polycarbonate incubators with inbuilt stirrers in their respective aquaria to keep at constant temperature. Each incubation contained two cores and lasted 6 h to determine chemical bioerosion rates (see Assessment of Bioerosion Rates). The optimum incubation time was determined through trials of 2, 4, 6, and 8 h. Although 6 h was considered the best fit to capture the alkalinity gradient caused by chemical bioerosion, it must be noted that sponges placed in 0.5 L of standing water for more than 1 h would experience lack of food and reduced amounts of oxygen (especially at night) over time. At the end of each incubation, cores were returned to their aquaria.
Data Collection
Temperature and irradiance of the water in the aquaria were recorded every 10 min by 6 HOBO® Pendant UA-002-64 light and temperature loggers and 2 calibrated Odyssey PAR sensors (Dataflow Systems, X, Y), respectively. Salinity was recorded daily in each aquarium using a salinometer (VWR CO310). Oxygen was recorded using a PreSens O2 sensor (Fibox 4, PSt3) after each incubation. Throughout the experiment, every other day around noon, water samples were taken from each treatment to monitor carbonate chemistry, DOC and nutrients. Samples for alkalinity (AT) and dissolved inorganic carbon (DIC) were collected into 250 ml borosilicate bottles and poisoned with 50% saturated HgCl2 solution (final concentration 0.02 %) to arrest biological activity. DOC samples (30 ml) were collected in pre-combusted (550°C) glass vials and acidified with 10 drops of concentrated HCl (37%). Both AT and DIC were measured on a Versatile Instrument for the Determination of Titration Alkalinity (VINDTA) model 3C (Marianda GmbH, Kiel, Germany). Determination of AT was by “open cell” potentiometric acid titration (Mintrop et al., 2000; Dickson et al., 2007) and DIC was measured coulometrically (Johnson et al., 1993; Dickson et al., 2007). Prevention of drift and a high accuracy for AT and DIC were attained by analysis of certified reference material (CRM; supplied by Dr. A. Dickson, Scripps Institution of Oceanography) after every ~20 samples. The full carbonate system state was calculated from the measured temperature, salinity, AT and DIC using the Seacarb package (R-3.2.0) and using the dissociations constants preferred by Dickson and Millero (1987). Samples for determination of nitrate + nitrite, nitrite, phosphate and ammonium were filtered upon collection and stored frozen. Analyses for nutrients were carried out on a QuAAtro continuous flow analyzer (SEAL Analytical, GmbH, Norderstedt, Germany) following GO-SHIP protocol (Hydes et al., 2010). DOC analyses were performed with a total carbon analyzer (TOC-VPN, Shimadzu Corp., Kyoto, Japan).
Assessment of Net Respiration and Photosynthesis Rates
Observed changes in DIC and AT are governed by the combination of respiration and carbonate dissolution and the associated reverse processes of photosynthesis and calcification. The individual contributions of respiration and carbonate dissolution can be disentangled by empirically adjusting observed Δ AT for nutrient effects using the measured nutrient concentration buildup. Indeed, in the case of incubation experiments, all of the change in nutrient concentrations must originate from processes within the incubation chamber. Therefore, this method will result in an appropriate estimate of respiration/dissolution, making calculated bioerosion rates insensitive to errors in measured DIC. Additionally, it takes into account the effect of release of NH4+ on measured AT, which the vector deconvolution does not and cannot, due to the variable release stoichiometry of NH4+. Calculations were carried out as follow:
Pretreatment:
Relationships:
ΔDICresp was then converted into respiration rates which were used to estimate approximately gross photosynthesis rates as follow:
This method assumes that sponge host respiration is constant during day and night and that symbionts produce 1 mole of O2 for every mole of CO2 they fix.
Assessment of Bioerosion Rates
Total, chemical and mechanical bioerosion rates were quantified. Total bioerosion refers to the sum of both mechanical and chemical bioerosion.
We expressed chemical and mechanical rates both in mg cm−2 h−1 (to distinguish rates between day and night) and in mg cm−2 day−1 (sum of day and night rates). Total bioerosion was expressed in mg cm−2 day−1 using both buoyant weight results and the sum of day and night results for chemical and mechanical bioerosion.
Chemical Bioerosion
Chemical bioerosion was determined using the alkalinity anomaly technique (Smith and Key, 1975; Chisholm and Gattuso, 1991) involving measured changes in AT (μmol kg−1) associated with dissolution in seawater during 6 h incubation periods and correcting for changes in the concentrations of ammonium, nitrate and phosphate (Jacques and Pilson, 1980; Wisshak et al., 2013). The amount of mass of dissolved calcium carbonate [ΔM(CaCO3), in μg] was calculated using Equation (1) (Zundelevich et al., 2007; Nava and Carballo, 2008):
Where Δ AT is the increase in AT over the incubation period associated with dissolution, VSW is the volume (l) of seawater in the incubation chamber and ρSW is local seawater density (1.022 kg L−1). The multiplication factor “100” represents the molecular mass of CaCO3.
The 6 h incubations were carried out during both the day and at night, starting either 2 h after sunrise and 1 h after sunset, respectively. Subsamples were used for determination of AT and DIC (250 ml, single sample), DOC (30 ml) and nutrient (5 ml) analysis from each chamber at the start and end of each incubation.
Bioerosion rates are commonly expressed as mass of removed substrate per unit surface area of the removing organism per unit time. Rates were therefore converted to mg cm−2 h−1 by expressing the change in AT per surface area of the sponge. Two surface areas of the sponge-bearing cores were determined, the upper circle and the healed surface around the sides of the core.
Mechanical Bioerosion
Mechanical bioerosion was estimated by quantifying the CaCO3 sediment produced by C. caribbaea during 6 h incubations using the method described in Fang et al. (2013b). All remaining incubation chamber seawater (~150 ml) + sediment was collected and the chamber was rinsed with 100 ml water to retrieve any remaining chips. The water was then sieved over a 150 μm mesh to remove non-chip material and then filtered through a precombusted (550°C, 3 h) and pre-weighed GF/F glass microfiber filter (0.7 μm; Whatman). Filters were then combusted at 550°C for 3 h to remove any organic matter and re-weighed to determine the difference in weight and hence that of the sediment produced.
Total Bioerosion
Total bioerosion (both mechanical and chemical) was estimated by the change in buoyant weight of the cores over the week of exposure to different pCO2 and eutrophication scenarios (Fang et al., 2013b). This method assumes organic components of the sponge to have a density equal to that of the ambient seawater (i.e., growth of the sponge will not change buoyant weight of the core). Both sponge cores and control cores were buoyant weighed using electronic scales with 0.1 mg accuracy before and after the week's exposure to the various pCO2 levels. The buoyant mass change of the cores was calibrated for seawater density and corrected by the change in buoyant weight of the control cores, which integrated possible dissolution by other bioeroders, abrasion caused to handling process and accretion due to the potential presence of calcifying organisms.
Statistical Analysis
All statistical analysis were performed using the programming environment R 3.3.2 (R Core Team, 2013). Dependent variables acquired from incubation experiments were analyzed by means of an analysis of covariance (ANCOVA) with two categorical factors (Eutrophication, day/night) including three (E1, E2, and E3) and two (day and night) levels, respectively and one continuous covariate (pCO2). Total bioerosion rates acquired from buoyant weight measurements and net photosynthesis rates were analyzed by means of a 4 × 3 crossed analysis of variance (ANOVA) with two categorical factors (pCO2, eutrophication) including four (BA, PR, RS, and BU) and three (E1, E2, and E3) levels, respectively.
Normality and homoscedacity were confirmed using the Shapiro-Wilk and Levene's test, respectively. If no significant two-way interactions were revealed, main effects were reported. In the case of significant interactive effects, Post hoc tests (Tukey HSD with Bonferroni correction) were applied to determine the effect of a factor at each level of the other.
In addition, linear regression models were performed, after confirming assumptions for residual normality and homoscedacity, between pCO2 (now as a continuous predictor variable) and chemical bioerosion rates for each eutrophication and time levels.
Results
Health
The sponge tissue damaged due to coring healed during the recovery session and started growing along the upper sides of the core throughout the experiment which indicated that sponges were healthy and recovering. Sponge color from the start to the end only varied very slightly, sponges in every treatment became a bit darker which may indicate a higher chlorophyll-a content in symbionts or an increase in symbiont abundance. Fluorescein injections revealed that sponges were still filtering half way through experiment.
Seawater Variables
Over the course of the experiment, headspace pCO2 in the four barrels remained sufficiently constant to warrant distinction between treatments (Figure 2, Table 1). Calculated mean pCO2 values in the experimental aquaria were 362.5, 443.8, 755.9, and 1046.0 μatm under PI, PD, RE, and BU. The pCO2 levels in PI were on average 82.5 μatm higher than the intended pre-industrial pCO2 levels. However, they remained significantly different from the present scenario and therefore the pre-industrial scenario will be termed “Below-ambient” (BA) in the following text. Sponge cores were exposed to natural variations in temperature and light which, however, proved to be minimal over the experimental period. The average experimental temperature was 27.63°C (min = 25.81°C and max = 29.75°C) and the average light intensity registered inside the aquaria around midday was 562 ± 125.0 μmol photons m−2 s−1. Measured DIC and hence all calculated carbonate system parameters were found to vary significantly across the four OA scenarios (Table 1) and dissolved organic carbon (DOC), ammonium (NH4), and phosphate (PO4) concentrations were found to increase significantly across the eutrophication treatments (Table 2, Supplementary Figure S1).
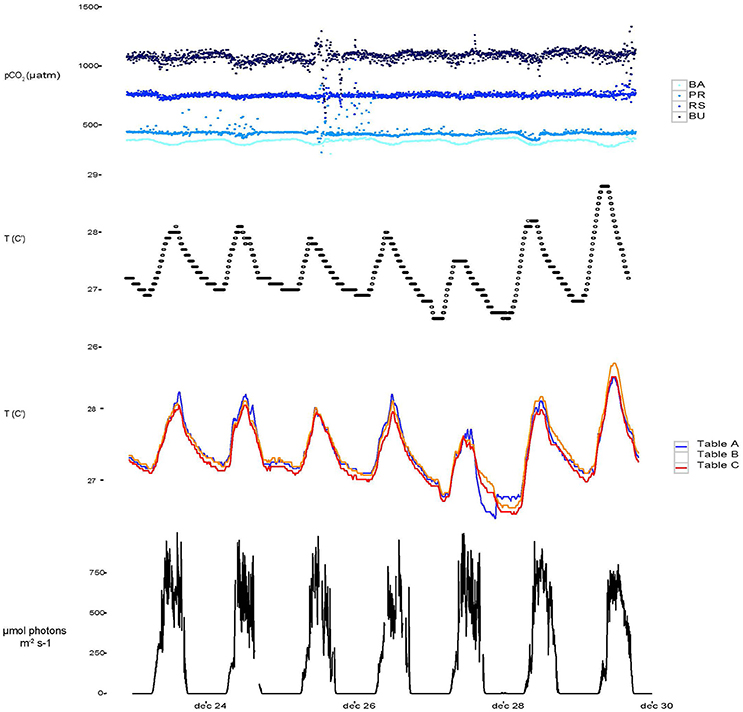
Figure 2. Temporal variability from December 23 to December 30 2015 of continuously monitored pCO2 (a), temperature monitored in the barrels used for setting the pCO2 experiments (b), temperature measured directly in aquaria from table A, B, and C (c) and light throughout the 1 week experiment.
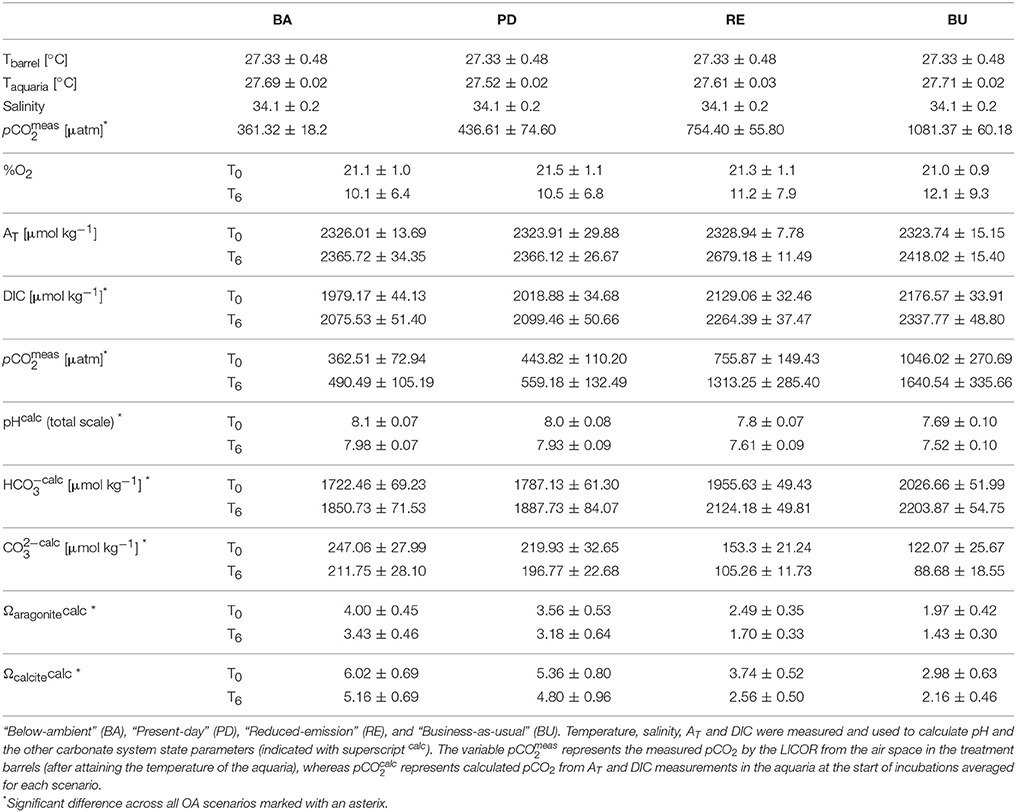
Table 1. Seawater physical and carbonate chemistry parameters at the start (T0) and the end (T6) of incubation experiments, averaged (±standard deviation) over all incubations for each pCO2 scenario.
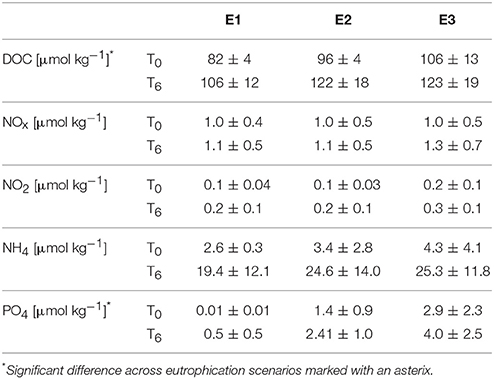
Table 2. Initial (T0) and final (T6) DOC and nutrient concentrations averaged over all incubations (± standard deviation) for the three “eutrophication” treatments: “E1” (natural organic loading), “E2” (double labile organic loading), “E3” (triple labile organic loading).
Bioerosion, photosynthesis and respiration within incubations altered the carbonate chemistry of the water (Table 1). Within the holobiont microenvironment, photosynthesis would increase the local pH while respiration would increase local acidification. Throughout all incubations, the pCO2 concentrations increased and the pH and Oaragonite decreased. The change in pCO2, pH and Oaragonite was significantly different between pCO2 scenarios and between day and night. In none of the incubations, Oaragonite reached values below 1. Initial pCO2 concentrations calculated from AT and DIC at the beginning of each chamber incubation were found to increase slightly with addition of RPMI for each OA scenario. Accordingly, pH and CaCO3 saturation state decreased with addition of RPMI for each OA scenario. However, no significant difference was found in calculated pCO2 concentrations, pH, and CaCO3 saturation state between eutrophication treatments in each OA scenario. Dissolved organic carbon and nutrient concentrations increased overall throughout incubations (Table 2, Supplementary Figure S2).
The observed increase in nutrients (Table 2) was not unexpected (Maldonado et al., 2012), but the enhanced concentrations could have interfered S2 with chemical bioerosion measurements. The increase in dissolved organic carbon (Table 2) was likely caused by the confinement of sponges in the incubation chambers, where sponge waste products were re-filtered during the 6 h incubation. Nevertheless, Cliona delitrix, another clinoid sponge, is known to assimilate DOM, which comprises a large part of its diet (Mueller et al., 2014). Despite these confinement effects, relative differences in bioerosional processes between treatments were still observed.
Chemical Bioerosion Rates
In total, 72 chamber incubations were conducted (36 during the day and 36 at night) after 1 week exposure to treatments. Of all incubations, 13 were compromised due to technical complications. The results for the successful 59 incubations are presented here. For the present-day (PD) pCO2 scenario, no data in treatment E2 during the day are available.
As sponges experienced significant increase in pCO2 concentrations throughout incubations, chemical rates were regressed against the average calculated pCO2 obtained from AT and DIC measurement at the start and end of each incubations. As a result, for each pCO2 scenario, day and night pCO2 levels differ from each other.
Chemical bioerosion rates of C. caribbaea increased significantly with pCO2 and eutrophication levels but no interaction was found between the two effects (Figure 3, Tables 3, 5). In addition, day-time chemical bioerosion rates are shown to differ significantly from night-time rates, and an interaction between the effects of pCO2 and day-night is revealed (Tables 3, 4). A post hoc pairwise comparison revealed that the significant differences in chemical bioerosion rates between day and night mostly occurred at low pCO2 scenarios where day time rates were ~50% higher than night-time rates. In high pCO2 scenarios (RE and BU), average day-time and night-time rates were equal in E1 and average night-time rates surpassed day-time ones in E2 and E3 (Table 3). The increase in pCO2 concentration during incubations at day and night was not significantly different between PD, RS, and BU. This indicates that the switch from higher rates during the day at low pCO2 scenarios (BA and PR) to equal/higher rates in RE and BU is not primarily linked to the difference in day and night pCO2.
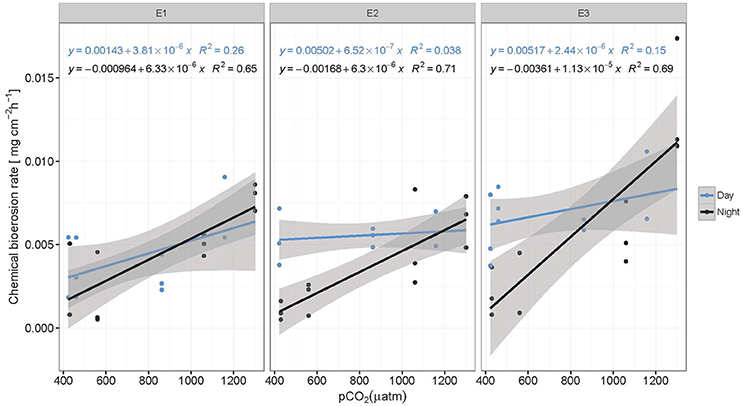
Figure 3. Chemical bioerosion rates in mg cm−2 h−1 as a function of pCO2 for day and night and each eutrophication treatment. Linear regressions illustrate positive correlation between pCO2 and dissolution rates. Slopes are significantly different between day (blue) and night (black) but not between eutrophication scenarios (E1–E3). Alkalinity titrations for incubations in Present scenario (PD) and E2 treatment during the day were of questionable quality due to equipment failure and therefore not represented here (N = 59).
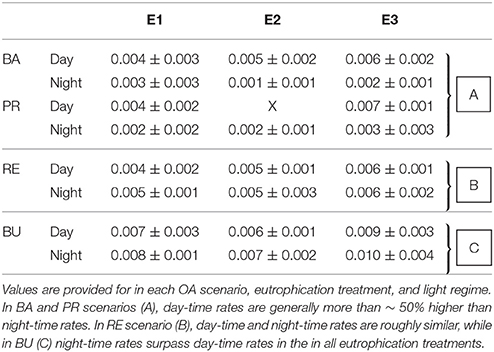
Table 3. Averages (±standard deviation) of chemical bioerosion rates in mg cm−2 h−1, as calculated from change in AT during incubations.
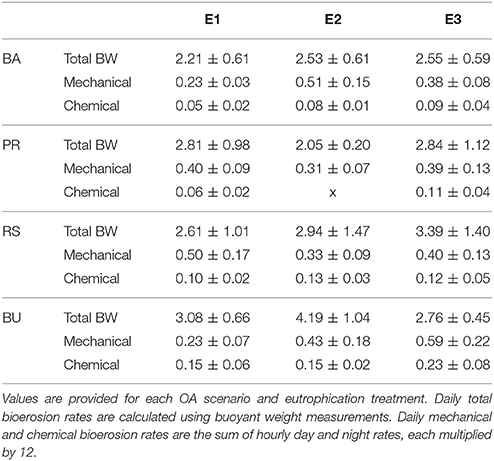
Table 4. Daily averages (±standard deviation) of total, mechanical, and chemical bioerosion rates in mg cm−2 d−1.
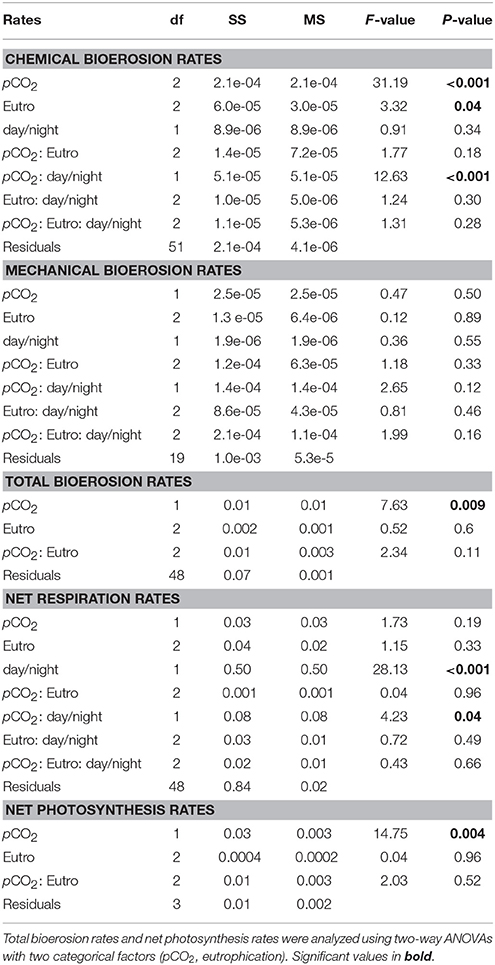
Table 5. Three-way ANCOVAs, with bioerosion rates (chemical: AT change, mechanical: chip production, and total: buoyant weight) and net respiration rates as dependent factors, eutrophication, and day/night as independent categorical factors and pCO2 as a continuous covariable.
Average day and night chemical bioerosion rates increased significantly from E1 to E3 for each of the pCO2 scenarios, however, increases in rates from E1 to E2 were minute and even negative at night (Table 3). Daily chemical rates (mg cm−2 day−1) in BA, PR, RE, and BU increased by 80, 83, 20, and 53% from E1 to E3, respectively (Table 4). Rates in E1 and E3 increased by 150 and 109% respectively from current pCO2 levels to the BU scenario (no PD, E2 chemical rate available).
In these calculations, abiotic dissolution was assumed negligible as aragonite saturation states always remained above 1. Possible bioerosion by other organisms living in the cores is not accounted for in our calculations but is considered minimal throughout the incubation period due to very low AT changes in control core incubations (Supplementary Table S1).
Mechanical and Total Bioerosion Rates
Mechanical bioerosion estimated from chip collection was not significantly different between pCO2 scenarios and eutrophication treatments and no interaction was found between effects (Tables 4, 5). The average hourly mechanical erosion rate for all pCO2 scenarios and eutrophication treatments during day and night equaled 0.02 ± 0.01 mg cm−2 h−1. The average daily rate estimated from the addition of night and day rates equaled to 0.40 ± 0.11 mg cm−2 d−1.
The change in buoyant weight yielded average net bioerosion rates of 2.47 ± 0.16, 2.63 ± 0.25, 2.96 ± 0.33, and 3.34 ± 0.26 mg cm−2 d−1 for BA, PD, RE, and BU, respectively and increased significantly with pCO2 (p = 0.009; Figure 4, Table 5). Although in most pCO2 scenarios, treatment E2 and E3 yielded higher total bioerosion rates than in E1, rates were not found to increase significantly with eutrophication (Figure 4, Table 5). Net bioerosion rates calculated from buoyant weight measurements were ~4–5 times higher than the sum of the measured chemical and mechanical (chips) bioerosion rates at day and night (Figures 4, 5, Table 4).
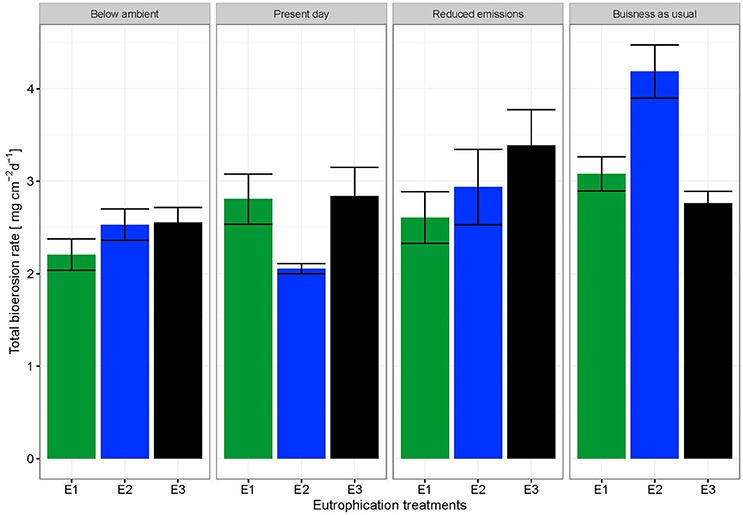
Figure 4. Total bioerosion rates of C. caribbaea in mg cm−2 d−1 estimated from buoyant weight measurements ± SEM for each pCO2 and eutrophication scenario. Estimates for buoyant weighing are based on all individual measurements (N = 59).
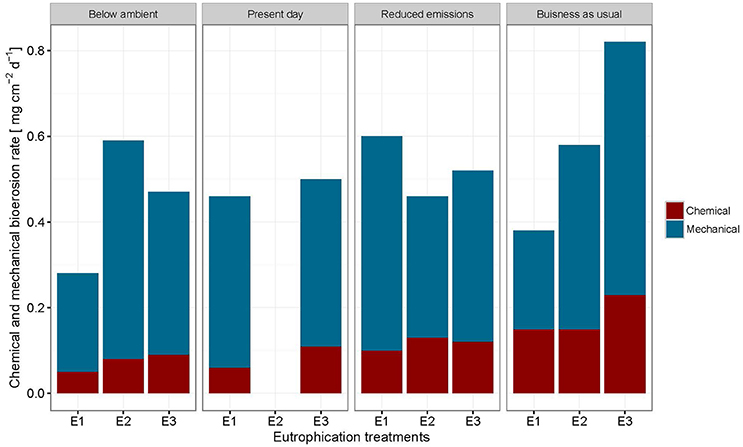
Figure 5. Sum of chemical and mechanical bioerosion in mg cm−2 d−1 for each pCO2 and eutrophication scenario. Mechanical bioerosion rates were estimated using the weight of chips collected during 6 h incubations. Chips were only collected for table A and B during the day and night (N = 44). Chemical bioerosion rates were calculated from ΔAT in incubations (N = 59). Day (24 h) rates were calculated by multiplying day and night mechanical and chemical hourly rates by 12 and adding them together for each pCO2 and eutrophication scenario.
Net Respiration and Photosynthetic Rates
Net holobiont (sponge + symbionts) respiration showed antagonistic behavior between day and night as pCO2 increased. Net respiration during the day decreased with high pCO2 while net respiration at night increased (Figure 6). Rates were found to vary significantly between day and night (p ≤ 0.001) but not between pCO2 scenarios and eutrophication treatments. An interaction between factors day/night and pCO2 levels was revealed (Table 5).
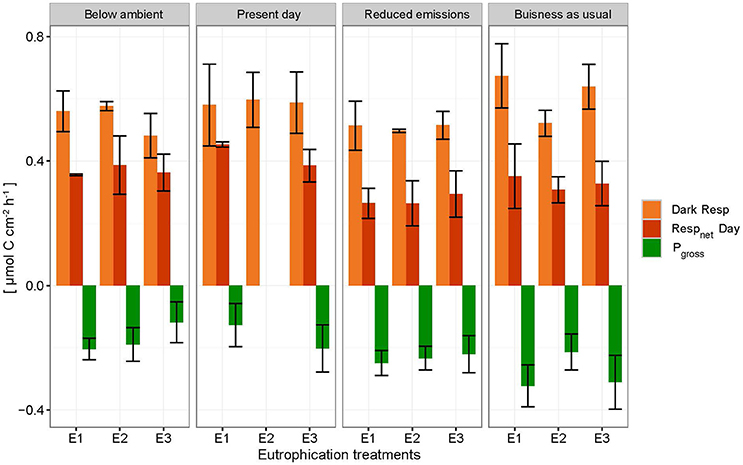
Figure 6. Net respiration rates (Respnet) during the day (dark orange), dark respiration rates (dark Resp) during the night (light orange) and gross photosynthesis (Pgross) of the holobiont (sponge + symbionts) ± SEM for each pCO2 and eutrophication scenario. Pgross was derived from the net respiration of the symbionts (shown as negative respiration in the figure by assuming that 1 mole CO2 respired during the night equals 1 mole O2 produced during the day).
Accordingly, photosynthesis rates (O2 production), estimated from the difference between net respiration rates at day and night, increased significantly with increasing pCO2 (p = 0.004; Figure 6, Table 5). No significant difference was found between primary production and eutrophication scenarios, although photosynthetic activity appeared to decrease with increasing eutrophication in most pCO2 scenarios.
Discussion
Total bioerosion rates by the common coral excavating sponge Cliona caribbaea are experimentally shown to increase with rising pCO2 (Figure 4), while the corresponding chemical bioerosion component increased significantly with both pCO2 and eutrophication (Figure 3). Mechanical bioerosion exceeded chemical bioerosion by 3–6 times irrespective of pCO2 and eutrophication. Contribution of eutrophication to higher chemical bioerosion rates was additive to pCO2 effects (i.e., not synergetic). Differences between day-time and night-time chemical bioerosion rates at below-ambient and present pCO2 levels suggests that photosynthetic activity by symbionts promotes the dissolution process. While under rising pCO2, the symbiotic relationship appears to become negligible to the bioerosion activity as night-time rates equal/surpass day-time rates.
Effects of pCO2 and Eutrophication on Bioerosion
Results regarding higher rates at increased pCO2 are comparable to previous studies on other clionaid species (C. orientalis and C. celata) (Wisshak et al., 2012, 2013, 2014; Fang et al., 2013a). Sponges and other borers are assumed to benefit from eutrophication (Holmes, 2000; Carballo et al., 2008). Many sponges on reefs harbor photosynthetic symbionts and in some cases they produce >50% of the energy requirements of the host (Erwin and Thacker, 2008). They rely nevertheless also on organic matter for food and their feeding strategy may be flexible depending on the type of symbionts or the environmental conditions. To maintain a positive energy budget, C. caribbaea likely relies mainly on autotrophic products (Weisz et al., 2010; Fang et al., 2014) and thus depends on the supply of organic matter for maintenance and growth from its photosymbionts. Considering the low phosphate concentrations in E1 (~0.01 μmol l−1), primary production may have been limited by phosphate. However, the addition of RPMI and hence higher phosphate concentrations did not enhance photosynthetic activity from E1 to E3. On the contrary, in most pCO2 scenarios, net primary production estimates decreased slightly (non-significant) from E1 to E3, while sponge chemical bioerosion rates were enhanced. It should be noted here that potential light limitation of symbiont photosynthesis in the incubations tanks may not be discounted. Under increased organic matter and nutrient levels, the sponges may be less dependent on autotrophic products. However, as the increase in chemical bioerosion rates from E1 to E3 was more pronounced during the day (at low and ambient pCO2 levels), it is likely that the autotrophic/heterotrophic ratio of energy supply only shifts slightly toward heterotrophy and the sponges still rely partly on autotrophic products.
Chemical bioerosion rates at night-time increase also (at a lesser degree) with higher eutrophication, indicating that chemical bioerosion does indeed benefit from a higher energy supply via heterotrophic feeding. This implies that increased eutrophication did not impact the productivity of the symbionts. Sponges, like corals, can exercise control on symbiont growth and abundance by inhibiting division or ingesting them to maintain population size near a carrying capacity (Hill, 2014).
Total bioerosion rates calculated using buoyant weight measurements were experimentally shown to increase significantly with pCO2 but not with eutrophication. These results are unexpected considering the significant impact eutrophication has on chemical bioerosion. However, the relatively short term experiment coupled with the smaller effect of eutrophication on chemical rates compared to the pCO2 impact may have obscured this signal.
Total bioerosion rates estimated from buoyant weights resulted in ~5 times higher rates than those based on the sum of chip production and the change in AT (Figures 4, 5). This is comparable to results from Fang et al. (2013a) and may be explained by an underestimation of the chip removal capacity of the sponge. Rates calculated using buoyant weight measurements are based on a longer period of bioerosion (1 week), whereas the chip removal is based on their collection at the end of a relatively short incubation period (6 h). Sponges might expel chips irregularly or they may temporarily reduce chip removal during incubations possibly due to stress caused by reduced food supply or build-up of waste products, both of which may become important toward the end of the 6 h-incubation period. Therefore, the sum of chemical and mechanical bioerosion should be considered as being conservative. Here, total bioerosion rates yielded from buoyant weight measurements are regarded as more reliable and are comparable to results estimated from previous studies (Fang et al., 2013a; Wisshak et al., 2013).
Rates of chip production did not differ significantly between pCO2 scenarios, day/night and eutrophication treatments. Although the underlying method by which sponges expel chips is largely unknown, it appears that chips are expelled from the sponge body through excurrent canals (Rützler and Rieger, 1973). It is likely that chip removal processes utilize products from the dissolution to contract their tissue and move the chip up from the boring pit into an excurrent canal. Work on phototrophic cyanobacteria showed that microbial excavation was achieved by transcellular Ca2+ transport (Garcia-Pichel, 2006; Garcia-Pichel et al., 2010; Guida and Garcia-Pichel, 2016). We tentatively suggest that the excess in Ca2+ derived from the dissolution in may be used by sponges to contract a conductive pathway, similarly to how muscle cell contract when triggered by an increase in intracellular Ca2+ (Sommerville and Hartshorne, 1986).
Respiration, Photosynthesis and Changes in Chemical Bioerosion Rates
Changes in chemical bioerosion activity can be associated with three processes within the holobiont: CO2 fixation/respiration by the symbionts, respiration by the sponge and chemical bioerosion. Photosynthesis promotes chemical bioerosion rates during the day at low pCO2 levels (BA and PD) (Figure 3, Table 3). Differences in rates between day and night are comparable to results from previous studies where C. orientalis and C. varians (both symbiont bearing species) excavated with higher rates in day light compared to the dark or shade at ambient pCO2 (Hill, 1996; Schönberg, 2006; Fang et al., 2016). Recent work by Fang et al. (2016) on the ecophysiology of C. orientalis showed that bioerosion rates in this sponge during day-time were ~40% higher than in the dark. C. celata on the other hand, an azooxanthellate sponge, displayed no diurnal variability in bioerosion pattern (Schönberg, 2008). Based on these findings, presence of Symbiodinium spp. was assumed to be associated with higher bioerosion rates (Hill, 1996; Fang et al., 2016). Geochemically speaking, this is a paradox because the autotrophic symbionts would tend to increase pH, increase saturation state and thereby aid carbonate precipitation rather than its antagonistic process (Garcia-Pichel et al., 2010).
However, local acidification due to sponge respiration may balance out the increase in pH associated with photosynthesis. As symbionts do not produce a favorable environment for carbonate dissolution, photosynthesis must therefore supply a high fraction of the energetic costs of the bioerosion process which may include ATP usage for active Ca2+ and/or active proton pumping (Guida and Garcia-Pichel, 2016). Higher rates during the day at low and ambient pCO2 indicate that the benefit of acquired energy from photosynthetic activity exceeds the benefit of increased pCO2 levels at night due to respiration.
Due to the sponge's energetic dependence on photosynthates for enhanced bioerosion activity, the capacity of phototrophic sponges to excavate may be particularly sensitive to environmental changes impacting photosynthesis. Our results suggest that photosynthesis is enhanced with increased pCO2 (Figure 6), possibly due to a switch from to CO2 uptake. Fang et al. (2014) describes a greater supply of photosynthetic products from symbionts in the “reduced emissions” scenario (pCO2 = 645 μatm, temperature = 28.4°C) to meet higher metabolic demands. Photosynthetic products by symbionts may be used for biosynthesis and respiration by the zooxanthellae or transferred to the associated sponge where it is used for metabolic maintenance via respiration or growth (Fang et al., 2014).
Despite enhanced photosynthetic rates with rising pCO2, day-time chemical rates did not seem to benefit from this boost in energy supply as they were found to be comparable and even lower than night-time rates. The relationship between the sponge and its symbionts regarding bioerosional processes seems to change at higher pCO2. We hypothesize that the increase in local pH associated with enhanced photosynthesis may be too large to be balanced out by local respiration acidification. In other words, the increased photosynthetic activity may have an antagonistic effect with respect to acidification during day-time due to higher uptake of CO2 by the symbionts. Borges and Gypens (2010) argued that the effect of enhanced primary production on carbon cycling can counter the effect of ocean acidification. Increased respiration might stimulate primary production by increased translocation of CO2 of the sponge to the symbionts. The antagonistic behavior of trends observed between respiration at night and net respiration during the day with rising pCO2, is attributed to enhanced photosynthesis resulting in greater CO2 fixation by photosymbionts.
Furthermore, competition for dissolved inorganic carbon species may occur between bioerosion and photosynthetic activity by the symbionts.
Comparison and Extrapolation of Bioerosion Rates
Estimates of chemical and mechanical bioerosion for C. caribbaea are comparable to those calculated for C. orientalis under a range of CO2 concentrations (Fang et al., 2013a; Wisshak et al., 2013, 2014). This is consistent with the membership of C. caribbaea to the Cliona viridis-complex (Schönberg, 2002). Our chemical rates ranged from 0.06 to 0.15 mg cm−2 day−1 from present day to business-as-usual pCO2 levels. Estimates by Fang et al. (2013a) ranged from 0.08 to 0.3 mg cm−2 day−1 while rates by Wisshak et al. (2014) ranged from 0.02 to 0.26 mg cm−2 day−1. Mechanical rates from Fang ranged from 0.12 to 0.16 mg cm−2 day−1 whilst our results ranged from 0.23 to 0.5 mg cm−2 day−1 (in E1). Total bioerosion rates from this study were nearly three times higher than those of Fang et al. (2013a) and Wisshak et al. (2014). Discrepancies between results can be attributed to differences in the methodology and calculations between these experiments. For instance, Wisshak et al. (2014) only conducted dark incubations which would explain the relatively low rates at ambient pCO2. These inconsistencies in the methodology between experiments are complicating comparison between results from different studies. Therefore, there is a need for method standardization regarding sponge bioerosion rates experiments. In addition, incubation methods are affecting sponges and are preventing accurate determination of rates. Up to now, closed incubations have been sufficient to observe relative variation between pCO2, temperature and eutrophication treatments. This sheds light on how boring sponges may react to future environmental changes. However, if we are to quantify such reaction, it is essential that rates are more accurately measured. Using semi enclosed incubation chambers may increase accuracy of chemical rates greatly. As the method involved in quantifying mechanical bioerosion rates is regarded as untrustworthy, collection of chips should be applied to a longer stretch in time.
Extrapolations should be treated with caution as it is an enormous jump to go from 6 h incubations to yearly estimates (McElhany, 2016), especially considering how seasonality and therefore different irradiance levels of light may impact bieoerosion rates of photosymbiotic sponges. Still, when extrapolating chemical bioerosion rates from our experiment to yearly estimates, rates in the present-day (PD) pCO2 scenario and in the business as usual (BU) scenario ranged from 0.22 to 0.55 kg m−2 year−1 in E1 and from 0.40 to 0.84 kg m−2 year−1 in E3. This corresponds to a doubling of rates by the end of this century. Even in a slightly more optimistic scenario, where CO2 emissions are reduced, chemical bioerosion rates would increase by 50% compared to present rates. However, combined effects of pCO2 and eutrophication, result in rates ranging from 0.22 kg m−2 year−1 in PD: E1 to 0.84 kg m−2 year−1 in BU: E3 which nearly corresponds to a quadrupling in chemical bioerosion rates.
Conclusions
Considering ongoing ocean acidification, combined with increasing coastal eutrophication around Caribbean islands, these finding suggests that sponge bioerosion will increase in the next century. The combined effect of OA and eutrophication on bioerosional activity was not synergetic but additive. Enhanced bioerosion in future oceans together with reduced calcifying potential of corals will inevitably tip the balance between reef accretion and bioerosion processes toward net loss of carbonate structure.
Results from our incubation experiments increases our understanding of the effect of symbionts on bioerosional activity. Greater chemical bioerosion during the day at low and ambient pCO2 suggest that the energy gained by photosynthetic activity is fueling a high fraction of the metabolic cost at the site of erosion which may include ATP usage for active Ca2+ and/or active proton pumping. At higher pCO2, enhanced photosynthesis appears to have an antagonistic effect with respect to acidification due to higher uptake of CO2 by the symbionts. Finally, our results stress the need to explore in more detail the role of light on the regulation of photosymbiotic sponge bioerosion rates.
Author Contributions
Data collection: AW and DdB; Data analysis: AW; Interpretation of the data: AW, SvH, DdB, FvD, GR, and LdN; Drafting work: AW; Critical revision: FvD, SvH, GR, and LdN; Final approval: AW, SvH, DdB, FvD, GR, and LdN; Agreement to be accountable for all aspects of the work AW, SvH, DdB, FvD, GR, and LdN.
Conflict of Interest Statement
The authors declare that the research was conducted in the absence of any commercial or financial relationships that could be construed as a potential conflict of interest.
Acknowledgments
We would like to thank two reviewers for their constructive comments which improve the initial manuscript. We thank the Caribbean Netherlands Science Institute (CNSI) for hosting the experiment and especially Johan Staple for his support. We also thank Masru Spanner for the nutrient analyses and Santiago Gonzalez for the dissolved organic carbon analyses and Paul Peters for field assistance. Bob Koster is gratefully acknowledged for the design and development of the pCO2 set-up just as the NIOZ workshop whose help and work was crucial for the construction of the experimental set-up. This work is supported by the Gravitation grant NESSC from the Dutch Ministry of Education, Culture and Science. External funding for this project was provided by the Netherlands Organization for Scientific Research (NWO grants 858.14.021 and 858.14.022).
Supplementary Material
The Supplementary Material for this article can be found online at: http://journal.frontiersin.org/article/10.3389/fmars.2017.00311/full#supplementary-material
References
Borges, A. V., and Gypens, N. (2010). Carbonate chemistry in the coastal zone responds more strongly to eutrophication than ocean acidification. Limnol. Oceanogr. 55, 346–353. doi: 10.4319/lo.2010.55.1.0346
Bruno, J. F., Sweatman, H., Precht, W. F., Selig, E. R., and Schutte, V. G. (2009). Assessing evidence of phase shifts from coral to macroalgal dominance on coral reefs. Ecology 90, 1478–1484. doi: 10.1890/08-1781.1
Cai, W.-J., Hu, X., Huang, W.-J., Murrell, M. C., Lehrter, J. C., Lohrenz, S. E., et al. (2011). Acidification of subsurface coastal waters enhanced by eutrophication. Nat. Geosci. 4, 766–770. doi: 10.1038/ngeo1297
Camacho, F. G., Chileh, T., García, M., Mirón, A. S., Belarbi, E., Gómez, A. C., et al. (2006). Sustained growth of explants from Mediterranean sponge Crambe crambe cultured in vitro with enriched RPMI 1640. Biotechnol. Prog. 22, 781–790. doi: 10.1021/bp050341m
Carballo, J. L., Bautista-Guerrero, E., and Leyte-Morales, G. E. (2008). Boring sponges and the modeling of coral reefs in the east Pacific Ocean. Mar. Ecol. Prog. Ser. 356, 113–122. doi: 10.3354/meps07276
Chisholm, J. R., and Gattuso, J. P. (1991). Validation of the alkalinity anomaly technique for investigating calcification of photosynthesis in coral reef communities. Limnol. Oceanogr. 36, 1232–1239. doi: 10.4319/lo.1991.36.6.1232
Cyronak, T., Santos, I. R., Erler, D. V., Maher, D. T., and Eyre, B. D. (2014). Drivers of pCO2 variability in two contrasting coral reef lagoons: the influence of submarine groundwater discharge. Global Biogeochem. Cycles 28, 398–414. doi: 10.1002/2013GB004598
De Bakker, D. M., van Duyl, F. C., Bak, R. P. M., Nugues, M. M., Nieuwland, G., and Meesters, E. H. (2017). 40 years of benthic community change on the caribbean reefs of curaçao and bonaire: the rise of slimy cyanobacterial mats. Coral Reefs 36, 355–367. doi: 10.1007/s00338-016-1534-9
De Goeij, J. M., and Van Duyl, F. C. (2007). Coral cavities are sinks of dissolved organic carbon (DOC). Limnol. Oceanogr. 52, 2608–2617. doi: 10.4319/lo.2007.52.6.2608
Dickson, A. G., and Millero, F. J. (1987). A comparison of the equilibrium constants for the dissociation of carbonic acid in seawater media. Deep Sea Res. A Oceanogr. Res. Pap. 34, 1733–1743. doi: 10.1016/0198-0149(87)90021-5
Dickson, A. G., Sabine, C. L., and Christian, J. R. (2007). Guide to best Practices for Ocean CO2 Measurements. Sidney, BC: PICES Special Publication 3.
Dove, S. G., Kline, D. I., Pantos, O., Angly, F. E., Tyson, G. W., and Hoegh-Guldberg, O. (2013). Future reef decalcification under a business-as-usual CO2 emission scenario. Proc. Natl. Acad. Sci. U.S.A. 110, 15342–15347. doi: 10.1073/pnas.1302701110
Duckworth, A. R., and Peterson, B. J. (2013). Effects of seawater temperature and pH on the boring rates of the sponge Cliona celata in scallop shells. Mar. Biol. 160, 27–35. doi: 10.1007/s00227-012-2053-z
Edinger, E. N., Limmon, G. V., Jompa, J., Widjatmoko, W., Heikoop, J. M., and Risk, M. J. (2000). Normal coral growth rates on dying reefs: are coral growth rates good indicators of reef health? Mar. Pollut. Bull. 40, 404–425. doi: 10.1016/S0025-326X(99)00237-4
Enochs, I. C., Manzello, D. P., Carlton, R. D., Graham, D. M., Ruzicka, R., and Colella, M. A. (2015). Ocean acidification enhances the bioerosion of a common coral reef sponge: implications for the persistence of the Florida Reef Tract. Bull. Mar. Sci. 91, 271–290. doi: 10.5343/bms.2014.1045
Erwin, P. M., and Thacker, R. W. (2008). Phototrophic nutrition and symbiont diversity of two Caribbean sponge–cyanobacteria symbioses. Mar. Ecol. Prog. Ser. 362, 139–147. doi: 10.3354/meps07464
Fang, J. K. H., Mello-Athayde, M. A., Schonberg, C. H., Kline, D. I., Hoegh-Guldberg, O., and Dove, S. (2013a). Sponge biomass and bioerosion rates increase under ocean warming and acidification. Glob. Chang. Biol. 19, 3581–3591. doi: 10.1111/gcb.12334
Fang, J. K. H., Schönberg, C. H. L., Hoegh-Guldberg, O., and Dove, S. (2016). Day–night ecophysiology of the photosymbiotic bioeroding sponge Cliona orientalis Thiele, 1900. Mar. Biol. 163, 1–12. doi: 10.1007/s00227-016-2848-4
Fang, J. K. H., Schönberg, C. H. L., Kline, D. I., Hoegh-Guldberg, O., and Dove, S. (2013b). Methods to quantify components of the excavating spongeCliona orientalisThiele, 1900. Mar. Ecol. 34, 193–206. doi: 10.1111/maec.12005
Fang, J. K. H., Schonberg, C. H. L., Mello-Athayde, M. A., Hoegh-Guldberg, O., and Dove, S. (2014). Effects of ocean warming and acidification on the energy budget of an excavating sponge. Glob. Chang. Biol. 20, 1043–1054. doi: 10.1111/gcb.12369
Freeman, C. J., and Thacker, R. W. (2011). Complex interactions between marine sponges and their symbiotic microbial communities. Limnol. Oceanogr. 56, 1577–1586. doi: 10.4319/lo.2011.56.5.1577
Garcia-Pichel, F. (2006). Plausible mechanisms for the boring on carbonates by microbial phototrophs. Sediment. Geol. 185, 205–213. doi: 10.1016/j.sedgeo.2005.12.013
Garcia-Pichel, F., Ramirez-Reinat, E., and Gao, Q. (2010). Microbial excavation of solid carbonates powered by P-type ATPase mediated transcellular Ca2+ transport. Proc. Natl. Acad. Sci. U.S.A. 107, 21749–22154. doi: 10.1073/pnas.1011884108
Gast, G. J., Jonkers, P., Van Duyl, F., and Bak, R. P. M. (1999). Bacteria, flagellates and nutrients in island fringing coral reef waters: influence of the ocean, the reef and eutrophication. Bull. Mar. Sci. 65, 523–538.
Gattuso, J.-P., and Hansson, L. (2011). “Ocean acidification: background and history,” in Ocean Acidification, eds J.-P. Gattuso and L. Hansson (Oxford: Oxford University Press), 1–20.
Gattuso, J.-P., Frankignoulle, M., Bourge, I., Romaine, S., and Buddemeier, R. (1998). Effect of calcium carbonate saturation of seawater on coral calcification. Glob. Planet. Change 18, 37–46. doi: 10.1016/S0921-8181(98)00035-6
Gorgula, S. K., and Connell, S. D. (2004). Expansive covers of turf-forming algae on human-dominated coast: the relative effects of increasing nutrient and sediment loads. Mar. Biol. 145, 613–619. doi: 10.1007/s00227-004-1335-5
Govers, L. L., Lamers, L. P., Bouma, T. J., de Brouwer, J. H., and van Katwijk, M. M. (2014). Eutrophication threatens Caribbean seagrasses–an example from Curaçao and Bonaire. Mar. Pollut. Bull. 89, 481–486. doi: 10.1016/j.marpolbul.2014.09.003
Guida, B. S., and Garcia-Pichel, F. (2016). Extreme cellular adaptations and cell differentiation required by a cyanobacterium for carbonate excavation. Proc. Natl. Acad. Sci. U.S.A. 113, 5712–5717. doi: 10.1073/pnas.1524687113
Hill, M. S. (1996). Symbiotic zooxanthellae enhance boring and growth rates of the tropical sponge Anthosigmella varians forma varians. Mar. Biol. 125, 649–654. doi: 10.1007/BF00349246
Hill, M. S. (2014). Production possibility frontiers in phototroph: heterotroph symbioses: trade-offs in allocating fixed carbon pools and the challenges these alternatives present for understanding the acquisition of intracellular habitats. Front. Microbiol. 5:357. doi: 10.3389/fmicb.2014.00357
Hoegh-Guldberg, O., Mumby, P. J., Hooten, A. J., Steneck, R. S., Greenfield, P., Gomez, E., et al. (2007). Coral reefs under rapid climate change and ocean acidification. Science 318, 1737–1742. doi: 10.1126/science.1152509
Holmes, K. E. (2000). Effects of eutrophication on bioeroding sponge communities with the description of new West Indian sponges, Cliona spp. (Porifera: Hadromerida: Clionidae). Invert. Biol. 119, 125–138. doi: 10.1111/j.1744-7410.2000.tb00001.x
Hudson, J. (1977). “Long-term bioerosion rates on a Florida reef: a new method,” in Proceedings of the 3rd International Coral Reef Symposium (Miami), 491–497.
Hughes, T. P. (1994). Catastrophes, phase shifts, and large-scale degradation of a Caribbean coral reef. Science 265, 1547–1551. doi: 10.1126/science.265.5178.1547
Hydes, D., Aoyama, M., Aminot, A., Bakker, K., Becker, S., Coverly, S., et al. (2010). Determination of Dissolved Nutrients (N, P, Si) in Seawater with High Precision and Inter-Comparability Using Gas-Segmented Continuous Flow Analysers. The GOSHIP Repeat Hydrography Manual: a Collection of Expert Reports and Guidelines. IOCCP report number 14, ICPO publication series number 134, UNESCO-IOC, (Paris).
Jacques, T., and Pilson, M. (1980). Experimental ecology of the temperate scleractinian coral Astrangia danae I. Partition of respiration, photosynthesis and calcification between host and symbionts Mar. Biol. 60, 167–178. doi: 10.1007/BF00389160
Johnson, K., Wills, K., Butler, D., Johnson, W., and Wong, C. (1993). Coulometric total carbon dioxide analysis for marine studies: maximizing the performance of an automated gas extraction system and coulometric detector. Mar. Chem. 44, 167–187. doi: 10.1016/0304-4203(93)90201-X
Kleypas, J. A., and Langdon, C. (2006). “Coral reefs and changing seawater carbonate chemistry,” in Coastal and Estuarine Studies: Coral Reefs and Climate Change Science and Management, Vol. 61, eds J. T. Phinney, O. Hoegh-Guldberg, J. A. Kleypas, W. Skirving, and A. Strong (American Geophysical Union), 73–110.
Kuffner, I. B., and Paul, V. J. (2001). Effects of nitrate, phosphate and iron on the growth of macroalgae and benthic cyanobacteria from Cocos Lagoon, Guam. Mar. Ecol. Prog. Ser. 222, 63–72. doi: 10.3354/meps222063
Lapointe, B. E., and Mallin, M. (2011). Nutrient Enrichment and Eutrophication on Fringing Coral Reefs of Bonaire and Curaçao, Netherlands Antilles. Report to the United Nations Environment Programme for the NACRI Coral Reef Monitoring Program. Pierce, FL; Harbor Branch Oceanographic Institute.
Le Quéré, C., Andres, R. J., Boden, T., Conway, T., Houghton, R. A., House, J. I., et al. (2013). The global carbon budget 1959–2011. Earth Syst. Sci. Data 5, 165–185. doi: 10.5194/essd-5-165-2013
Le Quéré, C., Moriarty, R., Andrew, R. M., Canadell, J. G., Sitch, S., Korsbakken, J. I., et al. (2015). Global carbon budget 2015. Earth Syst. Sci. Data 7, 349–396. doi: 10.5194/essd-7-349-2015
MacGeachy, J. K., and Stearn, C. W. (1976). Boring by macro-organisms in the coral Montastrea annularis on Barbados Reefs. Int. Rev. Gesamten Hydrobiol. Hydrogr. 61, 715–745. doi: 10.1002/iroh.19760610602
Maldonado, M., Ribes, M., and van Duyl, F. C. (2012). 3 Nutrient fluxes through sponges: biology, budgets, and ecological implications. Adv. Mar. Biol. 62:113. doi: 10.1016/B978-0-12-394283-8.00003-5
McElhany, P. (2016). CO2 sensitivity experiments are not sufficient to show an effect of ocean acidification. ICES J. Mar. Sci. 74, 926–928. doi: 10.1093/icesjms/fsw085
Mintrop, L., Pérez, F. F., González-Dávila, M., Santana-Casiano, J. M., and Körtzinger, A. (2000). Alkalinity determination by potentiometry: intercalibration using three different methods. Cienc. Mar. 26, 23–37. doi: 10.7773/cm.v26i1.573
Mueller, B., de Goeij, J. M., Vermeij, M. J., Mulders, Y., van der Ent, E., Ribes, M., et al. (2014). Natural diet of coral-excavating sponges consists mainly of dissolved organic carbon (DOC). PLoS ONE 9:e90152. doi: 10.1371/journal.pone.0090152
Nasonov (1924). Sur l'eponge Perforantes Clione Stationis Nason.et le Procede du Creusement des Galeries dans les Valves des Huitres. Moscow: C R. Academy Science Russia, 113–115.
Nava, H., and Carballo, J. L. (2008). Chemical and mechanical bioerosion of boring sponges from Mexican Pacific coral reefs. J. Exp. Biol. 211(Pt. 17), 2827–2831. doi: 10.1242/jeb.019216
Pandolfi, J. M., Connolly, S. R., Marshall, D. J., and Cohen, A. L. (2011). Projecting coral reef futures under global warming and ocean acidification. Science 333, 418–422. doi: 10.1126/science.1204794
Perry, C. T., Murphy, G. N., Kench, P. S., Edinger, E. N., Smithers, S. G., Steneck, R. S., et al. (2014). Changing dynamics of Caribbean reef carbonate budgets: emergence of reef bioeroders as critical controls on present and future reef growth potential. Proc. R. Soc. B 281, 2014–2018. doi: 10.1098/rspb.2014.2018
Pomponi, S. A. (1980). Cytological mechanisms of calcium carbonate excavation by boring sponges. Int. Rev. Cytol. 65, 301–319. doi: 10.1016/S0074-7696(08)61963-4
Ries, J. B., Cohen, A. L., and McCorkle, D. C. (2009). Marine calcifiers exhibit mixed responses to CO2-induced ocean acidification. Geology 37, 1131–1134. doi: 10.1130/G30210A.1
Rützler, K., and Rieger, G. (1973). Sponge burrowing: fine structure of Cliona lampa penetrating calcareous substrata. Mar. Biol. 21, 144–162. doi: 10.1007/BF00354611
Schönberg, C. H. L. (2000). “Sponges of the ‘Cliona viridis complex’–a key for Species Identification,” in Proceedings of 9th International Coral Reef Symposium (Bali), 295–299.
Schönberg, C. H. L. (2002). Substrate effects on the bioeroding demosponge Cliona orientalis. 1. Bioerosion rates. Mar. Ecol. 23, 313–326. doi: 10.1046/j.1439-0485.2002.02811.x
Schönberg, C. H. L. (2006). “Growth and erosion of the zooxanthellate Australian bioeroding sponge Cliona orientalis are enhanced in light,” in Proceedings of the 10th International Coral Reef Symposium (Napoli), 168–174.
Schönberg, C. H. L. (2008). “A history of sponge erosion: from past myths and hypotheses to recent approaches,” in Current Developments In Bioerosion, eds M. Wisshak, and L. Tapanila (Berlin; Heidelberg: Springer), 165–202.
Schönberg, C. H. L., Fang, J. K. H., Carreiro-Silva, M., Tribollet, A., and Wisshak, M. (2017). Bioerosion: the other ocean acidification problem. ICES J. Marine Sci. 74, 895–925. doi: 10.1093/icesjms/fsw254
Smith, S. V., and Key, G. S. (1975). Carbon dioxide and metabolism in marine environments. Limnol. Oceanogr. 20, 493–495. doi: 10.4319/lo.1975.20.3.0493
Solomon, S. (2007). Climate change 2007-the Physical Science Basis: Working group I Contribution to the Fourth Assessment Report of the IPCC. Cambridge, UK: Cambridge University Press.
Sommerville, L., and Hartshorne, D. (1986). Intracellular calcium and smooth muscle contraction. Cell Calcium 7, 353–364. doi: 10.1016/0143-4160(86)90038-2
Van Duyl, F. C., and Gast, G. J. (2001). Linkage of small-scale spatial variations in DOC, inorganic nutrients and bacterioplankton growth with different coral reef water types. Aquat. Microbiol. Ecol. 24, 17–26. doi: 10.3354/ame024017
Vermeij, M. J., Van Moorselaar, I., Engelhard, S., Hörnlein, C., Vonk, S. M., and Visser, P. M. (2010). The effects of nutrient enrichment and herbivore abundance on the ability of turf algae to overgrow coral in the Caribbean. PLoS ONE 5:e14312. doi: 10.1371/journal.pone.0014312
Veron, J. E. N. (2011). Ocean Acidification and Coral Reefs: an emerging big picture. Diversity 3, 262–274. doi: 10.3390/d3020262
Weisz, J. B., Massaro, A. J., Ramsby, B. D., and Hill, M. S. (2010). Zooxanthellar symbionts shape host sponge trophic status through translocation of carbon. Biol. Bull. 219, 189–197. doi: 10.1086/BBLv219n3p189
Wisshak, M., and Tapanila, L. (2008). Current Developments in Bioerosion. Berlin: Springer Science & Business Media.
Wisshak, M., Schönberg, C. H. L., Form, A. U., and Freiwald, A. (2014). Sponge bioerosion accelerated by ocean acidification across species and latitudes? Helgol. Mar. Res. 68:253. doi: 10.1007/s10152-014-0385-4
Wisshak, M., Schönberg, C. H. L., Form, A. U., and Freiwald, A. (2013). Effects of ocean acidification and global warming on reef bioerosion—lessons from a clionaid sponge. Aquat. Biol. 19, 111–127. doi: 10.3354/ab00527
Wisshak, M., Schönberg, C. H. L., Form, A. U., and Freiwald, A. (2012). Ocean acidification accelerates reef bioerosion. PLoS ONE 7:e45124. doi: 10.1371/journal.pone.0045124
Yeakel, K. L., Andersson, A. J., Bates, N. R., Noyes, T. J., Collins, A., and Garley, R. (2015). Shifts in coral reef biogeochemistry and resulting acidification linked to offshore productivity. Proc. Natl. Acad. Sci. 112, 14512–14517. doi: 10.1073/pnas.1507021112
Keywords: sponge bioerosion, ocean acidification, eutrophication, coral reef, diurnal rhythm, sponge symbionts
Citation: Webb AE, van Heuven SMAC, de Bakker DM, van Duyl FC, Reichart G-J and de Nooijer LJ (2017) Combined Effects of Experimental Acidification and Eutrophication on Reef Sponge Bioerosion Rates. Front. Mar. Sci. 4:311. doi: 10.3389/fmars.2017.00311
Received: 06 June 2017; Accepted: 12 September 2017;
Published: 26 September 2017.
Edited by:
Hajime Kayanne, The University of Tokyo, JapanReviewed by:
Max Wisshak, Senckenberg Nature Research Society, GermanySusana Enríquez, National Autonomous University of Mexico, Mexico
Copyright © 2017 Webb, van Heuven, de Bakker, van Duyl, Reichart and de Nooijer. This is an open-access article distributed under the terms of the Creative Commons Attribution License (CC BY). The use, distribution or reproduction in other forums is permitted, provided the original author(s) or licensor are credited and that the original publication in this journal is cited, in accordance with accepted academic practice. No use, distribution or reproduction is permitted which does not comply with these terms.
*Correspondence: Alice E. Webb, YWxpY2Uud2ViYkBuaW96Lm5s
 Alice E. Webb
 Steven M. A. C. van Heuven1
 Didier M. de Bakker
 Fleur C. van Duyl