 Alexander Matul
 Rahul Mohan
- 1Federal Agency for Scientific Organizations, P.P. Shirshov Institute of Oceanology, Moscow, Russia
- 2Earth System Science Organization, Ministry of Earth Sciences, National Centre for Antarctic and Ocean Research, Vasco-da-Gama, India
An objective of the study is to get new biogeographic information on the modern polycystine radiolarians from the high-latitude North Atlantic. The quantitative radiolarian dataset was compiled from publications and own micropaleontological counts from samples of the bottom surface sediments of the North Atlantic north of 40°N and Nordic Seas. Standard statistical treatment of micropaleontological data by factor analysis reveals five radiolarian assemblages which have their highest load at the specific temperature range in agreement with the oceanographic setting. An occurrence of radiolarian assemblages reflects extension and interaction of the warm North Atlantic and cold Polar/Arctic waters. Radiolarian distribution exhibits good correlation with the climatically averaged summer sea temperature on depth level of 200 m.
Introduction
Siliceous microorganisms, including radiolarians as marine plankton protozoa which range in size of hundreds to tenths of millimeter, are important agent of the organic carbon cycling in the World Ocean (Lampitt et al., 2009). Spatial occurrence of living radiolarians reflects primarily a temperature of the surface to subsurface water (Haq and Boersma, 1998) but combination of other environmental parameters such as salinity, availability of nutrients, seasonal productivity regime, etc., may also influence (but with debatable degree of correlation) a radiolarian habitat (Bjørklund et al., 1998). Area of study—the northern part of the Atlantic Ocean and the Nordic (Greenland-Iceland-Norwegian) Seas—has a complicated oceanographic regional pattern (Talley et al., 2011). The massive meridional transport of the warm water by the North Atlantic Current northward in the colder areas leads to the active interaction of water masses of different origin: the warm North Atlantic with cold Polar/Arctic ones in the Nordic Seas, and with cold Labrador and East Greenland ones in the Subpolar Gyre within the southern Labrador Sea and northwestern North Atlantic. Multiple hydrological frontal borders of irregular configuration together with a strong seasonal oceanographic variability promote an appearance of the wide spectrum of habitats for the marine microorganisms (Beaugrand et al., 2001). In this study, we compile our own and the published available data on the quantitative concentrations of the polycystine (having solid opaline skeletons) radiolarians in the bottom surface samples of sediments from the high-latitude North Atlantic and Nordic Seas. Working statistical procedure in our study is factor analysis. Previous micropaleontological works on the North Atlantic biogeography proved an applicability of the radiolarian study for the reliable definition of major biogeographic provinces and their environmental interpretation using both a description of species assemblages (Nigrini, 1967; Petrushevskaya, 1969; Matul, 1990) and statistical methods (Bjørklund et al., 1998; Cortese et al., 2003; Boltovskoy and Correa, 2016). Our objective is to improve knowledge on the modern radiolarian biogeography in the high-latitude North Atlantic, and to create a statistical base for the following reconstructions of the marine paleoenvironments as paleoenvironmental studies are crucial for understanding of trends and possible environmental cycling in the evolution of the World Ocean natural systems.
Materials and Methods
Graphs and maps are created using freewares PAST 3 (Hammer et al., 2001), PanMap (Grobe et al., 2003), PanPlot (Sieger and Grobe, 2013), and Ocean Data View (Schlitzer, 2016).
Radiolarian Dataset
The availability of silicates in the North Atlantic within depths of 0–3,000 m is much lower compared to that in the diatom/radiolarian-rich North Pacific, 17.4 and 111.6 μM, respectively (Conkright et al., 1994). Micropaleontological studies of the North Atlantic sediments mostly use data on the calcareous coccoliths and foraminifera. However, previous works demonstrated that both total abundances and preservation of the siliceous radiolarians in the bottom sediments of the North Atlantic and Nordic Seas are sufficient for the reliable quantitative micropaleontological analysis (e.g., Goll and Bjørklund, 1971; Molina-Cruz and de Bernal-Ramirez, 1996; Bjørklund and Kruglikova, 2003). The map of total radiolarian abundances (Figure 1) is compiled from data of Goll and Bjørklund (1971)−87 stations, Matul (1989)−42 stations, Schröder-Ritzrau (1995)−3 stations, and Bjørklund et al. (1998)−46 stations. The highest total radiolarian numbers of >50,000–90,000 tests per 1 g of dry bulk sediment were found in the southern Nordic Seas with a maximum on the Iceland Plateau under the mixed cold Polar/Arctic and warm North Atlantic waters. In the open North Atlantic, “spots” of total abundances >30,000 tests per 1 g of dry bulk sediment are located in the central high-latitude areas. Probably, they underlay diverged waters at the offset of branches from the North Atlantic Current to the east and to the northwest between latitudes of 50 and 60°N. Higher bioproductivity in these areas, belonging to the Subpolar Gyre and at the northernmost edge of the Subtropical Gyre, could be explained by a transfer of nutrients from thermocline to the euphotic zone due to the vertical winter mixing, Ekman drift, and geostrophic eddies (Williams and Follows, 1998).
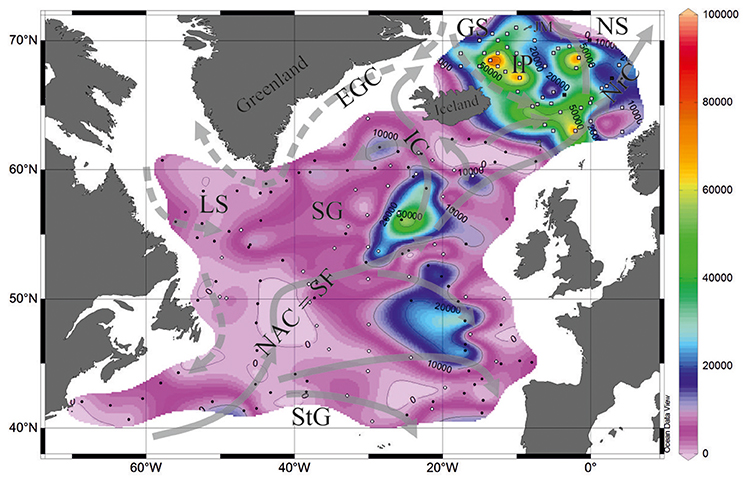
Figure 1. Total radiolarian abundances in the bottom surface sediments (tests per 1 g of bulk sediment). Black circles, data from Goll and Bjørklund (1971). White circles, data from Matul (1991). Black squares, data from Schröder-Ritzrau (1995). White squares, data from Bjørklund et al. (1998). Currents on the sea surface (Gorshkov et al., 1977): gray solid lines show warm currents, gray dashed lines show cold currents. EGC, East Greenland Current; GS, Greenland Sea; IC, Irminger Current; IP, Iceland Plateau; JM, Jan Mayen; LS, Labrador Sea; NAC, SF; North Atlantic Current, Subpolar Front; NrC, Norwegian Current; NS, Norwegian Sea; SG, Subpolar Gyre; StG, Subtropical Gyre.
In our study, we used the polycystine radiolarian counts in the sediment fraction >45 μm (Bjørklund et al., 1998) and >50 μm (Matul, 1989). The number of counted radiolarian tests were at least 300 (rarely 250) specimens per slide. Radiolarian microfauna from the modern sediments of the high-latitude North Atlantic and Nordic Seas comprises ~100 species (Matul, 1989; Bjørklund et al., 1998; Cortese et al., 2003). A choice of species list for the statistical treatment has followed criteria in Imbrie and Kipp (1971): every taxon must have a content of ≥2% in at least one sample, and be presented in at least 10 samples. Our list of species includes 36 polycystine radiolarian taxa (Figure 2). Basically, a compilation of radiolarian counts from the different published sources was not problematic because radiolarian fauna of the North Atlantic and Nordic Seas is well studied for the adequate practical species definition. But there is still a taxonomic question about Actinomma boreale/A. leptodermum group. It can be separated on several species which may reflect fine distinctions of the cold-water Polar/Arctic environments (Kruglikova et al., 2009). Taxonomy of other species also might be discussed. And we have to accept that the taxonomic issues can lower an accuracy of the statistical treatment of the micropaleontological data.
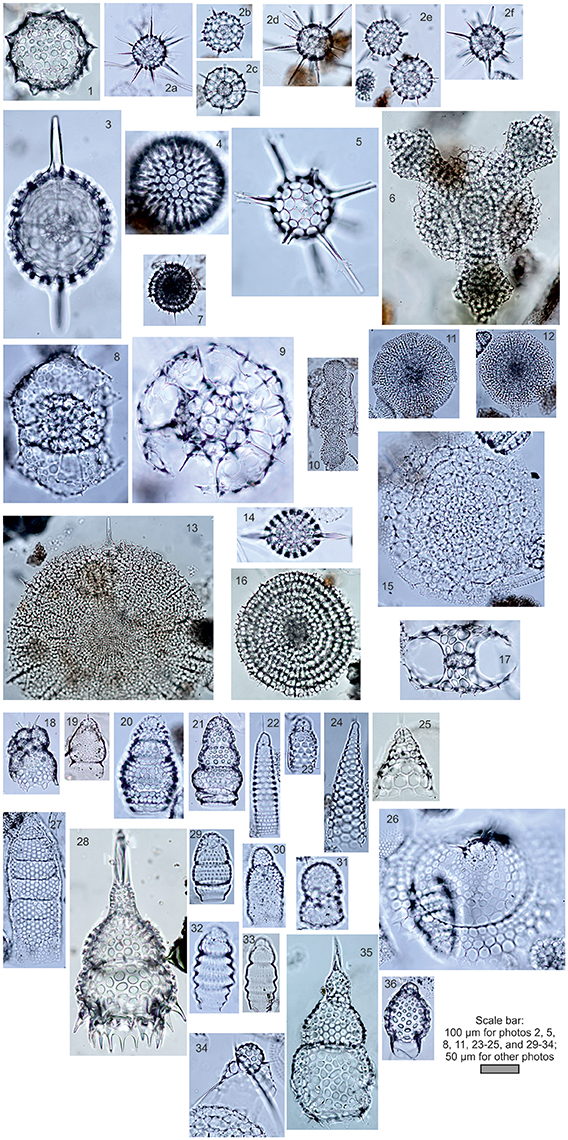
Figure 2. Photos of radiolarians from the bottom surface sediments of the North Atlantic (number of photo, radiolarian name, station): Spumellaria, (1) Acrosphaera spinosa Haeckel, L-107; (2a-f) Actinomma boreale Cleve/A. leptodermum (Jørgensen) group, (2a) L-418, (2b-d) L-180, (2e-f) L-237; (3) Axoprunum stauraxonium Haeckel, L-90; (4) Cenosphaera favosa Haeckel, L-73; (5) Cleveiplegma boreale (Cleve), L-73; (6) Hymeniastrum euclidis Haeckel, L-107; (7) Lithelius spiralis Haeckel, L-237; (8) Phorticium clevei (Jørgensen), L-237; (9) Rhizosphaera medianum (Nigrini), L-73; (10) Spongocore puella Haeckel, L-73; (11) Spongodiscus resurgens Ehrenberg, L-73; (12) Spongopyle osculosa Dreyer, L-73; (13) Spongotrochus glacialis Popofsky, L-73; (14) Stylatractus pyriformis (Bailey), L-73; (15) Stylochlamidium venustum (Bailey), L-73; 16) Stylodictya validispina (Jørgensen), L-237; (17) Tetrapyle quadriloba Haeckel, L-107; Nassellaria, (18) Amphimelissa setosa (Cleve), L-418; (19) Artobotrys borealis (Cleve), L-73; (20) Artostrobium tumidulum (Bailey), L-73; (21) Artostrobium eupora (Ehrenberg), L-418; (22) Artostrobus annulatus (Bailey), L-73; (23) Artostrobus joergenseni Petrushevskaya, L-73; (24) Cornutella profunda Ehrenberg, L-73; (25) Cycladophora davisiana Ehrenberg, L-73; (26) Eucecryphalus craspedota (Jørgensen), L-73; (27) Eucyrtidium acuminatum (Ehrenberg), L-73; (28) Lamprocyclas maritalis Haeckel, L-90; (29) Lithocampe platycephala (Ehrenberg), L-73; (30) Lithomelissa setosa Jørgensen, L-180; (31) Lithomelissa thoracites Haeckel, L-73; (32) Lithomitra arachnea Riedel, L-73; (33) Lithomitra lineata Ehrenberg, L-73; (34) Pseudodictyophimus gracilipes (Bailey), L-180; (35) Theocorythium trachelium dianae (Haeckel), L-73; (36) Tricolocapsa papillosa (Ehrenberg) mediterranea Haeckel, L-107. Letter “L” means Soviet RV Mikhail Lomonosov. Coordinates of stations: L-73, 53°40.2′N, 53°28.3′W; L-107, 42°31.3′N, 32°49.6′W; L-180, 59°04.5′N, 23°03.5′W; L-237, 55°36.6′N, 32°42.9′W; L-418, 43°34.6′N, 48°17.2′W. Practical species identification was made according Petrushevskaya (1967, 1971), Kruglikova (1977), Nigrini and Moore (1979), and http://radiolaria.org/list.htm?s=a.
Ninety one stations were selected for subsequent statistical analysis from the available tables with radiolarian counts (Matul, 1991; Schröder-Ritzrau, 1995; Bjørklund et al., 1998). Data file is provided in Supplementary Material. Samples with low abundances and/or suspected poor preservation of radiolarian tests were excluded. As the next step of our study (Matul, in preparation) is using of statistical results on modern radiolarian distribution for the Late Quaternary paleoceanography of the North Atlantic, area of study was limited from the south by the latitude of ~40°N. The Quaternary glacial to interglacial movements of the Subpolar Front in the North Atlantic occurred north of 40°N (Sarnthein et al., 2001). Also the tropical/equatorial radiolarians only sporadically cross this latitude, and we excluded samples from the warm-water middle- to low-latitude areas.
Temperature Dataset
As discussed by Bjørklund et al. (1998), the sea surface temperature is the main criteria for ecological studies of radiolarians while other environmental parameters like nutrients and salinity can also influence distribution of the marine microorganisms to a large degree. Colebrook (1982) and Parsons et al. (1984) studied seasonal cycles of the phyto- and zooplankton in the North Atlantic, and demonstrated that the largest development of marine zooplankton communities falls within the maximum water temperature during May-September. Lampitt et al. (2009) reported the highest radiolarian standing stocks during July-September in the sediment traps from the northeastern North Atlantic. Zas'ko (2001) analyzed the radiolarian plankton from the North Atlantic and Norwegian Sea for July-October 1991-1998, and found scarce radiolarians on depths of 0–50 m, but stable moderate (in average of 10–50 tests per m3 of water) abundances on depths of 50–100, and 100–200 m. Therefore, we decided to use the summer sea temperature on depths of 0, 100, and 200 m for statistical treatment. Temperature on depth of 0 m is commonly applied in the (paleo)ecological interpretation and (paleo)climatic modeling (Brandefelt and Otto-Bliesner, 2009). But temperature on depths of 100 and 200 m, probably, can be the environmental parameter of the preferred radiolarian habitat in the North Atlantic like in other oceanic areas (Steineck and Casey, 1990; Boltovskoy, 2017).
Temperature dataset for depths of 0, 100, and 200 m is extracted from the World Ocean Atlas 2013 (Locarnini et al., 2013). Values of temperature are averaged for squares of 1 degree in latitude and longitude. Sediment samples from the radiolarian dataset were obtained during expeditions mainly from the 1950's, 1960's, and 1970's. Every sample approximates climatic information for several decades. The standard time interval with averaged temperature records from the World Ocean Atlas 2013, closest to the time of sampling, is 1955-1964. More recent intervals cannot be used because of occurrence of large climatic shifts in the North Atlantic, e.g., the warming event in the Subpolar Gyre during 1990's, when the sea surface temperature increased on 1.2–1.5°C (Marzocchi et al., 2015) and the North Atlantic Oscillation index changed from the positive to negative values (Flatau et al., 2003). Bjørklund et al. (1998) and Cortese et al. (2003) also used old temperature data from the hydrological atlas of Dietrich (1969) arguing that G. Dietrich's records exhibit better oceanographic picture on the surface of the Nordic Seas compared to other sources of hydrological information. Figure 3 presents temperature maps for depths of 0, 100, and 200 m from the World Ocean Atlas 2013. Isotherms and directions of water currents on depths of 100 and 200 m display the distribution of the cold Polar and Arctic waters from the Greenland Sea to the southern Norwegian Sea, and from the Labrador Sea to the northwestern North Atlantic much clearer than on depth of 0 m.
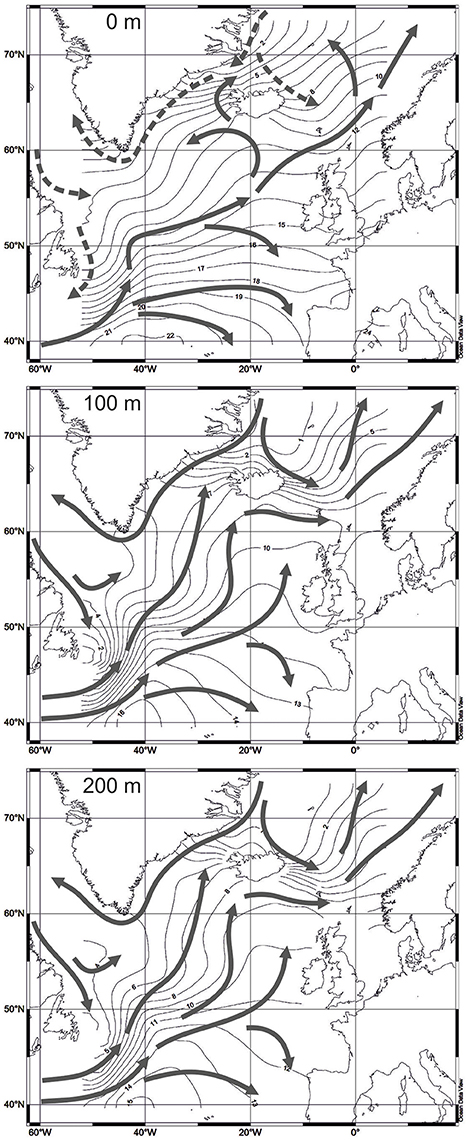
Figure 3. Water temperature, averaged for 1955-1964 (Locarnini et al., 2013). Water circulation on different depths according to Gorshkov et al. (1977): solid arrows for 0 m—warm currents, dashed arrows for 0 m—cold currents, solid arrows for 100 and 200 m—directions of water circulation.
Statistical Method
Different statistical methods are applied for the micropaleontological studies to identify the microfossil assemblages in the modern marine sediments, and to define their relationship with the environmental parameters. Regarding radiolarians, one of the best examples of such studies is work of Rogers and De Deckker (2007) who combined cluster and correspondence analysis to describe the biogeography and ecology of radiolarian microfauna in the southern Indian Ocean between the Polar, Subantarctic, and Subtropical Fronts. Both methods exhibited very good matching of the biogeographic and oceanographic boundaries in the area. Matul and Yushina (1999) found five radiolarian cluster assemblages in the pelagic North Atlantic from the equatorial to subpolar areas. Cortese et al. (2003) applied cluster analysis to the radiolarian dataset north of 60°N in the northwestern North Atlantic and in the Nordic Seas; four clusters of stations reflected main oceanographic provinces. According to cluster analysis by Boltovskoy and Correa (2016), major biogeographic domains in the North Atlantic are Tropical-Subtropical, Transitional, Bi-Subpolar, and Northern Polar.
In this study, we used factor analysis which is adapted for the micropaleontology in the software package PaleoTool Box (Sieger and Grobe, 2012). The Imbrie and Kipp (1971) Method of Q-mode factor analysis and transfer functions is now one of the standard statistical techniques for the quantitative estimation of the (paleo)environmental parameters from the micropaleontological data archived in the bottom oceanic sediments (MARGO Project Members, 2009).
Results and Discussion
Imbrie and Kipp (1971) Method is based on the assumption that the marine microflora and microfauna, which are preserved in the bottom sediments, reflect the living habitat conditions in the water such as temperature, salinity, availability of nutrients, etc. As argued by Zielinski et al. (1998), Imbrie and Kipp Method works better compared to other statistical methods like Modern Analog Technique in case of the regional micropaleontological datasets. An improved version of Imbrie and Kipp Method is available in the software package PaleoTool Box (Sieger and Grobe, 2012). Zielinski et al. (1998) presented a comprehensive description of PaleoTool Box and its application in biogeographic and paleoceanographic studies based on diatom data from the Southern Ocean sediments.
PaleoTool can manipulate the standard number up to 10 factors. In our radiolarian dataset, cumulative variance of the first five factors describes 94.875% of total information while cumulative variance of the first three factors is 88.981% (Figure 4). Factors 4 and 5 give additional/refining information.
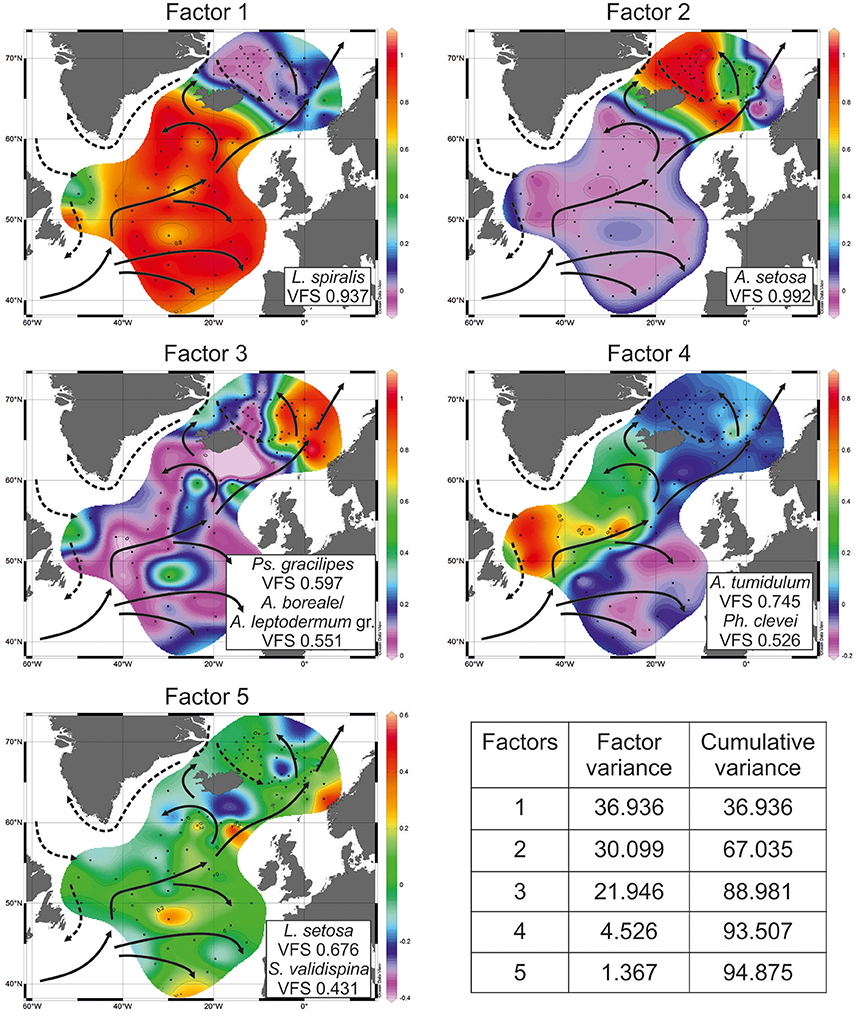
Figure 4. Distribution of factor loadings. VFS, varimax factor score. Sea surface (0 m) circulation according to Gorshkov et al. (1977): solid arrows—warm currents, dashed arrows—cold currents.
Factor 1 with loadings of >0.8 corresponds to the open North Atlantic without the Labrador Sea (Figure 4). This is area of the temperate waters of the North Atlantic Current and its branches eastward to the Europe and northwestward (Irminger Current). Leading radiolarian species of Factor 1 is L. spiralis with varimax factor score of 0.937. Its abundances of >20% (Figure 5) fit clearly Factor 1 loadings of >0.7. L. spiralis is the most typical representative of the boreal Atlantic radiolarian fauna having the highest percentages of >50% in modern sediments south of the Iceland at the annual sea surface temperature about 9°C (Matul, 1990). No any other species have substantial varimax factor scores except for S. validispina−0.254, S. osculosa−0.123, and S. resurgens−0.118.
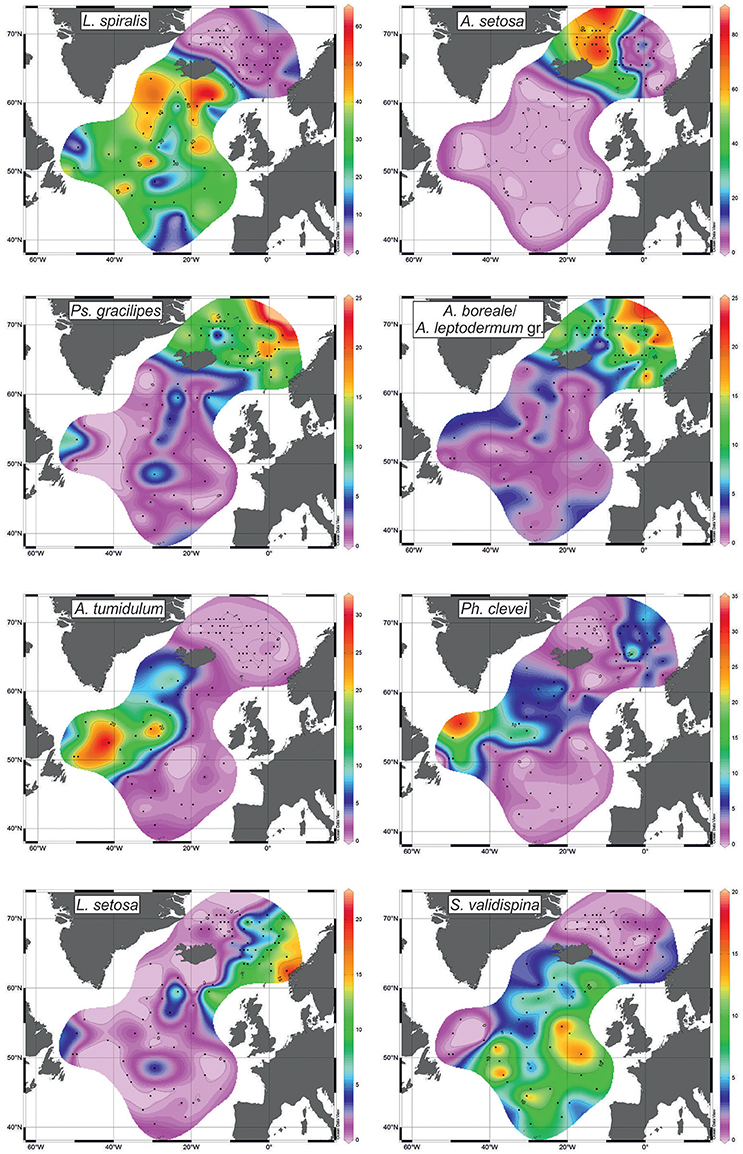
Figure 5. Distribution of radiolarians (%) with the highest scores (see Figure 4).
Factor 2 with loadings of >0.8 corresponds to the area of the Polar and Arctic waters in the southern Greenland Sea and on the Iceland Plateau (Figure 4). Like in case of Factor 1, only one species A. setosa with varimax factor score of 0.992 dominates Factor 2, and other radiolarians have no distinct varimax factor scores. According to Itaki et al. (2003), Bjørklund et al. (2015), Ikenoue et al. (2015) A. setosa is the Arctic surface to subsurface water dweller. Its highest abundances of >60% (Figure 5) are found in the modern sediments on the Iceland Plateau in the area of mixing cold Polar/Arctic and warm North Atlantic waters.
Factor 3 with loadings of >0.5 corresponds to the Norwegian Sea reflecting the North Atlantic water of the Norwegian Current, and the contact of Polar/Arctic and North Atlantic waters between the Greenland and Norwegian Seas (Figure 4). Two radiolarian taxa have the highest varimax factor scores: Ps. gracilipes−0.597, and A. boreale/A. leptodermum group−0.551. Both are distributed in the same areas of the Nordic Seas, and exhibit an increase of their concentrations from 10 to >15% toward the northern Norwegian Sea (Figure 5). Bjørklund et al. (1998) proposed that Ps. gracilipes reflects the North Atlantic water, and its interaction with the cold waters southeast of Jan Mayen. In the Nordic Seas, A. boreale/A. leptodermum group could be good indicator of the Arctic surface water east of Jan Mayen (Bjørklund et al., 1998).
Factor 4 with loadings of >0.5 corresponds to the Subpolar Gyre in the southern Labrador Sea and (partly) northwestern North Atlantic west of the North Atlantic Current (Figure 4). Mixing of the cold Labrador and warm North Atlantic waters may define the distribution of Factor 4. Radiolarians with the highest varimax factor scores are A. tumidulum and Ph. clevei, 0.745 and 0.526, respectively. Earlier (Matul, 1990), these have been assigned as the Subarctic species. The highest abundances of A. tumidulum and Ph. clevei are concentrated in the Subpolar Gyre of the North Atlantic (Figure 5) but only the latter is found also in the Nordic Seas with high percentages east of the Arctic Front (Bjørklund et al., 1998). We may suspect the deep-water habitat of A. tumidulum, therefore, it is not able to overcome ridges between the Greenland and Iceland (sill depth of 620 m), and between the Iceland and Faroe Islands (sill depth of 480 m) (Talley et al., 2011). There are not yet direct records on the vertical distribution of A. tumidulum in the water column. However, Tanaka and Takahashi (2008) found its related form Botryostrobus aquilonaris in sediment trap samples of the North Pacific with highest numbers below depth of 500 m.
Factor 5 with loadings of >0.2 corresponds to the northeastern North Atlantic and southeastern Norwegian Sea reflecting relatively warm waters of the northern part of the North Atlantic Current which enter in the Norwegian Sea (Figure 4). Main radiolarians of Factor 5 are L. setosa with varimax factor score of 0.676, and S. validispina with varimax factor score of 0.431. Area of preferable distribution of L. setosa is the warm-water southern Norwegian Sea (Bjørklund et al., 1998), also the Iceland Basin (Figure 5). In its turn, S. validispina is not numerous in the Norwegian Sea but common under the North Atlantic Current and in the eastern North Atlantic (Matul, 1989).
Figure 6 presents distribution of loadings for every factor (= radiolarian assemblage) against modern temperatures on stations from our dataset for depths of 0, 100, and 200 m. Polynomial regressions illustrate a relation between factor loadings and temperature. The highest loadings of Factors 1 and 2 exhibit fully opposite allocation along the temperature axis. The sharp boundary between the “warm” North Atlantic Factor 1 and “cold” Greenland Sea Factor 2 is at 9–12°C on 0 m depth, 7–8°C on 100 m depth, and 5–7°C on 200 m depth. Such temperature ranges mark the southern limit of the Polar/Arctic waters in the Norwegian Sea, and their contact with the North Atlantic waters in the surface to subsurface horizons. The Norwegian Sea Factor 3 has the stretched section of its highest loadings around the temperature boundary of Factors 1 and 2: within 7–13°C on 0 m depth, 2.5–10°C on 100 m depth, and 2–9.5°C on 200 m depth. Probably, temperature linking of Factor 3 loadings could be explained by intra-annual migrations of the Polar/Arctic and North Atlantic waters in the Nordic Seas together with specific temperature preferences of radiolarians dominated Factor 3. Peak of the highest loadings of the southern Labrador Sea Factor 4 can be clearly distinguished along the temperature axis. It is adjacent to the boundary of Factors 1 and 2 from the “warmer” part of the temperature axis: within 11–15°C on 0 m depth, 7–10°C on 100 m depth, and 6–9°C on 200 m depth. Our radiolarian dataset does not represent the coldest parts of the Subpolar Gyre. An addition of new samples from the central to northern Labrador Sea might extend the highest loadings of Factor 4 toward the lower temperatures. Distribution of loadings of the eastern North Atlantic Factor 5 is also connected with temperature boundary of Factors 1 and 2. Loadings of Factor 5 start to increase at temperature higher than 10–12°C on 0 m depth, 7–8°C on 100 m depth, and 6°C on 200 m depth, but they slightly drop to the “warmest” end of the temperature axis. It seems to be that the temperature boundary of Factors 1 and 2, which together provide two-thirds of cumulative variance of radiolarian information, outlines an interface between two primary radiolarian assemblages, the boreal North Atlantic one as “warm” end-member, and the arctic/subarctic Greenland-Iceland-Norwegian one as “cold” end-member.
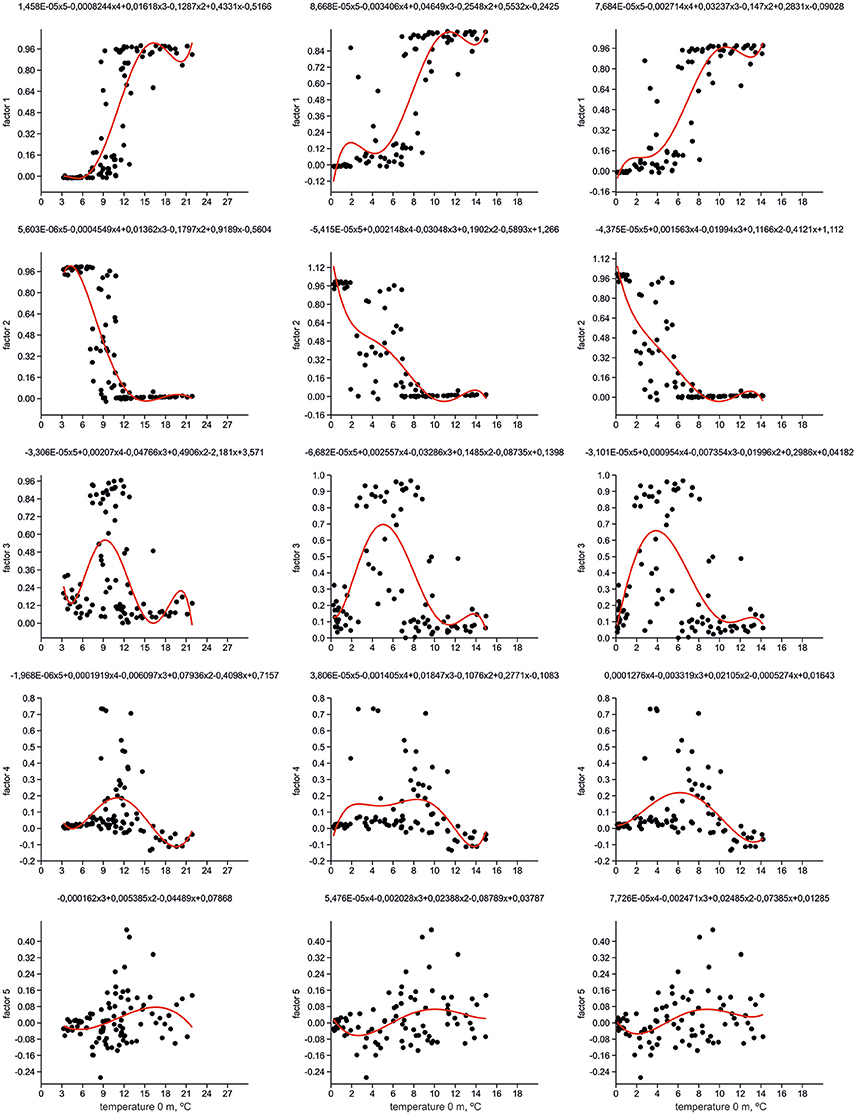
Figure 6. Distribution of factor loadings against temperature. Polynomial equations and functions (red line) are shown.
We calculated the Pearson coefficients of linear correlation between factor loadings and temperature values on different water depths (Table 1). Distribution of Factors 1 and 2 has very good correlation with temperature, positive one for Factor 1 with Pearson coefficient of 0.77–0.85, and negative one for Factor 2 with Pearson coefficient of −0.75 to −0.81. Correlation coefficients of both factors increase their absolute values from 0 to 200 m depth. Pearson coefficients for Factors 3–5 have low values because there is no unidirectional change of factor loadings against the temperature. Our finding of better correlation of radiolarian distribution in the North Atlantic with the subsurface but not surface temperature is in good agreement with previous works of Bjørklund et al. (1998), Cortese et al. (2003), Cortese et al. (2005) on the Nordic Seas. However, the Nordic Seas studies demonstrated higher correlation coefficients for depth of 100 m, whereas our study can exhibit better correlation for depth of 200 m. Radiolarian habitat in the Nordic Seas should reflect, in a high degree, an extent of the Polar/Arctic surface waters which occupy in average the upper 150 m of water column (Johannessen, 1986).
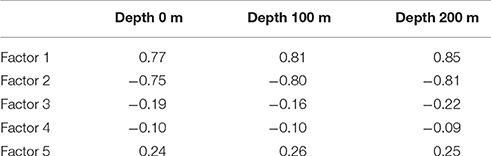
Table 1. Pearson coefficients of linear correlation of factor loadings and summer sea temperature.
Use of factor analysis allows getting back temperature estimates from the radiolarian micropaleontological data, and then we can compare them with measured oceanographic values. Temperature residuals (estimated minus measured temperature) for every station (Figure 7) vary between −4 and 4°C. Standard error is ±1.45°C for depth of 0 m, ±1.17°C for depth of 100 m, ±1.04°C for depth of 200 m, which is comparable with estimate of ±1.2°C by Cortese et al. (2003) for the sea surface summer temperature in the Nordic Seas. Error of the estimated temperatures obviously decreases from the sea surface to the deeper layers. This may support better correlation of radiolarian distribution with environments on the subsurface depths in the North Atlantic.
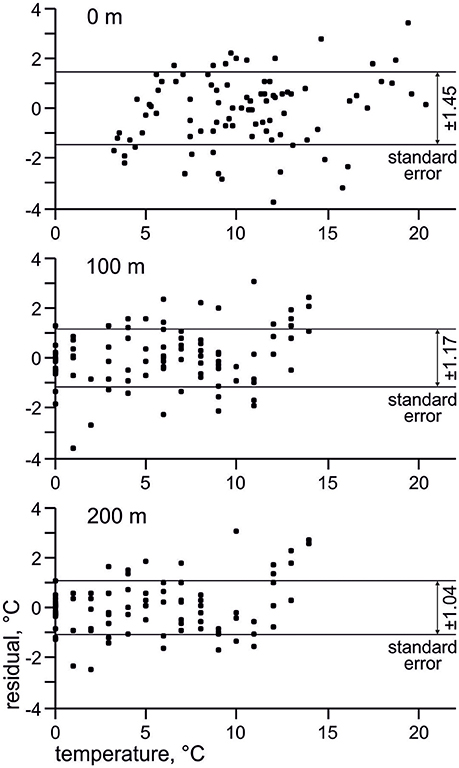
Figure 7. Residuals (estimated minus measured temperature) and standard errors of estimated temperature. Horizontal axis present measured temperature from the World Ocean Atlas 2013 (Locarnini et al., 2013).
Conclusions
The standard cluster, correspondence, and factor analysis of the micropaleontological data on polycystine radiolarians in the bottom surface sediments produce consistent information about the complicated biogeographic zonation of the North Atlantic and Nordic Seas in agreement with oceanographic setting. Distribution and interaction of water masses of different origin—from the cold Polar to warm North Atlantic—is reflected in the occurrence of three radiolarian assemblages in the North Atlantic north of 40°N, and two assemblages in the Nordic Seas. There are clear temperature limits between assemblages. The best correlation of radiolarian distribution and summer sea temperature is found for the depth level of 200 m.
Author Contributions
AM led the work and wrote most part of text. RM participated in interpretation of results and writing the manuscript.
Funding
Funded primarily by Joint Project No. 16-47-02009 of the Russian Science Foundation and Department of Science and Technology of the Ministry of Science and Technology of India. The funds for the same were extended by National Centre for Antarctic and Ocean Research, Goa, Ministry of Earth Sciences.
Conflict of Interest Statement
The authors declare that the research was conducted in the absence of any commercial or financial relationships that could be construed as a potential conflict of interest.
Acknowledgments
The authors express deep appreciation to reviewers, Demetrio Boltovskoy and Takahito Ikenoue, who provided very usefull comments and suggestions which helped to improve a quality of article. The authors are grateful for support from the Russian Government, the Russian Science Foundation and the Administration of P. P. Shirshov Institute of Oceanology. RM would like to thank the Director, NCAOR for extending support to this project. This is NCAOR Contribution No. 34/2017.
Supplementary Material
The Supplementary Material for this article can be found online at: https://www.frontiersin.org/articles/10.3389/fmars.2017.00330/full#supplementary-material
References
Beaugrand, G., Ibañez, F., and Lindley, J. A. (2001). Geographical distribution and seasonal and diel changes in the diversity of calanoid copepods in the North Atlantic and North Sea. Mar. Ecol. Prog. Ser. 219, 189–203. doi: 10.3354/meps219189
Bjørklund, K. R., Cortese, G., Swanberg, N. R., and Schrader, H. J. (1998). Radiolarian faunal provinces in surface sediments of the Greenland, Iceland and Norwegian (GIN) Seas. Mar. Micropaleontol. 35, 105–140. doi: 10.1016/S0377-8398(98)00013-9
Bjørklund, K. R., Hatakeda, K., Kruglikova, S. B., and Matul, A. G. (2015). Amphimelissa setosa (Cleve) (Polycystina, Nassellaria) – a stratigraphic and paleoecological marker of migrating polar environments in the northern hemisphere during the quaternary. Stratigraphy 12, 23–37.
Bjørklund, K. R., and Kruglikova, S. B. (2003). Polycystine radiolarians in surface sediments in the Arctic Ocean basins and marginal seas. Mar. Micropaleontol. 49, 231–273. doi: 10.1016/S0377-8398(03)00036-7
Boltovskoy, D. (2017). Vertical distribution patterns of Radiolaria Polycystina (Protista) in the World Ocean: living ranges, isothermal submersion and settling shells. J. Plankton Res. 39, 330–349. doi: 10.1093/plankt/fbx003
Boltovskoy, D., and Correa, N. (2016). Biogeography of radiolaria polycystina (Protista) in the World Ocean. Prog. Oceanogr. 149, 82–105. doi: 10.1016/j.pocean.2016.09.006
Brandefelt, J., and Otto-Bliesner, B. L. (2009). Equilibration and variability in a Last Glacial. Maximum climate simulation with CCSM3. Geophys. Res. Lett. 36, L19712. doi: 10.1029/2009GL040364
Colebrook, J. M. (1982). Continuous plankton records: seasonal variations in the distribution and abundance of plankton in the North Atlantic Ocean and the North Sea. J. Plankton Res. 4, 435–462. doi: 10.1093/plankt/4.3.435
Conkright, M. E., Levitus, S., and Boyer, T. P. (1994). World Ocean Atlas 1994, Vol. 1, Nutrients. Washington, DC: NOAA, U.S. Department of Commerce.
Cortese, G., Bjørklund, K. R., and Dolven, J. K. (2003). Polycystine radiolarians in the Greenland–Iceland-Norwegian Seas: species and assemblage distribution. Sarsia 88, 65–88. doi: 10.1080/00364820308466
Cortese, G., Dolven, J. K., Bjørklund, K. R., and Malmgren, B. A. (2005). Late Pleistocene–Holocene radiolarian paleotemperatures in the Norwegian Sea based on artificial neural networks. Palaeogeogr. Palaeoclimatol. Palaeoecol. 224, 311–332. doi: 10.1016/j.palaeo.2005.04.015
Dietrich, G. (1969). Atlas of the Hydrography of the Northern North Atlantic Ocean. Copenhagen: International Council for the Exploration of the Sea (ICES).
Flatau, M. K., Talley, L., and Niiler, P. P. (2003). The North Atlantic oscillation, surface current velocities, and SST changes in the subpolar North Atlantic. J. Clim. 16, 2355–2369. doi: 10.1175/2787.1
Goll, R. M., and Bjørklund, K. R. (1971). Radiolaria in surface sediments of the North Atlantic Ocean. Micropaleontology 17, 434–454. doi: 10.2307/1484872
Gorshkov, S. G., Alekseev, V. N., and Rassokho, A. I. (1977). Atlas of Oceans. Atlantic and Indian Oceans. Leningrad: GUNIO Press. (in Russian).
Grobe, H., Diepenbroek, M., and Siems, U. (2003). PanMap - A Mini-GIS (Geographical Information System) to Draw Point and Vector Data in Maps Including Geographical Resources. Bremerhaven: Alfred Wegener Institute, Helmholtz Center for Polar and Marine Research.
Hammer, Ø., Harper, D. A. T., and Ryan, P. D. (2001). PAST: paleontological statistics software package for education and data analysis. Palaeontol. Electron. 4:1.
Haq, B. U., and Boersma, A. (eds.). (1998). Introduction to Marine Micropaleontology. Singapore: Elsevier Science PTE Ltd.
Ikenoue, T., Bjørklund, K. R., Kruglikova, S. B., Onodera, J., Kimoto, K., and Harada, N. (2015). Flux variations and vertical distributions of siliceous Rhizaria (Radiolaria and Phaeodaria) in the western Arctic Ocean: indices of environmental changes. Biogeosciences 12, 2019–2046. doi: 10.5194/bg-12-2019-2015
Imbrie, J., and Kipp, N. G. (1971). “A new micropaleontological method for paleoclimatology: application to a late pleistocene caribbean core,” in The Late Cenozoic Glacial Ages, ed K. K. Turekian (New Haven, CT: Yale University Press), 71–181.
Itaki, T., Ito, M., Narita, H., Ahagon, N., and Sakai, H. (2003). Depth distribution of radiolarians from the Chukchi and Beaufort Seas, western Arctic. Deep Sea Res. Part I Oceanogr. Res. Papers 50, 1507–1522. doi: 10.1016/j.dsr.2003.09.003
Johannessen, O. M. (1986). “Brief overview of the physical oceanography,” in The Nordic Seas, ed G. Hurdle (Berlin: Springer), 103–124.
Kruglikova, S. B. (1977). “Radiolaria,” in Atlas of Microorganisms in Bottom Sediments of the Oceans: Diatoms, Radiolaria, Silicoflagellates and Coccoliths, ed A. P. Jouse (Moscow: Nauka Press), 7, 13–17 (plates 86–145).
Kruglikova, S. B., Bjørklund, K. R., Hammer, Ø., and Anderson, O. R. (2009). Endemism and speciation in the polycystine radiolarian genus Actinomma in the Arctic Ocean: description of two new species Actinomma georgii n. sp. and A. turidae n. sp. Mar. Micropaleontol. 72, 26–48. doi: 10.1016/j.marmicro.2009.02.004
Lampitt, R. S., Salter, I., and Johns, D. (2009). Radiolaria: major exporters of organic carbon to the deep ocean. Glob. Biogeochem. Cycles 23, GB1010. doi: 10.1029/2008GB003221
Locarnini, R. A., Mishonov, A. V., Antonov, J. I., Boyer, T. P., Garcia, H. E., Baranova, O. K., et al. (2013). World Ocean Atlas 2013, Vol. 1, Temperature. NOAA Atlas NESDIS 73. Washington, DC: NOAA, U.S. Department of Commerce.
MARGO Project Members (2009). Constraints on the magnitude and patterns of ocean cooling at the Last Glacial Maximum. Nat. Geosci. 2, 127–132. doi: 10.1038/ngeo411
Marzocchi, A., Hirschi, J. J.-M., Holliday, N. P., Cunningham, S. A., Blaker, A. T., and Coward, A. C. (2015). The North Atlantic subpolar circulation in an eddy-resolving global ocean model. J. Mar. Sys. 142, 126–143. doi: 10.1016/j.jmarsys.2014.10.007
Matul, A. G. (1989). The distribution of radiolarians in the surface layer of North Atlantic bottom sediments. Oceanology 29, 740–745.
Matul, A. G. (1990). Radiolaria thanatocoenoses in the surface layer of the North Atlantic sediments as a reflection of natural environmental conditions. Oceanology 30, 76–79.
Matul, A. G. (1991). Paleoecology of Radiolarians and the Quaternary Paleoceanography of the North Atlantic. Ph.D. thesis, Moscow, P.P. Shirshov Institute of Oceanology.
Matul, A. G., and Yushina, I. G. (1999). Radiolarians in North Atlantic sediments. Ber. Polarforschung 306, 35–45.
Molina-Cruz, A., and de Bernal-Ramirez, R. G. (1996). Distribution of Radiolaria in surface sediments and its relation to the oceanography of the Iceland and Greenland Seas. Sarsia 81, 315–328. doi: 10.1080/00364827.1996.10413629
Nigrini, C. A. (1967). Radiolaria in pelagic sediments from the Indian and Atlantic Oceans. Bull. Scripps Inst. Oceanogr. 11, 1–125.
Nigrini, C. A., and Moore, T. C. (1979). A guide to Modern Radiolaria. Washington, DC: Cushman Foundation for Foraminiferal Research Special Publication 16.
Parsons, T. R., Takahashi, M., and Hargrave, B. (1984). Biological Oceanographic Processes, 3rd Edn. Oxford: Pergamon Press.
Petrushevskaya, M. G. (1967). Radiolaria of orders Spumellaria and Nassellaria of the Antarctic area. Stud. Mar. Fauna 4, 5–185.
Petrushevskaya, M. G. (1969). “Distribution of skeletons of radiolarians in the North Atlantic sediments,” in Fossil and Modern Radiolarians: Proceedings of the Second Soviet Union Seminar on Radiolarians, ed O. S. Vyalov (Lvov: Lvov University Press), 123–132.
Petrushevskaya, M. G. (1971). Radiolaria Nassellaria in the Plankton of the World Ocean. Leningrad: Nauka Press.
Rogers, J., and De Deckker, P. (2007). Radiolaria as a reflection of environmental conditions in the eastern and southern sectors of the Indian Ocean: a new statistical approach. Mar. Micropaleontol. 65, 137–162. doi: 10.1016/j.marmicro.2007.07.001
Sarnthein, M., Statteger, K., Dreger, D., Erlenkeuser, H., Grootes, P., Haupt, B. J., et al. (2001). “Fundamental modes and abrupt changes in North Atlantic circulation and climate over the last 60 ky – concepts, reconstruction and numerical modeling,” in The Northern North Atlantic: A Changing Environment, eds P. Schäfer, W. Ritzrau, M. Schlüter, and J. Thiede (Berlin: Springer), 365–410.
Schlitzer, R. (2016). Ocean Data View. Available online at: http://odv.awi.de
Schröder-Ritzrau, A. (1995). Aktuopaläontologische Untersuchung zu Verbreitung und Vertikalfluss von Radiolarien sowie ihre räumliche und zeitliche Entwicklung im Europäischen Nordmeer. Ber. Sonderforschungsbereich 313, 1–99.
Sieger, R., and Grobe, H. (2012). PanTool – A Swiss Army Knife for Data Conversion and Recalculation. Bremerhaven: Alfred Wegener Institute, Helmholtz Center for Polar and Marine Research.
Sieger, R., and Grobe, H. (2013). PanPlot 2 - Software to Visualize Profiles and Time Series. Bremerhaven: Alfred Wegener Institute, Helmholtz Center for Polar and Marine Research.
Steineck, P. L., and Casey, R. E. (1990). “Ecology and paleobiology of foraminifera and radiolaria,” in Ecology of Marine Protozoa, ed G. M. Capriulo (Oxford: Oxford University Press), 89–138.
Talley, L., Pickard, G. L., Emery, W. J., and Swift, J. H. (2011). Descriptive Physical Oceanography, 6th Edn. An Introduction. Amsterdam: Elsevier Academic Press.
Tanaka, S., and Takahashi, K. (2008). Detailed vertical distribution of radiolarian assemblage (0-3000 m, fifteen layers) in the central subarctic Pacific, June 2006. Mem. Fac. Sci. Kyushu Univ. Ser D Earth Planet. Sci. XXXII, 49–72.
Williams, R. G., and Follows, M. J. (1998). The Ekman transfer of nutrients and maintenance of new production over the North Atlantic. Deep Sea Res. I 45, 461–489. doi: 10.1016/S0967-0637(97)00094-0
Zas'ko, D. N. (2001). Quantitative distribution of radiolarians in the North Atlantic plankton. Oceanology 41, 86–93.
Keywords: biogeographic provinces, high-latitude North Atlantic, polycystine radiolarians, marine environments, summer sea temperature
Citation: Matul A and Mohan R (2017) Distribution of Polycystine Radiolarians in Bottom Surface Sediments and Its Relation to Summer Sea Temperature in the High-Latitude North Atlantic. Front. Mar. Sci. 4:330. doi: 10.3389/fmars.2017.00330
Received: 19 June 2017; Accepted: 05 October 2017;
Published: 17 October 2017.
Edited by:
Katrin Linse, British Antarctic Survey (BAS), United KingdomReviewed by:
Demetrio Boltovskoy, Consejo Nacional de Investigaciones Científicas y Técnicas (CONICET), ArgentinaTakahito Ikenoue, Marine Ecology Research Institute (MERI), Japan
Copyright © 2017 Matul and Mohan. This is an open-access article distributed under the terms of the Creative Commons Attribution License (CC BY). The use, distribution or reproduction in other forums is permitted, provided the original author(s) or licensor are credited and that the original publication in this journal is cited, in accordance with accepted academic practice. No use, distribution or reproduction is permitted which does not comply with these terms.
*Correspondence: Alexander Matul, YW1hdHVsQG1haWwucnU=