 Alex Robinson
 Heather A. Bouman
 Gavin H. Tilstone
 Shubha Sathyendranath
- 1Department of Earth Sciences, University of Oxford, Oxford, United Kingdom
- 2Plymouth Marine Laboratory, Plymouth, United Kingdom
Over the past decade, a number of methods have been developed to estimate size-class primary production from either in situ phytoplankton pigment data or remotely-sensed data. In this context, the first objective of this study was to compare two methods of estimating size class specific (micro-, nano-, and pico-phytoplankton) photosynthesis-irradiance (PE) parameters from pigment data. The second objective was to analyse the relationship between environmental variables (temperature, nitrate and PAR) and PE parameters in the different size-classes. A large dataset was used of simultaneous measurements of the PE parameters (n = 1,260) and phytoplankton pigment markers (n = 2,326), from 3 different institutes. There were no significant differences in mean PE parameters of the different size classes between the chemotaxonomic method of Uitz et al. (2008) and the pigment markers and carbon-to-Chl a ratios method of Sathyendranath et al. (2009). For both methods, mean maximum photosynthetic rates () for micro-phytoplankton were significantly lower than those for pico-phytoplankton and nano-phytoplankton. The mean light limited slope (αB) for nano-phytoplankton were significantly higher than for the other size taxa. For micro-phytoplankton dominated samples identified using the Sathyendranath et al. (2009) method, both and αB exhibited a significant, positive linear relationship with temperature, whereas for pico-phytoplankton the correlation with temperature was negative. Nano-phytoplankton dominated samples showed a positive correlation between and temperature, whereas for αB and the light saturation parameter (Ek) the correlations were not significant. For the Uitz et al. (2008) method, only micro-phytoplankton , pico-phytoplankton αB, nano- and pico-phytoplankton Ek exhibited significant relationships with temperature. The temperature ranges occupied by the size classes derived using these methods differed. The Uitz et al. (2008) method exhibited a wider temperature range compared to those derived from the Sathyendranath et al. (2009) method. The differences arise from the classification of mixed populations. Based on these patterns, we therefore recommend using the Sathyendranath et al. (2009) method to derive micro-phytoplankton PE parameters at sea water temperatures up to 8°C during monospecific blooms and the Uitz et al. (2008) method to derive PE parameters of mixed populations over the temperature range from 8 to 18°C. Both methods exhibited similar relationships between pico-phytoplankton PE parameters and temperatures >18°C.
Introduction
Increased interest in predicting future effects of climate change on marine ecosystems has led to a concerted effort to understand how large-scale patterns in ocean productivity vary in response to changing environmental properties, especially to sea-surface temperature, which is routinely monitored from satellite. A range of models have been developed to estimate primary production from space (Platt and Sathyendranath, 1988; Platt et al., 1995; Antoine et al., 1996; Behrenfeld and Falkowski, 1997; Behrenfeld et al., 2005; Smyth et al., 2005; Uitz et al., 2008, 2012; Westberry et al., 2008) and several inter-comparisons of primary production algorithms have been conducted (Carr et al., 2006; Friedrichs et al., 2009; Tilstone et al., 2009; Saba et al., 2010). One principal conclusion from these studies was that a better understanding of the temperature regulation and parameterisation of photosynthesis is required to improve the accuracy of remotely-sensed models of marine primary production (Carr et al., 2006).
Relationship between Phytoplankton Photosynthesis and Temperature
To estimate primary productivity at basin or global scales, it is necessary to understand how the PE parameters; the light limited slope (αB), the maximum photosynthetic rate (), and the light saturation parameter (Ek) or associated parameters such as the optimum photosynthetic rate () vary as a function of environmental variables that can be measured from remote sensing (Behrenfeld and Falkowski, 1997; Bouman et al., 2005; Platt et al., 2005). For the Scotian Shelf, Bouman et al. (2003) found that 65% of the variation in could be described by temperature alone. The correlation between temperature and PE parameters is also likely to indicate relationships with other variables such as nitrate (Bouman et al., 2005; Marañon et al., 2012; Saux-Picart et al., 2014). It has already been documented that below 20°C, increasing temperature results in an increase in (Raven and Geider, 1988). At temperatures above 20°C, commonly associated with stratified oligotrophic conditions and high surface irradiance, the maximum rate of carbon fixation is often reduced, which may be explained in part by an increased investment of resources in photo-protection, repair of photo-damage (Raven, 2011), and to endure nutrient limitation (Behrenfeld and Falkowski, 1997).
Phytoplankton Cell Size and Photosynthesis
All aspects of the life of phytoplankton are influenced by its size (Chisholm, 1992), which affects it's growth, metabolism and access to resources, and in turn shapes it's ecological niche (Lichtman and Klausmeier, 2008). Total Chl a tends to increase with increasing cell size (Chisholm, 1992). In turn cell size is also an important source of variability in PE parameters. Historic evidence has shown that there are physiological differences between large and small phytoplankton cells in terms of Michaelis-Menten constants and sinking rates, which have implications for photosynthetic efficiency and carbon export from the pelagic zone (Paasche, 1967, 1968; Eppley et al., 1969; Smayda, 1970). Allometric theory states that metabolic rates scale with body size following Kleiber's law whereby the metabolic rate is a ¾ function of body size (Peters, 1983; Brown et al., 2000), which applies to photosynthesis (Niklas and Enquist, 2001). A number of studies questioned the allometric ¾ rule, since it does not account for the size dependence of light absorption and the size scaling of photosynthesis (Enquist et al., 1998; Finkel and Irwin, 2000; Niklas and Enquist, 2001). Eppley and Sloan (1965) similarly showed a dependency of respiration rate on cell size. The rate of respiration scales roughly as the −0.25 power of cell biomass (Laws, 1975; Banse, 1976), though significant deviations have been observed even within specific phytoplankton species (Raven, 1986). Similarly Chisholm (1992) found that this relationship is weak and that ecological differences between taxonomic groups mask the influence of size on growth. Recent studies showed that a single, universal scaling rule cannot predict the metabolism–size relationship in all photosynthetic organisms, since changes in taxonomic composition along the size spectrum have a significant effect on photosynthesis (Marañon et al., 2007).
The absorption cross-section also decreases with cell size because self-shading increases as cell size increases (Geider et al., 1986). Acclimation of phytoplankton to temperature and light conditions are important parameters in shaping the size structure of the phytoplankton community (MacIntyre et al., 2002; Thomas et al., 2012). Morel and Bricaud (1981) found that carbon-specific photosynthetic rates decrease with cell size in both light saturated and light limited cells. Photo-acclimation involves compensatory changes in the photosynthetic apparatus including cell volume, pigment composition and concentration, and the number and density of thylakoid membranes (Falkowski, 1980), which occurs over a cell generation of a few days (Falkowski and LaRoche, 1991). Typically there is a decrease in cellular photosynthetic pigment content across all taxa (MacIntyre et al., 2002), which is related to the amount of accessory pigment within the photosynthetic antenna or the amount of chlorophyll per reaction centre. Models of photo-acclimation indicate that changes in cellular pigment content balance the energy captured by light absorption with the energy demand for growth (Geider et al., 1998), which can be related to size (Roy et al., 2011).
Phytoplankton Cell Size, Turbulence, and Nutrient Assimilation
Cell size has important implications for resource acquisition, such as nutrient uptake (Sournia, 1982) and light harvesting (Duysens, 1956; Morel and Bricaud, 1981). Large phytoplankton, especially diatoms, can fix carbon and assimilate nutrients rapidly (Pahlow et al., 1997), which are then removed from the photic zone as they sink to depth (Riegman et al., 1993). They tend to thrive in regions rich in nitrate. Smaller cells (pico-phytoplankton) fix less carbon (Chisholm, 1992) and sink slowly, resulting in potential remineralisation via the microbial loop (Legendre and Rassoulzadegan, 1995). They tend to inhabit nutrient poor, oligotrophic regions (Munk and Riley, 1974; Malone, 1977). Water column characteristics and pelagic food web structure are tightly coupled and mediated by the effect of turbulence, which in turn can affect phytoplankton cell size (Kiørboe, 1993). Micro-phytoplankton dominates in eutrophic, turbulent and partially mixed waters, which enhances nutrient uptake and sedimentation. Small phytoplankton is generally more abundant in vertically stratified oligotrophic waters (Margalef, 1978). Turbulence also influences the light environment either by increasing the light intensity variability or by decreasing the average light intensity, which micro-phytoplankton, particularly diatoms, are potentially well adapted to (Kiørboe, 1993; Lavaud et al., 2007).
Phytoplankton Cell Size, Growth, and Grazing
The dominance of larger phytoplankton in nutrient-rich areas is also attributed to the stronger grazing pressure suffered by smaller cells (Kiørboe, 1993; Irigoen et al., 2005). This may be related to the size scaling exponent of carbon fixation, whereby the larger micro-phytoplankton (>20 μm) grows faster than medium size nano-phytoplankton (2–20 μm) and the smaller pico-phytoplankton (0.2–2 μm) under high-resource conditions (Niklas and Enquist, 2001). The relationship between cell size, phytoplankton abundance and carbon fixation suggests that the ecosystem size abundance distribution is the result of size-scaling metabolic rates, which when normalised to cell abundance, remains constant over the range in size (Huete-Ortega et al., 2012).
There seems to be an almost constant predator-prey size ratio in plankton food chains such that small predators graze small phytoplankton and large predators graze large phytoplankton (Berggreen et al., 1988). Some studies have suggested however, that predation pressure and growth rates decrease with size (Platt, 1985). Thus, despite the lower relative growth rate, nutrient uptake and light harvesting capabilities of large compared to small phytoplankton, their risk of being eaten is much lower (Kiørboe, 1993).
Phytoplankton Size from Space
Recently, there have been an increasing number of studies that have retrieved the size structure of phytoplankton from remote-sensing (Brewin et al., 2014). There is also an impetus to develop new algorithms that divide total marine primary production into different phytoplankton size classes (e.g., Brewin et al., 2017). Thorough validation and characterisation of some of these remote sensing models has been performed, and have an error of 0.27–0.63, depending on the size-class retrieved (Brewin et al., 2017). Our understanding of how the photo-physiological parameters vary within size-classes or taxa over basin scales remains poor and is still limited by the availability of in situ observations. Coincident in situ measurements of PE parameters, phytoplankton taxonomic and/or functional groups are required for this and for accurate parameterisation of size-class models of primary production (Uitz et al., 2008). There are few direct measurements of size-fractionated PE parameters (e.g., Tilstone et al., 2017), but more coincident PE parameters and HPLC pigment data (e.g., Uitz et al., 2008). Since different phytoplankton taxa contain different diagnostic pigments, information on pigment composition can be used to estimate the taxonomic composition of a sample (Everitt et al., 1990; Letelier et al., 1993; Bidigare and Ondrusek, 1996; Mackey et al., 1996; Vidussi et al., 2001; Uitz et al., 2006, 2008; Van den Meersche et al., 2008; Sathyendranath et al., 2009). Two methods have been developed methods to derive PE parameters of different size classes from pigment markers. These are either based on empirical approaches between size class marker pigments, the associated photo-physiological parameters and its dependence on irradiance in the water column (Uitz et al., 2008), or on least-squares regression between particulate carbon and Chl a for different phytoplankton groups identified using pigment markers (Sathyendranath et al., 2009). These methods have not yet been compared to evaluate any potential differences between them.
The objectives of this paper are therefore to: (1) Compare two different pigment-based methods at estimating size class specific PE parameters, and then (2) Analyse the relationship between environmental variables and photosynthetic rates in different size-classes using these methods. The resulting relationships are discussed in the context of choosing appropriate models to estimate phytoplankton size-class primary production using remotely-sensed data.
Methods
Study Area and Samples
Phytoplankton pigment and PE data were collected from 47 cruises in the Atlantic Ocean led by three principal institutes: the Bedford Institute of Oceanography (BIO) (Bouman et al., 2005; Sathyendranath et al., 2009), the Laboratoire d'Océanographie de Villefranche-sur-Mer (LOV) (Babin et al., 1994) and the Plymouth Marine Laboratory (PML) (Tilstone et al., 2003). Data from BIO were collected from 1997 to 2001 along the Scotian Shelf and from the NW sub-tropical Atlantic in March 1999; data from LOV were from the tropical NE Atlantic in June 1992 and data from PML were from AMT6 in May-June 1998 and the Irish Sea in May, June and July 2001. There were no significant differences in nano-phytoplankton biomass between laboratories [t(2, 11) = 2.65, p = 0.022]. There was also no significant difference in pico-phytoplankton biomass between BIO and PML [t(2, 6) = 4.13, p = 0.065]. There was, however a significant difference in micro-phytoplankton between BIO and PML [t(1, 63) = 4.06, p = 0.0001]. None of the LOV samples were dominated by micro- or pico-phytoplankton so a direct comparison with this laboratory was not possible.
Water samples were collected from 3 to 8 depths in the upper 200 m of the water column (Figure 1). Surface irradiance values were estimated using MODIS-Aqua monthly climatology of photosynthetically-active radiation (PAR) (NASA Ocean Colour Level 3 products; http://oceancolor.gsfc.nasa.gov). Mixed-layer depth (zm) was calculated using climatological data from the World Ocean Atlas (Levitus et al., 2009). Temperature, salinity and potential density data were estimated using the algorithms given in Jackett et al. (2006) since profiles of Conductivity Temperature Depth (CTD) were not available at all stations. To estimate the euphotic depth (ze), which we operationally define as the depth at which the light intensity is 1% of surface irradiance, vertical attenuation coefficients of 0.016 m2 (mg Chl a)−1 (Schanz et al., 1997) for Chl a and 0.043 m−1 for seawater were used (Platt et al., 2003). The mean mixed-layer PAR was also calculated using estimates of light attenuation coefficients from Chl a concentrations, zm and surface PAR following the methods of Platt et al. (1988) and Babin et al. (1996).
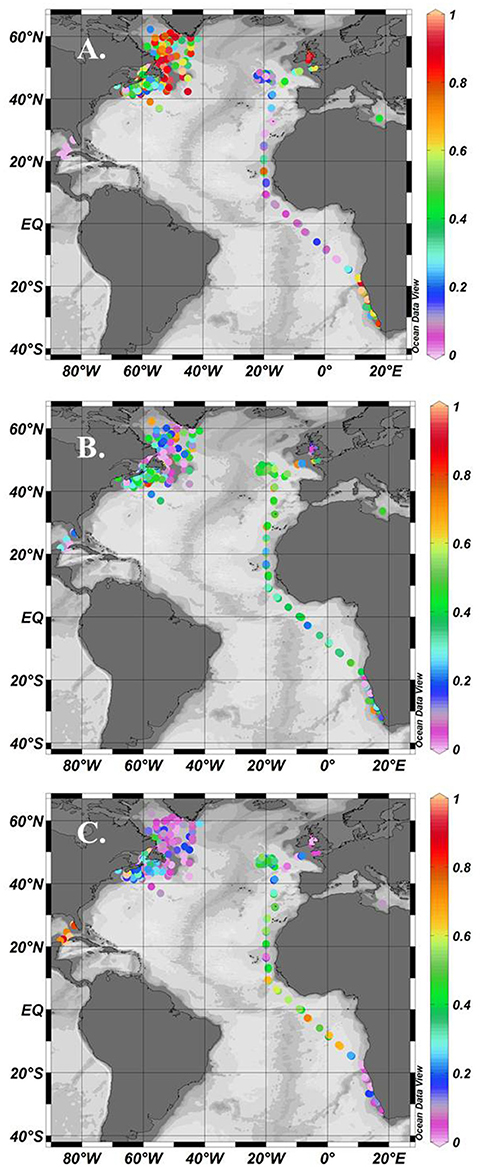
Figure 1. Location of stations where simultaneous measurements of phytoplankton pigments and photosynthesis-irradiance curves were made showing stations dominated by micro- (A), nano- (B), and pico-phytoplankton (C) using the method of Uitz et al. (2008). Colour scale is the relative fraction of each size class normalised to 1.
For the analysis of nutrients, seawater samples were collected directly from the CTD rosette, stored frozen until analysis and then equilibrated to room temperature prior to analysis. BIO measured nitrate, phosphate and silicate using an autoanalyser (Technicon II or Alphkem RFA300) following the methods of Strain and Clement (1996). LOV measured nitrate, nitrite and phosphate using a Technicon Autoanalyzer using the methods of (Wood et al., 1967) and Murphy and Ryley (1962). For PML, dissolved inorganic nutrient concentrations were determined by gas segmented flow colorimetric analysis using a Bran and Luebbe AutoAnalyser (model AA3). Dissolved nitrate and nitrite were determined by the spectrophotometric methods described by Brewer and Riley (1965). The analysis of soluble reactive phosphorus (SRP) concentration was based on the method described by Zhang and Chi (2002). Dissolved silicate (DSi) was determined using standard colorimetric methods (Kirkwood, 1989).
Phytoplankton Pigments
Chl a was measured using a Turner Designs fluorometer before and after acidification. BIO used the method of Holm-Hansen et al. (1965) (N = 1,873), LOV used the method of Yentsch and Menzel (1963) adapted by Holm-Hansen and Riemann (1978) (N = 162), and PML used the non-acidification method of Welschmeyer (1994) (N = 227).
Total Chl a (monovinyl + divinyl Chl a) and accessory pigments were measured on a subset of samples (N = 2,361) using high performance liquid chromatography (HPLC) following the procedure described by Head and Horne (1993) for BIO, Claustre and Marty (1995) for LOV and Barlow et al. (1997) for PML. Water samples were filtered onto GF/F filters before being flash frozen in liquid nitrogen and stored at −80°C until analysis. Pigment standards from Sigma Chemical Company, were used for the identification of Chl a, Chl b, and β-carotene. Chl c, 19′-butanoyloxyfucoxanthin, fucoxanthin, 19′-hexanoyloxyfucoxanthin and diadinoxanthin were identified using standards from Dr R. Bidigare (Claustre and Marty, 1995; Stuart et al., 2000) for BIO and LOV, and from DHI Denmark (Gibb et al., 2000) for PML. Further details of the HPLC methods used by each laboratory are given in Table 1.
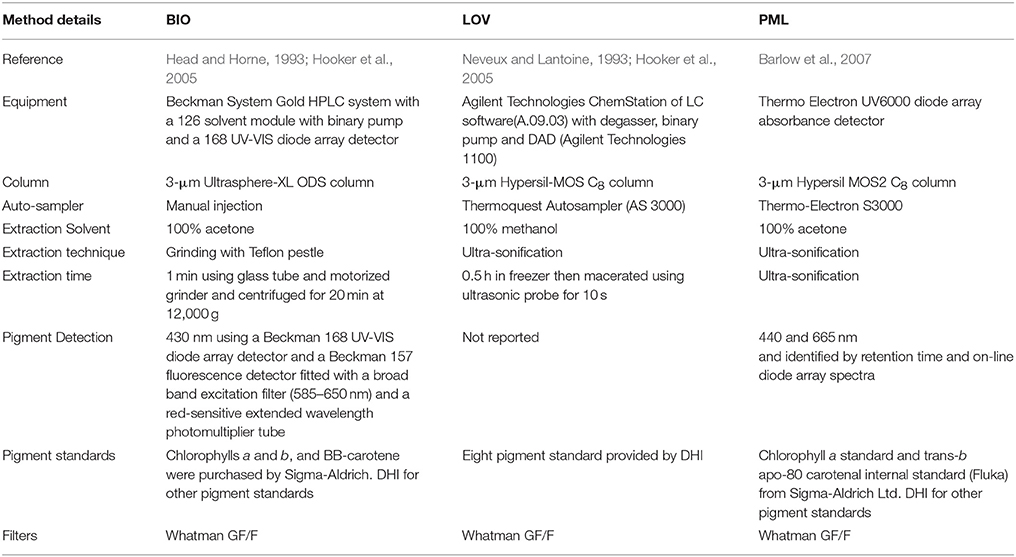
Table 1. Summary of HPLC methods.
Photosynthesis-Irradiance (PE) Parameters
The protocols used for the determination of PE parameters are described in Platt et al. (1982) for the BIO data, Babin et al. (1994) for the LOV data, Tilstone et al. (2003) for the PML data. In brief, seawater samples were collected from 3 to 8 depths based on the vertical structure in the in vivo fluorescence profile. During the 14C incubations the temperature of the photosynthetron was closely matched with ambient in situ temperature. For surface samples, the ships surface underway seawater supply was used to maintain the incubations at sea surface temperature. For deeper samples, each photosynthetron was connected to a temperature control unit which was used to maintain the incubations at ambient temperature.
All labs added 185 to 370 kBq (5 to 10 μCi) of 14C-labelled bicarbonate to the PE bottles. Ambient PAR was monitored over a 2–3 hr period prior to collecting the water samples for 14C incorporation and the photosynthetron irradiance was matched to the average PAR over this period. Platt et al. (1982) irradiated the samples using 30 different light levels and incubated for 2–3 h. Tilstone et al. (2003) used 15 light levels, whereas Babin et al. (1994) used 12 and both methods incubated samples for 1–2 h. All laboratories used tungsten halogen lamps for incubation and 14C rates were spectrally corrected based on phytoplankton absorption coefficient and the spectrum of the lamp (Kyewalyanga et al., 1997). It has been shown that short incubation periods (1–3 hrs) minimise bottle effects and do not result in nutrient limitation (Falkowski, 1981). Following incubation, all labs filtered the samples through 25 mm glass fibre filters (Whatman GF/F) at a vacuum pressure of <20 cm Hg. The filters were then exposed to 37% fuming HCl fumes for <12 hr to remove any inorganic carbon present, immersed in scintillation cocktail and disintegration time per minute of 14C was counted on a liquid scintillation counter. The PE parameters, [in mg C (mg Chl-a) −1] and αB [in mg C (mg Chl-a) −1 h −1 (μmol photons m −2 s −1) −1] were estimated by fitting the data to the model of Platt et al. (1980) (N = 882) or Jassby and Platt (1976) (N = 194) before being normalised to Chl a. The choice of the model was determined by inspection of each PE curve to evaluate whether there was photo-inhibition or not. The maximum quantum yield (ϕm) (mol C mol quanta−1) was calculated as:
Where PUR (μE m−2 s−1) is the phytoplankton useable radiation and the constant 0.0231 in the numerator converts grams to moles and hours to seconds.
The total absorption coefficient of phytoplankton was determined by filtering between 0.25 and 2 L of seawater onto 25 mm GF/F filters and the absorbance of the particulate material was measured from 350 to 750 nm at a 1 nm bandwidth using dual beam Perkin Elmer Lambda spectrophotometers. Measurements were made of total particulate absorption [apart(λ)] and aNAP(λ) before and after pigment extraction with methanol following the methods of Kishino et al. (1985). The pathlength amplification correction of Kyewalyanga et al. (1997) was used and aph(λ) was derived from the difference between apart(λ) and aNAP(λ).
Pigment-Based Classification of Phytoplankton Size-Classes
The Uitz et al. (2008) Method
The pigment-based method of Uitz et al. (2008) divides the total Chl a biomass into three size-classes (micro-phytoplankton, >20 μm; nano-phytoplankton, 2–20 μm; pico-phytoplankton, <2 μm) using seven diagnostic pigments (fucoxanthin (fuc), peridinin (per), alloxanthin (allo) 19′-butanoyloxyfucoxanthin (19′-but), 19′-hexanoyloxyfucoxanthin (19′-hex), zeaxanthin (zea) and the monovinyl chlorophyll b and divinyl chlorophyll b [Chl b)]. A weighted sum of these diagnostic pigments (wDP) was calculated as follows:
Using the ratio of the weighted sum of group-specific diagnostic pigments to wDP, the proportion of total biomass in the micro-phytoplankton (fmicro), nano-phytoplankton (fnano) and pico-phytoplankton (fpico) size classes were calculated using the following set of equations:
In this study samples were defined as being dominated by a single size-class if more than 70% of the total biomass was assigned to the size-class.
The Sathyendranath et al. (2009) Method
Sathyendranath et al. (2009) identify samples dominated by any one of six phytoplankton groups (diatoms, dinoflagellates, prymnesiophytes, green algae, Prochlorococcus, other cyanobacteria) using the following diagnostic pigments: fuc, chl-c, diad, per, allo, 19′-but, 19′-hex, DV Chl a, monovinyl Chl b (MV Chl b), DV Chl b, and zea. Instead of trying to apportion Chl a to each size-class, ratios of diagnostic pigments with respect to Chl a were used to classify samples as either being dominated by a particular taxonomic group or containing a mixed assemblage of cells (Sathyendranath et al., 2009). In order to compare directly with the results obtained from the Uitz et al. (2008) method, these taxonomic classes were assigned to the three size-classes (diatoms and dinoflagellates were treated as micro-phytoplankton, prymnesiophytes and green algae as nano-phytoplankton, Prochlorococcus and other cyanobacteria as pico-phytoplankton), the distribution of each is given in Figure 1. Uitz et al. (2008) assigned all biomass associated with Chl b to the pico-phytoplankton size-class due to its presence in classes such as Micromonas (Not et al., 2004) and Prochlorococcus (Chisholm, 1992). For this study however, due to the importance of Chl b containing nano-flagellates in the North Atlantic (Wright et al., 2010; Eker-Develi et al., 2012), samples found to consist predominantly of green flagellates using the Sathyendranath et al. (2009) were categorised as nano-phytoplankton.
Statistical Analyses
All data were analysed using CRAN R statistical software, with package “reshape” 0.8.4 used to process the data (R Core Team, 2015). Principal component analyses (PCA) based on correlation matrix were employed to assess the variation in and αB for each phytoplankton size class in relation to other environmental variables to assess the forcing functions on size class photosynthetic parameters. PCA was performed using the prcomp command within “stats” package 2.5.1. Data were plotted using package “ggplot2” version 0.8.9. Significant differences between size classes and methods were analysed using the Wilcoxon Rank Sum test and ANOVA functions within the “stats” package 2.5.1. The ANOVA results are given as W1,df = x, p = y where W is the Wilcoxon Rank Sum, the sub-script numbers denote the degrees of freedom and p is the ANOVA critical significance value.
Results
Relationship between Phytoplankton Photosynthesis and Environmental Variables
Using the Uitz et al. (2008) method, stations dominated by micro-phytoplankton occurred in the NW Atlantic on the Scotian Shelf, in the Irish Sea and at some locations along the Benguela upwelling zone (Figure 1A). There were few stations entirely dominated by nano-phytoplankton, but samples with >50% nano-phytoplankton occurred throughout the data set (Figure 1B). Samples dominated by pico-phytoplankton occurred in the Gulf of Guinea and in the NW sub-tropical Atlantic (Figure 1C). A climatological frequency distribution of data over the seasons is given in Figure 2. More than 30 stations were sampled throughout the year except for the winter period from January to February and summer period from mid-July to early August. The highest number of stations sampled was during late summer, from September-October, and during spring, in April.
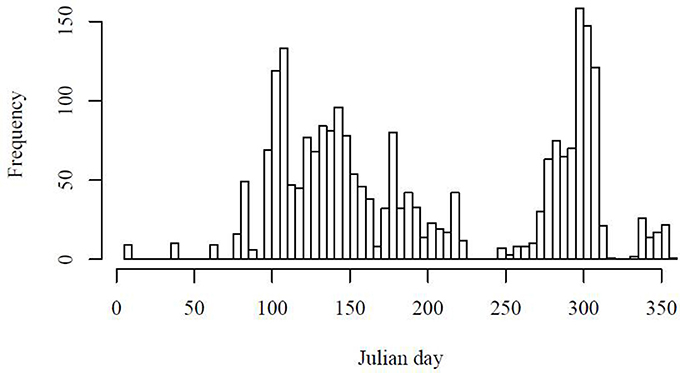
Figure 2. Climatological frequency distribution (1992, 1997–2001) of stations sampled over a year period.
To validate the micro-phytoplankton biomass from the Uitz et al. (2008) method, values of fmicro were compared with the fractional contribution of micro-phytoplankton from microscopy. Total carbon biomass was calculated from cell counts using carbon conversion factors for the AMT6 cruise, which covered a range of oceanographic conditions across a latitudinal gradient. A significant correlation between fmicro using the two approaches was observed (p = 0.0005, r2 = 0.51; Figure 3), which suggests that for a variety of oceanic regimes, the Uitz et al. (2008) method serves as robust chemotaxonomic indicator of micro-phytoplankton biomass.
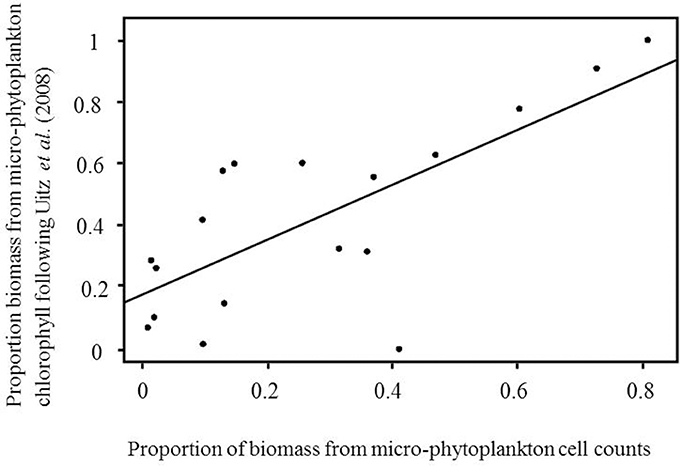
Figure 3. Comparison of the proportion of micro-phytoplankton to total carbon estimated using microscopy counts against the proportion micro-phytoplankton estimated from total chlorophyll following Uitz et al. (2008). Data are from 7 m depth during the AMT6 cruise.
The possible dependence of phytoplankton photosynthesis upon biological environmental variables was examined using PCA (Figure 4), which allows us to visualise the similarities and differences between samples and correlations between variables. The data matrix consisted of 373 observations of 9 variables (environmental variables: temperature, depth and PAR; biological variables: total Chl a, the proportion of size-specific Chl a, and αB derived using the Sathyendranath et al. method). The data were mean centred and normalised to one standard deviation so that data with different dispersion and units could be compared. The first two eigenvalues of the data matrix account for over 65% of the variance; the x-axis accounts for 42.97% and the y-axis accounts for 22.68% of the variability in the data (Figure 4). We therefore limited our analysis to the first factorial plane. The individual samples are coloured by the temperature range occupied by micro-, nano- and pico-phytoplankton (Figure 4). Nutrients were not included in this analysis due to the lag phase between nutrient concentration and uptake which can bias the relationship between cell size and nutrients.
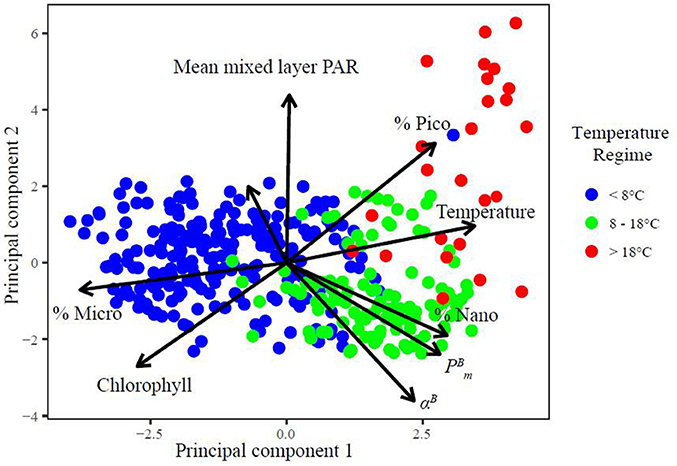
Figure 4. Graphical representation of PCA results as correlation matrix in the plane formed by the two first principal components (PC1 and PC2) with and projection of the individual samples coloured by the temperature ranges occupied by micro-, nano-, and pico-phytoplankton. The eigenvalues of PC1 and 2 account for 65.65% of the variability in the data matrix.
The main variables contributing to the formation of the first principal component (PC1) are the fraction of micro-phytoplankton Chl a (%micro; r2 = 0.47) and total Chl a (r2 = 0.34; positive eigenvalues), temperature (r2 = 0.43), (r2 = 0.35) and the fraction of pico- (%pico; r2 = 0.34), nano- phytoplankton (%nano; r2 = 0.36; negative eigenvalues; Figure 4). This indicates the association of high biomass regions with micro-phytoplankton dominance and that incrementing temperature is coupled with increases in pico-, nano-phytoplankton biomass and . The main variables that form the second principle component are PAR (r2 = 0.55), %pico (r2 = 0.39) and depth (r2 = 0.25) with positive eigenvalues, and αB (r2 = 0.45), Chl a (r2 = 0.36), (r2 = 0.30) and %nano (r2 = 0.24) with negative eigenvalues. The patterns in PC2 explain the vertical variability of light and %pico with depth and the increase in photosynthetic parameters with increases in %nano and Chl a.
Variability in Photosynthesis-Irradiance Parameters
From the in situ data, varied from 0.33 to 20 mg C (mg Chl a)−1 h−1, with a mean of 3.5 mg C (mg Chl a)−1 h−1, αB varied between 0.002 and 0.59 (mg chl)−1 h−1 (μmol quanta m−2 s−1)−1 with a mean of 0.033 (mg chl)−1 h−1 (μmol quanta m−2 s−1)−1, the range in Ek was 12 to 1,300 μmol photons m2 s−1, with a mean of 128 μmol photons m2 s−1, ϕm from 0.0004 to 0.123 mol C (mol photons)−1 with a mean of 0.033 mol C (mol photons)−1 and aph* from 0.059 to 0.074 m2 mg−1 with a mean of 0.0165 m2 mg−1 (Figure 4, Table 2).
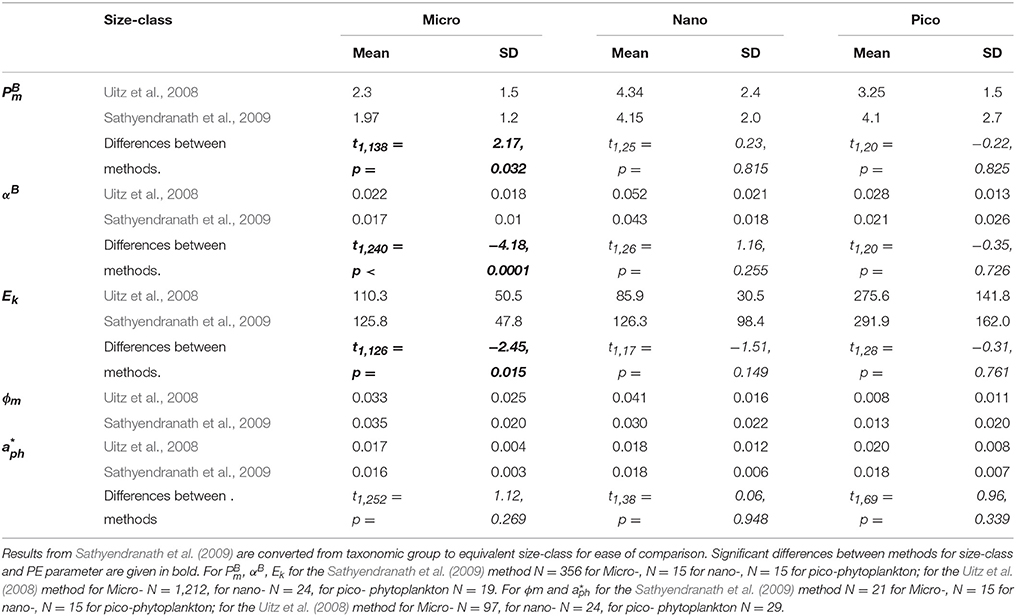
Table 2. Mean and standard deviation for the PE parameters; the maximum photosynthetic rate () [mg C (mg Chl-a)−1], the light-limited photosynthetic rate (αB) [mg C (mg Chl-a)−1 h−1 (μmol photons m−2 s−1)−1], light saturation parameter (Ek) (μmol photons m−2 s−1) quantum yield (ϕm) (mol C mol quanta−1) and mean Chl-a specific light absorption by phytoplankton (for the three size-classes of phytoplankton (pico-phytoplankton <2 μm, nano-phytoplankton 2–20 μm, micro-phytoplankton >20 μm) as estimated by the pigment-based approaches of Uitz et al. (2008) and Sathyendranath et al. (2009).
There were no significant difference in mean obtained using the methods of Uitz et al. (2008) and Sathyendranath et al. (2009) for nano- and pico-phytoplankton, however there were significant differences between methods for micro-phytoplankton (Figure 5A, Table 2). Using the Uitz et al. (2008) classification method, mean values for micro-phytoplankton were significantly lower than those for pico- (W = 5597, p < 0.0001) and nano-phytoplankton (W = 4149, p < 0.0001). Micro-phytoplankton mean estimates derived from the Sathyendranath et al. (2009) method were also significantly lower than that for both pico-phytoplankton (W = 851, p = 0.008) and nano-phytoplankton (W = 1061, p < 0.0001). There was no significant difference in mean between pico- and nano-phytoplankton using either classification method (Figure 5A, Table 2).
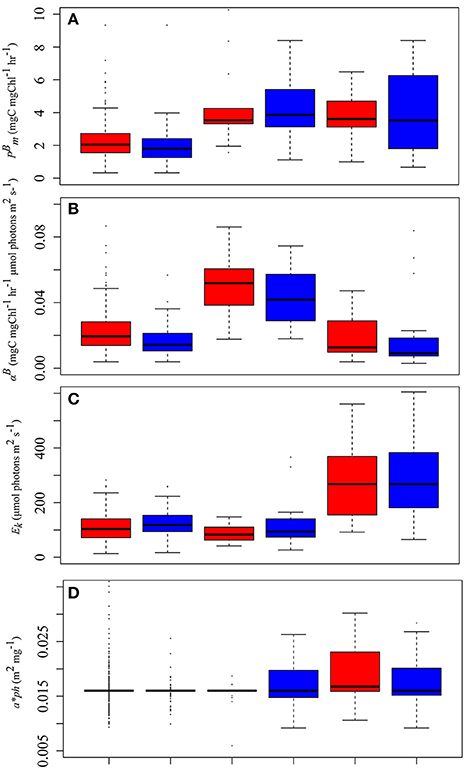
Figure 5. Median PE parameters estimated from Uitz et al. (2008) (red bars) and Sathyendranath et al. (2009) (blue bars) for (A) [mg C (mg Chl a)−1 h−1], (B) αB, [mg C (mg Chl a)−1 h−1 (μmol photons m−1 s−1)−1], (C) Ek (μmol photons m2 s−1), and (D) (m2 mg−1) for the three phytoplankton size classes (micro-phytoplankton >20 μm, nano-phytoplankton 2–20 μm, pico-phytoplankton <2 μm).
There were also no significant differences in mean αB for nano- and pico-phytoplankton between the two methods, but for micro-phytoplankton there was a significant difference between the methods (Figure 5B, Table 2). The mean αB was significantly higher for nano-phytoplankton compared to micro-phytoplankton, using both the Uitz et al. (2008) approach (W = 461, p < 0.0001) and the Sathyendranath et al. (2009) method (W = 93, p < 0.0001). The mean value of αB was also significantly higher for nano-phytoplankton compared to pico-phytoplankton for both methods (Uitz et al., 2008: W = 21, p < 0.0001; Sathyendranath et al., 2009: W = 41, p = 0.003). There were no significant differences in mean αB between pico- and micro-phytoplankton using either classification method (Figure 5B, Table 2).
Similarly there were no significant difference in mean Ek value for nano- and pico-phytoplankton between methods, but there was a significant difference for micro-phytoplankton (Figure 5C, Table 2). The mean Ek value for pico-phytoplankton determined using the Sathyendranath et al. (2009) approach was also significantly higher than that for nano-phytoplankton (W = 185, p = 0.003) and micro-phytoplankton (W = 964, p < 0.0001). There was no significant difference in mean Ek between nano- and micro-phytoplankton size classes between methods.
Mean ϕm for pico-phytoplankon derived from the Uitz et al. (2008) method was significantly lower than those for both nano-phytoplankton (W = 164, p > 0.0001) and micro-phytoplankton (W = 5214, p > 0.0001; Figure 5D, Table 2). Similarly, the mean ϕm for pico-phytoplankton using the Sathyendranath et al. (2009) approach was also significantly lower than that for nano-phytoplankton (W = 178, p = 0.007) and micro-phytoplankton (W = 995, p < 0.0001). There were no significant differences in ϕm between micro- and nano-phytoplankton using either method.
Mean derived from both methods were almost identical for each size class and there was no significant difference between them (Table 2).
Taxa-Specific Relationships between Environmental Variables and Photosynthesis-Irradiance Parameters
Temperature varied between −1.6 and 26.3°C with a mean of 10.7°C. When is plotted as a function of temperature (Figures 6A,E), the upper boundary of the points exhibited a linear increase with temperature until ~15°C, after which there is a decrease with increasing temperature. The αB values also displayed a similar increase to 15°C, followed by a decrease to 28°C (Figures 6B,F), whereas Ek and remained relatively constant to 15°C, and then increased sharply from 15 to 28°C (Figures 6C–H), though the increase in was far less marked than for Ek (Figures 6D,H).
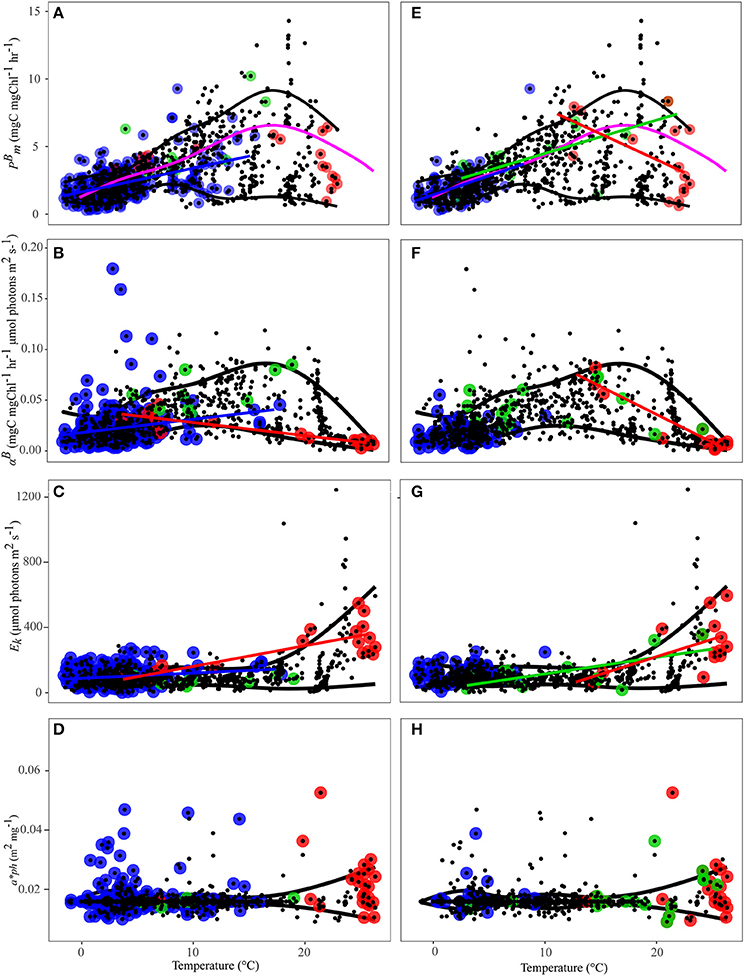
Figure 6. PE parameters as a function of temperature: (A) is Uitz ; (B) is Uitz αB; (C) is Uitz Ek; (D) is Uitz ; (E) is Sathyendranath ; (F) is Sathyendranath αB; (G) is Sathyendranath Ek; (H) is Sathyendranath . Micro-phytoplankton (>20 μm) is blue circles, nano-phytoplankton (2–20 μm) is green circles, and pico-phytoplankton (<2 μm) is red circles. Black points represent samples classified as “mixed” populations; blue regression line is for micro-, green regression line is for nano- and red regression line is for pico-phytoplankton, black lines are the 10 and 90% quantiles fitted using a running average over all samples, the pink line is the 7th order polynomial relationship from Behrenfeld and Falkowski (1997).
The shape of the relationships between the PE parameters and temperature were similar between methods, but there were differences in the temperature ranges associated with each of the size classes derived using the two methods. The temperature range for micro-phytoplankton dominated samples was greater when using the Uitz et al. (2008) method (−1.6 to 18°C) compared to the Sathyendranath et al. (2009) method (−1.6 and 10°C). Using the Uitz et al. (2008) approach, samples dominated by pico-phytoplankton occurred at temperatures as low as 3.7°C, whereas the coldest pico-phytoplankton dominated samples identified by the Sathyendranath et al. (2009) method were at 13°C (Figure 6).
For the Uitz et al. (2008) method, there were significant relationships between and temperature for micro-phytoplankton (Figure 6E, Table 3), for αB and temperature for micro- and pico-phytoplankton (Figure 6B, Table 3), and for Ek and temperature for micro- and pico-phytoplankton, though for micro- this relationship was also markedly weaker (Figure 6C, Table 3). For the Uitz method, there was also no significant relationship between and temperature for each size class (Figure 6D, Table 3).
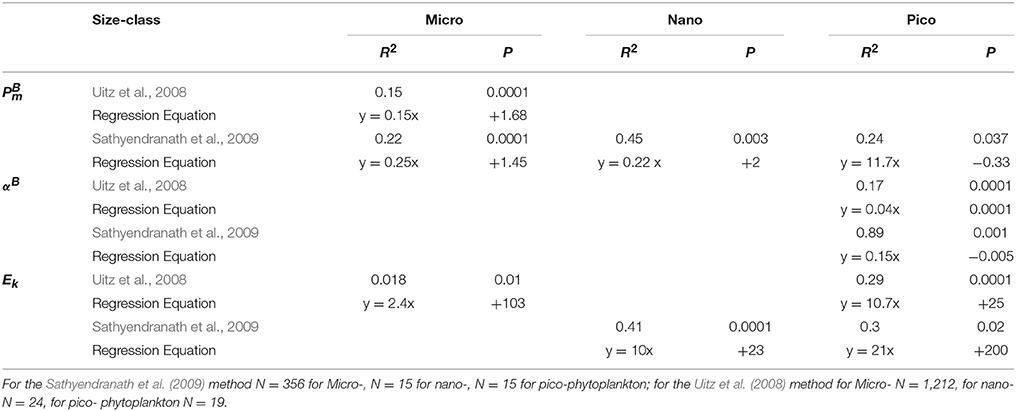
Table 3. Significant regression equations between size class photosynthetic parameters and temperature.
Using the Sathyendranath et al. (2009) method, there were significant relationships between and temperature for each size-class (Figure 6A). For micro-phytoplankton and nano-phytoplankton there were significant positive correlations with temperature (Table 3). Pico-phytoplankton, on the other hand, displayed a significant inverse correlation with temperature, though this was only just within the 5% limit. There were no significant relationships between αB and temperature for samples dominated by micro- or nano-phytoplankton, whereas for pico-phytoplankton there was a significant inverse relationship with temperature (Figure 6F, Table 3). There was no significant correlation between Ek and temperature for micro-phytoplankton dominated samples. By contrast, there was a significant positive relationship between Ek and temperature for samples dominated by nano-phytoplankton and pico-phytoplankton, though for pico- these were markedly weaker (Figure 5G, Table 3). For this method, there was no significant relationship between and temperature for each size class (Figure 6H, Table 3).
We also examined the relationship between the photosynthetic parameters and αB derived from the Sathyendranath et al. (2009) and Uitz et al. (2008) methods with nitrate and PAR (Figure 7). Nitrate concentrations varied from below the limit of detection to 26.10 μM, with a mean of 2.15 μM and PAR varied from 2 to 55 E m−2 d−1. The distribution of micro-phytoplankton and αB against nitrate and PAR using the Uitz et al. (2008) method was greater than for the Sathyendranath et al. (2009) method, since the latter classified fewer samples in each size class. There were no significant relationships for each parameter from either method for all data and for each size class (Figure 7).
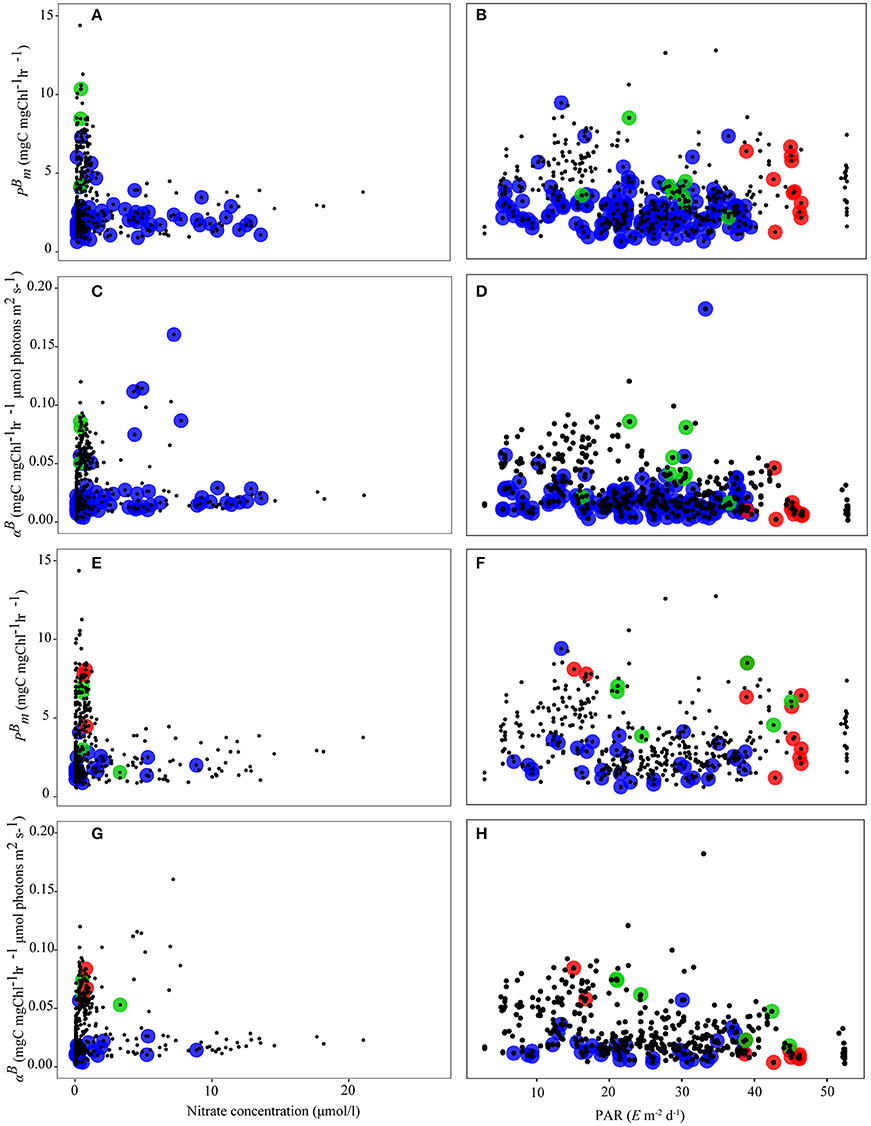
Figure 7. PE parameters as a function of nitrate an PAR: (A) is Sathyendranath against nitrate; (B) is Uitz against nitrate; (C) is Sathyendranath αB against nitrate; (D) is Uitz αB against nitrate; (E) is Sathyendranath against PAR; (F) is Uitz against PAR; (G) is Sathyendranath αB against PAR; (H) is Uitz αB against PAR; Micro-phytoplankton (>20 μm) is blue circles, nano-phytoplankton (2–20 μm) is green circles, and pico-phytoplankton (<2 μm) is red circles. Black points represent samples classified as “mixed” populations.
Discussion
Comparison of Size-Class Methods
The Uitz et al. (2008) classification method divides the total Chl a biomass of all samples into three size categories according to the relative abundances of specific indicator pigments. The reliability of this method for micro-phytoplankton was confirmed by the correlation between the pigment-based and microscopy-based estimates of the relative proportion of micro-phytoplankton biomass (Figure 3). The Sathyendranath et al. (2009) approach identifies samples where indicator pigment ratios suggest that they are comprised of a mixed population, and then omits them, leaving only samples dominated by a single taxonomic group. Samples dominated by individual taxonomic groups can then be combined to give a subset of samples dominated by a single size-class (N = 386), and are thus comparable with the output resulting from applying the threshold criteria to the size-class-based approach of Uitz et al. (2008). While the Uitz et al. (2008) method gives a proportion that can be plotted against the microscopy data, the Sathyendranath et al. (2009) identifies samples dominated by a single size class which cannot be directly compared with the microscopy data, which is a limitation of this method. Full validation of nano- and pico-phytoplankton fractions by each method was not possible due to the lack of coincident flow cytometry data. Further work is therefore required to compare the nano- and pico-phytoplankton size classes against independent in situ data.
Another limitation of the Sathyendranath et al. (2009) approach is that the stringent criteria requires a sufficiently large dataset to derive group-specific properties, since many of the samples are excluded on the basis that they are classified as mixed populations. Many phytoplankton groups, especially in the nano-phytoplankton size range, rarely form class-specific blooms (Hirata et al., 2008) and assessing only samples dominated by marker pigments of a single phytoplankton group could result in omission of the majority of phytoplankton communities from the analysis. The Uitz et al. (2008) method is much less restrictive, and when a cut-off point of 70% is used to define samples dominated by a single size-class, more samples are found to have mixed populations compared with the Sathyendranath et al. (2009) approach. This causes the differences in temperature range for each size-class using the two methods. For the Uitz et al. (2008) approach, biomass is assigned to the pico-phytoplankton size-taxa as a result of the presence of either zeaxanthin or Chl b. Some low-temperature samples in our dataset contained high Chl b concentrations, yet little zeaxanthin illustrating why some samples classified as pico-phytoplankton occur at 3.7°C with this method. While this may indicate the presence of pico-eukaryotes such as Micromonas, it could be also be a result of Chl b containing nano-flagellates being wrongly identified as pico-phytoplankton. The variability between the two methods reflects the way each method treats mixed populations.
Few independent studies have been used to verify the accuracy of these methods. Figueiras et al. (2014) tested the Uitz et al. (2008) method in the upwelling region of the NW Iberian peninsula and concluded that the method is accurate during stratified hydrographic conditions, but when the water column becomes mixed, the method over-estimates primary production. Our analysis suggests that the Sathyendranath et al. (2009) is applicable to conditions when the water column is completed dominated by a particular taxa or size-class and that the Uitz et al. (2008) method is more applicable to retrieving mixed populations. Further testing of the Sathyendranath et al. (2009) method in other shelf sea regions and the Uitz et al. (2008) method in other open ocean systems is required.
Phytoplankton Size Class and Photosynthesis-Irradiance Parameters
The size dependency of that we observed (Figure 4A) is consistent with the trends reported in Geider et al. (1997) and Le Quéré et al. (2005), with smaller size-classes having a higher biomass-normalised rates of photosynthesis compared with the larger size-class. By contrast, the global study of Uitz et al. (2008) found that micro-phytoplankton had higher . Similarly, a recent study of size fractionated PE parameters in the Atlantic Ocean, Tilstone et al. (2017) also reported that micro-phytoplankton had the highest [4.54 mg C (mg Chl a)−1], followed by nano- [4.15 mg C (mg Chl a)−1)] and pico- [2.29 mg C (mg Chl a)−1]. Cermeño et al. (2006) also observed higher biomass-normalised photosynthetic rates for larger cells. These differences may be due, in part, to the range of environmental conditions found in these contrasting studies. In this study, samples dominated by micro-phytoplankton were mostly located in the temperate North West Atlantic (Figure 1A) during the spring bloom (Figure 2), whereas the data used by Uitz et al. (2008) were from the sub-tropics and the Mediterranean. The study of Tilstone et al. (2017) covered both the Atlantic oligotrophic gyres and upwelling zones. The lower photosynthetic rates for micro-phytoplankton observed in this study could be the result of pigment packaging, which arises from self-shading by pigment molecules in the cell (Bidigare and Ondrusek, 1996). The package effect suggests that as the Chl a concentration per cell volume increases, the specific absorption coefficient decreases so that small cells require lower intracellular concentrations of Chl a compared to large cells to harvest equivalent quantities of light (Morel and Bricaud, 1981). Lower pigment packaging occurs due to a decrease in the pigment concentration per cell volume, as a result of either a decrease in cell size. For cells of a constant size, a decrease in internal pigment concentration can occur (Cleveland, 1995). Under this scenario, the carbon-to-chlorophyll ratio decreases as cell size increases. When measuring biomass in carbon units rather Chl a, the carbon-specific photosynthetic rates of small cells will decrease and those of large cells will increase.
The trends in Tilstone et al. (2017) are based on size-fractionated filtration whereas in this study we derived size-classes from phytoplankton pigment markers. Errors in the HPLC method may arise from the fact that taxonomic groups identified by specific diagnostic pigments have a large range in size and may therefore be classified across size classes (Brewin et al., 2014). Certain taxonomic groups can exhibit a high degree of variability in pigment concentration and composition. There can also be light-dependent variations in pigments filtration and HPLC methods (Vidussi et al., 2001). Differences in HPLC methods used across data sets may further compound these errors. In this study, differences in pigment concentrations arising from methodological differences in solvent, extraction procedures (see Table 1) could also contribute to differences between phytoplankton characterisation in the mesotrophic and eutrophic North West Atlantic (BIO), the sub-tropical Atlantic (LOV) and the oligotrophic Atlantic (PML).
A size-taxa dependent trend was also observed for αB; mean αB for nano-phytoplankton dominated samples were significantly higher than for micro-phytoplankton (Figure 5B). This was observed in ϕm using the Uitz et al. (2008) method, and reflects an increase in light harvesting efficiency and possibly higher nutrient availability (Morel and Bricaud, 1981; Howarth et al., 1988). Nano-phytoplankton is known to form a large proportion of the biomass at the DCM where irradiance levels are low and there is adaptation to maximise the photosynthetic rate through increases in C: Chl a ratios or changes in pigment composition (Bouman et al., 2000; Gibb et al., 2001). From our data, nano-phytoplankton dominated samples in the surface layer have a similar capacity to maximise αB at mid to high PAR (Figure 7D). Due to their small size and higher specific absorption coefficient, we may expect pico- to have higher αB compared to nano-phytoplankton. We did not observe this however, though the sample size for pico-phytoplankton was small (Figures 7D,H).
Ek is defined as /αB, and therefore size-class specific trends in Ek can be driven either by changes in or αB. Similar to Behrenfeld et al. (2004) and Huot et al. (2013), no significant difference was seen between Ek for micro- and nano-phytoplankton due to a co-variance of and αB. Thus, whilst we observed nano-phytoplankton to be higher than that of micro-phytoplankton, a corresponding increase in αB resulted in no change in Ek below 15°C. Pico-phytoplankton however had a high mean and low αB resulting in higher mean Ek, reflecting their dominance in the high irradiance environments of the NW sub-tropics and Gulf of Guinea (Figure 1C). By contrast, we found no significant difference in between size classes (Figure 5D).
Environmental Variables, Phytoplankton Size Class and Photosynthesis-Irradiance Parameters
The objective of comparing these pigment based methods of classifying size-class PE parameters was to assess the range and trend in these parameters against environmental variables. Of the environmental variables tested (temperature, nutrients, PAR), we found significant correlations between micro-, nano- and pico-phytoplankton photosynthetic parameters and temperature (Figure 6). For nitrate and PAR, correlations with size-class photosynthetic parameters were not significant (Figure 7).
Temperature is a major driver of successional changes in phytoplankton, both through direct effects on population growth and indirect effects through changes in water column stability and predator population growth (Lichtman et al., 2010). Many studies have shown that temperature is a strong predictor of phytoplankton cell size in marine ecosystems (Marañon et al., 2001; Bouman et al., 2003) such that the average cell size within phytoplankton communities tends to decreases with increasing temperature, which we also observed in this study (Figure 6). From our dataset, the relationships between temperature and the photosynthetic parameters and αB exhibited a clear envelope, with samples dominated by a specific phytoplankton size-class with a slightly different temperature range depending on the classification method used (Figures 6A,D). For micro- and nano-phytoplankton derived from the Sathyendranath et al. (2009) method, the regressions with temperature were highly correlated (Figures 6A,E). Increasing temperature resulted in an increase in up to 18°C, following standard reaction kinetics and possible enzymatic effects on the dark reactions of photosynthesis (Geider et al., 1998). For samples dominated by pico-phytoplankton there was a negative relationship between and temperature, though this was based on few data. These relationships are similar to those given in Thomas et al. (2012), in which the optimum temperature for growth decreases above 25°C in sub-tropical regions. Under future warming scenarios, this could result in a reduction in phytoplankton diversity and productivity in sub-tropical regions. The low values of at very high temperatures are likely to be the combined effects of extreme nutrient limitation (Geider et al., 1997), coupled with increased energetic costs of photo-protection under high irradiance in stratified oligotrophic waters (Raven, 2011). This relationship contrasts that observed in other studies where pico-phytoplankton and temperature are positively correlated (e.g. Mackey et al., 2013).
In our data, when temperature was high, αB was low (Figure 6B). In this scenario irradiance would also potentially be high suggesting high light adaptation at high temperatures and/or photo-protection. At lower temperatures micro-phytoplankton dominated and αB was also low, which may be due to the decreased efficiency of light absorption by phytoplankton caused by increased pigment packaging or the negative relationship between ϕm and nutrient availability, which can also occur at low temperature (Platt et al., 1992; Sosik, 1996).
Ek exhibited temperature-independent variation to ~20°C, beyond which there was a linear increase in Ek with increasing temperature (Figure 6C,F) possibly as a consequence of thermal stratification. This pattern has been observed in previous studies (Marañon and Holligan, 1999; Behrenfeld et al., 2004), where the highest values of Ek were associated with warm, subtropical waters. An increase in Ek with temperature may represent a strategy of acclimation to high light (Geider et al., 1998; Behrenfeld et al., 2004) and was observed in samples where both and αB decrease (Figures 6A–G). The drop in αB however, was greater than the drop in (Figures 6C,F), possibly reflecting an energetic investment in photo-protection by nano- and pico-phytoplankton under these conditions (Babin et al., 1996; Bouman et al., 2000; Raven et al., 2005). We observed no significant relationship between and temperature in each size class (Figures 6D,H).
The majority of the data that we used were from the NW Atlantic (N = 1873) and dominated by micro- and nano-phytoplankton (Figures 1A,B), compared to N = 389 in the oligotrophic Atlantic Ocean where pico-phytoplankton only dominated at stations in the Gulf of Guinea and NW sub-tropical Atlantic (Figure 1C). This skewed the relationships toward larger size classes that inhabit colder waters. For both methods over a temperature range of 0 to 8°C, the samples are dominated by micro-phytoplankton with some samples also dominated by nano-phytoplankton (Figures 6A,E). In the open ocean, nano-phytoplankton rarely comprises the entire phytoplankton community. Over the temperature range from 8 to 18°C, fewer samples were dominated by a single size class using the Sathyendranath et al. (2009) method (Figure 6E), and the phytoplankton community was represented more by mixed populations, as classified by the Uitz et al. method (Figure 6A). At temperatures >18°C, both methods showed a similar distribution in classifying samples dominated by pico-phytoplankton.
Using global in situ data Behrenfeld and Falkowski (1997) suggested a 7th-order polynomial relationship between temperature and the optimum photosynthetic rate for a given in situ productivity profile, , which incorporates a reduction in photosynthesis at high temperatures. is distinct from since it is derived from longer in situ incubations (Behrenfeld and Falkowski, 1997) as it also describes the optimum value at a discrete bottle depth rather than an instantaneous rate at the optimum irradiance level. The shape of the relationship found in the study of Behrenfeld and Falkowski (1997) fit midway between the 10 and 90% quantiles shown in this study (Figures 6A,B). The 90% quantile fit for can be regarded as the phytoplankton response under optimum conditions. In natural assemblages however, “optimal” conditions are rarely observed. The majority of production rates frequently fall below this upper bound due to the effect of changes in the community structure, nutrient, and/or light-limitation, which is illustrated by the scatter around the upper quantile (Figures 6A,B).
Temperature also co-varies with light (Finkel et al., 2010), stratification and nutrient supply (Sathyendranath et al., 1991; Kamykowski et al., 2002) suggesting that significant correlations between temperature and phytoplankton size-class are also likely to be due to these other co-varying parameters (Bouman et al., 2005). At higher temperatures for example, there is considerable spread in the data, which is likely a reflection of a myriad of other factors, such as nutrient availability and light, that govern the magnitude in (Behrenfeld and Falkowski, 1997; Huot et al., 2007). The strong negative correlation between temperature and at higher temperatures probably reflects the strong negative correlation between photosynthesis and nutrient supply in the open ocean (Sathyendranath et al., 1991; Kamykowski et al., 2002). ϕm is also strongly dependent on nutrient status and the low nutrient regime associated with warm, stratified areas often results in very low quantum yields (Falkowski et al., 1992; Platt et al., 1992; Sosik and Mitchell, 1994; Sosik, 1996). Samples dominated by pico-phytoplankton are often found where nutrient concentrations are extremely low and surface irradiance levels are high, which can result in a negative relationship between αB and temperature (Platt et al., 1992; Sosik, 1996), which corresponds with the patterns that we observed (Figures 6B,F). We did not however find significant correlations between size-fractionated photosynthetic parameters and nitrate (Figure 7). The lack of trend in these relationships is because ambient nutrient concentrations are generally uncoupled from changes in phytoplankton biomass and size-class such that nutrients can be high when phytoplankton biomass is low or at the peak of a bloom when phytoplankton biomass is high especially micro-phytoplankton, dissolved inorganic nitrogen (DIN), soluble reactive phosphorus (SRP) or dissolved silicate (DSi) may be used up rapidly and therefore be low. Phytoplankton biomass and nutrients remain out of phase resulting from the lag response between injection of nutrients into the euphotic zone and phytoplankton growth. For both methods the range in and αB was high at nitrate concentrations <1 μmolL−1 and was low at higher concentrations (Figures 7A,C,E,F). For the Uitz et al. (2008) method, the highest αB occurred at nitrate concentrations of between 5 and 10 μmolL−1. This pattern was not evident using the Sathyendranath et al. (2009) method for classifying size-class PE parameters.
Similarly we found no significant trend between and αB and PAR (Figure 7). This may be due to a combination of photo-acclimation and photo-inhibition. Phytoplankton can become photo-acclimated to their optimum photosynthetic rate over a large range in PAR (Sosik, 1996), which is evident by the narrow range in and αB and similar values for micro-, nano- and pico-phytoplankton. Sosik and Mitchell (1994) found that at high irradiance there is no significant difference in ϕm between micro- and nano-phytoplankton. In addition, high surface irradiance can result in the synthesis of photo-protective pigments to prevent damage to the photosystems (Dimier et al., 2007), which can potentially reduce αB and ϕm (Babin et al., 1996; Bouman et al., 2000), which is also evident in our data (Figures 7D,H). We found the xanthophyll cycle transformation product Diatoxanthin was present in ~25% of our samples, suggesting that a quarter of the data set was affected by photo-protection. For the Uitz et al. (2008) method, micro-phytoplankton had higher and αB at lower PAR (~15 μm−2d−1), nano- at ~20 μm−2d−1, and pico- at higher irradiance (>40 μm−2d−1). For the Sathyendranath et al. method these patterns changed, with micro- and αB being generally lower than values for nano- and pico-phytoplankton (Figure 7F), which had the highest values at 15–20 and >40 μm−2d−1. These differences arise from the treatment of mixed populations by each method.
In summary, we found that micro- and nano-phytoplankton PE parameters are highly correlated with temperature. We found no significant relationship between size-class PE parameters and nitrate and PAR. We recommend the Sathyendranath et al. method for classifying micro-phytoplankton over the temperature range of 0–8°C and pico-phytoplankton at temperatures >18°C during blooms. The Uitz et al. method is recommended for mixed micro- and nano-phytoplankton populations over the temperature range of 8–18°C. The PE parameters of these size classes could be derived from satellite sea surface temperature using these methods from the regression equations given in Table 3.
As remote-sensing models for estimating the biomass of phytoplankton functional types or size classes have developed (Sathyendranath et al., 2001; Nair et al., 2008; Brewin et al., 2010; Uitz et al., 2012), global estimates of primary production for particular groups of phytoplankton are improving. Models such as that of Uitz et al. (2012) have demonstrated the importance of size structure in estimates of primary production, where inclusion of different size classes of phytoplankton lowered the primary production estimates for the Mediterranean by a factor of 2. By linking the size-specific relationships for phytoplankton photosynthetic rates with temperature using the equations given in Table 3, class-specific primary production can be obtained. Such models will enable higher spatial and temporal frequency estimates of primary production in different size classes, which could be applied, through data assimilation, to improve the accuracy of biogeochemical models of the pelagic ecosystem.
Summary
Two chemotaxonomic methods of classifying phytoplankton size taxa showed similar temperature-photosynthesis size-class dependence. There were no significant differences between these methods for mean photosynthetic parameters of the different size classes. Mean and αB were significantly higher for nano-phytoplankton compared to micro- and pico-phytoplankton. The temperature ranges occupied by the size classes derived using the Uitz et al. (2008) method however exhibited a wider temperature range than those derived from the Sathyendranath et al. (2009) method. These differences arise from way that mixed populations are classified. Based on the relationship between PE parameters in different size classes and temperature, we recommend using the Sathyendranath et al. (2009) method to derive micro-phytoplankton PE parameters in sea water temperatures up to 8°C during monospecific blooms and the Uitz et al. (2008) method to derive PE parameters of mixed populations over the temperature range from 8 to 18°C.
Author Contributions
AR processed and analysed the data, prepared the figures and drafted the manuscript as part of his PhD thesis. HB, GT, and SS conceived and directed the research, provided the in situ data, contributed to the data analysis and writing of the paper. HB obtained the funding to carry out the research. GT distilled the PhD chapter into a paper and provided Case support funding. All authors have contributed substantially to the study's conception, data acquisition and analysis and to writing the manuscript.
Conflict of Interest Statement
The authors declare that the research was conducted in the absence of any commercial or financial relationships that could be construed as a potential conflict of interest.
Acknowledgments
This work was supported by a NERC Studentship to AR (Studentship No. 0711560248004). We are grateful to British Oceanographic Data Centre for supplying data from the Atlantic Meridional Transect (AMT). GT was supported by UK Natural Environment Research Council National Capability funding for the Atlantic Meridional Transect (AMT) to Plymouth Marine Laboratory, which was also supported by near real time satellite service from the National Earth Observation Data Archive and Analysis Service. This is contribution number 265 of the AMT programme. This work is a contribution to the National Centre for Earth Observations Project of UK Natural Environment Research Council, and to the ESA Project on Photosynthetic Parameters of Phytoplankton from Space. We thank Marcel Babin and Julia Uitz for use of the EUMELI data collected by LOV.
References
Antoine, D., Andre, J. M., and Morel, A. (1996). Oceanic primary production.2. Estimation at global scale from satellite (coastal zone color scanner) chlorophyll. Glob. Biogeochem. Cycles 10, 57–69. doi: 10.1029/95GB02832
Babin, M., Morel, A., and Gagnon, R. (1994). An incubator designed for extensive and sensitive measurements of phytoplankton photosynthetic parameters. Limnol. Oceanogr. 39, 694–702. doi: 10.4319/lo.1994.39.3.0694
Babin, M., Morel, A., Claustre, H., Bricaud, A., Kolber, Z., and Falkowski, P. G. (1996). Nitrogen- and irradiance-dependent variations of the maximum quantum yield of carbon fixation in eutrophic, mesotrophic and oligotrophic marine systems. Deep-Sea Res. I 43, 1241–1272. doi: 10.1016/0967-0637(96)00058-1
Banse, K. (1976). Rates of growth, respiration and photosynthesis of unicellular algae as related to cell size – A review. J. Phycol. 12, 135–140.
Barlow, R., Stuart, V., Lutz, V., Sessions, H., Sathyendranath, S., Platt, T., et al. (2007). Seasonal pigment patterns of surface phytoplankton in the subtropical southern hemisphere. Deep Sea Res. I Oceanogr. Res. Papers 54, 1687–1703. doi: 10.1016/j.dsr.2007.06.010
Barlow, R. G., Cummings, D. G., and Gibb, S. W. (1997). Improved resolution of mono- and divinyl chlorophylls a and b and zeaxanthin and lutein in phytoplankton extracts using reverse phase C-8 HPLC. Mar. Ecol. Prog. Ser. 161, 303–307. doi: 10.3354/meps161303
Behrenfeld, M. J., and Falkowski, P. G. (1997). Photosynthetic rates derived from satellite-based chlorophyll concentration. Limnol. Oceanogr. 42, 1–20.
Behrenfeld, M. J., Boss, E., Siegel, D. A., and Shea, D. M. (2005). Carbon-based ocean productivity and phytoplankton physiology from space. Glob. Biogeochem. Cycles 19:GB1006. doi: 10.1029/2004GB002299
Behrenfeld, M. J., Prasil, O., Babin, M., and Bruyant, F. (2004). In search of a physiological basis for covariations in light- limited and light-saturated photosynthesis. J. Phycol. 40, 4–25. doi: 10.1046/j.1529-8817.2004.03083.x
Berggreen, U., Hansen, B., and Kiørboe, T. (1988). Food size spectra, ingestion and growth of the copepod Arcatia tonsa: implications for the determination of copepod production. Mar. Bio. 99, 341–352. doi: 10.1007/BF02112126
Bidigare, R. R., and Ondrusek, M. E. (1996). Spatial and temporal variability of phytoplankton pigment distributions in the central equatorial Pacific Ocean. Deep-Sea Res. II 43, 809–833. doi: 10.1016/0967-0645(96)00019-7
Bouman, H. A., Platt, T., Kraay, G. W., Sathyendranath, S., and Irwin, B. D. (2000). Bio-optical properties of the subtropical North Atlantic. I. Vertical variability. Mar. Ecol. Progr. Ser. 200, 3–18. doi: 10.3354/meps200003
Bouman, H. A., Platt, T., Sathyendranath, S., Li, W. K. W., Stuart, V., Fuentes-Yaco, C., et al. (2003). Temperature as indicator of optical properties and community structure of marine phytoplankton: implications for remote sensing. Mar. Ecol. Progr. Ser. 258, 19–30. doi: 10.3354/meps258019
Bouman, H., Platt, T., Sathyendranath, S., and Stuart, V. (2005). Dependence of light-saturated photosynthesis on temperature and community structure. Deep-Sea Res. I. 52, 1284–1299. doi: 10.1016/j.dsr.2005.01.008
Brewer, P. G., and Riley, J. P. (1965). The automatic determination of nitrate in sea water. Deep Sea Res. 12, 765–772.
Brewin, R. J. W., Lavender, S. J., Hardman-Mountford, N. J., and Hirata, T. (2010). A spectral response approach for detecting dominant phytoplankton size class from satellite remote sensing. Acta Oceanol. Sinica 29, 14–32. doi: 10.1007/s13131-010-0018-y
Brewin, R. J. W., Sathyendranath, S., Tilstone, G., Lange, P. K., and Platt, T. (2014). A multicomponent model of phytoplankton size structure. J. Geophys. Res. 119, 3478–3496. doi: 10.1002/2014JC009859
Brewin, R. J. W., Tilstone, G., Jackson, T., Cain, T., Miller, P., Lange, P. K., et al. (2017). Modelling size-fractionated primary production in the Atlantic Ocean from remote sensing. Prog. Oceanogr. 158, 130–149. doi: 10.1016/j.pocean.2017.02.002
Brown, J. H., West, G. B., and Enquist, B. J. (2000). “Scaling in biology: patterns and processes, causes and consequences,” in Scaling in Biology, eds J. H. Brown and G. B. West (Oxford, UK: Oxford University Press), 1–24.
Carr, M. E., Friedrichs, M. A. M., Schmeltz, M., Aita, M. N., Antoine, D., Arrigo, K. R., et al. (2006). A comparison of global estimates of marine primary production from ocean color. Deep Sea Res. II 53, 741–770. doi: 10.1016/j.dsr2.2006.01.028
Cermeño, P., Marañón, E., Harbour, D., and Harris, R. P. (2006). Invariant scaling of phytoplankton abundance and cell size in contrasting marine environments. Ecol. Lett. 9, 1210–1215. doi: 10.1111/j.1461-0248.2006.00973.x
Chisholm, S. W. (1992). “Phytoplankton size,” in Primary Productivity and Biogeochemical Cycles in the Sea, eds P. G. Falkowski and A. D. Woodhead (New York, NY: Plenum Press), 213–237
Claustre, H., and Marty, J. C. (1995). Specific phytoplankton biomasses and their relation to primary production in the Tropical North-Atlantic. Deep Sea Res. I 42, 1475–1493. doi: 10.1016/0967-0637(95)00053-9
Cleveland, J. S. (1995). Regional models for phytoplankton absorption as a function of chlorophyll a concentration. J. Geophys. Res. 100, 13333–13344. doi: 10.1029/95JC00532
Dimier, C., Corato, F., Tramontano, F., and Brunet, C. (2007). Photoprotection and xanthophyll-cycle activity in three marine diatoms. J. Phycol. 43, 937–947. doi: 10.1111/j.1529-8817.2007.00381.x
Duysens, L. N. M. (1956). Energy transformations in photosynthesis. Ann. Rev. Plant Physiol. 7, 25–50. doi: 10.1146/annurev.pp.07.060156.000325
Eker-Develi, E., Berthon, J.-F., Canuti, E., Slabakova, N., Moncheva, S., Shtereva, G., et al. (2012). Phytoplankton taxonomy based on CHEMTAX and microscopy in the northwestern Black Sea. J. Mar. Syst. 94, 18–32. doi: 10.1016/j.jmarsys.2011.10.005
Enquist, B. J., Brown, J. H., and West, G. B. (1998). Allometric scaling of plant energetics and population density. Nature. 395, 163–165.
Eppley, R. W., Rogers, J. N., and McCarthy, J. J. (1969). Half-saturation constants for uptake of nitrate and ammonium by marine phytoplankton. Limnol. Oceanogr. 14, 912–920. doi: 10.4319/lo.1969.14.6.0912
Eppley, R. W., and Sloan, P. R. (1965). Carbon balance experiments with Marine Phytoplankton. J. Fish. Res. Bull. Can. 22, 1083-1097.
Everitt, D. A., Wright, S. W., Volkman, J. K., Thomas, D. P., and Lindstrom, E. J. (1990). Phytoplankton community compositions in the western equatorial pacific determined from chlorophyll and carotenoid pigment distributions. Deep-Sea Res. I. 37, 975–997. doi: 10.1016/0198-0149(90)90106-6
Falkowski, P. G. (1980). “Light-shade adaptation in marine phytoplankton,” in Primary Productivity in the Sea, ed P. G. Falkowski (Boston, MA: Plenum Press), 99–119.
Falkowski, P. G. (1981). Light-shade adaptation and assimilation numbers. J. Plankton Res. 3, 203–216. doi: 10.1093/plankt/3.2.203
Falkowski, P. G., and LaRoche, J. (1991). Acclimation to spectral irradiance in algae. J. Phycol. 27, 8–14.
Falkowski, P. G., Greene, R. M., and Geider, R. J. (1992). Physiological limitations on phytoplankton productivity in the ocean. Oceanography 5, 84–91. doi: 10.5670/oceanog.1992.14
Figueiras, F. G., Espinoza-Gonzalez, O., Arbones, B., Garrido, J. L., Teixeira, I. G., and Castro, C. G. (2014). Estimating phytoplankton size-fractionated primary production in the north western Iberian upwelling: is mixotrophy relevant in pigmented nanoplankton? Prog. Oceanogr. 128, 88–97. doi: 10.1016/j.pocean.2014.08.011
Finkel, Z. V., and Irwin, A. J. (2000). Modelling size-dependent photosynthesis: light absorption and the allometric rule. J. Theor. Biol. 204, 361–369. doi: 10.1006/jtbi.2000.2020
Finkel, Z. V., Beardall, J., Flynn, K. J., Quigg, A., Rees, T. A. V., and Raven, J. A. (2010). Phytoplankton in a changing world: cell size and elemental stoichiometry. J. Plankt. Res. 32, 119–137. doi: 10.1093/plankt/fbp098
Friedrichs, M. A. M., Carr, M.-E., Barber, R. T., Scardi, M., Antoine, D., Armstrong, R. A., et al. (2009). Assessing the uncertainties of model estimates of primary productivity in the tropical Pacific Ocean. J. Mar. Syst. 76, 113–133. doi: 10.1016/j.jmarsys.2008.05.010
Geider, R. J., MacIntyre, H. L., and Kana, T. M. (1997). Dynamic model of phytoplankton growth and acclimation: responses of the balanced growth rate and the chlorophyll a:carbon ratio to light, nutrien-limitation and temperature. Mar. Ecol. Progr. Ser. 148, 187–200. doi: 10.3354/meps148187
Geider, R. J., MacIntyre, H. L., and Kana, T. M. (1998). A dynamic regulatory model of phytoplanktonic acclimation to light, nutrients, and temperature. Limnol. Oceanogr. 43, 679–694. doi: 10.4319/lo.1998.43.4.0679
Geider, R. J., Platt, T., and Raven, J. A. (1986). Size dependence of growth and photosynthesis in diatoms. Mar. Ecol. Progr. Ser. 30, 93–104. doi: 10.3354/meps030093
Gibb, S. W., Barlow, R. G., Cummings, D. G., Rees, N. W., Trees, C. C., Holligan, P., et al. (2000). Surface phytoplankton pigment distributions in the Atlantic Ocean: an assessment of basin scale variability between 50 degrees N and 50 degrees S. Progr. Oceanogr. 45, 339–368. doi: 10.1016/S0079-6611(00)00007-0
Gibb, S. W., Cummings, D. G., Irigoien, X., Barlow, R. G., Fauzi, R., and Mantoura, C. (2001). Phytoplankton pigment chemotaxonomy of the northeastern Atlantic. Deep-Sea Res. II 48, 795–823. doi: 10.1016/S0967-0645(00)00098-9
Head, E. J. H., and Horne, E. P. W. (1993). Pigment transformation and vertical flux in an area of convergence in the north-atlantic. Deep-Sea Res. II. 40, 329–346. doi: 10.1016/0967-0645(93)90020-N
Hirata, T., Aiken, J., Hardman-Mountford, N., Smyth, T.J., and Barlow, R. G. (2008). An absorption model to determine phytoplankton size classes from satellite ocean colour. Remote Sens. Environ. 112, 3153–3159. doi: 10.1016/j.rse.2008.03.011
Holm-Hansen, O., Lorenzen, C. J., Holmes, R. W., and Strickland, J. D. H. (1965). Fluorometric determination of chlorophyll. ICES J. Mar. Sci. 30, 3–15. doi: 10.1093/icesjms/30.1.3
Holm-Hansen, O., and Riemann, B. (1978). Chlorophyll a determination: improvements in methodology. Oikos 30, 438–447. doi: 10.2307/3543338
Hooker, S., Van Heukelem, L., Thomas, C. S., Claustre, H., Ras, J., Schluter, L., et al. (2005). “The Second SeaWiFS HPLC Analysis Round-Robin Experiment (SeaHARRE-2),” in NASA/TM-2005-212785 NASA Goddard Space Flight Center. Greenbelt, MD, 112.
Howarth, R. W., Marino, R., and Cole, J. J. (1988). Nitrogen fixation in fresh water, estuarine, and marine ecosystems. 2. Biogeochemical controls. Limnol. Oceanogr. 33, 688–701.
Huete-Ortega, M., Cermeño, P., Calvo-Diaz, A., and Mara-on, E. (2012). Isometric size-scaling of metabolic rate and the size abundance distribution of phytoplankton. Proc. R. Soc. B 279, 1815–1823. doi: 10.1098/rspb.2011.2257
Huot, Y., Babin, M., and Bruyant, F. (2013). Photosynthetic parameters in the Beaufort Sea in relation to the phytoplankton community structure. Biogeoscience 10, 3445–3454. doi: 10.5194/bg-10-3445-2013
Huot, Y., Babin, M., Bruyant, F., Grob, C., Twardowski, M. S., and Claustre, H. (2007). Relationship between photosynthetic parameters and different proxies of phytoplankton biomass in the subtropical ocean. Biogeoscience 4, 853–868. doi: 10.5194/bg-4-853-2007
Irigoen, X., Flynn, K. J., and Harris, R. P. (2005). Phytoplankton blooms: A ‘loophole’ in microzooplankton grazing impact? J. Plankt. Res. 27, 313–321. doi: 10.1093/plankt/fbi011
Jackett, D. R., McDougall, T. J., Feistel, R., Wright, D. G., and Griffies, S. M. (2006). Algorithms for density, potential temperature, conservative temperature, and the freezing temperature of seawater. J. Atm. Ocean. Tech. 23, 1709–1728. doi: 10.1175/JTECH1946.1
Jassby, A. D., and Platt, T. (1976). Mathematical formulation of relationship between photosynthesis and light for phytoplankton. Limnol. Oceanogr. 21, 540–547. doi: 10.4319/lo.1976.21.4.0540
Kamykowski, D., Zentara, S. J., Morrison, J. M., and Switzer, A. C. (2002). Dynamic global patterns of nitrate, phosphate, silicate, and iron availability and phytoplankton community composition from remote sensing data. Glob. Biogeochem. Cycles 16, 25-1–25-29. doi: 10.1029/2001GB001640
Kiørboe, T. (1993). Turbulence, phytoplankton cell size, and the structure of pelagic food webs. Adv. Mar. Bio. 29, 1–72. doi: 10.1016/S0065-2881(08)60129-7
Kirkwood, D. S. (1989). “Simultaneous determination of selected nutrients in seawater,” in International Council Exploration of the Sea (ICES) CM (Copenhagen), 29.
Kishino, M., Takahashi, M., and Ichimura, S. (1985). Estimation of the spectral absorption coefficients of phytoplankton in the sea. Bull. Mar. Sci. 37, 634–642.
Kyewalyanga, M. N., Platt, T., and Sathyendranath, S. (1997). Estimation of the photosynthetic action spectrum: implication for primary production models. Mar. Ecol. Prog. Ser. 146, 207–223.
Laws, E. A. (1975). The importance of respiration losses in controlling the size distribution of marine phytoplankton. Ecology 56, 419-426.
Lavaud, J., Strzepek, R. F., and Kroth, P. G. (2007). Photoprotection capacity differs among diatoms: possible consequences on the spatial distribution of diatoms related to fluctuations in the underwater light climate. Limnol. Oceangr. 52, 1188–1194. doi: 10.4319/lo.2007.52.3.1188
Le Quéré, C., Harrison, S. P., Prentice, I. C., Buitenhuis, E. T., Aumont, O., Bopp, L., et al. (2005). Ecosystem dynamics based on plankton functional types for global ocean biogeochemistry models. Glob. Change Biol. 11, 2016–2040. doi: 10.1111/j.1365-2486.2005.1004.x
Legendre, L., and Rassoulzadegan, F. (1995). Plankton and nutrient dynamics in marine waters. Ophelia 41, 153–172. doi: 10.1080/00785236.1995.10422042
Letelier, R. M., Bidigare, R. R., Hebel, D. V., Ondrusek, M., Winn, C. D., and Karl, D. M. (1993). Temporal variability of phytoplankton community structure-based on pigment analysis. Limnol. Oceanogr. 38, 1420–1437. doi: 10.4319/lo.1993.38.7.1420
Levitus, S., Locarnini, R. A., Boyer, T. P., Mishonov, A. V., Antonov, J. I., Garcia, H. E., et al. (2009). World Ocean Atlas 2009. Vancouver, BC.
Lichtman, E., Tezanos Pinto, P. D., Klausmeier, C. A., Thomas, M. K., and Yoshiyama, K. (2010). Linking traits to species diversity and community structure in phytoplankton. Hydrobiology 653, 15–28. doi: 10.1007/s10750-010-0341-5
Lichtman, E., and Klausmeier, C. A. (2008). Trait based community ecology of phytoplankton. Annu. Rev. Ecol. Evol. Syst. 39, 615–639. doi: 10.1146/annurev.ecolsys.39.110707.173549
MacIntyre, H. L., Kana, T. M., Anning, T., and Geider, R. J. (2002). Photoacclimation of photosynthesis irradiance response curves and photosynthetic pigments in microalgae and cyanobacteria. J. Phycol. 38, 17–38. doi: 10.1046/j.1529-8817.2002.00094.x
Mackey, K. R. M., Hunter, D., Fischer, E. V., Jiang, Y. L., Allen, B., Chen, Y., et al. (2013). Aerosol nutrient induced picoplankton growth in Lake Tahoe. J. Geophys. Res. Biogeosci. 118, 1054–1067. doi: 10.1002/jgrg.20084
Mackey, M. D., Mackey, D. J., Higgins, H. W., and Wright, S. W. (1996). CHEMTAX - A program for estimating class abundances from chemical markers: application to HPLC measurements of phytoplankton. Mar. Ecol. Prog. Ser. 144, 265–283. doi: 10.3354/meps144265
Malone, T. C. (1977). Light-saturated photosynthesis by phytoplankton size fractions in the New York bight, USA. Mar. Biol. 42, 281–292.
Marañon, E., and Holligan, P. M. (1999). Photosynthetic parameters of phytoplankton from 50 degrees N to 50 degrees S in the Atlantic Ocean. Mar. Ecol. Prog. Ser. 176, 191–203. doi: 10.3354/meps176191
Marañon, E., Cermeño, P., Latasa, M., and Tadonleke, R. D. (2012). Temperature, resources, and phytoplankton size structure in the ocean. Limnol. Oceanogr. 57, 1266–1278. doi: 10.4319/lo.2012.57.5.1266
Marañon, E., Cermeño, P., Rodriguez, J., Zubkov, M., and Harris, R. (2007). Scaling of phytoplankton photosynthesis and cell size in the ocean. Limnol. Oceanogr. 52 2190–2198. doi: 10.4319/lo.2007.52.5.2190
Marañon, E., Holligan, P. M., Barciela, R., Gonzalez, N., Mourino, B., Pazo, M. J., et al. (2001). Patterns of phytoplankton size structure and productivity in contrasting open-ocean environments. Mar. Ecol. Progr. Ser. 216, 43–56. doi: 10.3354/meps216043
Margalef, R. (1978). Life forms of phytoplankton as survival alternatives in an unstable environment. Oceanol. Acta 1, 493–509.
Morel, A., and Bricaud, A. (1981). Theoretical results concerning light-absorption in a discrete medium, and application to specific absorption of phytoplankton. Deep Sea Res. I 28, 1375–1393. doi: 10.1016/0198-0149(81)90039-X
Munk, W. H., and Riley, G. A. (1974). Absorption of nutrients by aquatic plants. J. Mar. Res. 11:215.
Murphy, J., and Ryley, J. B. (1962). A modified single solution method for determination of phosphate in natural waters. Anal. Chim. Acta 27, 31–36. doi: 10.1016/S0003-2670(00)88444-5
Nair, A., Sathyendranath, S., Platt, T., Morales, J., Stuart, V., Forget, M. H., et al. (2008). Remote sensing of phytoplankton functional types. Remote Sens. Env. 112, 3366–3375. doi: 10.1016/j.rse.2008.01.021
Neveux, J., and Lantoine, F. (1993). Spectrofluorometric assays of chlorophylls and phaeopigments using the least squares approximation technique. Deep Sea Res. I 40, 1747–1765.
Niklas, K. J., and Enquist, B. J. (2001). Invariant scaling relationships for interspecific plant biomass production rates and body size. Proc. Natl. Acad. Sci. U.S.A. 98, 2922–2927. doi: 10.1073/pnas.041590298
Not, F., Latasa, M., Marie, D., Cariou, T., Vaulot, D., and Simon, N. (2004). A single species, Micromonas pusilla (Prasinophyceae), dominates the eukaryotic picoplankton in the western English channel. Appl. Env. Microbiol. 70, 4064–4072. doi: 10.1128/AEM.70.7.4064-4072.2004
Paasche, E. (1967). Marine plankton algae grown with light-dark cycles. I. Coccolithus huxleyi. Physiol. Plant. 20, 946–956.
Paasche, E. (1968). Marine plankton algae grown with light-dark cycles. II. Ditylum brightwelli and Nitzschia turgidula. Physiol. Plant. 21, 66–77.
Pahlow, M., Riebesell, U., and Wolf-Gladrow, D. A. (1997). Impact of cell shape and chain formation on nutrient acquisition by marine diatoms. Limnol. Oceanogr. 42, 1660–1672. doi: 10.4319/lo.1997.42.8.1660
Peters, R. H. (1983). The Ecological Implications of Body Size. Cambridge: Cambridge University Press.
Platt, T. (1985). Structure of the marine ecosystem: its allometric basis. Can. Bull. Fish. Aquatic Sci. 213, 55–64.
Platt, T., and Sathyendranath, S. (1988). Oceanic primary production - estimation by remote-sensing at local and regional scales. Science 241, 1613–1620. doi: 10.1126/science.241.4873.1613
Platt, T., Bouman, H., Devred, E., Fuentes-Yaco, C., and Sathyendranath, S. (2005). Physical forcing and phytoplankton distributions. Sci. Mar. 69, 55–73. doi: 10.3989/scimar.2005.69s155
Platt, T., Broomhead, D. S., Sathyendranath, S., Edwards, A. M., and Murphy, E. J. (2003). Phytoplankton biomass and residual nitrate in the pelagic ecosystem. Proc. Royal Soc. London Ser. A. Math. Physical Eng. Sci. 459, 1063–1073. doi: 10.1098/rspa.2002.1079
Platt, T., Gallegos, C. L., and Harrison, W. G. (1980). Photoinhibition of photosynthesis in natural assemblages of marine-phytoplankton. J. Mar. Res. 38, 687–701.
Platt, T., Harrison, W. G., Irwin, B., Horne, E. P., and Gallegos, C. L. (1982). Photosynthesis and photoadaptation of marine-phytoplankton in the arctic. Deep Sea Res. I 29, 1159–1170. doi: 10.1016/0198-0149(82)90087-5
Platt, T., Sathyendranath, S., and Longhurst, A. (1995). Remote-Sensing of primary production in the ocean - promise and fulfillment. Philos. Trans. R. Soc. Lond. B. Biol. Sci. 348, 191–201. doi: 10.1098/rstb.1995.0061
Platt, T., Sathyendranath, S., Caverhill, C. M., and Lewis, M. R. (1988). Ocean primary production and available light - further algorithms for remote-sensing. Deep Sea Res. I 35, 855–879. doi: 10.1016/0198-0149(88)90064-7
Platt, T., Sathyendranath, S., Ulloa, O., Harrison, W. G., Hoepffner, N., and Goes, J. (1992). Nutrient control of phytoplankton photosynthesis in the western North-Atlantic. Nature 356, 229–231. doi: 10.1038/356229a,0
R Core Team (2015). R: A Language and Environment for Statistical Computing. R Foundation for Statistical Computing, Vienna. Available online at: http://www.R-project.org/
Raven, J. A. (1986). Physiological consequences of extremely small size for autotrophic organisms in the sea. Can. Bull. Fish. Aquat. Sci. 214, 1–70.
Raven, J. A. (2011). The cost of photoinhibition. Physiol. Planta. 142, 87–104. doi: 10.1111/j.1399-3054.2011.01465.x
Raven, J. A., and Geider, R. J. (1988). Temperature and Algal Growth. New Phytol. 110, 441–461. doi: 10.1111/j.1469-8137.1988.tb00282.x
Raven, J. A., Finkel, Z. V., and Irwin, A. J. (2005). Picophytoplankton: bottom-up and top-down controls on ecology and evolution. Vie Milieu Life Environ. 55, 209–215.
Riegman, R., Kuipers, B. R., Noordeloos, A. A. M., and Witte, H. J. (1993). Size-differential control of phytoplankton and the structure of plankton communities. Neth. J. Sea Res. 31, 255–265. doi: 10.1016/0077-7579(93)90026-O
Roy, S., Sathyendranath, S., and Platt, T. (2011). Retrieval of phytoplankton size from bio-optical measurements: theory and applications. J. R. Soc. Interface 8, 650–660. doi: 10.1098/rsif.2010.0503
Saba, V. S., Friedrichs, M. A. M., Carr, M.-E., Antoine, D., Armstrong, R. A., Asanuma, I., et al. (2010). Challenges of modeling depth-integrated marine primary productivity over multiple decades: a case study at BATS and HOT. Global Biogeochem. Cycles 24:GB3020. doi: 10.1029/2009GB003655
Sathyendranath, S., Cota, G., Stuart, V., Maass, H., and Platt, T. (2001). Remote sensing of phytoplankton pigments: a comparison of empirical and theoretical approaches. Int. J. Remote Sens. 22, 249–273. doi: 10.1080/014311601449925
Sathyendranath, S., Platt, T., Horne, E. P. W., Harrison, W. G., Ulloa, O., Outerbridge, R., et al. (1991). Estimation of New Production in the Ocean by Compound Remote- Sensing. Nature 353, 129–133. doi: 10.1038/353129a0
Sathyendranath, S., Stuart, V., Nair, A., Oka, K., Nakane, T., Bouman, H., et al. (2009). Carbon-to-chlorophyll ratio and growth rate of phytoplankton in the sea. Mar. Ecol. Progr. Ser. 383, 73–84. doi: 10.3354/meps07998
Saux-Picart, S., Sathyendranath, S., Dowell, M., Moore, T., and Platt, T. (2014). Remote sensing of assimilation number for marine phytoplankton. Remote Sens. Env. 146, 87–96. doi: 10.1016/j.rse.2013.10.032
Schanz, F., Senn, P., and Dubinsky, Z. (1997). Light absorption by phytoplankton and the vertical light attenuation: ecological and physiological significance. Oceanogr. Mar. Bio. 35, 71–96.
Smayda, T. J. (1970). The suspension and sinking of phytoplankton in the sea. Oceanogr. Mar. Bio. Ann. Rev. 8, 353–414.
Smyth, T. J., Tilstone, G. H., and Groom, S. B. (2005). Integration of radiative transfer into satellite models of ocean primary production. J. Geophys. Res. Oceans 110:C10014. doi: 10.1029/2004JC002784
Sosik, H. M. (1996). Bio-optical modeling of primary production: consequences of variability in quantum yield and specific absorption. Mar. Ecol. Progr. Ser. 143, 225–238. doi: 10.3354/meps143225
Sosik, H. M., and Mitchell, B. G. (1994). Effects of temperature on growth, light-absorption, and quantum yield in Dunaliella-Tertiolecta (Chlorophyceae). J. Phycol. 30, 833–840. doi: 10.1111/j.0022-3646.1994.00833.x
Sournia, A. (1982). Form and function in marine-phytoplankton. Biol. Rev. Cam. Philos. Soc. 57, 347–394. doi: 10.1111/j.1469-185X.1982.tb00702.x
Strain, P. M., and Clement, P. M. (1996). Nutrient and dissolved oxygen concentrations in the Letang Inlet, New Brunswick, in the summer of 1994. Can. Data Rept. 587, xi+63.
Stuart, V., Sathyendranath, S., Head, E. J. H., Platt, T., Irwin, B., and Maass, H. (2000). Bio-optical characteristics of diatom and prymnesiophyte populations in the Labrador Sea. Mar. Ecol. Progr. Ser. 201, 91–106. doi: 10.3354/meps201091
Thomas, M. K., Kremer, C. T., Klausmeier, C. A., and Litchman, E. (2012). A global pattern of thermal adaptation in marine phytoplankton. Science. 338, 1085–1088. doi: 10.1126/science.1224836
Tilstone, G. H., Figueiras, F. G., Lorenzo, L. M., and Arbones, B. (2003). Phytoplankton composition, photosynthesis and primary production during different hydrographic conditions at the Northwest Iberian upwelling system. Mar. Ecol. Progr. Ser. 254, 313–313. doi: 10.3354/meps252089
Tilstone, G. H., Lange, P., Misra, A., Brewin, R., and Cain, T. (2017). Micro-phytoplankton photosynthesis, primary production and potential export production in the Atlantic Ocean. Progr. Oceanogr. 158, 109–129. doi: 10.1016/j.pocean.2017.01.006
Tilstone, G. H., Smyth, T. J., Poulton, A., and Hutson, R. (2009). Measured and remotely sensed estimates of primary production in the Atlantic Ocean from 1998 to 2005. Deep Sea Res. II 56, 918–930. doi: 10.1016/j.dsr2.2008.10.034
Uitz, J., Claustre, H., Morel, A., and Hooker, S. B. (2006). Vertical distribution of phytoplankton communities in open ocean: an assessment based on surface chlorophyll. J. Geophys. Res. Oceans. 111:C08005. doi: 10.1029/2005JC003207
Uitz, J., Huot, Y., Bruyant, F., Babin, M., and Claustre, H. (2008). Relating phytoplankton photophysiological properties to community structure on large scales. Limnol. Oceanogr. 53, 614–630. doi: 10.4319/lo.2008.53.2.0614
Uitz, J., Stramski, D., Gentili, B., D'Ortenzio, F., and Claustre, H. (2012). Estimates of phytoplankton class-specific and total primary production in the Mediterranean Sea from satellite ocean color observations. Global Biogeochem. Cycles 26:GB2024. doi: 10.1029/2011GB004055
Van den Meersche, K., Soetaert, K., and Middelburg, J. J. (2008). A Bayesian compositional estimator for microbial taxonomy based on biomarkers. Limnol. Oceanogr. Methods 6, 190–199. doi: 10.4319/lom.2008.6.190
Vidussi, F., Claustre, H., Manca, B. B., Luchetta, A., and Marty, J. C. (2001). Phytoplankton pigment distribution in relation to upper thermocline circulation in the eastern Mediterranean Sea during winter. J. Geophys. Res. Oceans 106, 19939–19956. doi: 10.1029/1999JC000308
Welschmeyer, N. A. (1994). Fluorometric analysis of chlorophyll-a in the presence of chlorophyll-B and pheopigments. Limnol. Oceanogr. 39, 1985–1992. doi: 10.4319/lo.1994.39.8.1985
Westberry, T., Behrenfeld, M. J., Siegel, D. A., and Boss, E. (2008). Carbon-based primary productivity modeling with vertically resolved photoacclimation. Global Biogeochem. Cycles 22:GB2024. doi: 10.1029/2007GB003078
Wood, E. P. K., Armstrong, F. A. J., and Richards, F. A. (1967). Determination of nitrate in seawater by cadmium copper reduction to nitrite. J. Mar. Bio. Assoc. 47, 23–31. doi: 10.1017/S002531540003352X
Wright, S. W., van den Enden, R. L., Pearce, I., Davidson, A. T., Scott, F. J., and Westwood, K. J. (2010). Phytoplankton community structure and stocks in the Southern Ocean (30-80 degrees E) determined by CHEMTAX analysis of HPLC pigment signatures. Deep Sea Res. II 57, 758–778. doi: 10.1016/j.dsr2.2009.06.015
Yentsch, C. S., and Menzel, D. W. (1963). A method for the determination of phytoplankton chlorophyll and phaeophytin by fluorescence. Deep Sea Res. I., 10, 221–231. doi: 10.1016/0011-7471(63)90358-9
Keywords: Atlantic Ocean, phytoplankton size, photosynthesis parameters, primary production, temperature
Citation: Robinson A, Bouman HA, Tilstone GH and Sathyendranath S (2018) Size Class Dependent Relationships between Temperature and Phytoplankton Photosynthesis-Irradiance Parameters in the Atlantic Ocean. Front. Mar. Sci. 4:435. doi: 10.3389/fmars.2017.00435
Received: 30 May 2017; Accepted: 15 December 2017;
Published: 10 January 2018.
Edited by:
Chris Bowler, École Normale Supérieure, Université de Sciences Lettres de Paris, FranceReviewed by:
Thomas Lacour, UMI3376 TAKUVIK, CanadaSakina-Dorothée Ayata, University Pierre and Marie Curie-Paris 6, France
Copyright © 2018 Robinson, Bouman, Tilstone and Sathyendranath. This is an open-access article distributed under the terms of the Creative Commons Attribution License (CC BY). The use, distribution or reproduction in other forums is permitted, provided the original author(s) or licensor are credited and that the original publication in this journal is cited, in accordance with accepted academic practice. No use, distribution or reproduction is permitted which does not comply with these terms.
*Correspondence: Gavin H. Tilstone, Z2h0aUBwbWwuYWMudWs=
†Present Address: Alex Robinson, Centre for Ecology and Hydrology, Wallingford, United Kingdom