 Stephen D. Archer1*
 Kerstin Suffrian1
 Kevin M. Posman1
 Lennart T. Bach2
 Patricia A. Matrai1
 Peter D. Countway1
 Andrea Ludwig2
 Ulf Riebesell2
- 1Bigelow Laboratory for Ocean Sciences, Boothbay, ME, United States
- 2GEOMAR Helmholtz Centre for Ocean Research Kiel, Kiel, Germany
Long-term time series data show that ocean acidification is occurring in the subtropical oceans. As a component of an in situ mesocosm experiment carried out off Gran Canaria in the subtropical North Atlantic, we examined the influence of ocean acidification on the net production of dimethylsulfide (DMS). Over 23 days under oligotrophic conditions, time-integrated DMS concentrations showed an inverse relationship of −0.21 ± 0.02 nmol DMS nmol−1 H+ across the gradient of H+ concentration of 8.8–23.3 nmol l−1, equivalent to a range of pCO2 of 400–1,252 atm. Proportionally similar decreases in the concentrations of both dissolved and particulate dimethylsulfoniopropionate (DMSP) were observed in relation to increasing H+ concentration between the mesocosms. The reduced net production of DMSP with increased acidity appeared to result from a decrease in abundance of a DMSP-rich nanophytoplankton population. A 35S-DMSP tracer approach was used to determine rates of dissolved DMSP catabolism, including DMS production, across the mesocosm treatments. Over a phase of increasing DMS concentrations during the experiment, the specific rates of DMS production were significantly reduced at elevated H+ concentration. These rates were closely correlated to the rates of net DMS production indicating that transformation of dissolved DMSP to DMS by bacteria was a major component of DMS production. It was not possible to resolve whether catabolism of DMSP was directly influenced by H+ concentrations or was an indirect response in the bacterial community composition associated with reduced DMSP availability. There is a pressing need to understand how subtropical planktonic communities respond to the predicted gradual prolonged ocean acidification, as alterations in the emission of DMS from the vast subtropical oceans could influence atmospheric chemistry and potentially climate, over a large proportion of the Earth's surface.
Introduction
Recent estimates of the net flux of dimethyl sulfide (DMS) from the oceans of 20–28 Tg S yr−1 (Lana et al., 2011; Wang et al., 2015) represent the largest natural source of sulfur to the atmosphere. This has a substantial impact on atmospheric chemistry (Toumi, 1994; Johnson and Bell, 2008; Chen and Jang, 2012). In the atmosphere, DMS is oxidized primarily to sulfur dioxide, sulfuric acid and to methanesulfonic acid (MSA). Sulfuric acid is responsible for new aerosol particles and cloud condensation nuclei (Sipilä et al., 2010; Kirkby et al., 2011), while MSA often makes a major contribution to the growth of existing aerosols (Rinaldi et al., 2010). Hence, DMS emissions contribute to a reduction in radiative forcing through both a direct aerosol effect and an indirect affect from cloud reflectivity (Haywood and Boucher, 2000; Lohmann and Feichter, 2005). Natural sources of aerosols, particularly DMS and sulfur emission from volcanoes, represent major uncertainties in understanding the controls on aerosol-mediated reductions in radiative forcing, including the role of anthropogenically-derived aerosols (Carslaw et al., 2013). Improved understanding of what causes variations in the DMS source would therefore, potentially improve estimates of the sensitivity of the climate to anthropogenic greenhouse gas emissions.
DMS is a product primarily of marine microbial planktonic communities. The precursor to DMS, dimethylsulfoniopropionate (DMSP), mainly synthesized by microalgae, is transformed to dissolved DMS or DMSP, through active exudation, cell lysis during senescence, viral lysis and grazing by microzooplankton and mesozooplankton (reviewed in Stefels et al., 2007). Once in the dissolved phase, bacteria are thought to play the major role in degrading DMSP in the oceans. Radiolabelled tracer studies have shown that pelagic bacteria generally either cleave DMSP, generating DMS, or demethylate/demethiolate DMSP to methylmercaptopropionate and methanethiol (Kiene et al., 2000). The relative magnitude of these catabolic pathways determines the DMS yield from dissolved DMSP consumption, which has been hypothesized to be a product of the sulfur demand of the bacteria (Kiene et al., 2000). Due to photochemical and biological consumption of DMS, only 2–10% of DMS production is emitted to the atmosphere (Bates et al., 1994; Archer et al., 2002). The fate of biologically transformed DMS is poorly understood but the most likely products in the pelagic environment are dimethylsulfoxide (DMSO) and sulfate (Kiene and Linn, 2000a; Vila-Costa et al., 2006; del Valle et al., 2007). One possibility is that DMS metabolism is routed through thiosulfate or tetrathionate (Boden et al., 2010), which is rapidly consumed to produce sulfate (Reisch et al., 2011).
There is mounting experimental evidence that DMS concentrations, and hence emissions, are likely to alter in response to ocean acidification. This stems, in particular, from a series of pCO2-perturbation experiments in natural seawater mesocosms. A compelling and consistent pattern of decreasing DMS concentrations with increased pCO2 and associated proton concentrations [H+]T [H+] in Norwegian coastal waters (Hopkins et al., 2010; Avgoustidi et al., 2012; Webb et al., 2016b) has also been observed in the Baltic (Webb et al., 2016a), Arctic (Archer et al., 2013), and coastal waters of Korea in early summer (Park et al., 2014). In stark contrast, a comparable study during the winter in the Korean coastal mesocosms resulted in elevated DMS concentrations with increased acidity (Kim et al., 2010). Moreover, limited variation in DMS concentrations between levels of acidity was observed in one of the series of Norwegian mesocosm experiments (Wingenter et al., 2007; Vogt et al., 2008). Less consistent responses of DMS to ocean acidification have been observed in alternative experimental approaches. For instance, a series of microcosm experiments carried out in temperate waters of the north-west European Shelf, generally resulted in increased DMS concentrations in response to acidification (Hopkins and Archer, 2014), while a similar microcosm-based experiment in the Arctic observed decreased DMS concentrations in response to increased acidity in both high and reduced light conditions (Hussherr et al., 2017). There is a clear bias in this experimental evidence to both northern latitudes and coastal waters.
Studies of the impact of ocean acidification on planktonic communities have generally been carried out at higher latitudes because the greater solubility of CO2 in colder waters means anthropogenic increases in atmospheric pCO2 result in more rapid reduction of pH, reduced calcium carbonate saturation states and lower buffering capacity in these regions (Sabine et al., 2004). Nonetheless, ocean acidification is apparent in time series measurements in warmer ocean waters. For instance, the increasing trend in atmospheric pCO2 has resulted in an increased seawater pCO2 of 1.75 ± 0.37 μatm yr−1 at the European Station for Time Series in the Ocean at the Canary Islands (ESTOC) over the period 1995–2004, and of 1.80 ± 0.09 μatm yr−1 at the Bermuda Atlantic Time Series Study (BATS) from 1983 to 2011 (González-Dávila et al., 2010; Bates et al., 2012). Corresponding changes in pH were also recorded at the two sites, of 0.0018 ± 0.0003 units yr−1 at ESTOC and 0.0017 ± 0.0001 units yr−1 at BATS. These changes are equivalent to an increase of ~0.4% yr−1 or 0.0031 nmol yr−1 in [H+]T. Hence, there is a pressing need to understand how planktonic communities of the subtropical and tropical oceans are going to respond to ocean acidification, including how this will influence DMS emissions.
The five subtropical ocean gyres cover approximately 40 % of the Earth's surface and are estimated to take up 0.353 Pg C yr−1 from the atmosphere, representing approximately 31% of the global uptake of atmospheric CO2 by the oceans (Signorini et al., 2015). These regions may make an even larger proportional contribution to the global emission of DMS, with the area between 10 and 30°N and 10–30°S contributing an estimated 41% of the global DMS flux (Lana et al., 2011). At a more regional level, DMS emissions from the vicinity of the Canary Islands influence aerosol composition and chemistry over the tropical North Atlantic. This is apparent in aerosol samples collected at the Cape Verde Atmospheric Observatory, in which the products of DMS oxidation, including MSA, make a significant contribution to the non-sea-salt sulfate content and aerosol mass in air that has passed close to the Canary Islands and Mauritanian upwelling region (Müller et al., 2010; Fomba et al., 2014).
A key objective of this study was to extend the latitudinal range of mesocosm experiments that have examined the DMS response to ocean acidification, to waters representative of the subtropical ocean gyres. The study examines the level and direction of response of the net production of DMS, DMSP and DMSO in oligotrophic waters of the subtropical North Atlantic, with an emphasis on improving our understanding of the mechanisms underlying the DMS response. In order to determine what may alter the sources of DMS in response to acidification, we also examined the link between changes in DMSP concentrations and the composition of the phytoplankton community. In addition, a radiolabelled tracer approach was used to determine how the catabolism of dissolved DMSP, including enzyme cleavage to DMS, responded to ocean acidification. The study identifies key mechanisms that may influence DMS concentrations in an increasingly acidifying ocean, providing new insights into the causes of decreasing DMS concentrations that have been observed in previous ocean acidification mesocosm experiments.
Materials and Methods
Experimental Set-Up
The mesocosm experiment was conducted in Gando Bay, on the east coast of Gran Canaria (27° 55′ 41″ N, 15° 21′ 55″ W) in the subtropical North Atlantic. Sample processing, analysis and further experiments were conducted in the laboratories of Plataforma Oceánica de Canarias (PLOCAN), Gran Canaria. The full experiment took place from 23rd September to 25th November 2014. The 1st October, the day of the first CO2 manipulation, was defined as t0. Routine sampling was conducted every second day, starting on t-3.
The design and deployment of the Kiel Off-Shore Mesocosms for future Ocean Simulations (KOSMOS) facility has previously been described in detail (Riebesell et al., 2013). The design, implementation and progression of this particular in situ mesocosm experiment are described by Taucher et al. (2017). Briefly, the set up consisted of nine cylindrical transparent thermoplastic polyurethane (TPU) enclosures, supported by a floating frame, and loosely covered by a polyvinyl (PVC) hood. Once deployed on t-8, the open cylinders were allowed to fill with ~32–38 m3 of natural seawater screened through a 3 mm mesh. Seawater was allowed to flush through the cylinders for ~4 days in order to capture a representative and similar plankton community in each enclosure. On t-4 the cylinders were sealed at the bottom by attachment of sediment traps. Hoods were installed and the tops of the mesocosms were lifted to a height of ~1.5 m above the sea surface to separate the enclosed water from the surrounding waters. During the experiment, the insides of the enclosures were cleaned with a cleaning ring on three occasions (t4, t10, t20) to minimize the build-up of a biofilm (Taucher et al., 2017).
Manipulation of Carbonate Chemistry
In order to generate a gradient in carbonate chemistry that mimicked potential future levels of ocean acidification, seven of the mesocosms had different volumes of 50 μm-filtered Atlantic seawater saturated with CO2 added to them in four additions between t0 and t6 (Taucher et al., 2017; Table 1). Filtered seawater that was not enriched with CO2 was added to two of the mesocosms that remained at ambient pCO2 levels, in order to replicate any physical disturbance applied during the CO2-rich seawater additions. On each sampling day, total alkalinity (TA) was measured using a potentiometric titration approach and dissolved inorganic carbon (DIC) by infrared absorption (Taucher et al., 2017). Proton concentrations [H+]T based on the total scale (pHT) were calculated from TA and DIC in CO2SYS (Pierrot et al., 2006) using the carbonate dissociation constants K1 and K2 of Lueker et al. (2000).
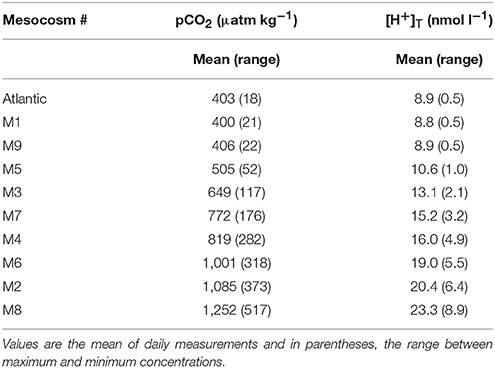
Table 1. Seawater pCO2 and corresponding [H+]T for each mesocosm (M) and the surrounding Atlantic water over the duration of the experimental period (t5–t23).
Sampling
A 5 l depth-integrating water sampler (IWS, Hydrobios, Kiel, Germany) was used to collect an integrated sample from ~13 to 0 m from each mesocosm and the adjacent Atlantic Ocean in the morning of every sampling day. It should be noted that in contrast to the mesocosms, there is limited temporal continuity in the Atlantic water sampled from the vicinity of the mesocosm experiment. Samples for chemical analysis and rate measurements were subsampled from the IWS into biological oxygen demand (BOD) bottles using a standardized gas sampling protocol. Samples were transported and stored in the dark and at ambient seawater temperature in cool boxes until analysis. The strategy for processing samples is illustrated in Figure 1.
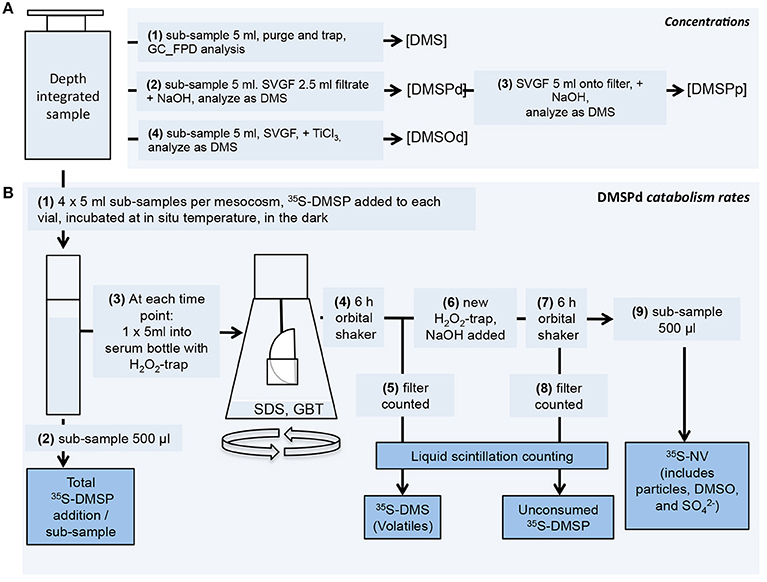
Figure 1. Scheme used to process seawater samples. (A) Concentration measurement procedures for DMS, DMSPd, DMSPp and DMSOd. (B) DMSPd catabolic rate measurement procedures using 35S-labeled DMSP. Further details of the procedures are described in the text.
Quantification of Dimethylated Sulfur Compounds
DMS concentrations were measured using a purge system and cryogenic trap linked to a GC-8A gas chromatograph (Shimadzu, Japan) equipped with a flame photometric detector and sulfur-specific, Chromosil 330 PTFE packed column (Sigma Aldrich). Samples were purged with high purity He in 10 or 20 ml headspace vials at a flow rate of 55–60 ml min−1 for 5 min.
To determine DMS concentrations in seawater ([DMS]), 5 ml of unfiltered seawater was transferred to a 10 ml headspace vial that was capped with a PTFE-coated crimp top and immediately analyzed. Unfiltered samples were used for [DMS] analysis for the entire experiment to minimize processing artifacts; for instance, due to cell disruption during filtration or exposure to the atmosphere. We are aware, however, that current standard procedures generally pre-filter samples to avoid DMS production during the purge and trap process. It is not clear which is the more accurate approach but tests of filtered vs. unfiltered samples generally demonstrated greater precision in unfiltered samples. For instance, triplicate analyses of samples from mesocosm M1 on t-3 gave results for the filtered samples that were ~25% lower with an average (±SD) of 1.00 (±0.12) nmol l−1 vs. unfiltered samples at 1.34 (±0.01) nmol l−1. DMS standards were prepared from 99.9% DMS (Sigma Aldrich) and MQ water.
Dissolved DMSP concentration [DMSPd] was determined by the small volume drip filtration approach (Kiene and Slezak, 2006). A 5 ml sample was allowed to drip filter through a 25 mm GF/F and the first ~3 ml were collected in a glass vial containing 40 μl 50% H2SO4, to fix DMSPd and remove DMS by oxidation. A 2.5 ml subsample was transferred to a 10 ml headspace vial to which 2.5 ml of 1 mol l−1 NaOH was added and immediately crimp-capped in order to hydrolyse the DMSP to DMS. The samples were analyzed as described for DMS.
Particulate DMSP concentrations [DMSPp] were determined using a solid phase micro extraction approach for DMS analysis (Yassaa et al., 2006). The GF/F filters were placed in 10 ml headspace vials with 5 ml 0.5 mol l−1 NaOH and immediately crimp-capped. After ≥6 h, DMS was sampled from the headspace using a 85 μm CAR/PDMS-solid phase micro extraction SPME fiber (Sigma Aldrich). The fibers were allowed to equilibrate in the headspace for 5 min and analyzed on a QP-2010 Ultra gas chromatograph with mass-spectrometric detector (Shimadzu, Japan). Ultra high purity He was used as the carrier gas at a flow rate of 0.85 ml min−1 through a 30 m × 0.32 mm SPB™−1 SULFUR column (Sigma Aldrich). The mass spectrometer was run in selected ion mode (SIM) to focus on the DMS parent ion m/z 62.06 and fragment ion m/z 47.05. Calibration standards were prepared and analyzed in the same manner as the samples using dilutions of the 99.9% DMS standard (Sigma Aldrich).
Quantification of dissolved DMSO [DMSOd] closely followed the protocol of del Valle et al. (2007). Samples for [DMSOd] were also prepared using the small volume drip filtration approach (Kiene and Slezak, 2006). The first 3 ml of filtrate were collected in a 10 ml headspace vial, sparged to eliminate DMS, crimped gastight, and frozen at −20°C. The samples were thawed for ~ 1 h then sparged again before DMSO was reduced to DMS by adding 400 μl of TiCl3 30% in 10% HCl, and incubated at 50°C for 30 min. After cooling to room temperature, samples were analyzed for DMS. A Na2CO3 trap was introduced before the Nafion dryer in the purge and trap system to prevent acid vapors from entering the cryotrap and the gas chromatograph. DMSO standards were prepared from 99.9% DMSO standards (Fisher Scientific).
Rates of DMSPd Consumption and Transformation
Rates of DMSPd catabolism were determined using 35S-DMSP as a tracer (Figure 1; Kiene and Linn, 2000a). The 35S-DMSP was synthesized from L-[35S]-methionine with an initial specific activity of 1,175 Ci mmol−1 (Perkin-Elmer, NEG009C) (Malmstrom et al., 2004). For each mesocosm, three or four discrete 5 ml seawater subsamples were spiked with 35S-DMSP to a final concentration of ≤0.02 nmol l−1, equivalent to an activity of ≤50,000 DPM ml−1. Vials were incubated in the dark at ambient seawater temperature and sequentially sacrificed for analysis over an incubation period of typically ~45 min, but up to 90 min in some cases. For each time point, metabolism of 35S-DMSPd in the vial was stopped by addition of sodium dodecyl sulfate (0.2% final concentration) and glycine betaine (0.01% final concentration). The total amount of added 35S-DMSP was determined from 500 μl subsamples added directly to Ecolume liquid scintillation cocktail (MP Biomedicals). The remaining 4.5 ml of subsample was transferred to a 120 ml serum vial and the volatile 35S products were collected on hanging filter traps impregnated with H2O2. Trapped volatile products were considered to be dominated by 35S-DMS but it is possible that other products, including 35S-methanethiol, were also trapped. The amount of 35S-DMSP remaining in the subsample was then determined by alkaline hydrolysis to 35S-DMS that was collected on a fresh H2O2 trap. The amount of non-volatile (NV) product was calculated from the difference between the total addition, DMS produced and DMSP remaining. Samples were analyzed on a Tri Carb 3100 TR liquid scintillation counter (Perkin Elmer) after overnight stabilization in the Ecolume scintillation cocktail.
Phytoplankton Abundance and Chlorophyll Concentration
Seawater for chlorophyll a measurements was collected from each mesocosm and the Atlantic with a manual vacuum pump system that was lowered steadily through the water column to acquire a depth-integrated sample from 0 to 13 m (see Taucher et al., 2017 for details on the pumping system and sample collection). Subsampled seawater was filtered on glass microfiber filters (Whatman, 0.7 μm nominal pore, Δpressure = 200 mbar) which were put into cryovials and stored at −80°C. Chlorophyll a was extracted in 90% acetone and concentrations determined by means of reverse phase high performance liquid chromatography following Barlow et al. (1997).
Seawater for flow cytometry measurements was subsampled directly from the IWS on board the sampling boats and kept at seawater temperature in a coolbox until analysis about 2–6 h later. Measurements were performed with an Accuri C6 flow cytometer (BD Biosciences) as described in Bach et al. (2017). Briefly, fresh samples were counted for 10 min with the “fast” setting. Volume intake was verified regularly by weighing the samples before and after measurements. Four different populations (picoeukaryotes, nanoeukaryotes, microeukaryotes, and Synechococcus) were distinguished based on their light scatter and fluorescence properties.
Statistical Analysis
Model 1 linear regression was used to determine the response of a variety of measured variables to increased acidity over distinct periods of the mesocosm experiment. The significance of the linear regression was determined by ANOVA. Hydrogen ion equivalent concentration [H+]T is used as the basis to examine the response to ocean acidification, providing a linear scale against which to compare other parameters, as opposed to pH. Alterations in extracellular [H+]T are likely to impact a greater proportion of the physiological processes that occur in heterotrophic and autotrophic microbes than changes in CO2 availability per se (Raven, 2013). However, [H+]T and pCO2 are directly related in this context.
Results
The full KOSMOS GC2 experiment took place over 55 d (Taucher et al., 2017); the results presented here are from Phase I of the experiment that ended on t23, prior to the addition of deepwater to the mesocosms (M). The influence of the deepwater additions on DMS cycling will be presented as a separate study.
Initial Conditions in the Mesocosms
Seawater characteristics were typical of an oligotrophic, subtropical environment. Mean inorganic macronutrient concentrations across all mesocosms during Phase I were 60 nmol l−1 , 160 nmol l−1 , 26 nmol l−1 , and 260 nmol l−1 Si(OH)4. The initial water temperature decreased gradually from 24.5 to 24.0°C and salinity increased from 36.95 to 38.00 during Phase I. There was no evidence, from the salinity and temperature depth profiles, of water column stratification within the mesocosms or the surrounding waters in the Bay of Gando, during this experiment (Taucher et al., 2017). Surface photosynthetically active radiation (PAR) varied on a daily basis, from 40 to 100 mol m−2 d−1, and showed a gradual seasonal decline.
Carbonate Chemistry in the Mesocosms
At the time of closing the mesocosm bags (t-3), the ambient water at the experimental site had a pCO2 of ~380 μatm and [H+]T of 8.9 nmol l−1. Manipulation of the carbonate chemistry in the mesocosms established an initial gradient in pCO2 from ambient levels of ~405 μatm (M1, M9) to ~1,480 μatm in the highest CO2 treatment (M8) and [H+]T of 8.8–27.2 nmol l−1. This manipulation over the course of 7 days equated to an average adjustment of pCO2 of ~140 μatm d−1 or ~2.4 nmol l−1 d−1 in [H+]T in the most acidified treatment. The average values from t5 to t23 are shown in Table 1. Over time, pCO2 and [H+]T declined most rapidly in the highly acidified treatments. In general, the distinction in carbonate chemistry between treatments was maintained throughout Phase I, except in the case of M4 and M7, in which pCO2 and [H+]T converged following t11 (Taucher et al., 2017).
Temporal Trends in Reduced Sulfur Compounds
Initial concentrations of the reduced sulfur compounds were typical of subtropical oceanic waters (Dacey et al., 1998; Lana et al., 2011). At t-3, the average (±SD) for [DMS] was 1.5 ± 0.4 nmol l−1, [DMSPp] was 8.5 ± 2.9 nmol l−1 and [DMSPd] was 2.8 ± 1.1 nmol l−1, among the mesocosms (Figure 2). Measurements of [DMSOd] were not carried out until t1 when they averaged 7.3 ± 1.1 nmol l−1 (Figure 2), comparable to prior observations in open ocean waters (Simó et al., 1997; Hatton et al., 1998).
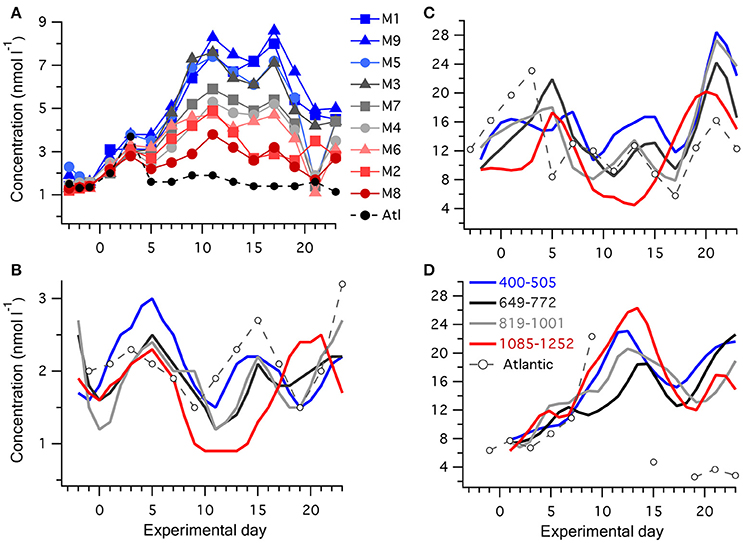
Figure 2. Temporal progression of reduced sulfur compounds in the mesocosms and surrounding Atlantic water: (A) [DMS] in individual mesocosms and surrounding water, with the color scheme depicting increasing [H+]T from blue to gray to red, see Table 1 for details; (B) [DMSPd]; (C) [DMSPp], and (D) [DMSOd]; where the nine mesocosms have been grouped into four levels of carbonate chemistry and the lines depict the average of each group of mesocosms. Concentrations were measured in all mesocosms and the Atlantic on alternate days, except for several days when the DMSOd analysis was not carried out for the Atlantic water.
An initial general increase in [DMS] occurred in all mesocosms, and plateaued on ~t11 (Figure 2A). [DMS] then stabilized until ~t17, followed by relatively rapid decline until t21 (Figure 2A). This was in contrast to the surrounding Atlantic water, in which an initial 3-fold increase in [DMS] by t3 matched the pattern in the mesocosms but then dropped to ~1 nmol l−1 for the remainder of the experiment, presumably as a different water mass passed through the experimental site. In comparison to [DMS], lower relative changes in [DMSPd], and [DMSPp] occurred during Phase I of the experiment. To clearly illustrate the temporal trends in [DMSPp], [DMSPd], and [DMSOd], the mesocosms have been grouped into four levels of carbonate chemistry manipulation (Figures 2B,C). [DMSPp] and [DMSPd] showed similar temporal patterns. Following closure of the mesocosms on t-3, [DMSPp] in general increased to a peak on t5 and then decreased from t5 to t10. Between t10 and t17, a second peak in [DMSPp] and [DMSPd] occurred in the majority of the mesocosms. This was followed by a rapid increase in [DMSPp] to a third peak at t21, at which point values exceeded 30 nmol l−1 in some of the mesocosms (Figure 2C).
The temporal pattern of [DMSOd] had a closer resemblance to the generally increasing trends in [DMS] rather than [DMSPp], with increasing concentrations that reached their highest levels between t10 and t15, declined between t15 and t20, and then increased again following t20 (Figure 2D). The average rate of increase in [DMSOd] between t5 and t11 of 2.0 nmol l−1 d−1 among all the mesocosms exceeded the average for [DMS] of 0.54 nmol l−1 d−1 by approximately 4-fold. The total increase in DMSOd during this period averaged 8.6 nmol l−1 among the mesocosms and was of a similar magnitude to the average decrease in [DMSPp] of 8.4 nmol l−1, suggesting a stoichiometric relationship between DMSPp loss and DMSOd production. However, when examined at the level of individual mesocosms no clear patterns between temporal trends in [DMSOd] and [DMSPp] were apparent.
Relationship Between Acidity and Reduced Sulfur Compounds
Time-averaged [DMS], calculated from all the measurements that were carried out on alternate days between t0 and t23, was significantly decreased at higher [H+]T (Figure 3A, Table 2). This response to increasing acidity began almost immediately following the addition of pCO2-enriched seawater at t0. This is apparent in the slope of the linear regression between [DMS] and [H+]T for individual sampling days, with a significant negative impact of increased acidity apparent at t5 (Figure 3E). The degree of inhibition of net DMS production at higher acidity increased up to t17 and then decreased for the remaining period (Figure 3E).
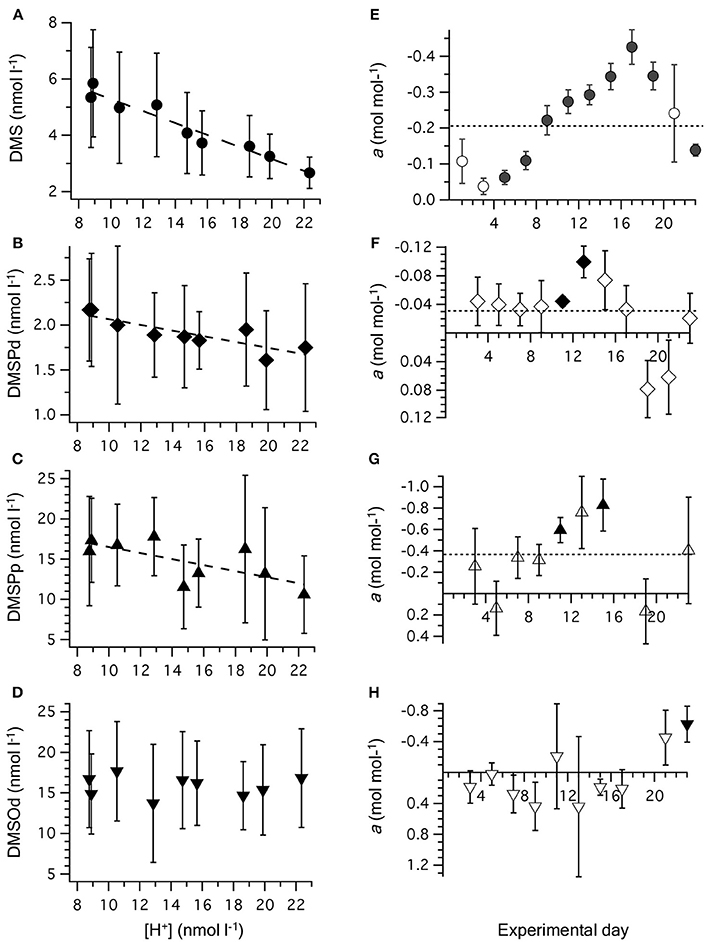
Figure 3. Relationship between [H+]T and concentrations of (A) DMS; (B) DMSPd; (C) DMSPp, and (D) DMSOd. Values are time-averaged from measurements on alternate days from t1 to t23. Error bars are the SD. The equations for the linear regressions are included in Table 2. The slope (±SE) of the linear regression between [H+]T and concentration of reduced sulfur compounds on individual days is shown for: (E) DMS; (F) DMSPd; (G) DMSPp, and (H) DMSOd. Significant regressions (P < 0.05) are shown as bold symbols. The slope from the time-averaged data is shown as a dashed line. Error bars are the SE.
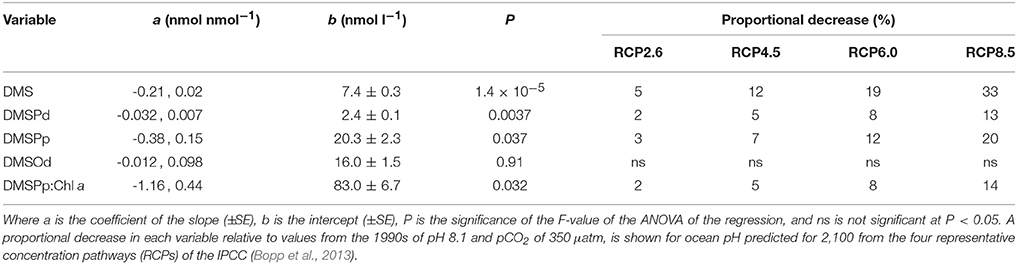
Table 2. Coefficients and levels of significance for the linear regressions of the time-averaged (t5–t23) concentrations (nmol l−1) of DMS, DMSPd, DMSPp, and DMSOd vs. [H+]T (nmol l−1) in the nine mesocosms (Figure 3).
The time-averaged concentrations of both DMSPd and DMSPp between t0 and t23 showed a significant decrease as well in relation to average [H+]T (Figures 3B,C, Table 2). This is also apparent in the results from individual days, although significant regressions between [DMSPd] or [DMSPp] and [H+]T were observed on only 2 days in each case (Figures 3F,G). The level of reduction in concentration with [H+]T was approximately 10-fold lower for DMSPd than DMSPp, reflecting the relative difference in concentrations (Table 2).
In contrast to the other sulfur compounds, [DMSOd] showed no significant relationship to the varied [H+]T in the mesocosms on the basis of time-averaged measurements (Figure 3D, Table 2). A significant reduction in [DMSOd] vs. [H+]T for individual days was only observed at the end of Phase I of the experiment, at t23 (Figure 3H).
Phytoplankton and DMSPp
Chl a concentrations were generally low, starting at an average of 0.17 ± 0.02 μg l−1 on t-1, and gradually increased in all mesocosms to between 0.17 and 0.32 μg l−1 on t23. The three peaks in [DMSPp] (Figure 2C) are apparent in the temporal trends in Chl a concentration (Figure 4A), suggesting that the phytoplankton that synthesized DMSP made up a sizeable component of the total Chl a. The initial DMSP:Chl a ratio among the mesocosms, of 71 ± 12 nmol μg−1 on t-1, increased to 96 ± 22 on t5 and then decreased in all mesocoms to 42 ± 11 on t11 (Figure 4B). Following t11, DMSP:Chl a increased at varying rates in the mesocosms, with a noticeable lag of several days in mesocosms at the highest [H+]T (Figure 4B). By t23, DMSP:Chl a varied from 34 to 130 nmol μg−1 between mesocosms.
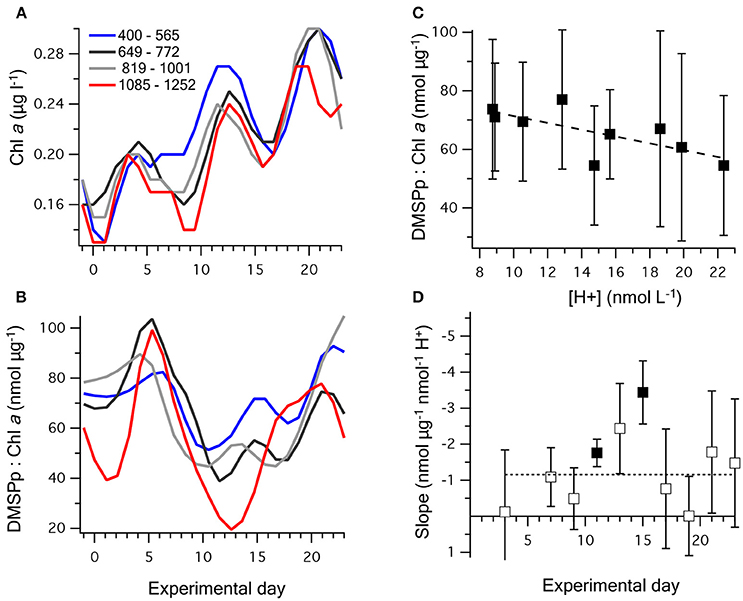
Figure 4. Temporal change in (A) chlorophyll a; and (B) DMSPp:chlorophyll a, where the nine mesocosms have been grouped into four levels of carbonate chemistry. (C) The time-averaged (t5–t23) relationship between [H+]T and DMSPp:chlorophyll a; and (D) the slope (±SE) of the linear regression between [H+]T and DMSPp:chlorophyll a on individual days. Significant values of the linear regression are shown as bold symbols and the dashed line illustrates the time-averaged slope shown in (C). Values for the regression fits are shown in Table 3.
Between t1 and t23, the time-averaged DMSPp:Chl a showed a significant decreasing trend with [H+]T, with the strongest response between t11 and t15 (Figures 4C,D). This trend was largely a product of reduced [DMSPp] at higher acidity (Figure 2), rather than increased Chl a concentration at lower acidity. This indicates that higher acidity caused a decrease in the DMSP-producing components of the planktonic communities or a decrease in cell-specific DMSP production, including during the period when net DMS production was highest from t5 to t11 (Figure 4D).
The contribution of phytoplankton functional groups to the DMSPp pool can be estimated based on cell DMSP content measured directly using flow cytometric sorting of specific phytoplankton groups from the eastern Tropical Atlantic (Archer et al., 2011; Figure 5A). The initial phytoplankton community in the mesocosms was dominated numerically by picophytoplankton, including the cyanobacteria Synechococcus sp. and Prochlorococcus, and picoeukaryote cells. Of these groups, Synechococcus sp. abundance increased fastest, from ~10,000 to >50,000 cells ml−1 by t11 and made up 70–80% of the Chl a during that period (Taucher et al., 2017). Based on the previously measured DMSP content (Archer et al., 2011), the contribution of Synechococcus sp. to DMSPp may have increased to a maximum of ~2 nmol l−1 by t11–t13 and averaged 4–12 % of the total DMSPp over the course of the 23 days (Figure 5A). The picoeukaryote population declined from ~3,000 to < 1,000 cells ml−1 between t0 and t10 and is estimated to have contributed < 0.5 nmol l−1 DMSPp, equivalent to an average of 1–3% of the total DMSPp during the 23 day period (Figure 5A). The largest contribution to total DMSPp was most likely from a nanophytoplankton population of 2–8 μm cells that contributed an estimated average of 62–101 % of the total DMSPp among the mesocosms (Figure 5A). The abundance of the nanophytoplankton populations was closely related to the temporal trends in DMSPp in each mesocosm (Figure 5B). Indeed, [DMSPp] and nanophytoplankton abundance from t1 to t23 were significantly correlated in each of the nine mesocosms (Pearson correlation coefficient, r = 0.62 to 0.87, p-value = 0.0002–0.0305).
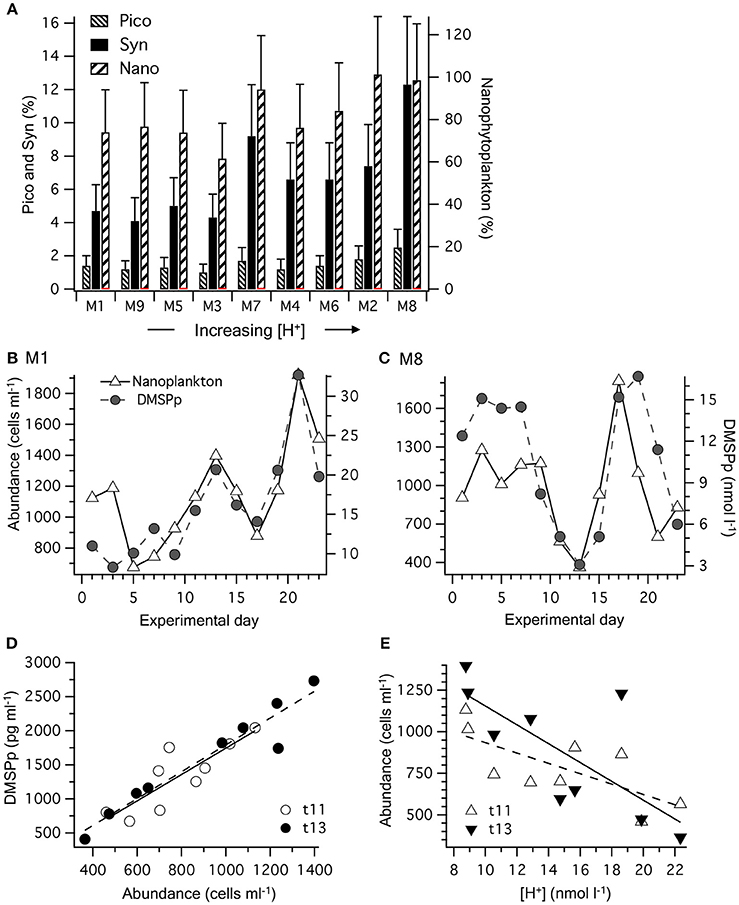
Figure 5. Partition of DMSPp among phytoplankton functional groups: (A) time-averaged contribution to the total DMSPp pool based on values of DMSP cell content in each mesocosm (M) over the 23 days. Values are the average DMSP contribution based on cell-specific estimates from two different stations: Synechococcus spp.: 0.0013–0.0027; picoeukaryotes: 0.006–0.016; nanoeukaryotes: 0.92–1.60 pg DMSP cell−1 (Archer et al., 2011). Error bars show the range. (B) Temporal progression of the nanophytoplankton population and [DMSPp] in M1 that experienced a time-averaged [H+]T of 8.8 nmol L−1; and (C) M8 in which the [H+]T averaged 23.3 nmol l−1. (D) The relationship between nanophytoplankton abundance and [DMSPp] in the nine mesocosms on days t11 and t13. (E) the relationship between nanophytoplankton abundance and [H+]T in the nine mesocosms on days t11 and t13. Values and levels of significance for the linear regressions are given in Table 3.
This close relationship between DMSPp and nanophytoplankton was apparent on a daily basis over the range of [H+]T in the mesocosms (Figure 5D). Significant linear regressions (p-value < 0.05) of [DMSPp] vs. nanophytoplankton abundance across all 9 mesocosms occurred on t11, t13, t15, t21, and t23 and are shown for t11 and t13 (Figure 5D, Table 3). The slopes of the regressions indicate that the DMSP cell content of the nanophytoplankton population were 1.93 ± 0.47 and 1.98 ± 0.21 pg DMSP cell−1 in the mesocosms on t11 and t13, respectively (Figure 5D, Table 3). Similar DMSP cell content of 2.13, 1.41, and 1.82 pg DMSP cell−1 could be derived for t15, t21, and t23, respectively. These estimates of DMSP cell content are at the upper range of the values directly measured in flow cytometrically-sorted natural nanophytoplankton populations (0.92–1.60 pg DMSP cell−1) that are used to determine the group specific contribution to total DMSPp (Figure 5A). Nanophytoplankton abundance also showed a significant inverse relationship to mesocosm [H+]T on t11 and t13 (Figure 5E, Table 3), consistent with significant relationships between [H+]T and DMSPp on those 2 days (Figure 3G, Table 2).
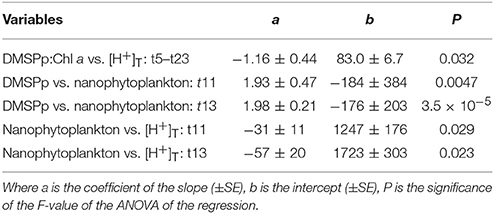
Table 3. Coefficients and levels of significance for the linear regressions of: time-averaged (t5–t23) DMSP:Chl a (nmol μg−1) vs. [H+]T (nmol l−1) (Figure 4); the relationship between DMSPp (pg ml−1) and abundance of nanophytoplankton (cells ml−1) on t11 and t13 (Figure 5D); and the relationship between nanophytoplankton abundance and [H+]T (nmol l−1) on t11 and t13 (Figure 5E).
Microphytoplankton abundance between t5 and t23 was < 100 cells ml−1 in all mesocosms. Even at such low abundance, large DMSP-rich cells may have made a sizeable contribution to the DMSPp pool, but this is difficult to assess from the available information.
Transformation of DMSPd
Measurements of 35S-DMSP transformation were carried out on t5, t9, t11, t13, t21, and t23 for each of the mesocosms and the Atlantic water. Although 35S-DMSP incubations were carried out on t17, an experimental error meant the results could not be interpreted. Examples of the results from 35S-DMSP tracer experiments for M1 during the period from t5 to t11 are illustrated in Figure 6. The rate coefficients for consumption of DMSPd (kDMSPd), production of DMS (kDMS), and conversion to a non-volatile form (kNV) were calculated as the rate of change in the log-transformed fraction of the disintegrations per minute (DPM) for each component relative to the total DPM added to each incubation vial. The corresponding coefficients and rates of DMSPd consumption, DMS production and transformation to non-volatile products are shown in Table 4. At [H+]T close to ambient levels in M1, DMSPd consumption, transformation to non-volatile products, and DMS production increased from t5 to t11, coinciding with increasing [DMS] over this period. Despite a decrease in [DMSPd] over time, the faster turnover of DMSPd and increased yield of DMS meant that production of DMS almost doubled from 0.12 to 0.20 nmol L−1 h−1 from t5 to t11 (Table 4). The major part of the DMSPd pool was converted to non-volatile products, presumably including and assimilation by bacteria (Kiene and Linn, 2000a).
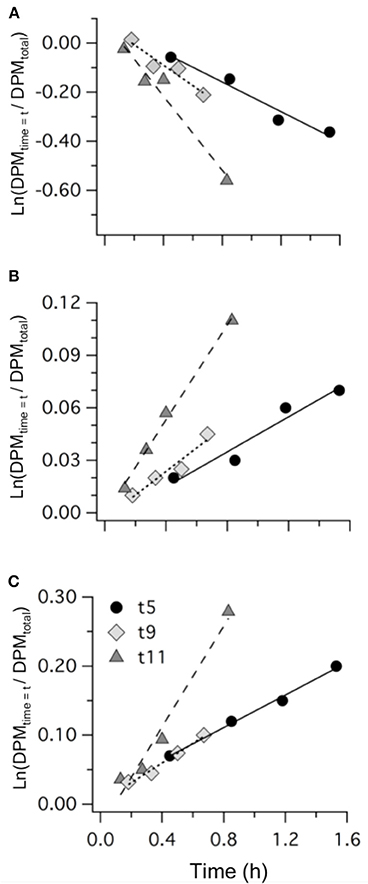
Figure 6. Examples of the results from 35S-DMSP addition experiments from mesocosm M1 on t5, t9, and t11 showing: (A) DMSPd consumption; (B) DMS production; and (C) formation of non-volatile (NV) products. Values are the natural log of the concentrations (DPM ml−1) normalized to the initial concentration of 35S-DMSP (DPM ml−1). The slope of the linear regression provides the rate coefficients kDMSPd, kDMS, and kNV (Table 4).
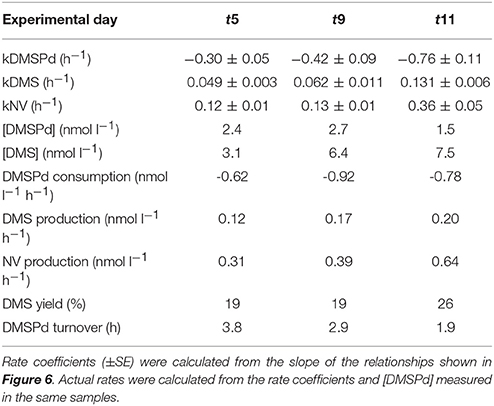
Table 4. Rate coefficients and derived rates for mesocosm M1 on experimental days t5, t9, and t11; corresponding to the 35S-DMSP—based experimental results shown in Figure 6.
Values of kDMS in all mesocosms increased over the course of the experiment, particularly between t5 and t11 (Figure 7), contributing to the observed increases in [DMS] seen in all the mesocosms. As is apparent in Figure 7, values of kDMS diverge between t5 and t9 in relation to [H+]T in the different mesocosms and this pattern was maintained, to some extent, through to t11. A highly significant inverse relationship occurred between [H+]T and kDMS on t9 (p-value: 0.0062) but the same relationship was not significant (p-value: < 0.05) on the other days when measurements were made. Significant relationships to [H+]T were also not observed for kDMSPd and kNV for the individual days.
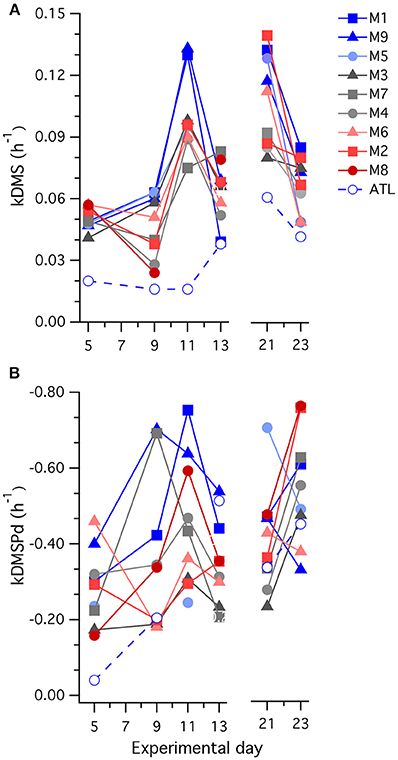
Figure 7. Temporal trends in the rate coefficients (A) kDMS; and (B) kDMSPd determined in 35S-DMSP-based experimental incubations of water from each mesocosm (M) and the surrounding Atlantic seawater.
A general decrease in kDMS between t21 and t23 accompanied a drop in [DMS] that started at t17 in most of the mesocosms. This decrease in kDMS and [DMS] occurred despite increasing [DMSPp] concentrations in the majority of mesocosms (Figure 2C) that were associated with expanding nanophytoplankton populations (Figures 5B,C). There was no apparent [H+] dependence in kDMS or kDMSPd on t21 or t23.
The most striking features of the temporal trends in [DMS] are the rapid increases between t5 and t11 (Figure 2A) that drive the observed response to [H+]T between the mesocosms (Figure 3A). To explain this feature in a more comprehensive way, time-integrated rates are used to examine whether the differences in DMS production via cleavage of DMSPd to DMS contributed to the differences in net production of DMS between t5 and t11. The rate coefficients and rates of DMSPd transformation have been integrated over the 6 days between t5 and t11 from the 35S-DMSP-based incubations on t5, t9, and t11 (Figure 8, Table 5). Observed rates of net DMS production showed a highly significant relationship to [H+]T when integrated between t5 and t11, varying from 0.68 to 0.23 nmol L−1 d−1 between mesocosms (Figure 8B, Table 6). The time-integrated kDMS values showed a corresponding, significant inverse relationship to [H+]T (Figure 8A, Table 6). Net DMS production in each mesocosm was significantly correlated to the corresponding values of kDMS (Pearsons product-moment correlation, r = 0.67, P = 0.049) (Table 6). Time-integrated DMS production rates due to cleavage of DMSPd ranged from ~ 3.9 to 1.8 nmol L−1 d−1 across the [H+]T gradient (Table 5), on average 6-fold higher than the net rates of DMS production (Figure 8B). These DMS production rates from the cleavage of DMSPd were also significantly related to [H+]T between t5 and t11 (Table 6). This indicates that variable specific rates of DMSPd cleavage to DMS (kDMS) related to [H+]T are at least in part, responsible for the observed differences in [DMS] between the different levels of acidity.
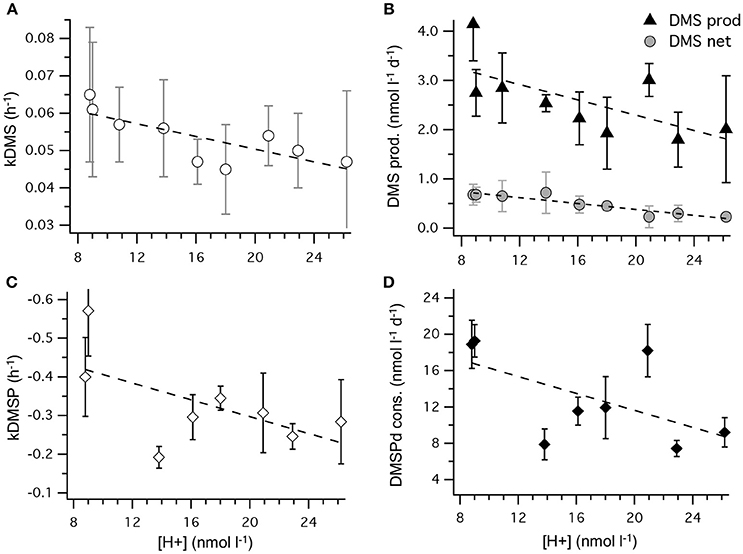
Figure 8. Rates of DMSPd catabolism from 35S-DMSP experiments, in relation to [H+]T for the period of maximum net DMS production from t5 to t11. Values are average (±SD) daily rates integrated over the 6-day period: (A) kDMS; (B) DMS production from DMSPd and net DMS production; (C) kDMSPd; (D) DMSPd consumption (Table 6). Time-integrated values of kDMSPd and DMSPd consumption are not available for mesocosm 5.
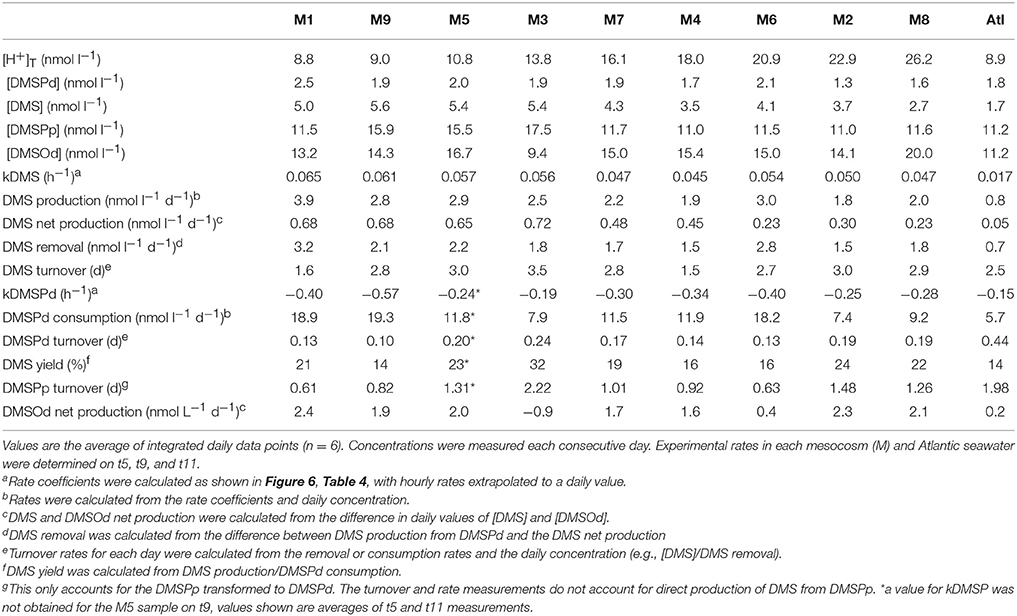
Table 5. Concentrations and rates determined using the 35S-DMSP approach during the period of rapid net production of DMS (t5–t11).
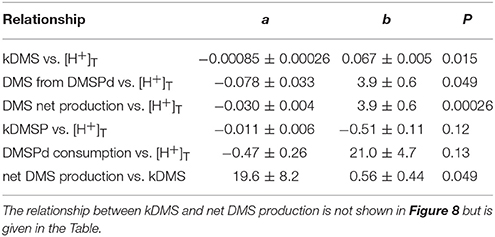
Table 6. Coefficients of the linear regressions between [H+]T in the mesocosms and the time-integrated coefficients and rates of DMS and DMSP metabolism between t5 and t11 (Figure 8), where a is the coefficient of the slope (±SE), b is the intercept (±SE), P is the significance of the F-value of the ANOVA of the regression.
Reduced kDMS with increased [H+]T contributed to the decreasing, although not significant, trend of the linear regression between kDMSPd and [H+]T (Figure 8). The non-significant regression, (Table 6) suggests DMSPd uptake and transformation in general, was inhibited by acidification during the peak of DMS net production (t5 to t11), possibly to a greater extent than kDMS. Conversion to non-volatile products during this period accounted for an average of 79 % (range 49–95%) of the DMSP consumption kNV and production of non-volatile products showed no significant relationship to [H+]T when integrated over the time period (t5–t11) or on individual days.
Discussion
Environmental Context and Comparison to Previous Experiments
To the best of our knowledge, this in situ mesocosm experiment was the first that investigated the impact of increased acidity on DMS concentrations in a subtropical oligotrophic environment. This substantially extends the latitudinal and environmental range of mesocosm experiments that have examined the influence of ocean acidification on DMS concentrations. The Canaries Current flows NNE to SSW through the Canaries archipelago (Molina, 1976). Similar levels of long term change in carbonate chemistry and pH to those measured in the open ocean to the north of the islands at ESTOC (see Introduction), would be expected to have occurred along the east coast of Gran Canaria, where this experiment was conducted. Moreover, there is growing evidence that planktonic communities in open ocean, low latitude environments may be more susceptible to ocean acidification because of the limited variability they normally experience in carbonate chemistry, compared to communities in shelf and coastal seas (Joint et al., 2011; Duarte et al., 2013). Although regional enhancement of nutrients and productivity may occur in the coastal waters around the islands and to the south of the Canaries (Arístegui et al., 1997), the initial experimental water had concentrations of nutrients and Chl a, and phytoplankton communities dominated by cyanobacteria and picophytoplankton (Taucher et al., 2017), that are similar to those observed further north at ESTOC (Neuer et al., 2007). Hence, the initial planktonic communities captured in the mesocosms are likely to have experienced day-to-day and seasonal variability in carbonate chemistry that is also representative of subtropical ocean waters.
Of the nine mesocosm experiments described so far that have investigated the DMS response to ocean acidification, including the present study, seven show a clear reduction in the time-integrated DMS concentration over the course of the experiments (reviewed in Hopkins et al., in preparation). This is despite being carried out in widely varied locations and environments by independent teams of researchers using differing experimental approaches. The similar set up of the present study and the Arctic experiment (Archer et al., 2013), in terms of mesocosm structure and volume, number, and range of [H+]T treatments and the methods and duration of carbonate chemistry manipulation, enables a straightforward comparison of the DMS response to altered acidity. The linear decrease in time-averaged [DMS] in relation to [H+]T was remarkably similar in the two experiments, with slopes of 0.22 ± 0.3 and 0.21 ± 0.02 nmol nmol−1 for the Arctic and sub-tropical experiments, respectively (Figure 3, Table 2). If the response observed in the mesocosm experiments is assumed to represent what may happen in the oceans over the next century, [DMS] may decrease by 5–33%, depending on which IPCC representative concentration pathway (RCP) transpires (Table 2). This estimated decrease is based on the average change in ocean [H+]T predicted using ten Earth System Models with marine biogeochemical components that were part of the Coupled Model Intercomparison Project 5 (CMIP5) (Bopp et al., 2013).
The relationships between [DMS] and pH observed in mesocosm experiments, particularly the Arctic experiment, have been used as the basis for modeled predictions of the impact of ocean acidification on global DMS emissions and climate (Six et al., 2013; Schwinger et al., 2017). The study by Schwinger et al. (2017) used a fully coupled Earth system model to demonstrate a potential 31% decrease in DMS emissions by the year 2100, assuming a medium level, negative response of DMS production to pH. This level of decrease in DMS emissions could contribute an extra 0.3 K of global warming by the turn of the century, due to reduction in both cloud albedo and the aerosol direct effect, as the sulfate aerosol loading is decreased. Both modeling studies used the parameterization of Six et al. (2013) in which local DMS production is modified by a pH-sensitive factor F; in which F = 1-(pHpi – pH) . γ, where γ is the slope of time-averaged [DMS] vs. pH and pHpi is the pH value of the preindustrial undisturbed ocean determined in reference model runs. The similarity in γ between experiments conducted in Arctic waters and in the subtropical North Atlantic, supports the global extrapolation of the pH vs. [DMS] dependence used as a first approximation in the model studies. However, understanding the mechanistic basis of this common response is required for more robust model predictions and this will be the focus of the remaining discussion.
Mechanisms Driving the DMS Response
Compared to many other approaches, the large in situ mesocosm approach has advantages of scalability, in part because it effectively captures many of the natural ecological interactions that are important influences in the response of pelagic ecosystems. That said, there are several caveats that need to be made clear in interpreting the DMS response. Although the lack of continuity in the waters sampled outside the mesocosms needs to be considered, the increasing difference between [DMS] in the mesocosms vs. Atlantic waters (Figure 2A) as the experiment progressed, points to some characteristic of the mesocosm environment that causes enhanced production or inhibits DMS loss. This may also be true of the trends in [DMSOd] inside and outside the mesocosms, which appear similar in the early stages of the experiment but remain at a higher level in the mesocosms toward the end of the experiment (Figure 2D). This is in contrast to the temporal trends in [DMSPd] and [DMSPp] that remain of a similar magnitude to the surrounding Atlantic waters throughout (Figures 2B,C). Two DMS removal processes, exchange with the atmosphere and photochemistry, are potentially affected by the enclosures and, as a result, net DMS production may be enhanced, leading to elevated [DMS]. In the Arctic mesocosm experiment, loss rates of added N2O were slightly higher than predicted from the measured average wind speeds close to the mesocosms, counter-intuitively indicating an enhanced loss rate from the mesocosms (Czerny et al., 2013). This possibly results from perturbation of the air-sea interface due to the routine sampling and from interactions with the mesocosm walls (Czerny et al., 2013). Gas exchange rates were not measured directly during the present experiment and the closest wind speed recordings from nearby Las Palmas Airport averaged 5.3 m s−1 between t0 and t23, more than 2-fold higher than during the EPOCA experiment. Even though the magnitude of the DMS sea-to-air flux is uncertain, it is expected to have varied in direct proportion to [DMS] in each mesocosm and therefore, to have minimal influence on the relationship between [H+]T and [DMS] across mesocosms.
Another DMS loss process potentially affected by the enclosures is photolysis, including photo-oxidation to DMSOd. The indirect photolysis of DMS requires photochemical production of oxidants derived from sources including photo-excited chromophoric dissolved organic matter (CDOM), nitrate, bromide, and the carbonate system (Mopper and Kieber, 2002; Bouillon and Miller, 2005). In general, DMS photolysis is driven by wavelengths below 400 nm but varies in relation to the composition of potential oxidants. The transparency of the polyvinyl chloride (PVC) roofs and the thermoplastic polyurethane (TPU) walls of the mesocosms rapidly reduces below 400 nm (Riebesell et al., 2013). The magnitude of DMS photolysis within the mesocosms remains to be resolved but cannot be completely ruled out on the basis of the transparency of the construction materials. For instance, higher wavelengths of 380–400 nm were reported to dominate DMS photo-oxidation to DMSO in water from the equatorial Pacific (Kieber et al., 1996). Moreover, the elevated [DMSOd] in the mesocosms compared to the Atlantic waters on t15–t23 (Figure 2) suggest enhanced production of DMSO relative to the surrounding waters, possibly as a result of DMS photochemistry in the mesocosms. In a separate mesocosm experiment of similar design in Norwegian coastal waters, concentrations of DMSOd and particulate DMSO were reduced under high [H+]T (Zindler-Schlundt et al., 2016). This was not apparent in the present experiment in oligotrophic waters, possibly reflecting variations in the balance between biological and photochemical processes that control [DMSOd] at different latitudes and in different water types.
Changes in Community Composition and DMSPp
Understanding how environmental pressures on physiology influence the composition of planktonic communities will help in predicting how ecosystem functions respond to climate change and ocean acidification. These adjustments in composition are likely to impact resource allocation by communities, including to biogeochemically important compounds like DMSP. Over the range of reduced pH predicted for the different RCPs (Bopp et al., 2013), this experiment suggests a decrease of between 3 and 20% in [DMSPp] and a corresponding decrease of 2–14% for DMSPp:Chl a may occur in subtropical waters (Figures 3, 4; Table 2). This seeming reduced investment by the community in DMSP synthesis in response to increased acidity is in contrast to the experiment in Arctic waters, during which time-averaged total DMSP increased in relation to [H+]T and no significant decrease in DMSP:Chl a vs. [H+]T was apparent (Archer et al., 2013).
Reduced net growth of the nanophytoplankton population in relation to [H+]T during the first phase of this subtropical experiment (Figure 5, Table 3) appears to explain the observed reduction in time-averaged [DMSPp] with increasing acidity (Figure 3, Table 2). Furthermore, reduced competitiveness among nanophytoplankton in the face of increased ocean acidity may be a more general phenomenon. A recent review of experiments that have examined phytoplankton community composition in relation to increased pCO2 and [H+]T found a negative impact on nanoflagellates, specifically prymnesiophytes (Haptophyta), in seven of 16 studies, and a positive impact in only one experiment (Schulz et al., 2017). The composition of the nanophytoplankton populations in the present study is unclear at this time, but the estimated cell quota of ~2 pg DMSP cell−1 from the regression between cell abundance and [DMSPp] (Figure 5) is consistent with high DMSP-producing taxa such as prymnesiophytes that can accumulate intracellular DMSP concentrations of >100 mmol l−1 cell volume and range in size from 2 to 10 μm in diameter (Keller et al., 1989).
Growth rates of the calcifying prymnesiophyte E. huxleyi have been shown to be adversely affected by increased [H+]T rather than changes in carbonation per se (Bach et al., 2011). It may be that increased [H+]T similarly affects other species of nanophytoplankton and was responsible for reducing the growth rates and competitiveness of the nanophytoplankton populations in the present study. How exactly [H+]T may impact growth rates is unclear but maintaining intracellular pH homeostasis in the face of increasing extracellular [H+]T may incur physiological costs for some taxa of microalgae (Taylor et al., 2012). This may potentially have led to reduced growth rates of DMSP-producing nanophytoplankton in the more acidified mesocosms during the early stages of the experiment.
Catabolism of DMSP and Production of DMS
The 35S-DMSP-based measurements of DMSPd catabolism provide additional insights into the mechanisms that result in reduced [DMS] in relation to [H+]T in this and, possibly, other mesocosm experiments. The 35S-DMSP approach used in the present study was chosen to specifically test if bacterial populations altered rates of DMSPd consumption and/or the proportion of DMSPd converted to DMS in the face of ocean acidification. The rates of DMSPd transformation that were measured in the mesocosm samples are generally consistent with previous measurements using the 35S-DMSP-tracer approach (reviewed in Kiene et al., 2000; Lizotte et al., 2017). For instance, values of kDMSPd integrated from t5 to t11 ranged between −0.19 and −0.40 h−1, equivalent to turnover times of the DMSPd pool of 6.3–1.3 h, respectively; confirming the rapid utilization of this labile compound by planktonic microbes (Table 5). For comparison, Kiene and Linn (2000b) recorded similar rates of kDMSPd of −0.06 to −0.28 h−1, equivalent to turnover times for DMSPd of 17.3–4.1 h in the near surface (1–10 m) oligotrophic waters of the Gulf of Mexico. In oligotrophic waters during summer in the northwestern Mediterranean, Vila-Costa et al. (2008) also measured similar rates of kDMSPd of −0.09 to −0.26 h−1 that are equivalent to turnover times for DMSPd of 10.9–3.8 h.
During this subtropical experiment, rates of kDMS were determined from the production rate of 35S-DMS from 35S-DMSP. The yield of DMS from consumed DMSPd varied between 8 and 46% for individual samples over the course of the experiment (data not shown), with time-integrated values at the height of DMS net production (t5–t11) of 14 to 32% among the [H+]T treatments (Table 5). Few directly comparable data for DMS yields exist from warm oceanic regions. Kiene and Linn (2000b) measured values of 5–6% in the oceanic waters of the Gulf of Mexico and Sargasso Sea. Generally lower values of 4–18% have been determined in temperate waters using similar 35S-DMSP-based approaches (Zubkov et al., 2001; Merzouk et al., 2008; Lizotte et al., 2017).
Other processes, including production of DMS directly by DMSP-producers, through grazing processes, or due to viral infection and lysis, may have contributed to the significant differences in concentration and net production of DMS between [H+]T treatments (Figures 3, 8) but were not quantified. However, two observations indicate that catabolism of DMSPd made an important contribution to the trends between [DMS] and [H+]T: (i) there was a significant correlation between the time integrated kDMS and net DMS production rates during the peak of DMS production (see Results section); and (ii) estimates of DMS production from DMSPd were on average 6-fold higher than net DMS production rates (Figure 8).
The response of kDMS in the mesocosms extrapolates to a decrease of 3 and 13% by 2100 for RCP2.6 and RCP8.5 respectively, based on the global ocean pH shifts predicted by Bopp et al. (2013). It also seems likely that a [H+]T -related decrease in DMSPd consumption in general occurred during the t5–t11 period (Figure 8). In contrast, no significant response to [H+]T was observed in the measurements of community bacterial production during this period, based on the incorporation into protein of 14C-leucine (Zark et al., 2017). In all mesocosms, bacterial production more than doubled from initial rates of ~6–12 μg C l−1 d−1 on t-1 to 24–38 μg C l−1 d−1 by t5 and then gradually declined before increasing again after t15–t17 to reach values of 20–42 μg C l−1 d−1 by t23 (Hornick, pers comm.). Our data show that the response of DMSPd catabolism to ocean acidification is not closely linked to the response of the bulk community bacterial production. This emphasizes the complexity of bacterial communities and the variety of ways in which bacterial processes or different components of the community may respond to environmental stresses.
Possibly the largest uncertainty associated with the 35S-DMSPd-tracer approach is conversion of the rate coefficients, kDMS, kDMSPd and kNV (h−1), to production or loss rates (nmol l−1 h−1) based on measured [DMSPd]. The introduction of a small volume, gravity filtration (SVGF) approach to determine [DMSPd] has substantially reduced estimates of [DMSPd] over earlier techniques (Kiene and Slezak, 2006). This has the knock-on effect of reducing estimates of DMSPd loss and DMS production rate. Our analysis of DMSPd provided values that ranged from 0.8 to 3.9 nmol l−1 and averaged 1.9 nmol l−1 (Figure 2), consistent with other studies using the same approach. Nonetheless, it has been shown that the amount of bioavailable DMSPd in seawater may be lower than even SVGF-based measures of [DMSPd] (Li et al., 2009). Potential inaccuracies in determining [DMSPd] do not alter the fact that elevated [H+]T had a negative influence on the rate at which the pool of bioavailable DMSPd was converted to DMS, evident as a significant decrease in the time-integrated (t5–t11) rate of kDMS (Figure 8).
Our experiment demonstrated that both DMSPd catabolism in general and DMSPd cleavage, specifically, may be affected by ocean acidification to an extent that partially explains observed decreases in [DMS]. Whether this is due to a direct effect of increased [H+]T on DMSP metabolism or is an indirect response to [H+]T -driven changes in the composition and availability of resources, is not obvious. The contrasting temporal patterns in [DMS] and kDMS compared to [DMSPp] and nanophytoplankton abundance following t17 suggests a shift in the resource coupling between DMSP-producing nanophytoplankton and the bacterial populations compared to the period of rapid net DMS production earlier in the experiment.
The physiological basis of the [H+] dependence of DMSPd cleavage to DMS observed in the present study warrants further investigation. The DMSP lyase DddY is a periplasmic enzyme associated with the cell surface (Yoch et al., 1997), and may be directly susceptible to variations in external [H+]T. However, the DddY of Alcaligenes sp., for instance, has a Km of 1–2 mmol l−1, and DddY-producing bacteria may thrive only in DMSPd-rich microenvironments (de Souza and Yoch, 1996). Most lyase and demethylation enzymes involved in DMSP catabolism are cytoplasmic and may be protected from external changes in pH by the maintenance of intracellular pH homeostasis. The uptake of leucine by dominant components of the bacterioplankton, including SAR11, in North Atlantic waters appeared to be unaffected by short term (2 h) increases in acidity, indicating that oceanic bacteria may be tolerant to changes in pH (Hartmann et al., 2015). An enduring challenge remains to establish whether the indirect consequences of acidification, including changes in phytoplankton composition and alterations in resource availability, have a greater influence on the biogeochemical function of bacterial communities than direct effects on physiology.
Conclusion
As anthropogenic sources of atmospheric sulfur decrease, it becomes increasingly important to understand how natural sources, particularly DMS emissions from the oceans, will respond to environmental changes and influence atmospheric chemistry and climate. This experiment demonstrated the potential for decreased DMS emissions from the vast subtropical oceans that could result as the oceans acidify over the next century and beyond. This confirms results from similar experiments conducted in more northern latitudes in coastal seas, indicating that similar pH-sensitive and/or pCO2-sensitive mechanisms may influence DMS concentrations generally, with possible implications for the global sulfur budget and climate.
It was possible to distinguish several, interrelated causes of the decreased net production of DMS due to increased acidity. Higher levels of acidity decreased the abundance of nanophytoplankton populations that dominated the production of DMSPp. This had the effect of decreasing the availability of DMSPd. Bacterial populations may have responded to this decreased substrate availability by decreasing the specific rate at which they catabolized DMSPd, particularly the rate at which DMSPd was cleaved to DMS. Whether this change in DMSP catabolism was the result of a physiological response by the existing bacterial populations or reflected a change in taxonomic composition, remains to be established. A direct effect of increased acidity on DMSP uptake or catabolism cannot be discounted, especially as variations in DMS concentrations between treatments were detected earlier in the experiment than variations in the nanophytoplankton abundance or DMSP pools. Although no relationship was observed between DMSOd concentrations and levels of acidity, conversion of DMS is likely to have contributed to the increasing concentrations of DMSOd that developed in the mesocosms.
The more mechanistic understanding of the processes driving reduced [DMS] with increasing [H+]T observed in this sub-tropical experiment may help to explain similar results in previous mesocosm experiments. If so, these processes may present mechanistic solutions to incorporate into predictive Earth system models, potentially providing more robust predictions of changes in DMS emissions and the consequences for climate. It remains to be resolved how the processes that drive the decreases in DMS concentration in response to increasing ocean acidity will impact DMS emissions on longer, more realistic timescales than the duration of mesocosm experiments. Future predictions may need to also embrace how the adaptive capacity, and potential for geographical redistribution, of key microbial components of the planktonic community may influence DMS cycling.
Author Contributions
All authors were involved in designing the study. LB, AL, UR, KS, KP, and SA took part in the experiment. GC and GC/MS analysis was carried out by KS and KP. KS and SA carried out the 35S-rate measurements. Data interpretation and manuscript writing was carried out by SA and KS with input from all other authors.
Conflict of Interest Statement
The authors declare that the research was conducted in the absence of any commercial or financial relationships that could be construed as a potential conflict of interest.
Acknowledgments
We thank all the team of the Gran Canaria KOSMOS experiment for their assistance, support and bonhomie. We would also like to thank the Plataforma Oceánica de Canarias (PLOCAN) for sharing their research facilities with us and for their thoughtful hospitality and considerable support. We also thank the captain and crew of RV Hesperides for deploying and recovering the mesocosms (cruise 29HE20140924). Ron Kiene, University of South Alabama, kindly provided protocols for the synthesis of 35S-DMSP. We gratefully acknowledge financial support from the National Science Foundation, United States (NSF project OCE-1316133 to SA, PM, and PC). Funding from the German Federal Ministry of Education and Research (BMBF) in the framework of the coordinated project BIOACID—Biological Impacts of Ocean Acidification, phase 2 (FKZ 03F06550) largely supported the project. UR received additional funding from the Leibniz Award 2012 by the German Research Foundation (DFG).
References
Archer, S. D., Gilbert, F. J., Nightingale, P. D., Zubkov, M. V., Taylor, A. H., Smith, G. C., et al. (2002). Transformation of dimethylsulphoniopropionate to dimethyl sulphide during summer in the North Sea with an examination of key processes via a modelling approach. Deep Sea Res. II 49, 3067–3101. doi: 10.1016/S0967-0645(02)00072-3
Archer, S. D., Kimmance, S. A., Stephens, J. A., Hopkins, F. E., Bellerby, R. G. J., Schulz, K. G., et al. (2013). Contrasting responses of DMS and DMSP to ocean acidification in Arctic waters. Biogeosciences 10, 1893–1908. doi: 10.5194/bg-10-1893-2013
Archer, S. D., Tarran, G. A., Stephens, J. A., Butcher, L. J., and Kimmance, S. A. (2011). Combining flow sorting with gas chromatography to determine phytoplankton group-specific intracellular content of dimethylsulphoniopropionate (DMSP). Aquat. Microb. Ecol. 62, 109–121. doi: 10.3354/AME01464
Arístegui, J., Tett, P., Hernández-Guerra, A., Basterretxea, G., Montero, M. F., Wild, K., et al. (1997). The influence of island-generated eddies on chlorophyll distribution: a study of mesoscale variation around Gran Canaria. Deep Sea Res. I. 44, 71–96. doi: 10.1016/S0967-0637(96)00093-3
Avgoustidi, V., Nightingale, P. D., Joint, I., Steinke, M., Turner, S. M., Hopkins, F. E., et al. (2012). Decreased marine dimethyl sulfide production under elevated CO2 levels in mesocosm and in vitro studies. Envioron. Chem. 9, 399–404. doi: 10.1071/EN11125
Bach, L. T., Riebesell, U., and Schulz, K. G. (2011). Distinguishing between the effects of ocean acidification and ocean carbonation in the coccolithophore Emiliania huxleyi. Limnol. Oceanogr. 56, 2040–2050. doi: 10.4319/lo.2011.56.6.2040
Bach, L. T., Alvarez-Fernandez, S., Hornick, T., Stuhr, A., and Riebesell, U. (2017). Simulated ocean acidification reveals winners and losers in coastal phytoplankton. PLoS ONE 12:e0188198. doi: 10.1371/journal.pone.0188198
Barlow, R. G., Cummings, D. G., and Gibb, S. W. (1997). Improved resolution of mono- and divinyl chlorophylls a and b and zeaxanthin and lutein in phytoplankton extracts using reverse phase C-8 HPLC. Mar. Ecol. Prog. Ser. 161, 303–307.
Bates, N. R., Best, M. H. P., Neely, K., Garley, R., Dickson, A. G., and Johnson, R. J. (2012). Detecting anthropogenic carbon dioxide uptake and ocean acidification in the North Atlantic Ocean. Biogeosciences 9, 2509–2522. doi: 10.5194/bg-9-2509-2012
Bates, T. S., Kiene, R. P., Wolfe, G. V., Matrai, P. A., Chavez, F. P., Buck, K. R., et al. (1994). The cycling of sulfur in surface seawater of the Northeast Pacific. J. Geophys. Res. 99, 7835–7843. doi: 10.1029/93JC02782
Boden, R., Kelly, D. P., Murrell, J. C., and Schäfer, H. (2010). Oxidation of dimethylsulfide to tetrathionate by Methylophaga thiooxidans sp. nov.: a new link in the sulfur cycle. Environ. Microbiol. 12, 2688–2699. doi: 10.1111/j.1462-2920.2010.02238.x
Bopp, L., Resplandy, L., Orr, J. C., Doney, S. C., Dunne, J. P., Gehlen, M., et al. (2013). Multiple stressors of ocean ecosystems in the 21st century: projections with CMIP5 models. Biogeosciences 10, 6225–6245. doi: 10.5194/bg-10-6225-2013
Bouillon, R. C., and Miller, W. L. (2005). Photodegradation of dimethyl sulfide (DMS) in natural waters: laboratory assessment of the nitrate-photolysis-induced DMS oxidation. Environ. Sci. Tech. 39, 9471–9477. doi: 10.1021/es048022z
Carslaw, K. S., Lee, L. A., Reddington, C. L., Pringle, K. J., Rap, A., Forster, P. M., et al. (2013). Large contribution of natural aerosols to uncertainty in indirect forcing. Nature 503, 67–74. doi: 10.1038/nature12674
Chen, T. Y., and Jang, M. (2012). Secondary organic aerosol formation from photooxidation of a mixture of dimethyl sulfide and isoprene. Atmos. Environ. 46, 271–278. doi: 10.1016/j.atmosenv.2011.09.082
Czerny, J., Schulz, K. G., Ludwig, A., and Riebesell, U. (2013). A simple method for air–sea gas exchange measurements in mesocosms and its application in carbon budgeting. Biogeosciences 10, 11989–12017. doi: 10.5194/bg-10-1379-2013
Dacey, J. W., Howse, F. A., Michaels, A. F., and Wakeham, S. G. (1998). Temporal variability of dimethylsulfide and dimethylsulfoniopropionate in the Sargasso Sea. Deep Sea Res. I 45, 2085–2104. doi: 10.1016/S0967-0637(98)00048-X
del Valle, D. A., Kieber, D. J., John, B., and Kiene, R. P. (2007). Light-stimulated production of dissolved DMSO by a particle-associated process in the Ross Sea, Antarctica. Limnol. Oceanogr. 52, 2456–2466. doi: 10.4319/lo.2007.52.6.2456
de Souza, M. P., and Yoch, D. C. (1996). “N-terminal amino acid sequences and comparison of DMSP lyases from Pseudomonas doudoroffii and Alcagenes strain M3A,” in Biological and Environmental Chemistry of DMSP and Related Sulfonium Compounds, eds M. D. Keller, R. D. Kiene, G. O. Kirst, and P. T. Visscher (Boston, MA: Springer), 293–304.
Duarte, C. M., Hendriks, I. E., Moore, T. S., Olsen, Y. S., Steckbauer, A., Ramajo, L., et al. (2013). Is ocean acidification an open-ocean syndrome? Understanding anthropogenic impacts on seawater pH. Est. Coasts 36, 221–236. doi: 10.1007/s12237-013-9594-3
Fomba, K. W., Müller, K., van Pinxteren, D., Poulain, L., van Pinxteren, M., and Herrmann, H. (2014). Long-term chemical characterization of tropical and marine aerosols at the Cape Verde Atmospheric Observatory (CVAO) from 2007 to 2011. Atmos. Chem. Phys. 14, 8883–8904. doi: 10.5194/acp-14-8883-2014
González-Dávila, M., Santana-Casiano, J. M., Rueda, M. J., and Llinas, O. (2010). The water column distribution of carbonate system variables at the ESTOC site from 1995 to 2004. Biogeosciences 7, 3067–3081. doi: 10.5194/bg-7-3067-2010
Hartmann, M., Hill, P. G., Tynan, E., Achterberg, E. P., Leakey, R. J., and Zubkov, M. V. (2015). Resilience of SAR11 bacteria to rapid acidification in the high-latitude open ocean. FEMS Microbial. Ecol. 92:fiv161. doi: 10.1093/femsec/fiv161
Hatton, A. D., Turner, S. M., Malin, G., and Liss, P. S. (1998). Dimethylsulphoxide and other biogenic sulphur compounds in the Galapagos Plume. Deep Sea Res. II 45, 1043–1053. doi: 10.1016/S0967-0645(98)00017-4
Haywood, J., and Boucher, O. (2000). Estimates of the direct and indirect radiative forcing due to tropospheric aerosols: a review. Rev. Geophys. 38, 513–543. doi: 10.1029/1999RG000078
Hopkins, F. E., and Archer, S. D. (2014). Consistent increase in dimethyl sulfide (DMS) in response to high CO2 in five shipboard bioassays from contrasting NW European waters. Biogeosciences 11, 4925–4940. doi: 10.5194/bg-11-4925-2014
Hopkins, F. E., Turner, S. M., Nightingale, P. D., Steinke, M., Bakker, D., and Liss, P. S. (2010). Ocean acidification and marine trace gas emissions. Proc. Natl. Acad. Sci. U.S.A. 107, 760–765. doi: 10.1073/pnas.0907163107
Hussherr, R., Levasseur, M., Lizotte, M., Tremblay, J. É., Mol, J., Helmuth, T., et al. (2017). Impact of ocean acidification on Arctic phytoplankton blooms and dimethyl sulfide concentration under simulated ice-free and under-ice conditions. Biogeosciences 14, 2407–2427. doi: 10.5194/bg-14-2407-2017
Johnson, M. T., and Bell, T. G. (2008). Coupling between dimethylsulfide emissions and the ocean-atmosphere exchange of ammonia. Environ. Chem. 5, 259–267. doi: 10.1071/EN08030
Joint, I., Doney, S. C., and Karl, D. M. (2011). Will ocean acidification affect marine microbes? ISME J. 5, 1–7. doi: 10.1038/ismej.2010.79
Keller, M. D., Bellows, W. K., and Guillard, R. R. L. (1989). “Dimethyl sulfide production in marine phytoplankton,” in Biogenic Sulfur in the Environment, eds E. S. Saltzman and W. J. Cooper (American Chemical Society), 183–200.
Kieber, D. J., Jiao, J., Kiene, R. P., and Bates, T. S. (1996). Impact of dimethylsulfide photochemistry on methyl sulfur cycling in the equatorial Pacific Ocean. J. Geophys. Res. Oceans. 101, 3715–3722. doi: 10.1029/95JC03624
Kiene, R., and Linn, L. (2000a). The fate of dissolved dimethylsulfoniopropionate (DMSP) in seawater: tracer studies using 35S-DMSP. Geochim. Cosmochim. Acta. 64, 2797–2810. doi: 10.1016/S0016-7037(00)00399-9
Kiene, R. P., and Linn, L. J. (2000b). Distribution and turnover of dissolved DMSP and its relationship with bacterial production and dimethylsulfide in the Gulf of Mexico. Limnol. Oceanogr. 45, 849–861. doi: 10.4319/lo.2000.45.4.0849
Kiene, R. P., Linn, L. J., and Bruton, J. A. (2000). New and important roles for DMSP in marine microbial communities. J. Sea Res. 43, 209–224. doi: 10.1016/S1385-1101(00)00023-X
Kiene, R. P., and Slezak, D. (2006). Low dissolved DMSP concentrations in seawater revealed by small volume gravity filtration and dialysis sampling. Limnol. Oceanogr. Methods 4, 80–95. doi: 10.4319/lom.2006.4.80
Kim, J. M., Lee, K., Yang, E. J., Shin, K., Noh, J. H., Park, K. T., et al. (2010). Enhanced production of oceanic dimethylsulfide resulting from CO2-induced grazing activity in a high CO2 world. Environ. Sci. Tech. 44, 8140–8143. doi: 10.1021/es102028k
Kirkby, J., Curtius, J., Almeida, J., Dunne, E., Duplissy, J., Ehrhart, S., et al. (2011). Role of sulphuric acid, ammonia and galactic cosmic rays in atmospheric aerosol nucleation. Nature 476, 429–433. doi: 10.1038/nature10343
Lana, A., Bell, T., Sim, R., Vallina, S. M., Ballabrera-Poy, J., Kettle, A. J., et al. (2011). An updated climatology of surface dimethlysulfide concentrations and emission fluxes in the global ocean. Glob. Biogeochem. Cycles 25:GB1004. doi: 10.1029/2010GB003850
Li, C. X., Yang, G. P., and Kiene, R. P (2009). “Bio-availability and turnover of dissolved dimethylsulfoniopropionate (DMSP) in coastal waters of the Gulf of Mexico,” in Abstracts of the SOLAS Open Science Conference 2009 (Barcelona).
Lizotte, M., Levasseur, M., Law, C. S., Walker, C. F., Safi, K. A., Marriner, A., et al. (2017). Dimethylsulfoniopropionate (DMSP) and dimethyl sulfide (DMS) cycling across contrasting biological hotspots of the New Zealand subtropical front. Ocean Sci. 13, 961–982. doi: 10.5194/os-13-961-2017
Lohmann, U., and Feichter, J. (2005). Global indirect aerosol effects: a review. Atmos. Chem. Phys. 5, 715–737. doi: 10.5194/acp-5-715-2005
Lueker, T. J., Dickson, A. G., and Keeling, C. D. (2000). Ocean pCO2 calculated from dissolved inorganic carbon, alkalinity, and equations for K1 and K2: validation based on laboratory measurements of CO2 in gas and seawater at equilibrium. Mar. Chem. 70, 105–119. doi: 10.1016/S0304-4203(00)00022-0
Malmstrom, R. R., Kiene, R. P., Cottrell, M. T., and Kirchman., D. L (2004). Contribution of SAR11 bacteria to dissolved dimethylsulfoniopropionate and amino acid uptake in the North Atlantic ocean. Appl. Environ. Microbiol. 70, 4129–4135. doi: 10.1128/AEM.70.7.4129-4135.2004
Merzouk, A., Levasseur, M., Scarratt, M., Michaud, S., Lizotte, M., Rivkin, R. B., et al. (2008). Bacterial DMSP metabolism during the senescence of the spring diatom bloom in the Northwest Atlantic. Mar. Ecol. Progr. Ser. 369, 1–11. doi: 10.3354/meps07664
Molina, R. (1976). Consideraciones Sobre la Corriente de Canarias, Asamblea National de Geodesia y Geofisica. Comunicaciones 3, 1567–1588.
Mopper, K., and Kieber, D. J. (2002). “Photochemistry and the cycling of carbon, sulfur, nitrogen and phosphorus,” in Biogeochemistry of Marine Dissolved Organic Matter, eds D. A. Hansell and C. A. Carlson (San Diego, CA: Academic Press), 455–503.
Müller, K., Lehmann, S., Pinxteren, D. V., Gnauk, T., Niedermeier, N., Wiedensohler, A., et al. (2010). Particle characterization at the Cape Verde atmospheric observatory during the 2007 RHaMBLe intensive. Atmos. Chem. Phys., 10, 2709–2721. doi: 10.5194/acp-10-2709-2010
Neuer, S., Cianca, A., Helmke, P., Freudenthal, T., Davenport, R., Meggers, H., et al. (2007). Biogeochemistry and hydrography in the eastern subtropical North Atlantic gyre. Results from the European time-series station ESTOC. Progr. Oceanogr. 72, 1–29. doi: 10.1016/j.pocean.2006.08.001
Park, K. T., Lee, K., Shin, K., Yang, E. J., Hyun, B., Kim, J. M., et al. (2014). Direct linkage between dimethyl sulfide production and microzooplankton grazing, resulting from prey composition change under high partial pressure of carbon dioxide conditions. Environ. Sci. Tech. 4750–4756. doi: 10.1021/es403351h
Pierrot, D., Lewis, E., and Wallace, D. W. R. (2006). MS Excel Program Developed for CO2 System Calculations. ORNL/CDIAC-105a. Oak Ridge, TN: Carbon Dioxide Information Analysis Center, Oak Ridge National Laboratory, US Department of Energy.
Raven, J. A. (2013). “Half a century of pursuing the pervasive proton,” in Progress in Botany, eds U. Lüttge, W. Beyschlag, D. Francis, and J. Cushman (Berlin; Heidelberg, Springer), 3–34. doi: 10.1007/978-3-642-30967-0_1
Reisch, C. R., Moran, M. A., and Whitman, W. B. (2011). Bacterial catabolism of dimethylsulfoniopropionate (DMSP). Front. Microbiol. 2:172. doi: 10.3389/fmicb.2011.00172
Riebesell, U., Czerny, J., Von Bröckel, K., Boxhammer, T., Büdenbender, J., Deckelnick, M., et al. (2013). Technical note: a mobile sea-going mesocosm system - new opportunities for ocean change research. Biogeosciences 10, 1835–1847. doi: 10.5194/bg-10-1835-2013
Rinaldi, M., Decesari, S., Finessi, E., Giulianelli, L., Carbone, C., Fuzzi, S., et al. (2010). Primary and secondary organic marine aerosol and oceanic biological activity: recent results and new perspectives for future studies. Adv. Meteorol. 2010:310682. doi: 10.1155/2010/310682
Sabine, C. L., Feely, R. A., Gruber, N., Key, R. M., Lee, K., Bullister, J. L., et al. (2004). The oceanic sink for anthropogenic CO2. Science 305, 367–371. doi: 10.1126/science.1097403
Schulz, K. G., Bach, L. T., Bellerby, R. G., Bermúdez, R., Büdenbender, J., Boxhammer, T., et al. (2017). Phytoplankton blooms at increasing levels of atmospheric carbon dioxide: experimental evidence for negative effects on prymnesiophytes and positive on small picoeukaryotes. Front. Mar. Sci. 4, 1–18. doi: 10.3389/fmars.2017.00064
Schwinger, J., Tjiputra, J., Goris, N., Six, K. D., Kirkevåg, A., Seland, Ø., et al. (2017). Amplification of global warming through pH dependence of DMS production simulated with a fully coupled Earth system model. Biogeosciences 14, 3633–3648. doi: 10.5194/bg-14-3633-2017
Signorini, S. R., Franz, B. A., and McClain, C. R. (2015). Chlorophyll variability in the oligotrophic gyres: mechanisms, seasonality and trends. Front. Mar. Sci. 2:1. doi: 10.3389/fmars.2015.00001
Simó, R., Grimalt, J. O., and Albaigés, J. (1997). Dissolved dimethylsulphide, dimethylsulphoniopropionate and dimethylsulphoxide in western Mediterranean waters. Deep Sea Res. II 44, 929–950. doi: 10.1016/S0967-0645(96)00099-9
Sipilä, M., Berndt, T., Petäjä, T., Brus, D., Vanhanen, J., Stratmann, F., et al. (2010). The role of sulfuric acid in atmospheric nucleation. Science 327, 1243–1246. doi: 10.1126/science.1180315
Six, K. D., Kloster, S., Ilyina, T., Archer, S. D., Zhang, K., and Maier-Reimer, E. (2013). Global warming amplified by reduced sulphur fluxes as a result of ocean acidification. Nat. Clim. Chang. 3, 975–978. doi: 10.1038/nclimate1981
Stefels, J., Steinke, M., Turner, S., Malin, G., and Belviso, S. (2007). Environmental constraints on the production and removal of the climatically active gas dimethylsulphide (DMS) and implications for ecosystem modelling. Biogeochemistry 83, 245–275. doi: 10.1007/s10533-007-9091-5
Taucher, J., Bach, L. T., Boxhammer, T., Nauendorf, A., Achterberg, E. P., Algueró-Muñiz, M., et al. (2017). Influence of ocean acidification and deep water upwelling on oligotrophic plankton communities in the subtropical North Atlanc: insights from an in situ mesocosm study. Front. Mar. Sci. 4:85. doi: 10.3389/fmars.2017.00085
Taylor, A. R., Brownlee, C., and Wheeler, G. L. (2012). Proton channels in algae: reasons to be excited. Trends Plant Sci. 17, 675–684. doi: 10.1016/j.tplants.2012.06.009
Toumi, R. (1994). BrO as a sink for dimethylsulphide in the marine atmosphere. Geophys. Res. Letts. 21, 117–120. doi: 10.1029/93GL03536
Vila-Costa, M., del Valle, D. A., González, J. M., Slezak, D., Kiene, R. P., Sánchez, O., et al. (2006). Phylogenetic identification and metabolism of marine dimethylsulfide-consuming bacteria. Environ. Microbiol. 8, 2189–2200. doi: 10.1111/j.1462-2920.2006.01102.x
Vila-Costa, M., Kiene, R. P., and Simó, R. (2008). Seasonal variability of the dynamics of dimethylated sulfur compounds in a coastal northwest Mediterranean site. Limnol. Oceanogr. 53, 198–211. doi: 10.4319/lo.2008.53.1.0198
Vogt, M., Steinke, M., Turner, S., Paulino, A., Meyerhöfer, M., Riebesell, U., et al. (2008). Dynamics of dimethylsulphoniopropionate and dimethylsulphide under different CO2 concentrations during a mesocosm experiment. Biogeosciences 5, 407–419. doi: 10.5194/bg-5-407-2008
Wang, S., Elliott, S., Maltrud, M., and Cameron-Smith, P. (2015). Influence of explicit Phaeocystis parameterizations on the global distribution of marine dimethyl sulfide. J. Geophys. Res. Biogeosci. 120, 2158–2177. doi: 10.1002/2015JG003017
Webb, A. L., Leedham-Elvidge, E., Hughes, C., Hopkins, F. E., Malin, G., Bach, L. T., et al. (2016a). Effect of ocean acidification and elevated CO2 on trace gas production by a Baltic Sea summer phytoplankton community. Biogeosciences 13, 4595–4613. doi: 10.5194/bg-13-4595-2016
Webb, A. L., Malin, G., Hopkins, F. E., Ho, K. L., Riebesell, U., Schulz, K. G., et al. (2016b). Ocean acidification has different effects on the production of dimethylsulfide and dimethylsulfoniopropionate measured in cultures of Emiliania huxleyi and a mesocosm study: a comparison of laboratory monocultures and community interactions. Environ. Chem. 13, 314–329. doi: 10.1071/EN14268
Wingenter, O. W., Haase, K. B., Zeigler, M., Blake, D. R., Rowland, F. S., Sive, B. C., et al. (2007). Unexpected consequences of increasing CO2 and ocean acidity on marine production of DMS and CH2ClI: potential climate impacts. Geophys. Res. Letts. 34:L05710. doi: 10.1029/2006GL028139
Yassaa, N., Colomb, A., Lochte, K., Peeken, I., and Williams, J. (2006). Development and application of a headspace solid-phase microextraction and gas chromatography/mass spectrometry method for the determination of dimethylsulfide emitted by eight marine phytoplankton species. Limnol. Oceanogr Methods 4, 374–381. doi: 10.4319/lom.2006.4.374
Yoch, D. C., Ansede, J. H., and Rabinowitz, K. S. (1997). Evidence for intracellular and extracellular dimethylsulfoniopropionate (DMSP) lyases and DMSP uptake sites in two species of marine bacteria. Appl. Environ. Microbiol. 63, 3182–3188.
Zark, M., Broda, N. K., Hornick, T., Grossart, H. P., Riebesell, U., and Dittmar, T. (2017). Ocean acidification experiments in large-scale mesocosms reveal similar dynamics of dissolved organic matter production and biotransformation. Front. Mar. Sci. 4:271. doi: 10.3389/fmars.2017.00271
Zindler-Schlundt, C., Lutterbeck, H., Endres, S., and Bange, H. W. (2016). Environmental control of dimethylsulfoxide (DMSO) cycling under ocean acidification. Environ. Chem. 13, 330–339. doi: 10.1071/EN14270
Zubkov, M. V., Fuchs, B. M., Archer, S. D., Kiene, R. P., Amann, R., and Burkill, P. H. (2001). Linking the composition of bacterioplankton to rapid turnover of dissolved dimethylsulphoniopropionate in an algal bloom in the North Sea. Environ. Microbiol. 3, 304–311. doi: 10.1046/j.1462-2920.2001.00196.x
Keywords: DMS, DMSP, ocean acidification, bacterial metabolism, phytoplankton composition, subtropical North Atlantic, mesocosm experiment
Citation: Archer SD, Suffrian K, Posman KM, Bach LT, Matrai PA, Countway PD, Ludwig A and Riebesell U (2018) Processes That Contribute to Decreased Dimethyl Sulfide Production in Response to Ocean Acidification in Subtropical Waters. Front. Mar. Sci. 5:245. doi: 10.3389/fmars.2018.00245
Received: 31 March 2018; Accepted: 26 June 2018;
Published: 23 July 2018.
Edited by:
Christel Hassler, Université de Genève, SwitzerlandReviewed by:
Katherina Petrou, University of Technology Sydney, AustraliaWilliam Sunda, University of North Carolina at Chapel Hill, United States
Copyright © 2018 Archer, Suffrian, Posman, Bach, Matrai, Countway, Ludwig and Riebesell. This is an open-access article distributed under the terms of the Creative Commons Attribution License (CC BY). The use, distribution or reproduction in other forums is permitted, provided the original author(s) and the copyright owner(s) are credited and that the original publication in this journal is cited, in accordance with accepted academic practice. No use, distribution or reproduction is permitted which does not comply with these terms.
*Correspondence: Stephen D. Archer, c2FyY2hlckBiaWdlbG93Lm9yZw==