 Theodor Kindeberg
 Sarah B. Ørberg
 Maria Emilia Röhr1,3
 Marianne Holmer
 Dorte Krause-Jensen
- 1Department of Biology, University of Southern Denmark, Odense, Denmark
- 2Department of Bioscience, Aarhus University, Silkeborg, Denmark
- 3Environmental and Marine Biology, Åbo Akademi University, Åbo, Finland
Seagrass ecosystems provide an array of ecosystem services ranging from habitat provision to erosion control. From a climate change and eutrophication mitigation perspective, the ecosystem services include burial and storage of carbon and nutrients in the sediments. Eelgrass (Zostera marina) is the most abundant seagrass species along the Danish coasts, and while its function as a carbon and nutrient sink has been documented in some areas, the spatial variability of these functions, and the drivers behind them, are not well understood. Here we present the first nationwide study on eelgrass sediment stock of carbon (Cstock), nitrogen (Nstock), and phosphorus (Pstock). Stocks were measured in the top 10 cm of eelgrass meadows spanning semi-enclosed estuaries (inner and outer fjords) to open coasts. Further, we assessed environmental factors (level of exposure, sediment properties, level of eutrophication) from each area to evaluate their relative importance as drivers of the spatial pattern in the respective stocks. We found large spatial variability in sediment stocks, representing 155–4413 g C m-2, 24–448 g N m-2, and 7–34 g P m-2. Cstock and Nstock were significantly higher in inner fjords compared to outer fjords and open coasts. Cstock, Nstock, and Pstock showed a significantly positive relationship with the silt-clay content in the sediments. Moreover, Cstock was also significantly higher in more eutrophied areas with high concentrations of nutrients and chlorophyll a (chl a) in the water column. Conversely, silt-clay content was not related to nutrients or chl a, suggesting a spatial dependence of the importance of these factors in driving stock sizes and implying that local differences in sediment properties and eutrophication level should be included when evaluating the storage capacity of carbon, nitrogen, and phosphorus in Danish eelgrass meadows. These insights provide guidance to managers in selecting priority areas for carbon and nutrient storage for climate- and eutrophication mitigation initiatives.
Introduction
The coastal ocean is a highly dynamic component of the Earth’s system and features many complex interactions between oceanic, terrestrial, and atmospheric processes. The central role of coastal ecosystems in global and local biogeochemical cycles is in part due to disproportionately high biological activity in conjunction with extensive inputs of carbon and nutrients from rivers, terrestrial runoff, and upwelling (Gattuso et al., 1998; Duarte et al., 2005). Seagrasses are pervasive benthic macrophytes in coastal and estuarine waters spanning all continents except Antarctica (Short et al., 2007). In addition to providing important habitat for a wide range of species, seagrasses also play important roles in biogeochemical cycles including carbon and nutrient cycling (Duarte et al., 2005; McGlathery et al., 2007). Seagrasses, along with other marine vegetated habitats such as mangroves, saltmarshes, and macroalgae, have been recognized as a potential solution to combat anthropogenic perturbations such as excessive emissions of greenhouse gasses and nutrients to the environment (Nordlund et al., 2016; Gattuso et al., 2018; Himes-Cornell et al., 2018). The ability of marine vegetated habitats to sequester and store atmospheric CO2 was first introduced by Smith (1981), and the term Blue Carbon was defined in the Blue Carbon report by Nellemann et al. (2009). This research field has propelled over the last decade and Blue Carbon has been proposed as a viable tool in both climate mitigation- and adaptation strategies (McLeod et al., 2011; Duarte et al., 2013; Greiner et al., 2013; Luisetti et al., 2013). Similarly, the potential of these habitats to act as nutrient filters has been suggested to alleviate effects of local eutrophication (McGlathery et al., 2007; Piehler and Smyth, 2011).
Due to a combination of high productivity and the ability to trap sestonic particles, seagrasses produce and bury large amounts of organic matter (OM) of which a portion is stored in the often anoxic underlying sediment and effectively sequestered from the ocean-atmosphere carbon pool (Fourqurean et al., 2012a). The sediment stock has been shown to be the predominant contributor to the total pool of organic carbon in seagrass meadows (Kennedy et al., 2010; Fourqurean et al., 2012a; Macreadie et al., 2014). In addition, a fraction of the seagrass-derived detritus and dissolved organic matter (DOM) is exported from the meadow and may either be buried in depositional basins and the deep sea, or enter the microbial loop as refractory DOM (Barrón et al., 2014; Duarte and Krause-Jensen, 2017).
Nutrient cycling and retention in seagrass meadows is regulated both directly through the uptake and assimilation in leaves, roots, and rhizomes and indirectly through trapping of sestonic particles containing variable amounts of nutrients (Touchette and Burkholder, 2000; Eyre and Ferguson, 2002; Romero et al., 2006). In addition, elevated rates of denitrification carried out by microbes associated with the rhizosphere have been shown to contribute to additional export of nitrogen at the community and ecosystem scale (Eyre et al., 2016; Reynolds et al., 2016), although nitrogen fixation in seagrass meadows may also be significant (McGlathery et al., 1998; Welsh, 2000). However, the size and variability of the nutrient sink capacity of seagrass meadows, the mechanisms governing the variability, and the temporal aspects of the retention are not well constrained (Risgaard-Petersen et al., 1998; Nielsen et al., 2004; McGlathery et al., 2012).
Several studies have investigated the drivers behind Blue Carbon storage, and it has been shown that they consist of a complex set of physical, chemical, and biological factors that vary considerably between and within systems and are highly dependent on which functional scale is assessed (e.g., spatial, temporal, species, community, ecosystem) (see e.g., Ricart et al., 2015; Röhr et al., 2016; Samper-Villarreal et al., 2016; Belshe et al., 2017a,b; Dahl, 2017; Oreska et al., 2017a; Mazarrasa et al., 2018; Röhr et al., 2018). Sediment properties such as grain size, porosity, degree of sorting, and density are largely controlled by the hydrodynamic regime where, for instance, grain size typically increases with increasing wave- and current exposure, as the higher hydrodynamic energy and short residence times do not allow finer grains to settle (Folk and Ward, 1957; Fonseca and Bell, 1998; van Keulen and Borowitzka, 2003; Mazarrasa et al., 2017). Contrarily, low-energy environments typically observed in sheltered locations, tend to have a larger fraction of fine-grained material such as silt and clay (Jankowska et al., 2016; Röhr et al., 2016). Thus, information on sediment characteristics can serve as a useful proxy for the level of exposure in unvegetated areas, but the relationship may be confounded by water depth and in vegetated sediments by the seagrass canopy and rhizosphere’s effect on sedimentation and resuspension (Fonseca and Bell, 1998; Madsen et al., 2001; Yang et al., 2008; Linders et al., 2018). Moreover, sediment grain size is a strong predictor of sediment OM pools and seagrass sediments exhibit increases in both the amount of carbon stored (Dahl et al., 2016; Röhr et al., 2016; Samper-Villarreal et al., 2016; Miyajima et al., 2017) and carbon burial rates (Mazarrasa et al., 2017) with increasing silt-clay content. This correlation may be due to the larger surface area for adsorbing organic molecules at high silt-clay content (Keil et al., 1994; Bergamaschi et al., 1997), and low oxygen availability reducing the remineralization of OM (Dauwe et al., 2001; Serrano et al., 2016), as well as the relatively higher sedimentation of sestonic particles in these low-energy environments (Mazarrasa et al., 2017, 2018). However, plant traits such as shoot density, above- and belowground biomass, and net primary productivity also explain a large part of the variability in carbon stock and sink capacity in local areas (Duarte et al., 2010; Gillis et al., 2017; Oreska et al., 2017a). The relative importance of biological and environmental factors seem to largely depend on which spatial scale is assessed, with biological factors being more important on smaller scales (meadow, patch) and environmental factors more important on larger scales (regional, global) (Dahl, 2017).
In the present study, we made a concerted effort to assess sediment stocks of carbon (Cstock), nitrogen (Nstock), and phosphorus (Pstock) in eelgrass (Zostera marina L.) meadows across Denmark and evaluated environmental properties as explanatory variables for the variability in sediment stocks. Eelgrass is a prevalent seagrass species which, although it has been in drastic decline, creates vast meadows in areas along the Danish coasts (Boström et al., 2014). Despite receiving extensive attention and research efforts in Denmark for over a century, the role of eelgrass in carbon and nutrient storage is not well known. To our knowledge, this study is the first to assess species-specific seagrass sediment storage of carbon, nitrogen, and phosphorus on a nationwide scale ranging from semi-enclosed estuaries to the open coast. Given the large spatial range in sampling areas, we proposed the following research questions: (i) what is the spatial variability in sediment Cstock, Nstock, and Pstock in Danish eelgrass meadows? (ii) To what extent is stock size related to sediment characteristics and/or level of eutrophication? Based on these questions we formulated the following hypotheses: (1) Cstock, Nstock, and Pstock are higher in sheltered areas with less exposure and higher silt-clay content and (2) stocks are higher in areas with higher nutrient and chl a concentrations in the water column.
Materials and Methods
Assessing C, N, and P Stocks
To assess the sediment stocks of each element (Cstock, Nstock, and Pstock), particulate organic carbon [POC % dry weight (% dw)], total nitrogen (TN % dw), and total phosphorus (TP % dw) concentrations in the top 10 cm sediment were compiled from six studies conducted across Denmark in the period 1999–2014 (Supplementary Table S1). In all studies, sediment cores (1–4 cores per site) were collected in eelgrass meadows using similar techniques and subsequently analyzed for elemental composition and sediment properties. Sediment carbon density (g cm-3) was calculated by multiplying dry bulk density [DBD (g cm-3) with POC (% dw)] according to Howard et al. (2014). The sediment density of nitrogen and phosphorus was calculated in the same way but using TN and TP, respectively. In studies where OM [defined as loss on ignition, LOI (%)] was measured instead of POC, a conversion was performed using the empirical linear relationship between POC and OM found in studies measuring both parameters (Supplementary Figure S1). For sites where a full depth profile was obtained (0–10 cm), the accumulated amount of C, N, and P was assessed by multiplying the average (n = 1–4 cores) sediment density of carbon, nitrogen, and phosphorus by the length of each core section (cm) and integrating across the 10 cm depth to express as mass per area (g m-2). The total number of sites, where all information needed to assess sediment stock was available, equaled n = 50 for Cstock, followed by n = 47 for Nstock, and n = 36 for Pstock.
Maps of Cstock, Nstock, and Pstock were created using the MATLAB® R2017b mapping toolbox (Mathworks, Inc.) and projected using the WGS1984 ellipsoid UTM zone 32N.
Environmental Parameters
To assess the level of exposure, a wave energy layer covering the sampling sites was obtained from the EUSeaMap1 with a resolution of 300 m × 300 m. The wave energy layer is based on mean wind data in the period 2002–2007 (Wijkmark and Isæus, 2010).
The process of eutrophication is defined as “an increase in the rate of supply of organic matter to an ecosystem” (Nixon, 1995). However, several alternative definitions exist that concern the various proxies from which the level of eutrophication can be inferred (Cloern, 2001; Andersen et al., 2006). These include water column concentrations of macronutrients, chl a, and Secchi depth (Andersen et al., 2006). In order to assess relationships between sediment stocks and level of eutrophication we extracted data from the Danish National Monitoring and Assessment Program for the Aquatic and Terrestrial Environments (DNAMAP). Due to the long temporal range of our sediment data (1999–2014), we used annual averages of water column concentrations of TN, dissolved inorganic nitrogen (DIN), TP, dissolved inorganic phosphorus (DIP), chl a, salinity, and Secchi depth from each site for the 5 years prior to the respective sampling events (Wulff et al., 1990; Christiansen and Emelyanov, 1995) (Supplementary Data Sheet S1). Based on levels of chl a and Secchi depth at the Danish intercalibration sites of the Water Framework Directive (WFD), all sites in this study can be considered eutrophic (Henriksen, 2009). Thus, we discuss various levels of eutrophication when referring to water column TN, TP, chl a, and Secchi depth.
To obtain information on the effects of sediment fine-grained material on sediment stocks, and to explore the relationship between level of exposure and fine-grained material, we used silt-clay content (% dw, Φ < 62.5 μm) reported in each study. We used the average silt-clay content of the top 10 cm at all sites except for 10 sites, where only surface samples (0–2 cm) were available.
Statistical Analyses
The sediment cores were sampled in different waterbodies, which we qualitatively categorized into three types (inner fjord, outer fjord, and open coast) based on visual inspection of the sites’ respective location (Figure 1). Out of the 60 sampling sites, 34 were categorized as inner fjord, 18 as outer fjord, and 8 as open coast. The sites differed in water depth ranging from 0.5 to 12 m, and we performed a one-way ANOVA to assess whether mean water depth differed between waterbodies. Similarly, we performed one-way ANOVAs to assess whether the silt-clay content and exposure differed between waterbodies.
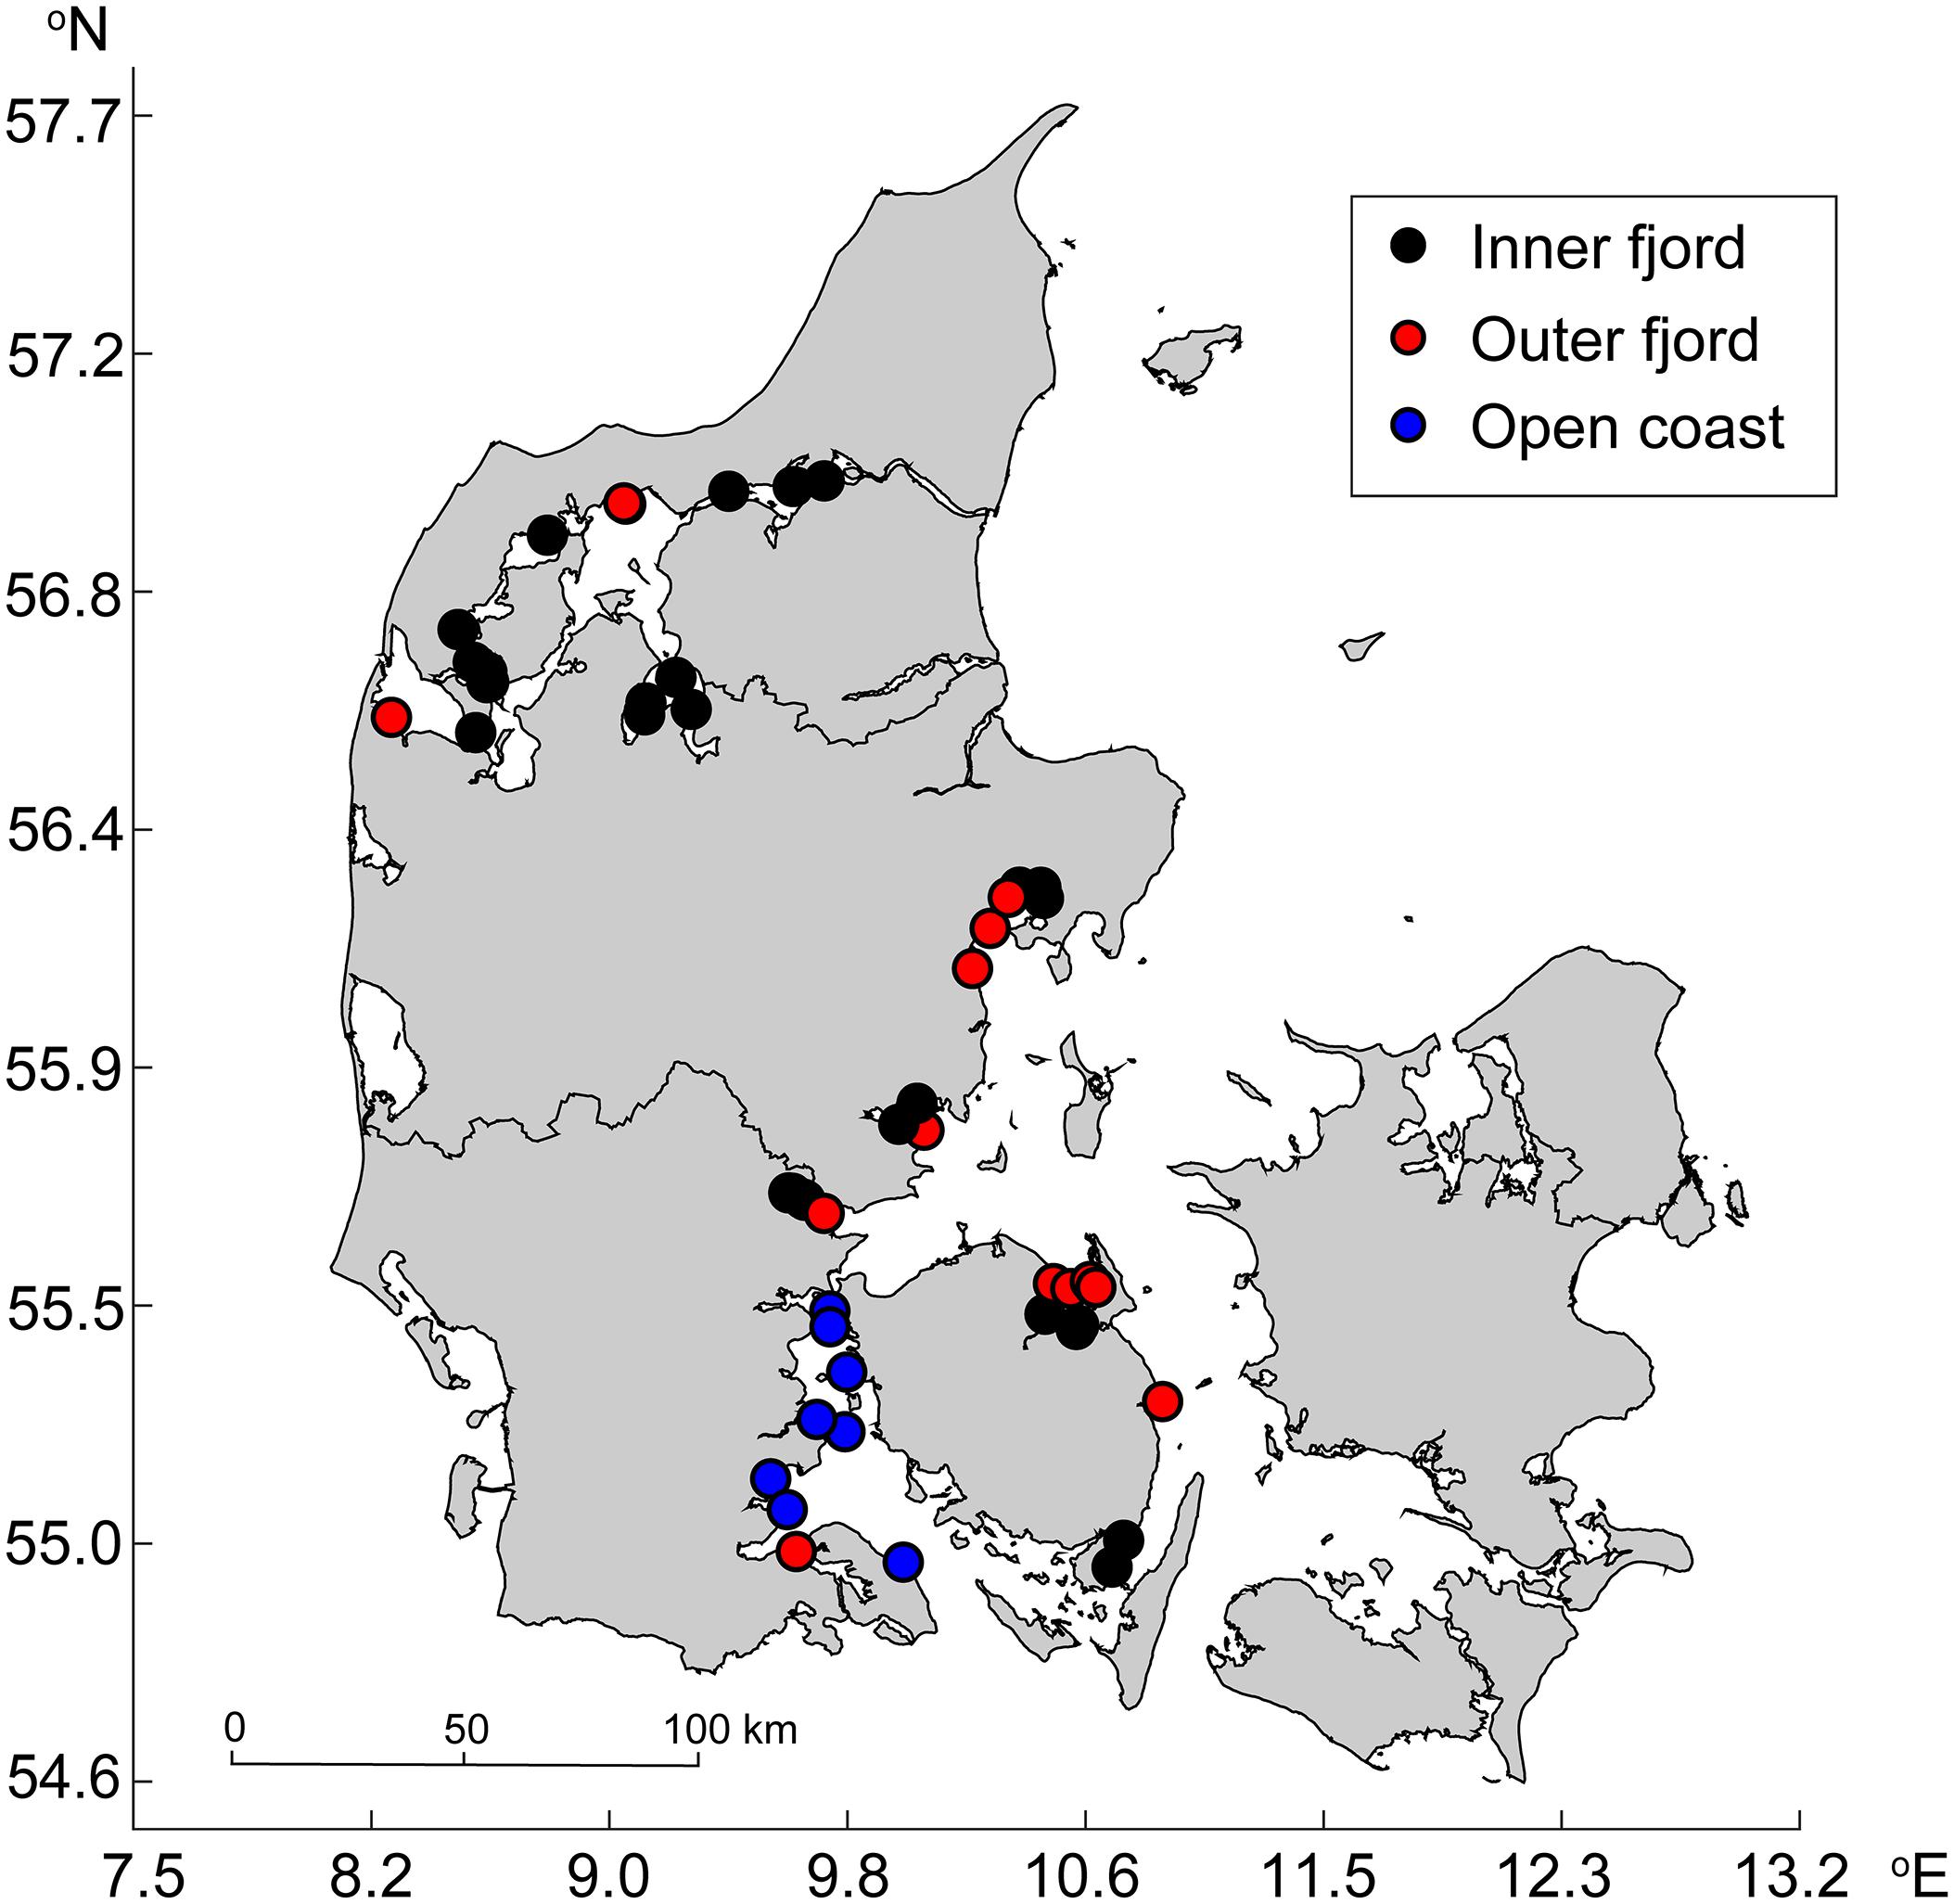
Figure 1. Map showing the sites and their respective waterbody categorization.
To assess whether sediment stocks in Danish eelgrass meadows depend on waterbody type, we performed one-way ANOVAs. Cstock and Nstock were log-transformed to meet assumptions of normality and homogeneity of variances, obtained using Shapiro–Wilk’s test of normality and Levene’s test of homoscedasticity, respectively. Tukey’s HSD post hoc tests were performed to test the pairwise difference in sediment stocks between waterbodies.
To examine environmental effects on sediment stock size, we constructed generalized linear models (GLM) for each sediment stock (Cstock, Nstock, and Pstock). Stocks were modeled as a function of silt-clay, TN, TP, chl a, Secchi depth, salinity, and exposure, using the Gaussian family with identity links. The model setup was chosen following evaluation of Akaike Information Criterion (AIC), likelihood-ratio test, and residual deviance. We also assessed the multicollinearity between explanatory variables by using variance inflation factors (VIF). In order to constrain the predictive power of each explanatory variable, we standardized all variables to z-scores by subtracting the mean from each observation and dividing by its standard deviation.
A caveat of using GLMs was that due to missing values at some sites, the model runs were applied to a reduced number of observations and thus did not cover the entire range of sites. Specifically, the GLMs for Cstock, Nstock, and Pstock were only applied to 27, 29, and 24 sites, respectively, and the relative number of waterbodies (inner/outer fjord, open coast) was not always proportional to the full dataset. Consequently, we also assessed the relationships between sediment stocks and environmental variables through simple linear regression analyses of one explanatory variable at a time. Similarly, we assessed the linear correlation between Cstock, Nstock and Pstock. Considering our aim to describe variation across all sites, we focus on these results and primarily use the GLMs to explore the predictive power of environmental factors for a subset of sites.
All statistics were performed with R statistical software (R Core Team, 2017) using the following packages: basic, boot, bbmle, car, and lmtest. A significance level of α < 0.05 was used for all parametric tests.
Results
Eelgrass Sediment Stocks of C, N, P in Denmark
Concentrations (% dw) of sediment POC, TN, and TP exhibited significant heterogeneity ranging from 0.005–11.33, <0.001–1.13, and 0.007–0.17, respectively. Mean (± SE) Cstock, Nstock, and Pstock inferred from the top 10 cm sediment equaled 1013 ± 116, 109 ± 12, and 17 ± 1 g m-2, respectively. The spatial variability was large and ranged 155–4413, 24–448, and 7–34 g m-2, for Cstock, Nstock, and Pstock, respectively (Figure 2). Furthermore, median stocks of C and N were substantially lower than mean values (711 and 68 g m-2, respectively), reflecting a lognormal distribution with a majority of lower stocks and a few very high stocks.
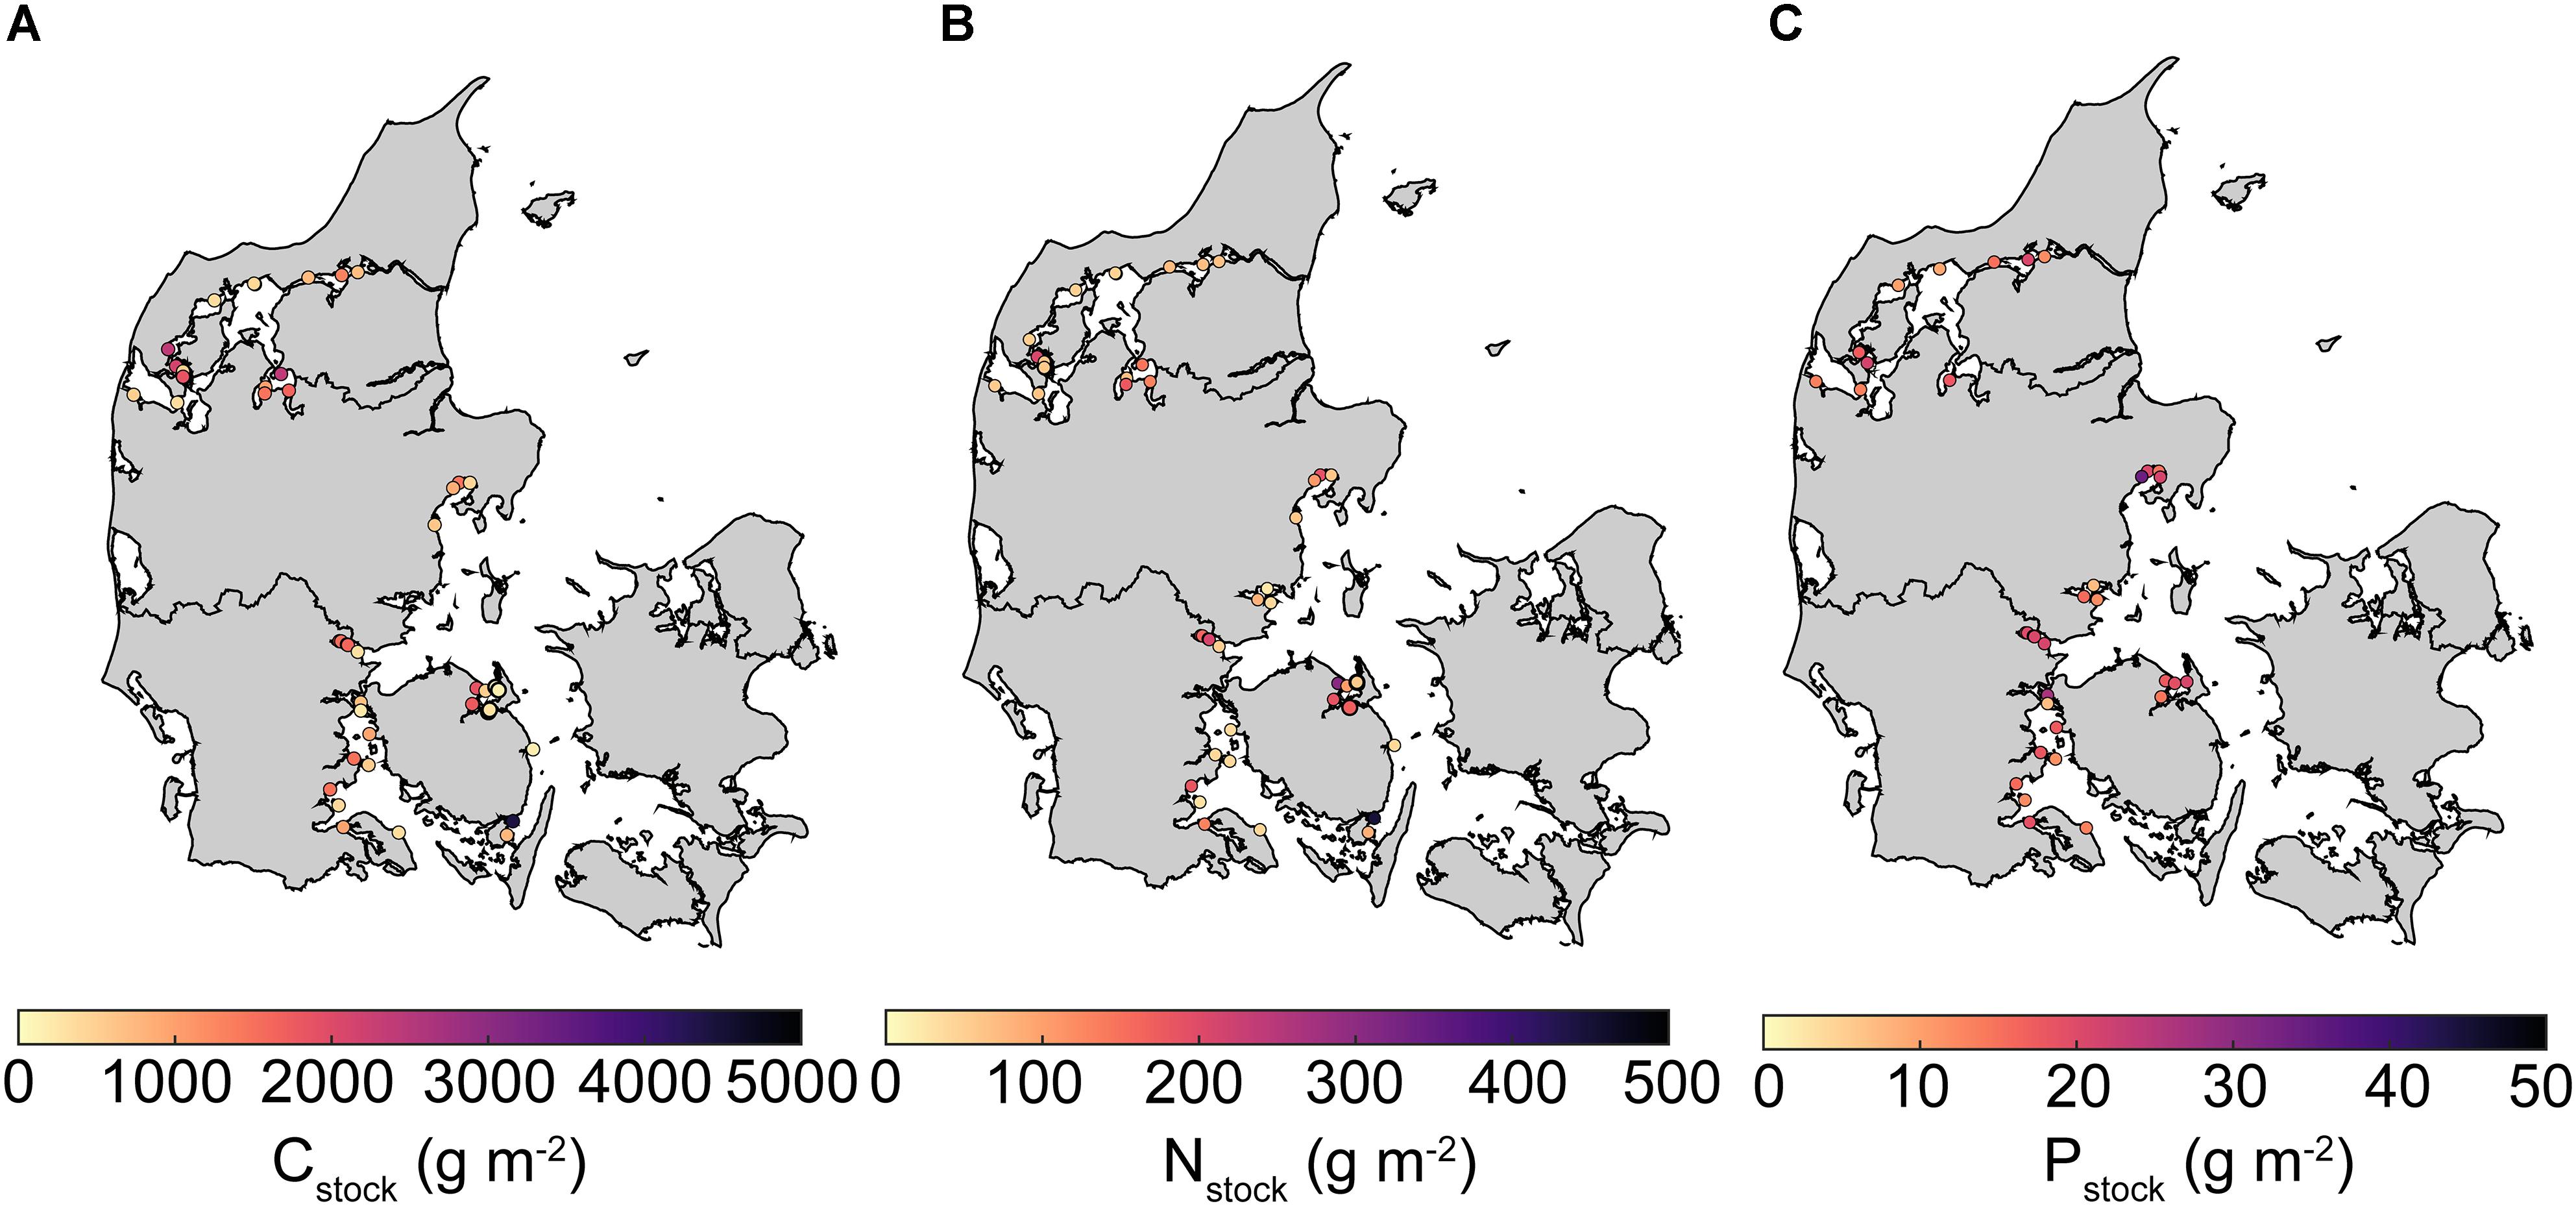
Figure 2. Maps of average Danish eelgrass sediment stocks of (A) carbon (Cstock), (B) total nitrogen (Nstock), and (C) total phosphorus (Pstock) in the top 10 cm. Empty circles indicate missing data. Note that the colorbar scale differ between maps.
We found significant positive linear correlations between Cstock and Nstock (slope = 6.42, R2= 0.59, F1,30 = 43.22, p < 0.001), between Cstock and Pstock (slope = 44.42, R2 = 0.13, F1,29 = 5.41, p = 0.027), and between Nstock and Pstock (slope = 0.04, R2= 0.25, F1,30 = 10.18, p = 0.003).
We identified significant relationships between waterbody (inner or outer fjord, open coast) and sediment stock for Cstock (ANOVA, F2,47 = 9.39, p < 0.001) and Nstock (ANOVA, F2,44 = 4.10, p = 0.02) but not for Pstock (ANOVA, F2,33 = 0.42, p = 0.52). Cstock was significantly higher in inner fjord locations than in outer fjords (post hoc, p < 0.001) whereas Nstock was significantly higher in inner fjords compared to open coast (post hoc, p = 0.03) (Figure 3 and Supplementary Table S2). Neither silt-clay content nor level of exposure differed significantly between waterbodies, but the water depth of the sampling sites differed significantly between waterbodies (ANOVA, F2,43 = 5.76, p = 0.006) and was on average significantly higher in outer fjords compared to the inner fjords (post hoc, p = 0.006), reflecting that the depth range of eelgrass is deeper in outer fjords (Riemann et al., 2016).
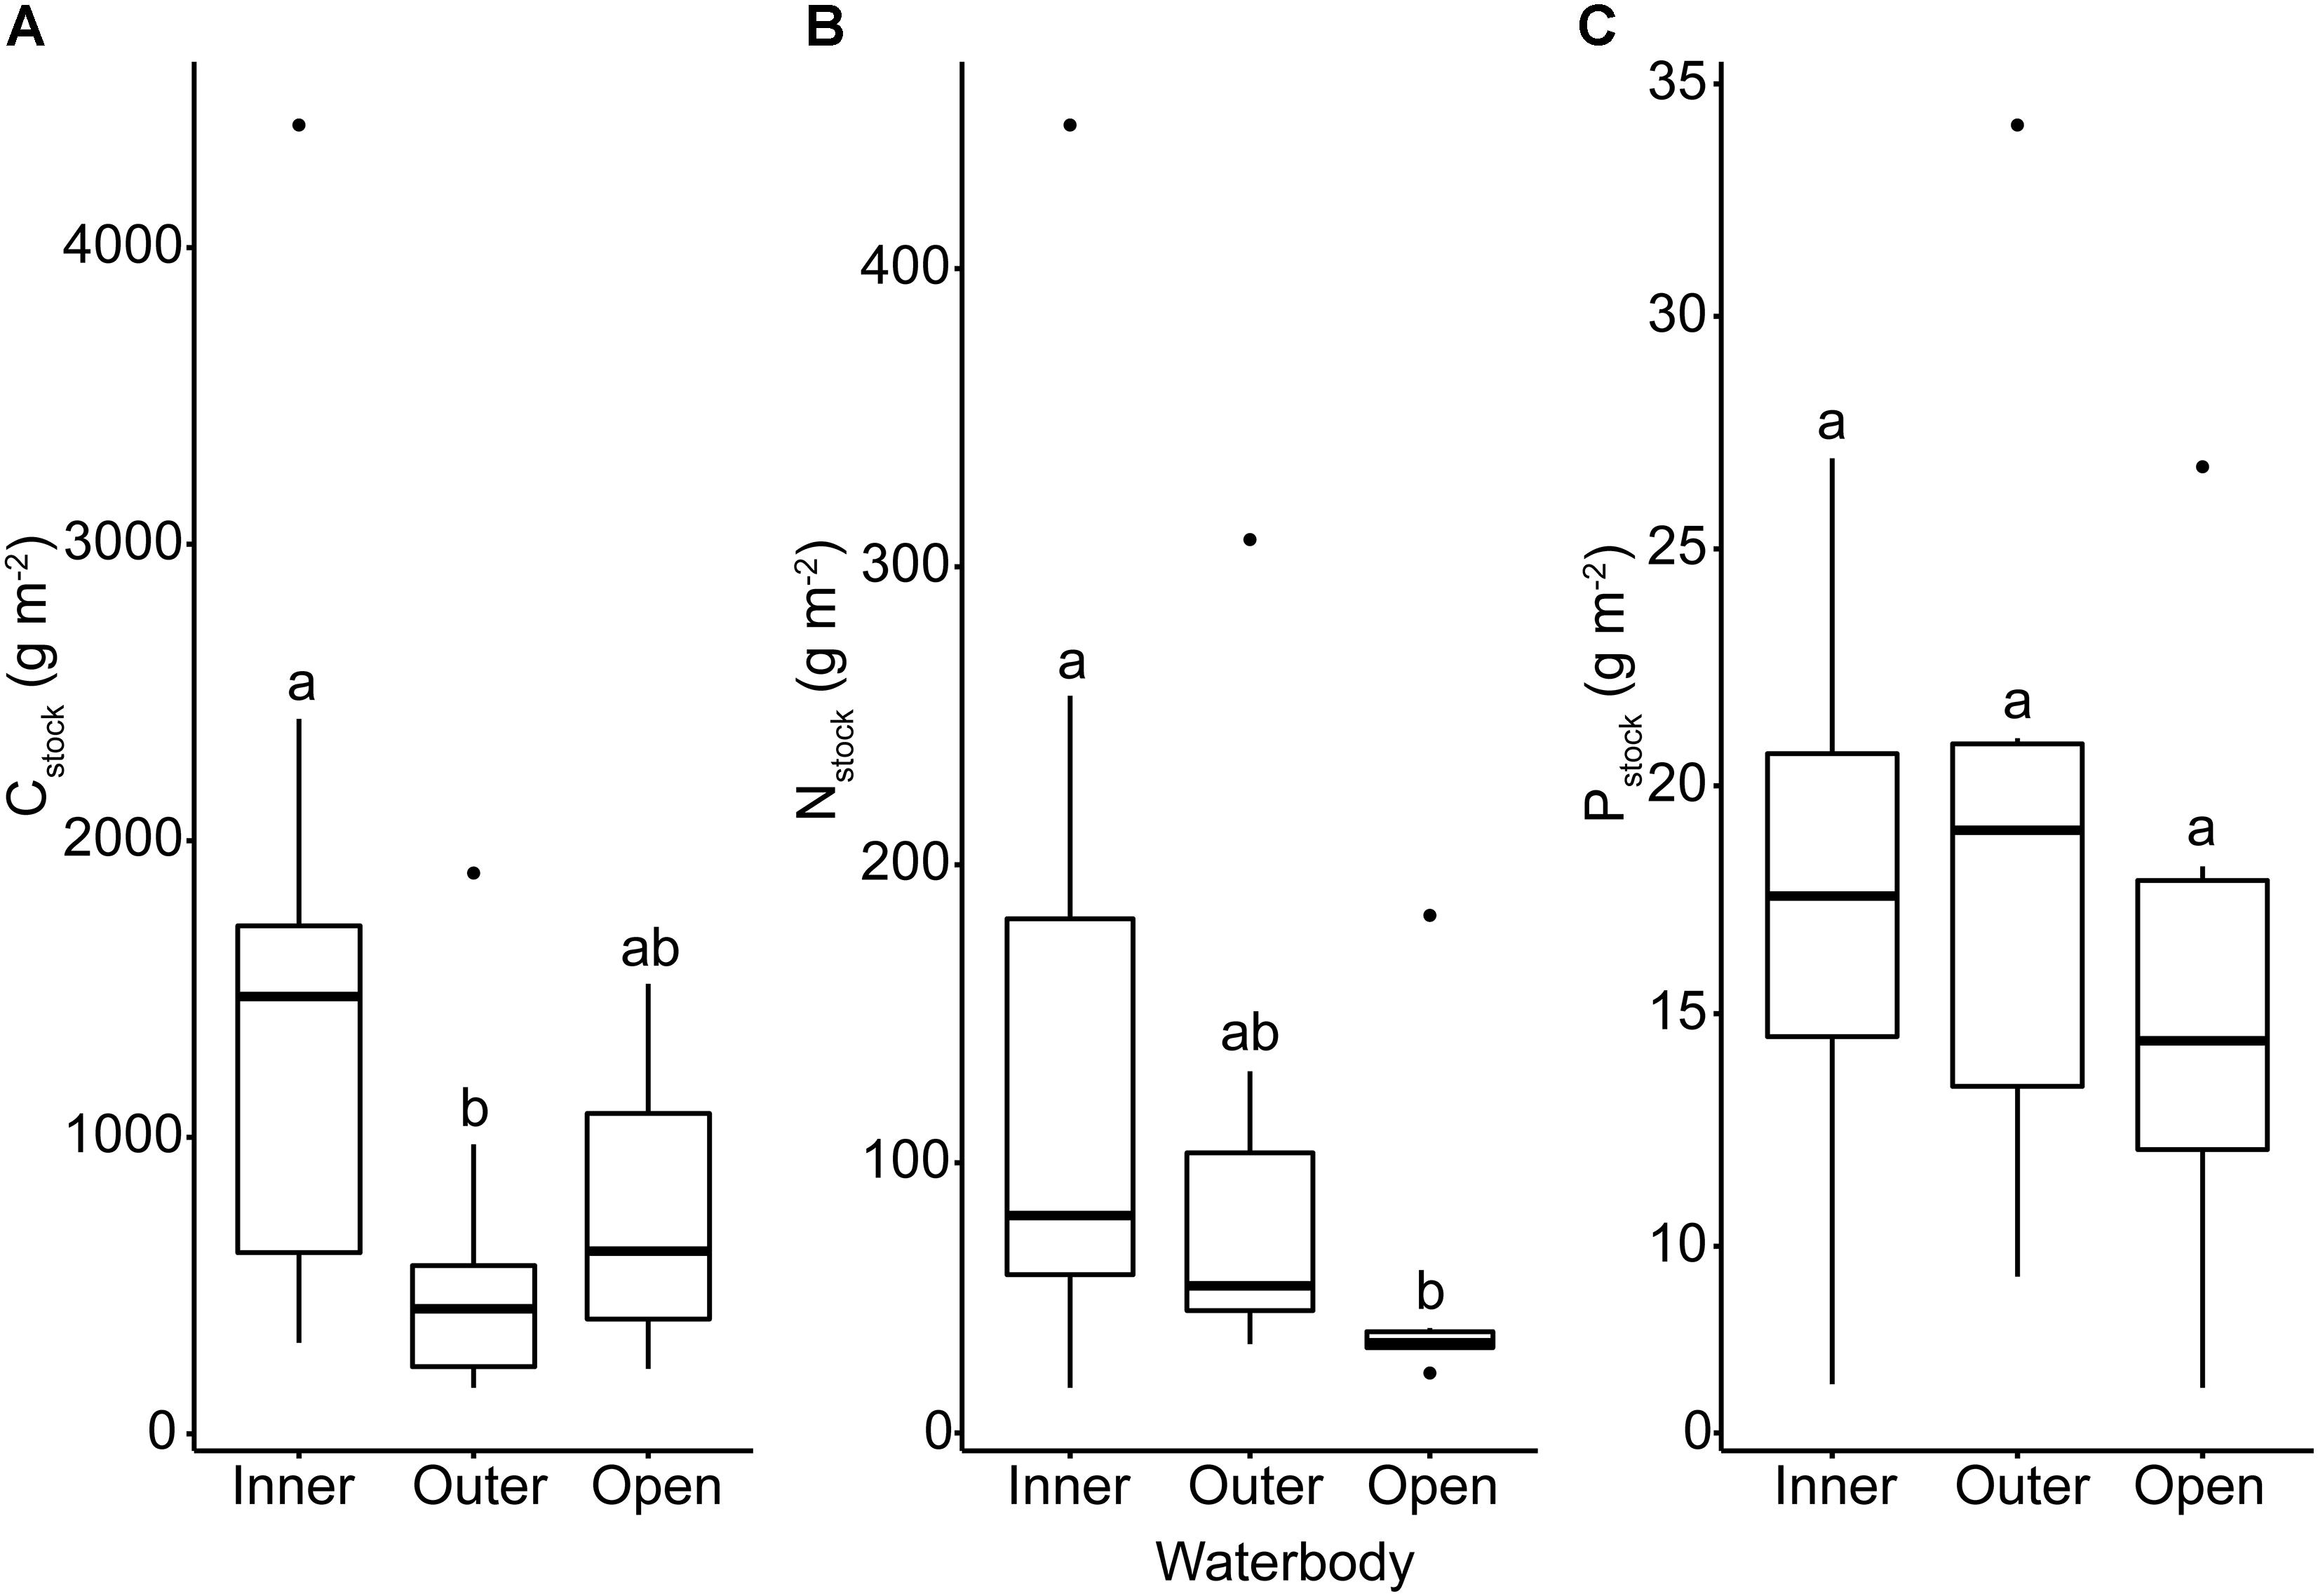
Figure 3. Box plots of Danish eelgrass sediment stocks of (A) carbon, (B) nitrogen, and (C) phosphorus grouped by waterbody. Letters above boxes indicate significance at the α < 0.05 level.
Drivers of Variability
Sediment Properties
The silt-clay content in the sediment revealed a positive linear relationship with Cstock, Nstock, and Pstock with the highest slope for Cstock and highest R2 value (0.30) for Nstock (Figure 4 and Supplementary Figures S4, S5).
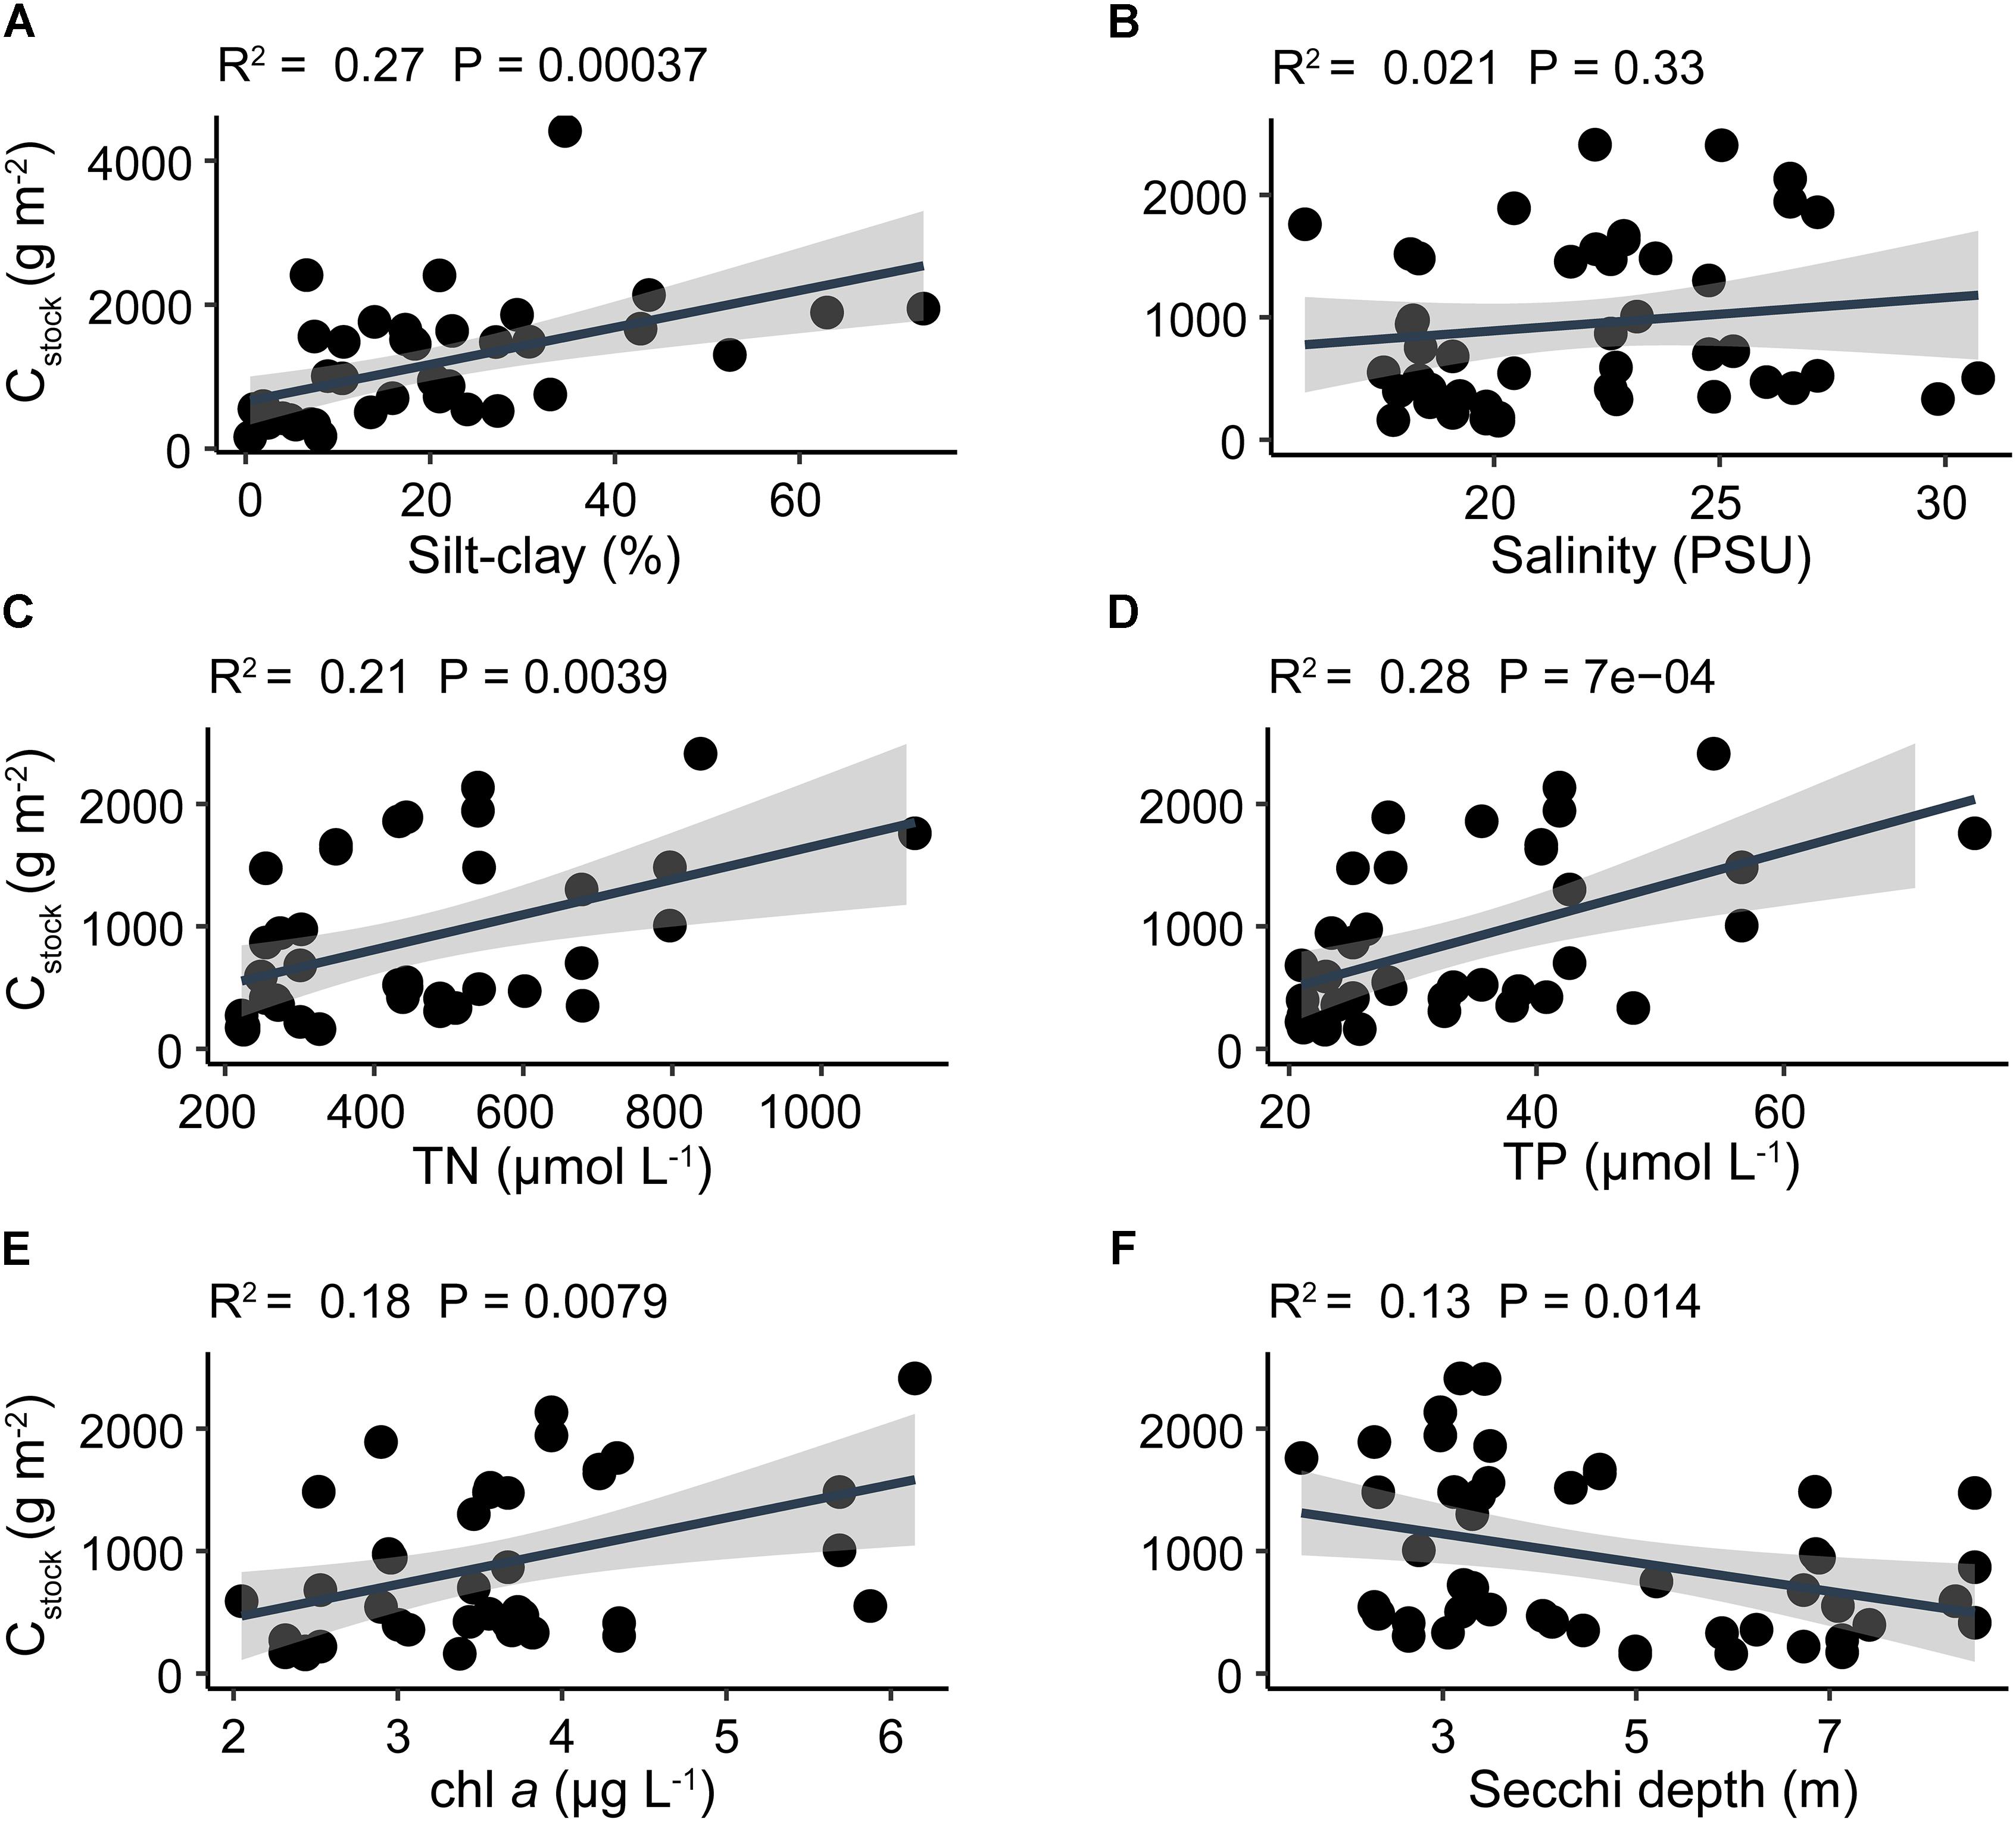
Figure 4. Linear regression analyses of average Cstock and (A) sediment silt-clay content, (B) water column salinity, (C) total nitrogen, (D) total phosphorus, (E) chlorophyll a, and (F) Secchi depth. Black solid line indicates the best fit line result of linear regression and shaded area indicates 95% confidence interval. Note that the y-axis limit in panel (A) is different from other panels.
Silt-clay content was not significantly correlated with exposure (p = 0.29). Similarly, exposure was not significantly related to Cstock (p = 0.37), Nstock (p = 0.41), or Pstock (p = 0.15).
Water Column Properties
Water column concentrations of TN, TP, and chl a exhibited a similar pattern as sediment stocks and were all significantly different between waterbodies (ANOVA, F2,39 = 6.43, p = 0.004; F2,39 = 8.66, p < 0.001; F2,42 = 6.56, p = 0.003, respectively) (Supplementary Figure S2). TP was significantly higher in inner fjords compared to open coasts (post hoc, p = 0.02), whereas TN, TP and chl a were significantly higher in inner fjords compared to outer fjords (post hoc, p < 0.05) (Supplementary Figure S2). For the entire dataset, DIN and DIP exhibited strong linear correlations with TN (TN = 2.6⋅DIN ++ 260, R2 = 0.92, p < 0.001) and TP (TP = 1.7⋅DIP + 18, R2 = 0.85, p < 0.001; figure not shown), respectively. On average (mean ± SE), DIN accounted for 13.8 ± 1.2% of TN and DIP accounted for 25.8 ± 1.6% of TP.
Salinity showed a different pattern with lowest salinities in inner (22.8 ± 0.6) and outer fjords (22.0 ± 0.8) compared to open coast (18.2 ± 0.2) (ANOVA, F3,47 = 4.25, p = 0.001) (Supplementary Figure S3). Across all sites, salinity ranged from 15.8 to 30.7 and was lowest around Funen and highest in Nissum Bredning, Limfjorden, close to the mouth connecting to the North Sea (Supplementary Figure S3).
Cstock displayed a significant positive correlation with both water column nutrient concentrations and chl a, and a significant negative correlation with Secchi depth (Figure 4). In contrast, Nstock and Pstock displayed no significant correlations with any water column parameter (Supplementary Figures S4, S5). Furthermore, no significant correlation was observed between any of the water column parameters and silt-clay content, except for Secchi depth which exhibited a significant negative correlation with silt-clay content, displaying the highest silt-clay content at low Secchi depths (Supplementary Table S3). Elemental ratios in the sediment were not related to water column nutrients, except that sediment N:P ratio was positively related to TP concentration in the water column (p = 0.03). The variation in sediment elemental ratios was highest in C:N, followed by C:P and N:P as indicated by their respective coefficients of variation (CV = standard deviation/mean) of 0.84, 0.58, and 0.57, respectively (Supplementary Table S4).
Model Predictions
The three GLMs, based on a subset of sites for which all variables were measured, overall supported the patterns of the variable-by-variable linear regression analyses. Consistent for all three sediment stocks was that silt-clay content was significantly positively related to stock size (Table 1). In contrast to the simple linear regression analyses, however, chl a was the only other variable that was significantly related to Cstock (p = 0.01) and Secchi depth was significantly related to Nstock (p = 0.005). As expected, water column concentrations of TN and TP exhibited the largest multicollinearity (Table 1) and were strongly correlated (slope = 15.1, R2 = 0.82, p < 0.001).
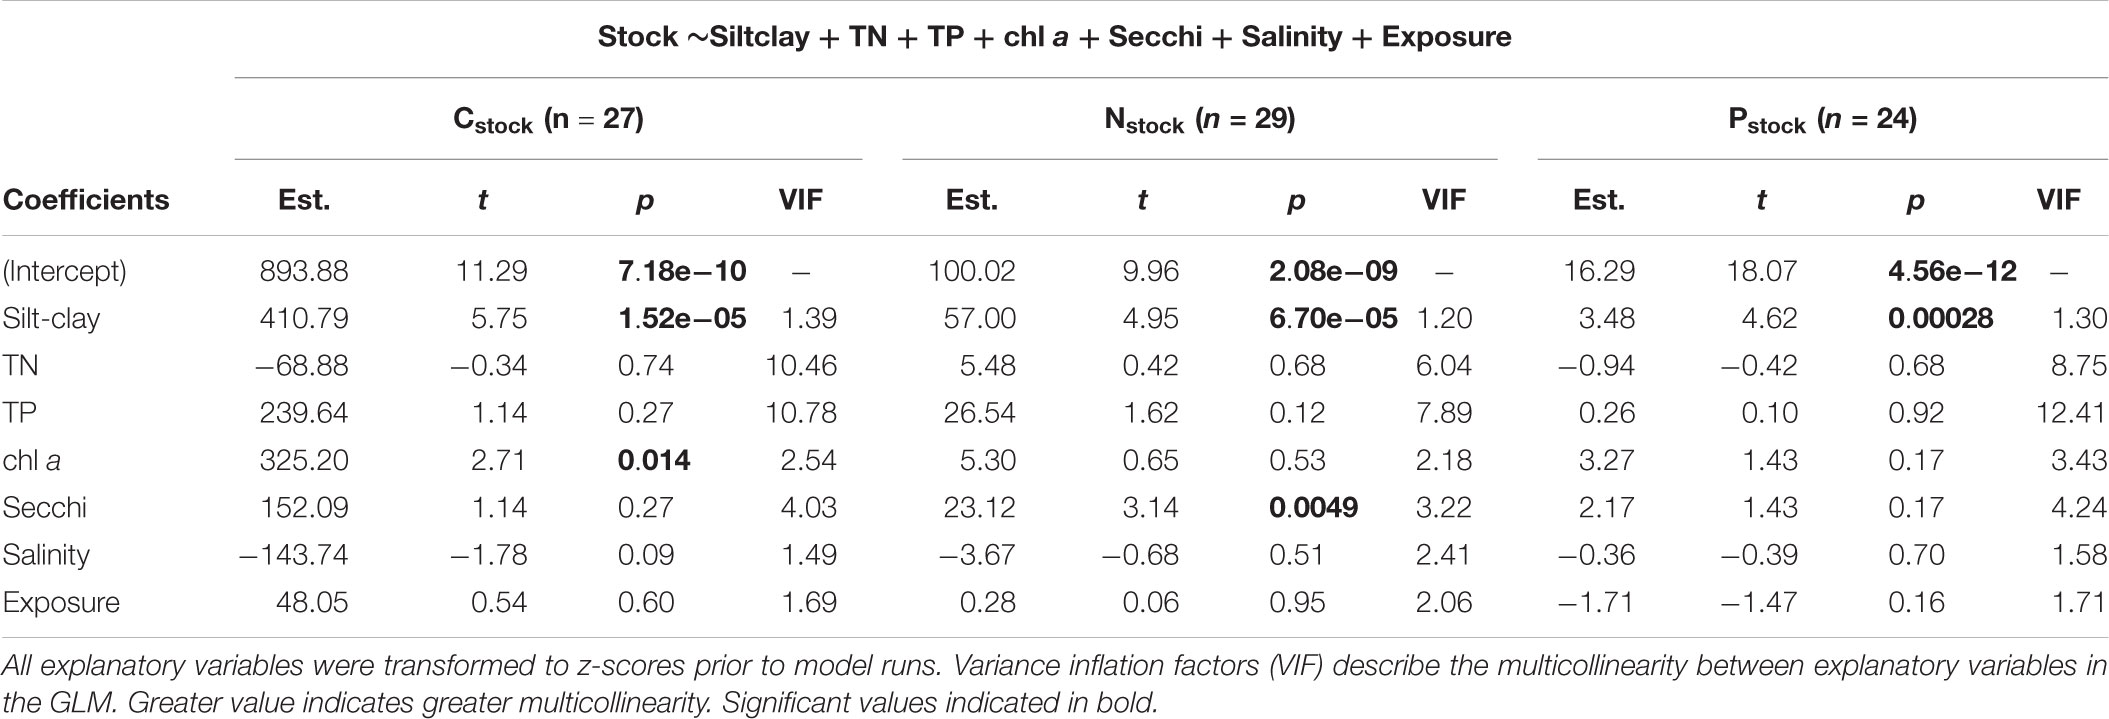
Table 1. Summary table of generalized linear model results.
Overall, the GLM predictions performed well and yielded R2 values of 0.78, 0.66, and 0.71 for Cstock, Nstock, and Pstock, respectively (Figure 5).
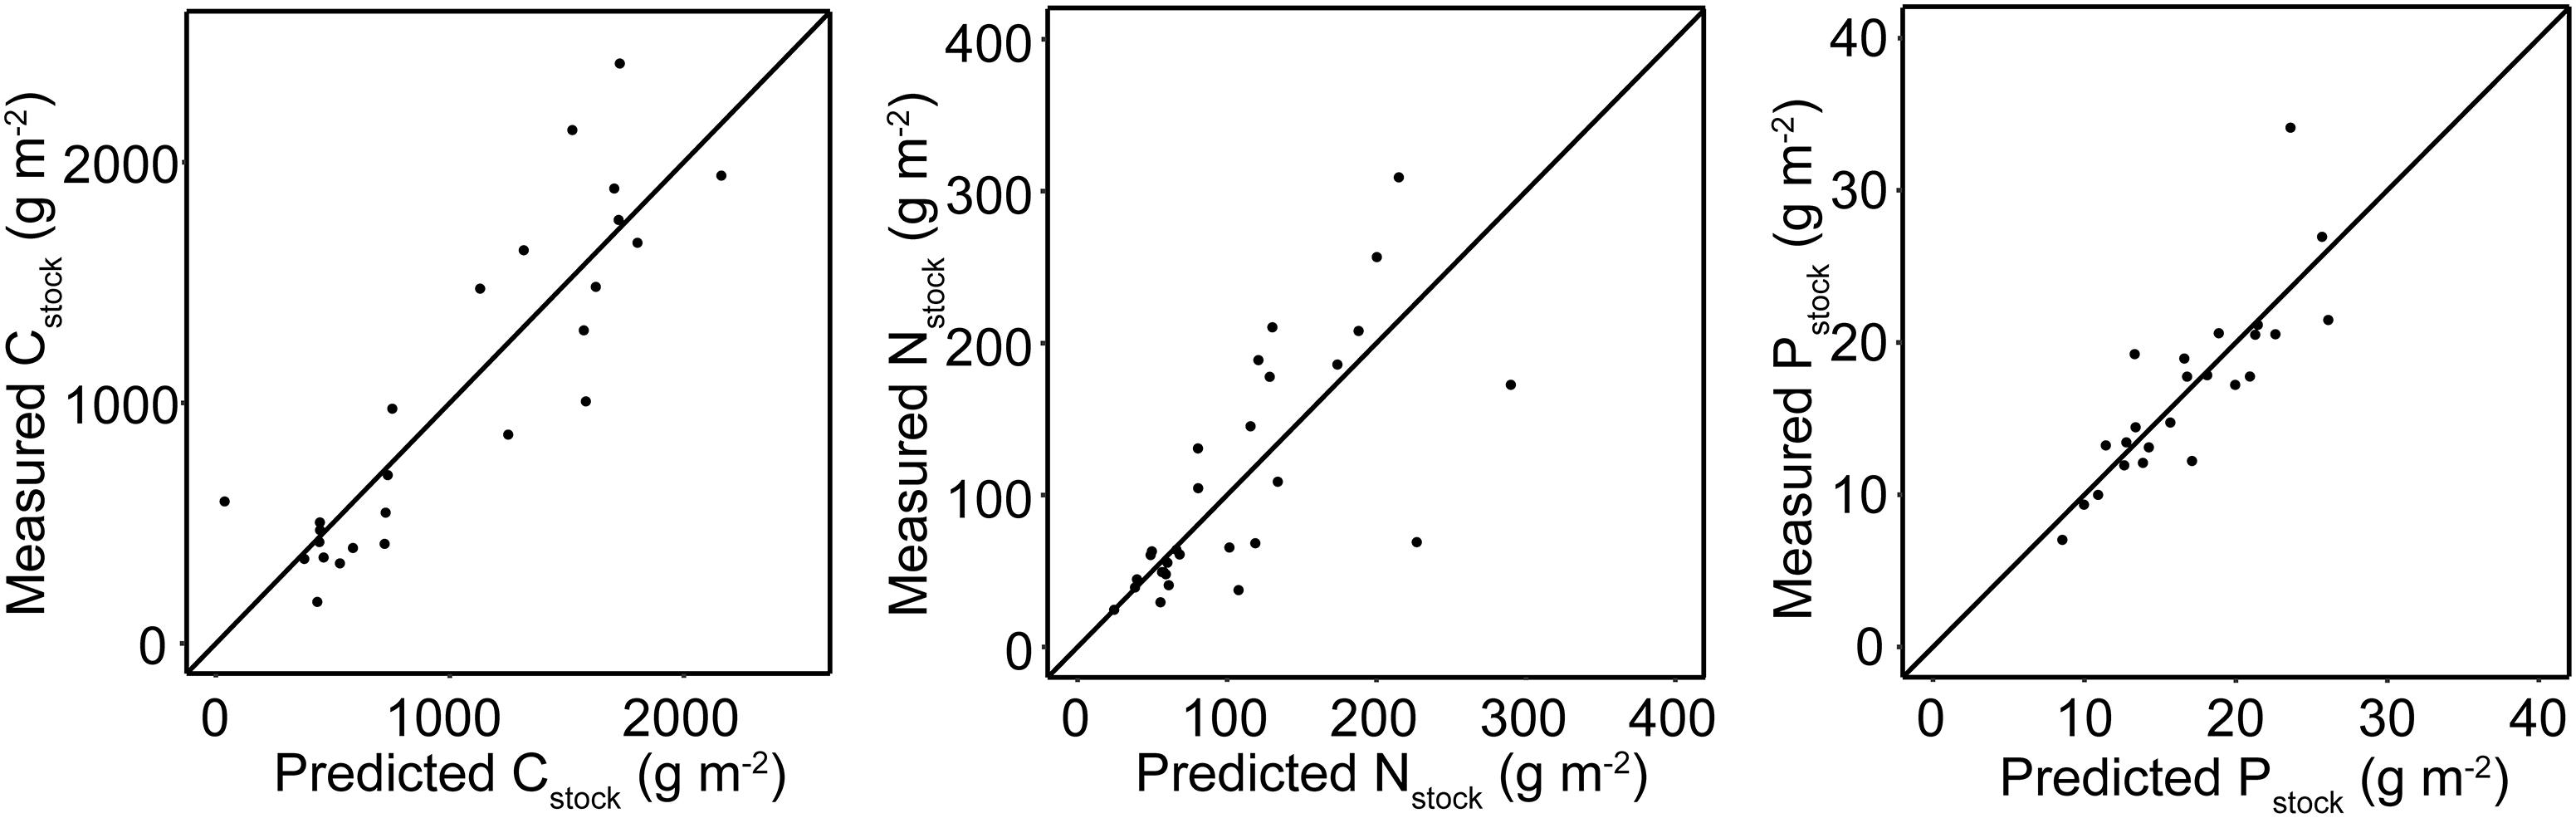
Figure 5. Predicted vs. actual values of sediment stocks generated by the GLMs. The diagonal line has a slope of 1 and intercept of 0.
Discussion
C, N, P Stocks in Danish Eelgrass Sediments
We observed large spatial variability in sediment stocks of carbon, nitrogen, and phosphorus where sheltered, inner fjord locations generally comprised larger stocks whereas outer fjords and open coasts exhibited stocks that were sometimes orders of magnitude lower. These findings demonstrate the necessity of considering spatial variability when assessing regional or national sediment stocks and provide guidance into which eelgrass areas may be of particular importance as reservoirs of these elements.
Sediment Characteristics and Exposure as Explanatory Variables for the Variability in Eelgrass Sediment Stocks
As hypothesized, we observed strong positive relationships between fine-grained material (silt-clay) in the sediment and Cstock, Nstock, and Pstock, which is in line with previous studies on eelgrass sediment carbon content (e.g., Dahl et al., 2016; Röhr et al., 2016; Mazarrasa et al., 2017; Oreska et al., 2017a; Röhr et al., 2018). In general, the grain size composition of marine sediments is controlled by the hydrodynamic regime and is often considered a useful proxy for wave- and current exposure (Yang et al., 2008; Cabaço et al., 2010; Mazarrasa et al., 2017). In absence of in situ current or exposure measurements, we utilized the publicly available EUSeaMap exposure layer. Notably, we did not find a relationship between level of exposure and silt-clay content in the sediment. This could be due to the relatively coarse resolution of the exposure layer used (300 m × 300 m) compared to the point measurements that the sampled cores constitute. The exposure layer also does not address temporal differences in exposure between sites, being based on mean wind conditions for a 5-year period between 2002 and 2007. Moreover, the level of exposure is strongly depth-dependent where the generally shallower sampling depths in inner fjords in this study represent a higher exposure level than the deeper sampling depths in outer fjords and open coast locations. However, we did not observe a significant relationship between water depth and silt-clay content or sediment stocks. The lack of correlation between silt-clay content and exposure may also be due to the attenuating effect of the eelgrass canopy on hydrodynamic energy which allows for fine-grained particles to settle, in addition to the stabilizing effect of the rhizosphere on limiting resuspension (Fonseca et al., 1982; De Boer, 2007; Hansen and Reidenbach, 2012). Lastly, considering that our sites ranged from semi-enclosed estuaries to open coast, variable patterns in sediment discharge from run-off may explain the lacking correlation, where low-exposure sites are often located in areas of higher riverine and/or terrestrial sediment input compared to the open coast and thereby offsetting the role of eelgrass.
Eutrophication Effects on Eelgrass Sediment Stocks
The literature is equivocal regarding the effects of eutrophication on seagrass carbon storage and burial, reporting both higher storage and burial due to an increased input of sestonic particles (Gacia et al., 2002; Mazarrasa et al., 2017; Samper-Villarreal et al., 2017), and decreased storage and burial due to detrimental effects on seagrass productivity and survival (Macreadie et al., 2012; Jiang et al., 2018). Here, the level of eutrophication appeared to increase Cstock (Figures 4C–F and Table 1), suggesting that Danish eelgrass meadows have a relatively high reliance on allochthonous carbon (Oreska et al., 2017b). In fact, for 10 of the sites used in this study, the eelgrass net primary production only explained 2.3% of the variation in Cstock indicating a low contribution of autochthonous carbon (Röhr et al., 2016). Moreover, the positive relation between Cstock and silt-clay content and turbidity (Secchi depth) observed in this study suggests that the sources of carbon in the eelgrass sediment are largely of allochthonous origin (Samper-Villarreal et al., 2016). This was also demonstrated for 10 of the sites where analysis of stable isotopes (δ13C and δ15N) and C:N ratios in sediments and in carbon sources was carried out (Supplementary Table S1). An isotope mixing model suggested that the carbon content in eelgrass sediments was largely comprised (up to 78%) of sestonic particles (e.g., phytoplankton and macroalgae), further pointing to the influence of allochthonous carbon on Cstock (Röhr et al., 2016; Kindeberg et al., unpublished).
Unexpectedly, Nstock or Pstock were uncorrelated with water column nutrient concentrations (Table 1 and Supplementary Figures S4, S5). This could be due to the lower sample size for these stocks compared to Cstock which thus did not cover the entire range of eutrophication levels (TN: 248–1123 μmol L-1; TP: 21–75 μmol L-1; chl a: 2–6 μg L-1). Moreover, it may reflect the different burial efficiencies and remineralization rates for the three elements due to differing nutrient content of the sediment OM, where OM rich in nutrients (low C:N and C:P ratios) is decomposed faster and to a larger extent than nutrient-depleted OM (Kristensen and Hansen, 1995; Banta et al., 2004; McGlathery et al., 2007). It is difficult to ascertain the processes affecting relationships between sediment stocks and C:N:P ratios as elemental ratios of OM (e.g., eelgrass leaves and phytoplankton) are affected both by nutrient supply and light availability, and a confounding effect of eutrophication on increased nutrients and associated decreased light on productivity may also confound the effects of OM decomposition (Zimmerman et al., 1987; Grice et al., 1996). Overall, we observed a quite large variability in C:N:P ratios across the different sites (Supplementary Table S4), illustrating the spatial difference in sources and/or age of OM and nutrient availability as well as sediment biogeochemistry (Fourqurean et al., 1997; Kennedy et al., 2010).
Nutrient dynamics in eelgrass sediments are comprised of many complex processes, some of which are directly governed by uptake of dissolved nutrients in the water column and sediment porewaters and others that are facilitated by the rhizosphere’s microbial communities (Pedersen et al., 2004). These dynamics may explain the lack of correlation between water column nutrients and Nstock and Pstock. Pedersen and Borum (1993) estimated a total annual uptake rate of nitrogen of 25.3–50 g m-2 year-1 in an eelgrass meadow in Øresund, Denmark, of which 38–64% was attributed to the roots’ uptake from sediment porewater. If uptake into eelgrass biomass is high and this biomass is subsequently exported out of the system (e.g., during storms), this could account for a significant loss term. Depending on the fraction of the plant detritus that is subsequently deposited in the sediment compared to exported elsewhere (Heck et al., 2008; Duarte and Krause-Jensen, 2017), this could be a factor which may explain the discrepancy between available nutrients in the water column and nutrient stocks in the sediment.
In addition, denitrification and anammox are both loss processes that convert inorganic nitrogen into nitrogen gas (N2, N2O, or NO) which escapes the sediment, and have been shown to be a major contributing process to nitrogen loss in seagrass habitats (Eyre et al., 2016; Reynolds et al., 2016). Rates of eelgrass-associated denitrification differ between studies (3.2–10.1 mg N m-2 d-1) but the net effect on the sediment nitrogen fluxes should also consider nitrogen fixation, which can be significant (1.2–6.5 mg N m-2 d-1) (see e.g., Flindt, 1994; McGlathery et al., 1998; Risgaard-Petersen and Ottosen, 2000; Welsh, 2000; Welsh et al., 2000; Cole and McGlathery, 2012; Russell et al., 2016). Although dependent on several factors and far from straightforward, denitrification rates typically increase and nitrogen fixation rates decrease in seagrass sediments with increasing eutrophication (Seitzinger and Nixon, 1985; Howarth et al., 1988; Welsh, 2000; Seitzinger et al., 2006; Murray et al., 2015; Asmala et al., 2017). This could be a potential explanation as to why Nstock did not mirror the nutrient concentrations in the water column.
Phosphorus cycling in marine sediments is governed by a complex set of biogeochemical processes and is distributed into various pools, where phosphorus loosely adsorbed or bound to iron oxides (Fe-P complexes) are generally the largest pools (Ruttenberg, 1992). In carbonate-rich areas, phosphorus is also often tightly bound to calcium carbonate (CaCO3-P complexes) whereas in siliciclastic muddy sediments, phosphorus is considered relatively more available due to the effects of coupled sulfate- and iron-reduction on releasing iron-bound phosphorus (Canfield et al., 1993; Jensen et al., 1995). The effects of eutrophication on increasing sediment organic content may stimulate sulfate reduction thus releasing iron-bound phosphorus (Holmer et al., 2006). As opposed to its tropical seagrass counterparts, eelgrass growing in fine-grained, siliciclastic sediments is rarely limited by phosphorus, although contrasting evidence exists (Murray et al., 1992; Holmer et al., 2006). Eelgrass may even excrete some phosphorus into the water column (Brix and Lyngby, 1985), and depending on the rate and magnitude of this process, eelgrass may facilitate an efflux of phosphorus out of the sediment to the water column. Taken together, these two processes may mask the effects of water column nutrient concentrations on Pstock and could, in addition to export of eelgrass biomass, explain the lack of correlation in our dataset.
Notably, neither water column nutrients nor chl a were significantly correlated with silt-clay, suggesting a spatial dependence in the explanatory power of these variables and it is therefore difficult to attribute the variability in stocks solely to either factor. Both eutrophication and too high silt-clay content can have negative effects on eelgrass subsistence and the positive effects on stock size observed here are likely to diminish when reaching a certain threshold (De Boer, 2007; Viaroli et al., 2008). Eelgrass is, as seagrasses in general, sensitive to turbidity and organic-rich sediments due to high light requirements and sensitivity to highly reducing sediments (Goodman et al., 1995; Holmer and Bondgaard, 2001; Kemp et al., 2004; Ochieng et al., 2010). Once a tipping point is exceeded and the eelgrass is lost, the system can enter an alternative stable state where sediments are eroded, and the stored carbon, nitrogen, and phosphorus can re-enter the water column (Pendleton et al., 2012; Arias-Ortiz et al., 2017; Moksnes et al., 2018). Depending on the bioavailability of the eroded nutrients, this efflux can result in net CO2 emissions and fuel a positive feedback loop on water quality deterioration. Further investigation into this complex balance is warranted and in particular the observed decoupling between the effects of eutrophication and sediment silt-clay content on a larger spatial scale should be explored further.
Danish Eelgrass Sediment Stocks in a Broader Seagrass Context
Due to the relatively shallow sediment depth (10 cm) used in this study, it is difficult to directly compare our results with those from other studies which usually assess sediment stocks based on deeper cores [e.g., ≥100 cm proposed as the practicable standard for carbon stock assessments (Howard et al., 2014; Emmer et al., 2015)] (Fourqurean et al., 2012a,b; Miyajima et al., 2015). However, when comparing the mean POC concentration (1.1 ± 0.07%) found in our study, Danish eelgrass sediments fall within the lower end of the global range of 0–48.2% and below the global mean of 2.5 ± 0.1% for seagrasses (Fourqurean et al., 2012a). Nevertheless, the identified POC concentrations are well above the reported estimates for Z. marina in the southern Baltic Sea (0.14%, Jankowska et al., 2016) and similar to the recently reported global average for Z. marina of 1.4 ± 0.4% (Röhr et al., 2018). It should be noted, however, that mean POC concentration alone does not provide information of the total accumulated carbon in the sediment (Cstock), which requires information on sediment density and integration over sediment depth (Howard et al., 2014).
Similar to our study, Jankowska et al. (2016) measured Cstock in the top 10 cm, sampled in eelgrass meadows in a sheltered inner bay, an exposed outer bay, and a shallow open coast area in Puck Bay, Poland. In accordance with our results, the highest Cstock values were found in the sheltered, inner location (228.0 ± 11.6 g C m-2) and lowest in the exposed, outer location (50.2 ± 2.2 g C m-2). However, these values are about an order of magnitude lower than the average Cstock we observed in respective waterbodies in Denmark (Inner fjord: 1357 ± 173 g C m-2, Outer fjord: 525 ± 117 g C m-2; Supplementary Table S2), which could partly be due to a higher fraction of larger grain sizes (mean φ = 1.68–2.39) in Puck Bay.
Postlethwaite et al. (2018) measured Cstock in three eelgrass meadows in Clayoquot Sound, BC, Canada, but integrated over deeper sediment depths (34 cm on average) compared to our study. They found Cstock to range from 820 ± 26 g C m-2 in areas with sandier sediments closest to the coast and up to 2099 ± 365 g C m-2 near the river mouth. Considering that these Cstock measurements were obtained from more than three times as deep cores than used in our study, their values are generally lower than presented here, as their carbon depth profiles were relatively stable with depth. This difference could partly be due to the more pristine conditions with low anthropogenic influence, high Secchi depth (4.8–8.8 m), and likely lower sediment discharge as compared to most of the sites in Denmark (Postlethwaite, 2018; Postlethwaite et al., 2018). A similar study was carried out south of British Columbia, in Puget Sound, Washington, DC, United States. Poppe and Rybczyk (2018) found eelgrass Cstock to range from 1180–1900 g C m-2, averaging at 1420 ± 110 g C m-2, but also here the integrated core depth was three times as deep (30 cm) as in our study. A recent comprehensive assessment of Cstock (integrated over 25 cm sediment depth) across the distributional range of Z. marina further established the spatial variability, which ranged from 318 ± 10 – 26523 ± 667 g C m-2, and averaged 2721 ± 989 g C m-2 (Röhr et al., 2018). In line with the results presented here, silt-clay content was found to be the most important predictor explaining 53% of the variation in Cstock. Among the largest observed stocks were typically found in sheltered locations in the Kattegat-Skagerrak ocean margin in which the sites in this study are located. Based on the datasets in the abovementioned studies, Danish eelgrass meadows seem to hold larger Cstock than other areas of comparable latitudes which highlights the influence of the local environmental setting.
Fewer studies have assessed nitrogen and phosphorus stocks in seagrass sediments and the current study is, to our knowledge, the largest-scale assessment available in the literature. McGlathery et al. (2012) measured the sediment nitrogen stock in the top 5 cm sediment in a 9-year-old restored eelgrass meadow in Virginia, United States and found an average Nstock of 16.2 g N m-2. Assuming a stable profile between 5–10 cm, and extrapolating across 10 cm, would put this restored eelgrass meadow (32.4 g m-2) on the lower end of the range of Nstock presented here (24–448 g m-2). While not explicitly assessing sediment stocks, Yang et al. (2018) measured the sediment nitrogen concentration in three eutrophic sites colonized by Z. marina and Z. japonica in northeastern China, where the average nitrogen content in the top 10 cm sediment was almost three times higher (0.35%) than what we found in Denmark. Fourqurean et al. (2012b) assessed nitrogen and phosphorus in the top 100 cm sediment in two seagrass systems (mainly Thalassia testudinum) in Western Australia and Florida, United States. The average nitrogen concentration in the sediment was similar between the two areas (0.15 ± 0.004 and 0.19 ± 0.01%, respectively), which is comparable to 0.12 ± 0.01% in our study. Phosphorus content exhibited much greater difference between their sites and was on average 87.7 ± 4.3 μg g-1 in Florida and 135.7 ± 3.6 μg g-1 in Australia, which is lower than what we found (310.1 ± 18.6 μg g-1) and was explained by the carbonate-rich sediments in these locations in which phosphorus content in the porewater is known to be low (Short, 1987; Fourqurean et al., 2012b).
Uncertainty, Limitations, and Future Direction
For best practices assessments of sediment stocks and long-term storage in seagrass meadows, sediment cores should ideally extend at least 100 cm to estimate buried carbon and nutrients below the depth of decomposition (Howard et al., 2014; Macreadie et al., 2014). One important caveat of assessing stocks in the top 10 cm is that this shallow sediment layer is considered biologically (e.g., bioturbation and -irrigation), physically (e.g., wave action, sediment resuspension) and biogeochemically (e.g., high remineralization rates, redox oscillations) active, and the sediment properties (including C, N, and P stocks) can vary over short time-scales (e.g., seasonal, annual) (Middelburg et al., 2004; Burdige, 2007; Johannessen and Macdonald, 2016). Consequently, although the top 10 cm in similar areas have been shown to represent approximately the past 60 years (Jankowska et al., 2016), any assertions regarding long-term carbon and nutrient storage cannot be adequately made (Johannessen and Macdonald, 2016; Nilsson, 2018). Normalizing stocks based on 10 cm cores to 25 or 100 cm requires untested assumptions of invariant change with sediment depth and that the 10 cm profile pattern is representative of deeper depths. However, deeper sediment cores (25 cm) from 10 sites in this study revealed that most depth profiles of carbon exhibited either a stable, or even increasing, pattern with sediment depth between 10–25 cm, especially in sites with large Cstock (Supplementary Figure S6), suggesting that the risk of overestimation may be limited in this case. Furthermore, from these sites the vertically extrapolated Cstock (from 10 to 25 cm) was generally lower than the measured Cstock with a mean offset (± SE) of 895 ± 527 g C m-2, corresponding to 64.7 ± 20.8% of the average Cstock. Although uncertainties associated with deeper extrapolation persist, the estimated Cstock values presented here should be considered conservative (Röhr et al., 2016).
A second limitation of this study is the lack of adjacent, unvegetated sites to allow for estimation of buried carbon and nutrients in the absence of eelgrass cover. However, Kennedy et al. (2010) reported almost twice as high median organic carbon content (0.34% compared to 0.19%) and total nitrogen (0.031% compared to 0.024%) in sediments within the seagrass meadow compared to adjacent bare. Similarly, Jankowska et al. (2016) observed 1.5–4.8 times higher organic carbon concentrations and 1.6–3.1 times higher nitrogen concentrations in eelgrass-vegetated sediments compared to unvegetated. Similar differences in OM content between vegetated and unvegetated reference sediments have also been documented elsewhere (see e.g., Miyajima et al., 1998; Ricart et al., 2015; Postlethwaite et al., 2018). This aspect should, however, be a focal point in future studies as the lack of unvegetated reference sediment is prevalent in the seagrass sediment stock literature. Yet, selecting a reference is by no means uncomplicated as both the OM produced by seagrass itself and the sestonic particles it captures have been documented to bury far away from the canopy (Kennedy et al., 2010; Duarte and Krause-Jensen, 2017).
A third important consideration concerning studies on seagrass sediment storage is the ability to scale measurements to basin-wide, regional, or even global level. Large scale extrapolation of sediment stocks warrants considerable precaution, as spatial (and temporal) variability is large not only between meadows as shown here, but can also be significant within meadows (Oreska et al., 2017a). Any upscaling of meadow point measurements therefore requires assumptions of invariable abiotic properties (e.g., hydrodynamic regime, residence time, sediment dynamics, geomorphology, water column chemistry) and biotic properties (e.g., meadow configuration, productivity, shoot density). This aspect was to some extent illustrated in the, albeit limited, discrepancy between the results of the GLM and the variable-by-variable regressions where the number of sites and environmental settings differed. Nevertheless, there is a need to provide stakeholders, managers, and policymakers with incentives to conserve and protect these valuable habitats, which are declining at rapid rates (Orth et al., 2006; Waycott et al., 2009). However, rather than producing first-order estimates of sediment storage on a larger scale, we emphasize the small-scale spatial variability and provide guidance into selecting high priority areas for carbon and nutrient storage on the local scale. Denmark does indeed comprise hotspots for carbon and nutrient storage, which can be targeted as high priority areas in the management of seagrass meadows for mitigation of climate change and eutrophication. By further pinning down the associated environmental factors, this study also indicates where additional hotspots may be located. All in all, this nationwide information on C, N, and P stocks highlights the combined climate change and eutrophication mitigation potentials of eelgrass meadows and thereby stimulates incentives for conservation efforts.
Conclusion
In this study, we have further established the large spatial variability in sediment storage of carbon, nitrogen, and phosphorus in seagrass systems. Our study is the first to assess these three elements in concert for a single species on a nationwide basis covering a variety of waterbodies. We have shown that carbon and nitrogen stocks are higher in sheltered inner fjords compared to more exposed locations. Furthermore, we have shown that environmental factors that are often considered detrimental to eelgrass, such as eutrophication and high sediment mud content (De Boer, 2007), to a certain extent have a positive effect on the sediment stocks and this intricate balance should be explored further. The heterogeneous nature of eelgrass sediment stocks and the varying influence of environmental parameters observed here highlights the importance of considering the environmental setting when assessing carbon and nutrient storage in sediments, constructing regional budgets, and evaluating ecosystem services in eelgrass meadows on a national scale.
Author Contributions
TK, SØ, MH, and DK-J conceived and designed the study. MR collected the data. TK and SØ carried out data analysis. TK drafted the manuscript. All authors revised and approved the manuscript.
Funding
This work was built upon initial work presented (TK) at the 4th International Symposium on Research and Management of Eutrophication in Coastal Ecosystems (EUTRO2018). The study was part of the project Havets skove, funded by the Villum Foundation (Grant Number 18530).
Conflict of Interest Statement
The authors declare that the research was conducted in the absence of any commercial or financial relationships that could be construed as a potential conflict of interest.
Acknowledgments
We would like to thank Prof. Jacob Carstensen for providing water column chemistry data from the DNAMAP database. DK-J also acknowledges support from the Ministry of Environment and Food of Denmark (contract 33010-NIFA-16651) and from the Danish Centre for Environment and Energy. We thank CG, JH, and TO for constructive comments that significantly improved the quality of this paper.
Supplementary Material
The Supplementary Material for this article can be found online at: https://www.frontiersin.org/articles/10.3389/fmars.2018.00474/full#supplementary-material
Footnotes
References
Andersen, J. H., Schlüter, L., and Ærtebjerg, G. (2006). Coastal eutrophication: recent developments in definitions and implications for monitoring strategies. J. Plankton Res. 28, 621–628. doi: 10.1093/plankt/fbl001
Arias-Ortiz, A., Serrano, O., Masqué, P., Lavery, P. S., Mueller, U., Kendrick, G. A., et al. (2017). A Marine Heat wave Drives Massive Losses from the World’s Largest Seagrass Carbon Stocks. Perth: Edith Cowan University. doi: 10.1038/s41558-018-0096-y
Asmala, E., Carstensen, J., Conley, D. J., Slomp, C. P., Stadmark, J., and Voss, M. (2017). Efficiency of the coastal filter: nitrogen and phosphorus removal in the Baltic Sea. Limnol. Oceanogr. 62, S222–S238. doi: 10.1002/lno.10644
Banta, G., Pedersen, M. F., and Nielsen, S. L. (2004). Decomposition of Marine Primary Producers: Consequences for Nutrient Recycling and Retention in Coastal Ecosystems. Dordrecht: Kluwer Academic.
Barrón, C., Apostolaki, E. T., and Duarte, C. M. (2014). Dissolved organic carbon fluxes by seagrass meadows and macroalgal beds. Front. Mar. Sci. 1:42. doi: 10.3389/fmars.2014.00042
Belshe, E. F., Hoeijmakers, D., Herran, N., Mtolera, M., and Teichberg, M. (2017a). Seagrass community-level controls over organic carbon storage are constrained by geophysical attributes within meadows of Zanzibar, Tanzania. Biogeosciences 15, 4609–4626. doi: 10.5194/bg-2017-474
Belshe, E. F., Mateo, M. A., Gillis, L. G., Zimmer, M., and Teichberg, M. (2017b). Muddy waters: unintentional consequences of blue carbon research obscure our understanding of organic carbon dynamics in seagrass ecosystems. Front. Mar. Sci. 4:125. doi: 10.3389/fmars.2017.00125
Bergamaschi, B. A., Tsamakis, E., Keil, R. G., Eglinton, T. I., Montluçon, D. B., and Hedges, J. I. (1997). The effect of grain size and surface area on organic matter, lignin and carbohydrate concentration, and molecular compositions in Peru Margin sediments. Geochim. Cosmochim. Acta 61, 1247–1260. doi: 10.1016/S0016-7037(96)00394-8
Boström, C., Baden, S., Bockelmann, A.-C., Dromph, K., Fredriksen, S., Gustafsson, C., et al. (2014). Distribution, structure and function of Nordic eelgrass (Zostera marina) ecosystems: implications for coastal management and conservation. Aquat. Conserv. Mar. Freshw. Ecosyst. 24, 410–434. doi: 10.1002/aqc.2424
Brix, H., and Lyngby, J. (1985). Uptake and translocation of phosphorus in eelgrass (Zostera marina). Mar. Biol. 90, 111–116. doi: 10.1007/BF00428221
Burdige, D. J. (2007). Preservation of organic matter in marine sediments: controls, mechanisms, and an imbalance in sediment organic carbon budgets? Chem. Rev. 107, 467–485. doi: 10.1021/cr050347q
Cabaço, S., Ferreira,Ó., and Santos, R. (2010). Population dynamics of the seagrass Cymodocea nodosa in Ria Formosa lagoon following inlet artificial relocation. Estuar. Coast. Shelf Sci. 87, 510–516. doi: 10.1016/j.ecss.2010.02.002
Canfield, D. E., Jørgensen, B. B., Fossing, H., Glud, R., Gundersen, J., Ramsing, N. B., et al. (1993). Pathways of organic carbon oxidation in three continental margin sediments. Mar. Geol. 113, 27–40. doi: 10.1016/0025-3227(93)90147-N
Christiansen, C., and Emelyanov, E. (1995). Nutrients and organic matter in southern Kattegat—western Baltic Sea sediments: effects of resuspension. Geogr. Tidsskr. 95, 19–27. doi: 10.1080/00167223.1995.10649360
Cloern, J. E. (2001). Our evolving conceptual model of the coastal eutrophication problem. Mar. Ecol. Prog. Ser. 210, 223–253. doi: 10.3354/meps210223
Cole, L. W., and McGlathery, K. J. (2012). Nitrogen fixation in restored eelgrass meadows. Mar. Ecol. Prog. Ser. 448, 235–246. doi: 10.3354/meps09512
Dahl, M. (2017). Natural and Human-Induced Carbon Storage Variability in Seagrass Meadows. Doctoral thesis, Stockholm University, Stockholm.
Dahl, M., Deyanova, D., Gütschow, S., Asplund, M. E., Lyimo, L. D., Karamfilov, V., et al. (2016). Sediment properties as important predictors of carbon storage in Zostera marina meadows: a comparison of four European areas. PLoS One 11:e0167493. doi: 10.1371/journal.pone.0167493
Dauwe, B., Middelburg, J. J., and Herman, P. M. (2001). Effect of oxygen on the degradability of organic matter in subtidal and intertidal sediments of the North Sea area. Mar. Ecol. Prog. Ser. 215, 13–22. doi: 10.3354/meps215013
De Boer, W. (2007). Seagrass–sediment interactions, positive feedbacks and critical thresholds for occurrence: a review. Hydrobiologia 591, 5–24. doi: 10.1007/s10750-007-0780-9
Duarte, C. M., and Krause-Jensen, D. (2017). Export from seagrass meadows contributes to marine carbon sequestration. Front. Mar. Sci. 4:13. doi: 10.3389/fmars.2017.00013
Duarte, C. M., Losada, I. J., Hendriks, I. E., Mazarrasa, I., and Marbà, N. (2013). The role of coastal plant communities for climate change mitigation and adaptation. Nat. Clim. Chang 3, 961–968. doi: 10.1038/nclimate1970
Duarte, C. M., Marbà, N., Gacia, E., Fourqurean, J. W., Beggins, J., Barron, C., et al. (2010). Seagrass community metabolism: assessing the carbon sink capacity of seagrass meadows. Glob. Biogeochem. Cycles 24:GB4032. doi: 10.1029/2010gb003793
Duarte, C. M., Middelburg, J. J., and Caraco, N. (2005). Major role of marine vegetation on the oceanic carbon cycle. Biogeosciences 2, 1–8. doi: 10.5194/bg-2-1-2005
Emmer, I., von Unger, M., Needelman, B., Crooks, S., and Emmett-Mattox, S. (2015). Coastal Blue Carbon in Practice; a Manual for Using the VCS Methodology for Tidal Wetland and Seagrass Restoration. VM0033 1. Arlington, VA: Restore America’s Estuaries.
Eyre, B. D., and Ferguson, A. J. P. (2002). Comparison of carbon production and decomposition, benthic nutrient fluxes and denitrification in seagrass, phytoplankton, benthic microalgae- and macroalgae-dominated warm-temperate Australian lagoons. Mar. Ecol. Prog. Ser. 229, 43–59. doi: 10.3354/meps229043
Eyre, B. D., Maher, D. T., and Sanders, C. (2016). The contribution of denitrification and burial to the nitrogen budgets of three geomorphically distinct Australian estuaries: importance of seagrass habitats. Limnol. Oceanogr. 61, 1144–1156. doi: 10.1002/lno.10280
Flindt, M. R. (1994). Measurements of nutrient fluxes and mass balances by on-line in situ dialysis in a Zostera marina bed culture. Verhandlungen 25, 2259–2264. doi: 10.1080/03680770.1992.11900614
Folk, R. L., and Ward, W. C. (1957). Brazos River bar: a study in the significance of grain size parameters. J. Sediment. Res. 27, 3–26. doi: 10.1306/74D70646-2B21-11D7-8648000102C1865D
Fonseca, M. S., and Bell, S. S. (1998). Influence of physical setting on seagrass landscapes near Beaufort, North Carolina, USA. Mar. Ecol. Prog. Ser. 171, 109–121. doi: 10.3354/meps171109
Fonseca, M. S., Fisher, J. S., Zieman, J. C., and Thayer, G. W. (1982). Influence of the seagrass, Zoster marina L, on current flow. Estuar. Coast. Shelf Sci. 15, 351–358. doi: 10.1016/0272-7714(82)90046-4
Fourqurean, J. W., Duarte, C. M., Kennedy, H., Marbà, N., Holmer, M., Mateo, M. A., et al. (2012a). Seagrass ecosystems as a globally significant carbon stock. Nat. Geosci. 5, 505–509. doi: 10.1038/ngeo1477
Fourqurean, J. W., Kendrick, G. A., Collins, L. S., Chambers, R. M., and Vanderklift, M. A. (2012b). Carbon, nitrogen and phosphorus storage in subtropical seagrass meadows: examples from Florida Bay and Shark Bay. Mar. Freshw. Res. 63, 967–983. doi: 10.1071/MF12101
Fourqurean, J. W., Moore, T. O., Fry, B., and Hollibaugh, J. T. (1997). Spatial and temporal variation in C: N: P ratios, δ 15 N, and δ 13 C of eelgrass Zostera marina as indicators of ecosystem processes, Tomales Bay, California, USA. Mar. Ecol. Prog. Ser. 157, 147–157. doi: 10.3354/meps157147
Gacia, E., Duarte, C. M., and Middelburg, J. J. (2002). Carbon and nutrient deposition in a Mediterranean seagrass (Posidonia oceanica) meadow. Limnol. Oceanogr. 47, 23–32. doi: 10.4319/lo.2002.47.1.0023
Gattuso, J. P., Frankignoulle, M., and Wollast, R. (1998). Carbon and carbonate metabolism in coastal aquatic ecosystems. Annu. Rev. Ecol. Syst. 29, 405–434. doi: 10.1146/annurev.ecolsys.29.1.405
Gattuso, J.-P., Magnan, A. K., Bopp, L., Cheung, W. W. L., Duarte, C. M., Hinkel, J., et al. (2018). Ocean solutions to address climate change and its effects on marine ecosystems. Front. Mar. Sci. 5:337. doi: 10.3389/fmars.2018.00337
Gillis, L., Belshe, F., Ziegler, A., and Bouma, T. (2017). Driving forces of organic carbon spatial distribution in the tropical seascape. J. Sea Res. 120, 35–40. doi: 10.1016/j.seares.2016.12.006
Goodman, J. L., Moore, K. A., and Dennison, W. C. (1995). Photosynthetic responses of eelgrass (Zostera marina L.) to light and sediment sulfide in a shallow barrier island lagoon. Aquat. Bot. 50, 37–47. doi: 10.1016/0304-3770(94)00444-Q
Greiner, J. T., McGlathery, K. J., Gunnell, J., and McKee, B. A. (2013). Seagrass restoration enhances “blue carbon” sequestration in coastal waters. PLoS One 8:e72469. doi: 10.1371/journal.pone.0072469
Grice, A., Loneragan, N., and Dennison, W. (1996). Light intensity and the interactions between physiology, morphology and stable isotope ratios in five species of seagrass. J. Exp. Mar. Biol. Ecol. 195, 91–110. doi: 10.1016/0022-0981(95)00096-8
Hansen, J. C. R., and Reidenbach, M. A. (2012). Wave and tidally driven flows in eelgrass beds and their effect on sediment suspension. Mar. Ecol. Prog. Ser. 448, 271–287. doi: 10.3354/meps09225
Heck, K. L., Carruthers, T. J., Duarte, C. M., Hughes, A. R., Kendrick, G., Orth, R. J., et al. (2008). Trophic transfers from seagrass meadows subsidize diverse marine and terrestrial consumers. Ecosystems 11, 1198–1210. doi: 10.1007/s10021-008-9155-y
Henriksen, P. (2009). “Reference conditions for phytoplankton at Danish Water Framework Directive intercalibration sites,” in Eutrophication in Coastal Ecosystems, eds J. H. Andersen and D. Conley (Berlin: Springer), 255–262.
Himes-Cornell, A., Pendleton, L., and Atiyah, P. (2018). Valuing ecosystem services from blue forests: a systematic review of the valuation of salt marshes, sea grass beds and mangrove forests. Ecosyst. Serv. 30, 36–48. doi: 10.1016/j.ecoser.2018.01.006
Holmer, M., and Bondgaard, E. J. (2001). Photosynthetic and growth response of eelgrass to low oxygen and high sulfide concentrations during hypoxic events. Aquat. Bot. 70, 29–38. doi: 10.1016/S0304-3770(00)00142-X
Holmer, M., Carta, C., and Andersen, F. O. (2006). Biogeochemical implications for phosphorus cycling in sandy and muddy rhizosphere sediments of Zostera marina meadows (Denmark). Mar. Ecol. Prog. Ser. 320, 141–151. doi: 10.3354/meps320141
Howard, J., Hoyt, S., Isensee, K., Telszewski, M., and Pidgeon, E. (2014). Coastal Blue Carbon: Methods for Assessing Carbon Stocks and Emissions Factors in Mangroves, Tidal Salt Marshes, and Seagrasses. Arlington, TX: International Union for Conservation of Nature.
Howarth, R. W., Marino, R., and Cole, J. J. (1988). Nitrogen fixation in freshwater, estuarine, and marine ecosystems. 2. Biogeochemical controls. Limnol. Oceanogr. 33, 688–701. doi: 10.1186/s12864-018-4648-3
Jankowska, E., Michel, L. N., Zaborska, A., and Wlodarska-Kowalczuk, M. (2016). Sediment carbon sink in low-density temperate eelgrass meadows (Baltic Sea). J. Geophys. Res. Biogeosci. 121, 2918–2934. doi: 10.1002/2016jg003424
Jensen, H. S., Mortensen, P., Andersen, F., Rasmussen, E., and Jensen, A. (1995). Phosphorus cycling in a coastal marine sediment, Aarhus Bay, Denmark. Limnol. Oceanogr. 40, 908–917. doi: 10.4319/lo.1995.40.5.0908
Jiang, Z., Liu, S., Zhang, J., Wu, Y., Zhao, C., Lian, Z., et al. (2018). Eutrophication indirectly reduced carbon sequestration in a tropical seagrass bed. Plant Soil 426, 135–152. doi: 10.1007/s11104-018-3604-y
Johannessen, S. C., and Macdonald, R. W. (2016). Geoengineering with seagrasses: is credit due where credit is given? Environ. Res. Lett. 11:113001. doi: 10.1088/1748-9326/11/11/113001
Keil, R. G., Montluçon, D. B., Prahl, F. G., and Hedges, J. I. (1994). Sorptive preservation of labile organic matter in marine sediments. Nature 370, 549–552. doi: 10.1038/370549a0
Kemp, W. M., Batleson, R., Bergstrom, P., Carter, V., Gallegos, C. L., Hunley, W., et al. (2004). Habitat requirements for submerged aquatic vegetation in Chesapeake Bay: water quality, light regime, and physical-chemical factors. Estuaries 27, 363–377. doi: 10.1007/BF02803529
Kennedy, H., Beggins, J., Duarte, C. M., Fourqurean, J. W., Holmer, M., Marbà, N., et al. (2010). Seagrass sediments as a global carbon sink: isotopic constraints. Glob. Biogeochem. Cycles 24:GB4026. doi: 10.1029/2010gb003848
Kristensen, E., and Hansen, K. (1995). Decay of plant detritus in organic-poor marine sediment: production rates and stoichiometry of dissolved C and N compounds. J. Mar. Res. 53, 675–702. doi: 10.1357/0022240953213115
Linders, T., Infantes, E., Joyce, A., Karlsson, T., Ploug, H., Hassellöv, M., et al. (2018). Particle sources and transport in stratified Nordic coastal seas in the Anthropocene. Elem. Sci. Anth. 6, 1–17. doi: 10.1525/elementa.149
Luisetti, T., Jackson, E. L., and Turner, R. K. (2013). Valuing the European ’coastal blue carbon’ storage benefit. Mar. Pollut. Bull. 71, 101–106. doi: 10.1016/j.marpolbul.2013.03.029
Macreadie, P. I., Allen, K., Kelaher, B. P., Ralph, P. J., and Skilbeck, C. G. (2012). Paleoreconstruction of estuarine sediments reveal human-induced weakening of coastal carbon sinks. Glob. Change Biol. 18, 891–901. doi: 10.1111/j.1365-2486.2011.02582.x
Macreadie, P. I., Baird, M. E., Trevathan-Tackett, S. M., Larkum, A. W. D., and Ralph, P. J. (2014). Quantifying and modelling the carbon sequestration capacity of seagrass meadows - A critical assessment. Mar. Pollut. Bull. 83, 430–439. doi: 10.1016/j.marpolbul.2013.07.038
Madsen, J. D., Chambers, P. A., James, W. F., Koch, E. W., and Westlake, D. F. (2001). The interaction between water movement, sediment dynamics and submersed macrophytes. Hydrobiologia 444, 71–84. doi: 10.1023/A:1017520800568
Mazarrasa, I., Marbà, N., Garcia-Orellana, J., Masqué, P., Arias-Ortiz, A., and Duarte, C. M. (2017). Effect of environmental factors (wave exposure and depth) and anthropogenic pressure in the C sink capacity of Posidonia oceanica meadows. Limnol. Oceanogr. 62, 1436–1450. doi: 10.1002/lno.10510
Mazarrasa, I., Samper-Villarreal, J., Serrano, O., Lavery, P. S., Lovelock, C. E., Marbà, N., et al. (2018). Habitat characteristics provide insights of carbon storage in seagrass meadows. Mar. Pollut. Bull. 134, 106–117. doi: 10.1016/j.marpolbul.2018.01.059
McGlathery, K. J., Reynolds, L. K., Cole, L. W., Orth, R. J., Marion, S. R., and Schwarzschild, A. (2012). Recovery trajectories during state change from bare sediment to eelgrass dominance. Mar. Ecol. Prog. Ser. 448, 209–221. doi: 10.3354/meps09574
McGlathery, K. J., Risgaard-Petersen, N., and Christensen, P. B. (1998). Temporal and spatial variation in nitrogen fixation activity in the eelgrass Zostera marina rhizosphere. Mar. Ecol. Prog. Ser. 168, 245–258. doi: 10.3354/meps168245
McGlathery, K. J., Sundback, K., and Anderson, I. C. (2007). Eutrophication in shallow coastal bays and lagoons: the role of plants in the coastal filter. Mar. Ecol. Prog. Ser. 348, 1–18. doi: 10.3354/meps07132
McLeod, E., Chmura, G. L., Bouillon, S., Salm, R., Björk, M., Duarte, C. M., et al. (2011). A blueprint for blue carbon: toward an improved understanding of the role of vegetated coastal habitats in sequestering CO2. Front. Ecol. Environ. 9, 552–560. doi: 10.1890/110004
Middelburg, J. J., Soetaert, K., Herman, P. M., Boschker, H. T., and Heip, C. H. (2004). “Burial of nutrient in coastal sediments: the role of primary producers,” in Estuarine Nutrient Cycling: The Influence of Primary Producers, eds S. L. Nielsen, G. T. Banta, and M. F. Pedersen (Berlin: Springer), 217–230. doi: 10.1007/978-1-4020-3021-5_8
Miyajima, T., Hori, M., Hamaguchi, M., Shimabukuro, H., Adachi, H., Yamano, H., et al. (2015). Geographic variability in organic carbon stock and accumulation rate in sediments of East and Southeast Asian seagrass meadows. Glob. Biogeochem. Cycles 29, 397–415. doi: 10.1002/2014gb004979
Miyajima, T., Hori, M., Hamaguchi, M., Shimabukuro, H., and Yoshida, G. (2017). Geophysical constraints for organic carbon sequestration capacity of Zostera marina seagrass meadows and surrounding habitats. Limnol. Oceanogr. 62, 954–972. doi: 10.1002/lno.10478
Miyajima, T., Koike, I., Yamano, H., and Iizumi, H. (1998). Accumulation and transport of seagrass-derived organic matter in reef flat sediment of Green Island, Great Barrier Reef. Mar. Ecol. Prog. Ser. 175, 251–259. doi: 10.3354/meps175251
Moksnes, P.-O., Eriander, L., Infantes, E., and Holmer, M. (2018). Local regime shifts prevent natural recovery and restoration of lost eelgrass beds along the Swedish west coast. Estuar. Coasts 41, 1712–1731. doi: 10.1007/s12237-018-0382-y
Murray, L., Dennison, W. C., and Kemp, W. M. (1992). Nitrogen versus phosphorus limitation for growth of an estuarine population of eelgrass (Zostera marina L.). Aquat. Bot. 44, 83–100. doi: 10.1016/0304-3770(92)90083-U
Murray, R. H., Erler, D. V., and Eyre, B. D. (2015). Nitrous oxide fluxes in estuarine environments: response to global change. Glob. Change Biol. 21, 3219–3245. doi: 10.1111/gcb.12923
Nellemann, C., Corcoran, E., Duarte, C., Valdés, L., De Young, C., Fonseca, L., et al. (2009). Blue Carbon: a Rapid Response Assessment. Nairobi: United Nations Environment Programme.
Nielsen, S. L., Banta, G. T., and Pedersen, M. F. (2004). “Interactions between vegetation and nutrient dynamics in coastal marine ecosystems: an introduction,” in Estuarine Nutrient Cycling: The Influence of Primary Producers: The Fate of Nutrients and Biomass, eds S. L. Nielsen, G. T. Banta, and M. F. Pedersen (Dordrecht: Springer), 1–15. doi: 10.1007/978-1-4020-3021-5_1
Nilsson, M. (2018). Carbon Cycling in Baltic Sea Sediments - In Situ Investigations with Benthic Landers. Ph.D. dissertation, University of Gothenburg, Gothenburg.
Nixon, S. W. (1995). Coastal marine eutrophication: a definition, social causes, and future concerns. Ophelia 41, 199–219. doi: 10.1080/00785236.1995.10422044
Nordlund, L. M., Koch, E. W., Barbier, E. B., and Creed, J. C. (2016). Seagrass ecosystem services and their variability across Genera and geographical regions. PLoS One 11:e0163091. doi: 10.1371/journal.pone.0163091
Ochieng, C. A., Short, F. T., and Walker, D. I. (2010). Photosynthetic and morphological responses of eelgrass (Zostera marina L.) to a gradient of light conditions. J. Exp. Mar. Biol. Ecol. 382, 117–124. doi: 10.1016/j.jembe.2009.11.007
Oreska, M. P. J., McGlathery, K. J., and Porter, J. H. (2017a). Seagrass blue carbon spatial patterns at the meadow-scale. PLoS One 12:e0176630. doi: 10.1371/journal.pone.0176630
Oreska, M. P. J., Wilkinson, G. M., McGlathery, K. J., Bost, M., and McKee, B. A. (2017b). Non-seagrass carbon contributions to seagrass sediment blue carbon. Limnol. Oceanogr. 63, S3–S18. doi: 10.1002/lno.10718
Orth, R. J., Carruthers, T. J. B., Dennison, W. C., Duarte, C. M., Fourqurean, J. W., Heck, K. L., et al. (2006). A global crisis for seagrass ecosystems. BioScience 56, 987–996. doi: 10.1641/0006-3568 (2006)56[987:AGCFSE]2.0.CO;2
Pedersen, M. F., and Borum, J. (1993). An annual nitrogen budget for a seagrass Zostera marina population. Mar. Ecol. Prog. Ser. 101, 169–177. doi: 10.3354/meps101169
Pedersen, M. F., Nielsen, S. L., and Banta, G. (2004). Interactions Between Vegetation and Nutrient Dynamics in Coastal Marine Ecosystems: an Introduction. Dordrecht: Kluwer Academic Publishers.
Pendleton, L., Donato, D. C., Murray, B. C., Crooks, S., Jenkins, W. A., Sifleet, S., et al. (2012). Estimating global ”blue carbon” emissions from conversion and degradation of vegetated coastal ecosystems. PLoS One 7:e43542. doi: 10.1371/journal.pone.0043542
Piehler, M. F., and Smyth, A. R. (2011). Habitat-specific distinctions in estuarine denitrification affect both ecosystem function and services. Ecosphere 2, 1–17. doi: 10.1890/es10-00082.1
Poppe, K. L., and Rybczyk, J. M. (2018). Carbon sequestration in a pacific northwest eelgrass (Zostera marina) meadow. Northwest Sci. 92, 80–91. doi: 10.3955/046.092.0202
Postlethwaite, V. R. (2018). Blue Carbon Storage and Variability in Clayoquot Sound, British Columbia. Ph.D. dissertation, Simon Fraser University, Burnaby.
Postlethwaite, V. R., McGowan, A. E., Kohfeld, K. E., Robinson, C. L. K., and Pellatt, M. G. (2018). Low blue carbon storage in eelgrass (Zostera marina) meadows on the Pacific Coast of Canada. PLoS One 13:e0198348. doi: 10.1371/journal.pone.0198348
R Core Team (2017). R: A Language and Environment for Statistical Computing. Vienna: R Foundation for Statistical Computing.
Reynolds, L. K., Waycott, M., McGlathery, K. J., and Orth, R. J. (2016). Ecosystem services returned through seagrass restoration. Restor. Ecol. 24, 583–588. doi: 10.1111/rec.12360
Ricart, A. M., York, P. H., Rasheed, M. A., Pérez, M., Romero, J., Bryant, C. V., et al. (2015). Variability of sedimentary organic carbon in patchy seagrass landscapes. Mar. Pollut. Bull. 100, 476–482. doi: 10.1016/j.marpolbul.2015.09.032
Riemann, B., Carstensen, J., Dahl, K., Fossing, H., Hansen, J. W., Jakobsen, H. H., et al. (2016). Recovery of Danish coastal ecosystems after reductions in nutrient loading: a holistic ecosystem approach. Estuar. Coasts 39, 82–97. doi: 10.1007/s12237-015-9980-0
Risgaard-Petersen, N., Dalsgaard, T., Rysgaard, S., Christensen, P. B., Borum, J., McGlathery, K., et al. (1998). Nitrogen balance of a temperate eelgrass Zostera marina bed. Mar. Ecol. Prog. Ser. 174, 281–291. doi: 10.3354/meps174281
Risgaard-Petersen, N., and Ottosen, L. D. M. (2000). Nitrogen cycling in two temperate Zostera marina beds: seasonal variation. Mar. Ecol. Prog. Ser. 198, 93–107. doi: 10.3354/meps198093
Röhr, M. E., Boström, C., Canal-Vergés, P., and Holmer, M. (2016). Blue carbon stocks in Baltic Sea eelgrass (Zostera marina) meadows. Biogeosciences 13, 6139–6153. doi: 10.5194/bg-13-6139-2016
Röhr, M. E., Holmer, M., Baum, J. K., Björk, M., Chin, D., Chalifour, L., et al. (2018). Blue carbon storage capacity of temperate eelgrass (Zostera marina) meadows. Glob. Biogeochem. Cycles 32, 1457–1475. doi: 10.1029/2018GB005941
Romero, J., Lee, K.-S., Pérez, M., Mateo, M. A., and Alcoverro, T. (2006). “Nutrient dynamics in seagrass ecosystems,” in Seagrasses: Biology, Ecology and Conservation, eds A. W. D. Larkum, R. J. Orth, and C. M. Duarte (Dordrecht: Springer), 227–254.
Russell, D. G., Warry, F. Y., and Cook, P. L. M. (2016). The balance between nitrogen fixation and denitrification on vegetated and non-vegetated intertidal sediments. Limnol. Oceanogr. 61, 2058–2075. doi: 10.1002/lno.10353
Ruttenberg, K. C. (1992). Development of a sequential extraction method for different forms of phosphorus in marine sediments. Limnol. Oceanogr. 37, 1460–1482. doi: 10.4319/lo.1992.37.7.1460
Samper-Villarreal, J., Lovelock, C. E., Saunders, M. I., Roelfsema, C., and Mumby, P. J. (2016). Organic carbon in seagrass sediments is influenced by seagrass canopy complexity, turbidity, wave height, and water depth. Limnol. Oceanogr. 61, 938–952. doi: 10.1002/lno.10262
Samper-Villarreal, J., Mumby, P. J., Saunders, M. I., Barry, L. A., Zawadzki, A., Heijnis, H., et al. (2017). Vertical accretion and carbon burial rates in subtropical seagrass meadows increased following anthropogenic pressure from European colonisation. Estuar. Coast. Shelf Sci. 202, 40–53. doi: 10.1016/j.ecss.2017.12.006
Seitzinger, S., Harrison, J. A., Böhlke, J. K., Bouwman, A. F., Lowrance, R., Peterson, B., et al. (2006). Denitrification across landscapes and waterscapes: a synthesis. Ecol. Appl. 16, 2064–2090. doi: 10.1890/1051-0761 (2006)016[2064:DALAWA]2.0.CO;2
Seitzinger, S. P., and Nixon, S. W. (1985). Eutrophication and the rate of denitrification and N20 production in coastal marine sediments. Limnol. Oceanogr. 30, 1332–1339. doi: 10.4319/lo.1985.30.6.1332
Serrano, O., Lavery, P. S., Duarte, C. M., Kendrick, G. A., Calafat, A., York, P. H., et al. (2016). Can mud (silt and clay) concentration be used to predict soil organic carbon content within seagrass ecosystems? Biogeosciences 13, 4915–4926. doi: 10.5194/bg-13-4915-2016
Short, F., Carruthers, T., Dennison, W., and Waycott, M. (2007). Global seagrass distribution and diversity: a bioregional model. J. Exp. Mar. Biol. Ecol. 350, 3–20. doi: 10.1016/j.jembe.2007.06.012
Short, F. T. (1987). Effects of sediment nutrients on seagrasses: literature review and mesocosm experiment. Aquat. Bot. 27, 41–57. doi: 10.1016/0304-3770(87)90085-4
Smith, S. (1981). Marine macrophytes as a global carbon sink. Science 211, 838–840. doi: 10.1126/science.211.4484.838
Touchette, B. W., and Burkholder, J. M. (2000). Review of nitrogen and phosphorus metabolism in seagrasses. J. Exp. Mar. Biol. Ecol. 250, 133–167. doi: 10.1016/s0022-0981(00)00195-7
van Keulen, M., and Borowitzka, M. A. (2003). Seasonal variability in sediment distribution along an exposure gradient in a seagrass meadow in Shoalwater Bay, Western Australia. Estuar. Coast. Shelf Sci. 57, 587–592. doi: 10.1016/S0272-7714(02)00394-3
Viaroli, P., Bartoli, M., Giordani, G., Naldi, M., Orfanidis, S., and Zaldivar, J. M. (2008). Community shifts, alternative stable states, biogeochemical controls and feedbacks in eutrophic coastal lagoons: a brief overview. Aquat. Conserv. Mar. Freshw. Ecosyst. 18, S105–S117. doi: 10.1002/aqc.956
Waycott, M., Duarte, C. M., Carruthers, T. J., Orth, R. J., Dennison, W. C., Olyarnik, S., et al. (2009). Accelerating loss of seagrasses across the globe threatens coastal ecosystems. Proc. Natl. Acad. Sci. U.S.A. 106, 12377–12381. doi: 10.1073/pnas.0905620106
Welsh, D. T. (2000). Nitrogen fixation in seagrass meadows: regulation, plant–bacteria interactions and significance to primary productivity. Ecol. Lett. 3, 58–71. doi: 10.1046/j.1461-0248.2000.00111.x
Welsh, D. T., Bartoli, M., Nizzoli, D., Castaldelli, G., Riou, S. A., and Viaroli, P. (2000). Denitrification, nitrogen fixation, community primary productivity and inorganic-N and oxygen fluxes in an intertidal Zostera noltii meadow. Mar. Ecol. Prog. Ser. 208, 65–77. doi: 10.3354/meps208065
Wijkmark, N., and Isæus, M. (2010). Wave exposure calculations for the Baltic Sea. Aquabiota Rep. 2010:2.
Wulff, F., Stigebrandt, A., and Rahm, L. (1990). Nutrient dynamics of the Baltic Sea. Ambio 19, 126–133.
Yang, S., Li, H., Ysebaert, T., Bouma, T. J., Zhang, W. X., Wang, Y. Y., et al. (2008). Spatial and temporal variations in sediment grain size in tidal wetlands, Yangtze Delta: on the role of physical and biotic controls. Estuar. Coast. Shelf Sci. 77, 657–671. doi: 10.1016/j.ecss.2007.10.024
Yang, X., Zhang, P., Li, W., Hu, C., Zhang, X., and He, P. (2018). Evaluation of four seagrass species as early warning indicators for nitrogen overloading: implications for eutrophic evaluation and ecosystem management. Sci. Total Environ. 635, 1132–1143. doi: 10.1016/j.scitotenv.2018.04.227
Keywords: eutrophication, Zostera marina, blue carbon, sediment storage, ecosystem service
Citation: Kindeberg T, Ørberg SB, Röhr ME, Holmer M and Krause-Jensen D (2018) Sediment Stocks of Carbon, Nitrogen, and Phosphorus in Danish Eelgrass Meadows. Front. Mar. Sci. 5:474. doi: 10.3389/fmars.2018.00474
Received: 31 August 2018; Accepted: 26 November 2018;
Published: 10 December 2018.
Edited by:
Christian Grenz, UMR7294 Institut Méditerranéen d’Océanographie (MIO), FranceReviewed by:
Jenny R. Hillman, The University of Auckland, New ZealandTheresa O’Meara, Smithsonian Environmental Research Center (SI), United States
Copyright © 2018 Kindeberg, Ørberg, Röhr, Holmer and Krause-Jensen. This is an open-access article distributed under the terms of the Creative Commons Attribution License (CC BY). The use, distribution or reproduction in other forums is permitted, provided the original author(s) and the copyright owner(s) are credited and that the original publication in this journal is cited, in accordance with accepted academic practice. No use, distribution or reproduction is permitted which does not comply with these terms.
*Correspondence: Theodor Kindeberg, dGhlby5raW5kZWJlcmdAZ21haWwuY29t