 Stephen Conrad†
 Dylan R. Brown†Paula Gomez AlvarezBronte Bates
 Nizam IbrahimAlex ReidLuciana Silva Monteiro
 Daniela A. Silva
 Lea T. Mamo
 Jacob R. BowtellHuang An Lin
 Nathaniel L. Tolentino
 Christian Joshua Sanders*
- National Marine Science Centre, School of Environment, Science and Engineering, Southern Cross University, Coffs Harbour, NSW, Australia
Mitigating climate change through the reduction of atmospheric CO2 levels is of interest, particularly through maintaining and re-establishing natural ecosystems that act as carbon sinks, such as coastal vegetated habitats or “blue carbon” systems. Here we compare sedimentary blue carbon (C) stocks from 37 sediment cores collected in pristine (n = 13), agricultural (n = 11), and urban (n = 13) estuaries within the same geomorphological region, located on the eastern coast of Australia. The mean estimated C stocks for each carbon system (seagrass, mangrove, and saltmarshes) were 402 ± 78, 830 ± 109, and 723 ± 100 Mg C ha-1, respectively, conservatively estimated up to 3 m depths. Analysis of variance revealed no significant difference between C stocks per area (C ha-1) considering each habitat type and between specific estuaries. However, the total estuarine C stocks were found to be greater with increasing levels of conservation, based on larger areas of blue carbon vegetation. The potential loss of C to the atmosphere from these small regional estuaries are 500,574 ± 118,635 tons of CO2 equivalent (CO2e), based on specific assumptions. The implication of these results are that there are large C stocks in small regional estuaries which supports the protection of blue C systems in developing coastal areas and highlights the uncertainties of the CO2 emissions from potential blue C habitat degradation.
Introduction
Vegetated coastal ecosystems (i.e., seagrass beds, saltmarsh meadows, and mangrove forests) are highly productive ecosystems that play a critical role in the global carbon, water, and nutrient cycles (Sanders et al., 2014; Lovelock et al., 2017; Maher et al., 2018). Their natural ability to sequester substantial amounts of carbon dioxide (CO2) from the atmosphere via the long term burial of carbon in mostly anoxic sediments has become increasingly recognized as important climate change mitigation strategies (Chmura et al., 2003; McLeod et al., 2011; Hopkinson et al., 2012; Howard et al., 2017; Macreadie et al., 2017a). However, while these blue C systems are capable of offsetting anthropogenic greenhouse gas emissions through bio- sequestering atmospheric CO2, their continuing decline due to environmental change and human land use activities is reducing their capacity to provide this ecosystem service and ultimately exacerbating global climate change (McLeod et al., 2011; Beaumont et al., 2014; Atwood et al., 2017).
Over the past several decades, it is estimated that about one third of global mangroves, seagrass, and saltmarsh have been lost as a result of deforestation and habitat reclamation, coastal and urban development, nutrient enrichment, water quality degradation, and climate change (Alongi, 2002; Orth et al., 2006; Gedan et al., 2009; McLeod et al., 2011; Pendleton et al., 2012; Lovelock et al., 2015). This decline in coastal blue C systems still continues today at rates estimated between ∼0.5–3% annually depending on ecosystem type (McLeod et al., 2011; Pendleton et al., 2012). The degradation of these habitats, particularly the disturbance of sediments, leads to the remineralization of CO2 that has been stored for millennia (McLeod et al., 2011; Lovelock et al., 2017). An evaluation of global blue carbon emissions emitted as a result of the conversion and degradation of vegetated coastal ecosystems has been estimated at 0.15–1.02 Pg (billion tons) of CO2 being released annually which is estimated to cause economic damages of approximately $US 6–42 billion annually (Pendleton et al., 2012). These economic damages are associated with restoration efforts in wetlands with ecological benefits and undefined carbon offsets (Irving et al., 2011).
Although there has been an increasing amount of studies focusing on quantifying potential CO2 emissions from blue carbon sediment disturbance to evaluate the effects of habitat loss on greenhouse gas budgets (Pendleton et al., 2012; Brown et al., 2016; Atwood et al., 2017; Lovelock et al., 2017; Macreadie et al., 2017b), there are still uncertainties when it comes to variabilities in C stock estimates, particularly in regards to inter-ecosystem variability (Lavery et al., 2013; Friess and Webb, 2014; Ricart et al., 2015; Hayes et al., 2017; Kelleway et al., 2017). While variations in sedimentary carbon stocks in blue C systems have been documented across longitudinal and estuarine spatial gradients (Lavery et al., 2013; Brown et al., 2016; Sanders et al., 2016; Hayes et al., 2017; Lewis et al., 2017), data on the variability of C stocks from blue C systems of the same geomorphological region are scarce.
The current study was therefore undertaken with the objective of (i) estimating and evaluating variability in sedimentary blue carbon stocks of three estuaries within the same geomorphological region and (ii) quantifying possible variability in sedimentary C stocks as a result of regional development. A total of 13 sedimentary C stock estimates were estimated from sediment cores collected from blue C systems within a relatively pristine estuarine catchment, 11 cores from a predominately agricultural impacted estuarine catchment, and 13 sediment cores were collected from an urbanized estuary catchment. For comparative purposes, extrapolations of saltmarsh, mangrove and seagrass sediment C stocks were calculated for each estuary and the potential CO2 emissions from habitat degradation were based on these sedimentary C stock estimates.
Materials and Methods
Study Sites
Field observations were performed along three coastal estuaries on the subtropical East Coast of New South Wales, Australia (Figure 1). The Wooli River, Corindi River, and Coffs Creek estuaries are all tidal estuaries situated within the same geomorphological region (within 50 km of each other) and experience a similar subtropical climate of hot wet summers and cold dry winters. The region receives an average annual rainfall of approximately 1600 mm with the wettest and driest months being February and September, respectively. Each estuary contains all three blue C systems with the dominant species for each blue carbon system being Zostera muelleri (seagrass), Sporobolus virginicus (saltmarsh), and Avicennia marina (mangrove).
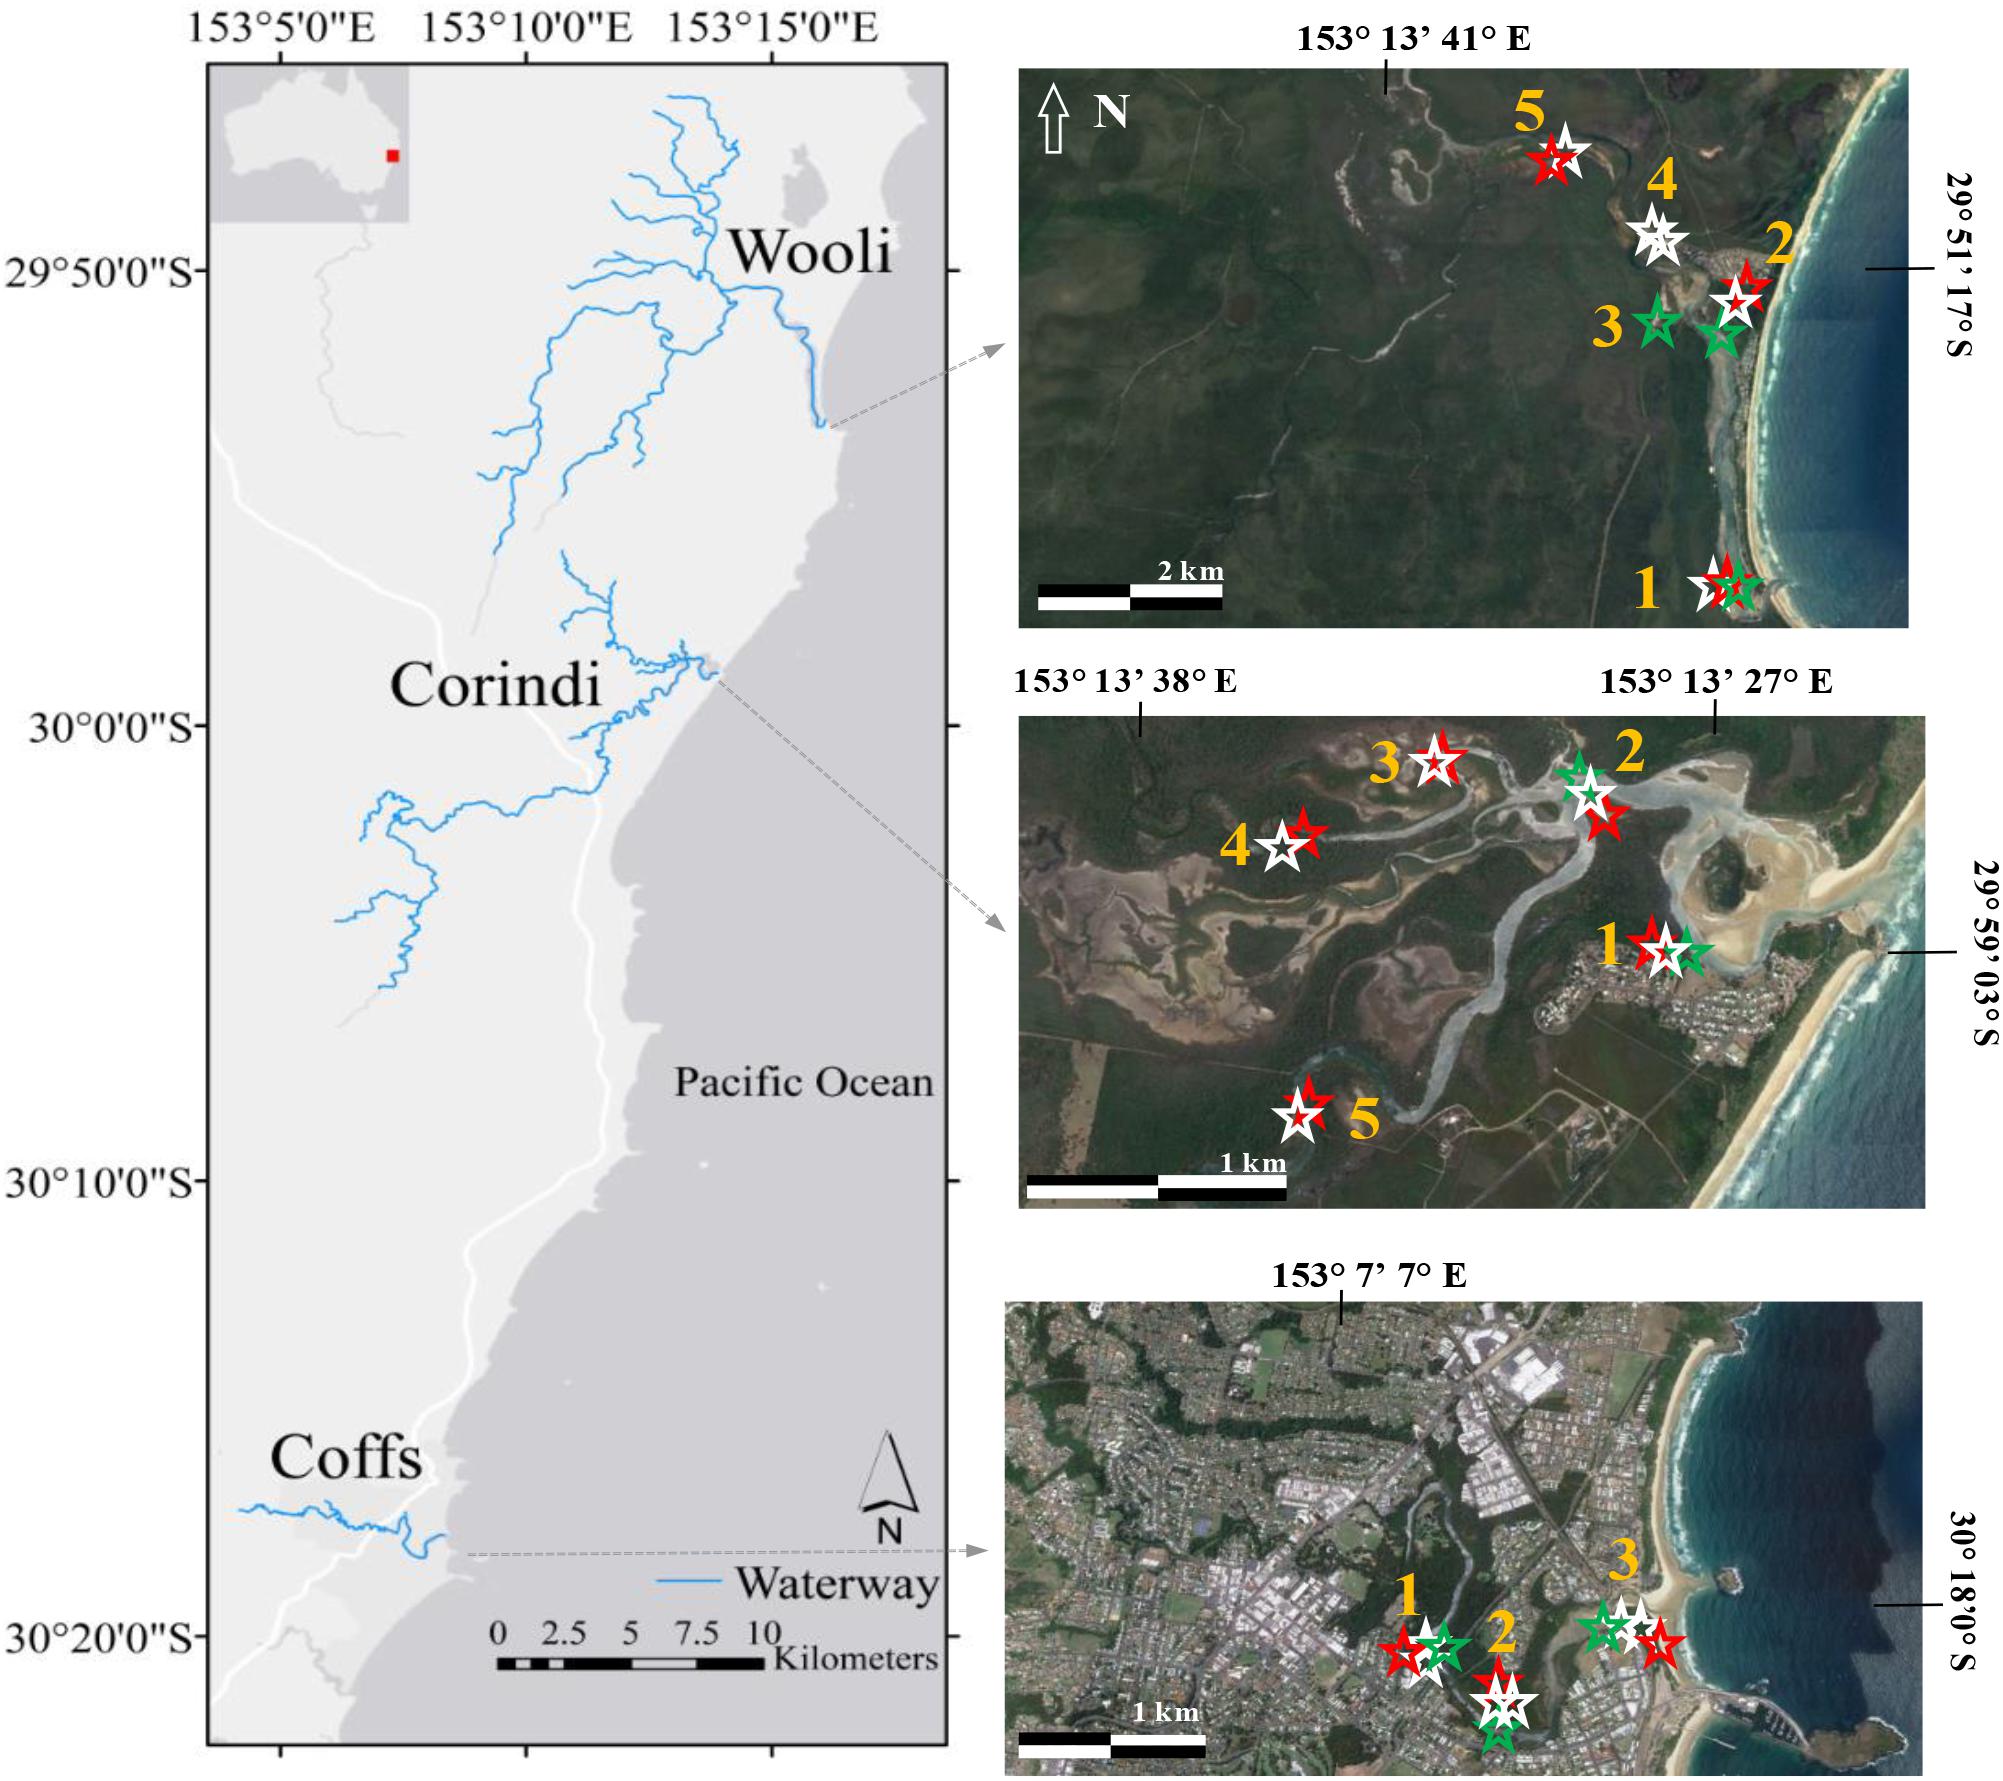
Figure 1. Study region on the left, and satellite image of each estuary on the right. The townships of Coffs Harbour, Corindi Beach and Wooli, NSW [populations: 72,971, 1,200, and 418, respectively (ABS, 2016)]. Coffs Harbour is the main urban center of the region. Numbers on the satellite image of each area indicate location of sediment samples, greens stars represent seagrass, white stars mangrove and red stars saltmarsh sediment cores.
Although the three estuaries in this study experience a similar climate, they differ in terms of the degree of environmental impact and regional development within their catchments. The estuary situated the furthest north of all estuaries, the Wooli River estuary, is located in the Yuraygir National Park in the Northern Rivers district of New South Wales, Australia (29.89° S, 153.27° E) (Figure 1). The closest villages are Minnie Water, situated at 13.7 km north from the Wooli River, and Red Rock, which is found 48 km south from Wooli. Although in the surroundings of the river there are camping and caravan parks, as well as holiday apartments, the Wooli River is known to be one of the most pristine systems in New South Wales, Australia. The Wooli River estuary has an area of 370 ha and a total catchment area of 18,000 ha.
Also situated in the Northern Rivers district of New South Wales, the Corindi River estuary (29.98° S, 153.23° E) and its surrounding catchment (190 ha) drains to the ocean in the town of Red Rock, NSW (population: 435, ABS, 2016; Figure 1). The catchment area is primarily dominated by agricultural development and supports a range of blueberry and banana plantations. The Corindi River drainage basin is one of the major blueberry growing areas in northern New South Wales and previous studies have shown the impacts of blueberry farms to the local estuary, including phosphorus enrichment (Conrad et al., 2018).
The urban estuary studied in this work, Coffs Creek estuary (30.30° S, 153.14° E), is situated in the northern section of the Mid North Coast near the township of Coffs Harbour, NSW Australia (Figure 1). The estuary has a catchment area of about 250 ha of which 80% is dominated by urban development and agriculture, while just 16% is considered undisturbed (Roper et al., 2011). Coffs Creek estuary has an estimated population of ∼18,000 (Ryder et al., 2012). The water demand of Coffs Harbour is around 18 ML per day. Potable water for the city is pumped from the local rivers outside the catchment (Orara River, Nymboida River, and Shannon Creek) and the wastewater from the city is treated before the effluent is disposed offshore (Ryder et al., 2012).
Sample Collection and C Stock Calculations
Sampling was conducted in March 2016 (Coffs Creek estuary), March 2017 (Corindi River estuary), and March 2018 (Wooli River estuary). Using a 50 cm long, 5 cm diameter Russian Peat auger (mangrove and saltmarsh) or PVC corer with a 7 cm inner diameter (seagrass). Sediment cores were collected, at least two sediment cores in each blue carbon system, along each estuary (Figure 1). At each sampling site, soil depth was measured using a 3 m metal rod to probe for soil bedrock. If the rod became fully submerged in the sediment, a conservative depth of 3 m was presumed. Once collected, sediment cores were sectioned into 2 cm intervals. This sampling protocol is designed to allow maximum spatial coverage, based on available resources, and allowed for comparisons with other blue carbon stock studies that sampled three depth intervals per sediment core (Lewis et al., 2017).
Dry bulk density (DBD) was calculated for each interval using the dry weight of sediment and volume of sample from the sediment core. Three subsamples from each core (8–10, 28–30, and 48–50 cm) were placed into the oven at 105°C until dry, to obtain the sample dry weight. The three samples per sediment core were then placed in the furnace at 550°C to burn off the organic matter [loss on ignition (L.O.I.)] (Sanders et al., 2012). Organic C content was calculated by multiplying the organic material, determined from the loss on ignition (LOI) method, by 0.58 as confirmed by Brown et al. (2016) for this region. By multiplying soil depth, DBD and organic C content, sediment C stocks for each core were estimated. To determine the C stocks in saltmarsh, mangrove and seagrass sediments of each estuary, the mean C stocks were multiplied by the area of each habitat (Table 1).
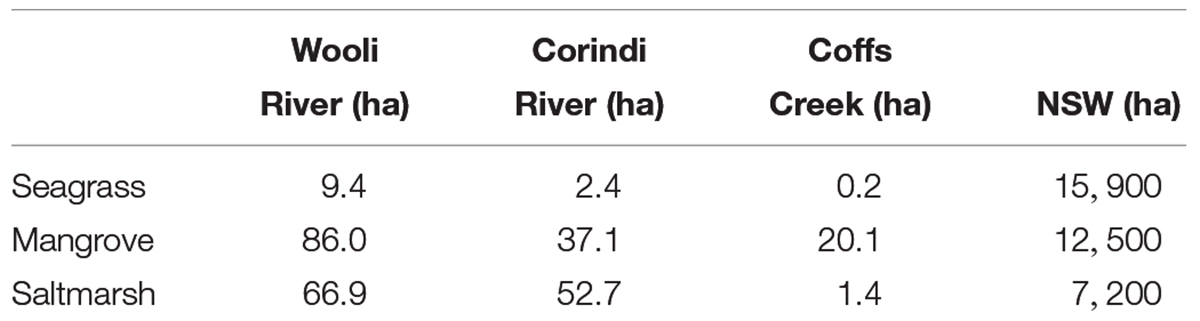
Table 1. Total area (ha) of each blue carbon ecosystem within Wooli River estuary, Corindi River estuary, and Coffs Creek estuary.
Data Analysis
To evaluate differences in carbon stocks (Mg C ha-1), carbon density (g C cm-3), and carbon content (g C g sediment-1) between locations (Coffs, Corindi, and Wooli; fixed factor), habitat types (seagrass, mangrove, and saltmarsh; fixed factor), and cores (three replicate subsamples; random, nested within location and habitat type), we ran a distance-based multiple factor PERMANOVA on a Euclidian similarity matrix of all samples. We used 9999 permutations of residuals under a reduced model to generate P-values and Type III (partial) sums of squares to account for the unbalanced number of cores in each location. The spatial distribution of carbon stock, carbon density, and carbon content was visualized using a non-metric MDS (multidimensional scaling) scatter plot. All analyses were done using PRIMER 7 (Clarke and Gorley, 2015) and PERMANOVA+ (Anderson, 2008).
Results
Below we outline the results for each blue C systems from the Wooli River, Corindi River and Coffs Creek estuaries individually. Sedimentary blue carbon stock data for Coffs Creek estuary are summarized from Brown et al. (2016). All confidence intervals are given as Standard Error. See Supplementary Table 1 for raw data.
Wooli River Estuary
Seagrass
Carbon content (percentage C of total sample dry weight) in the seagrass sediment samples from the Wooli River estuary ranged from 0.75 to 0.96% with an average of 0.85 ± 0.11% (Table 2). The dry bulk densities (DBD) ranged from 1.48 to 1.55 g cm-3 with an average DBD of 1.51 ± 0.06 g cm-3. From these, sedimentary seagrass carbon stocks were estimated between 348 and 391 Mg C ha-1, with an overall average of 371 ± 31 Mg C ha-1.
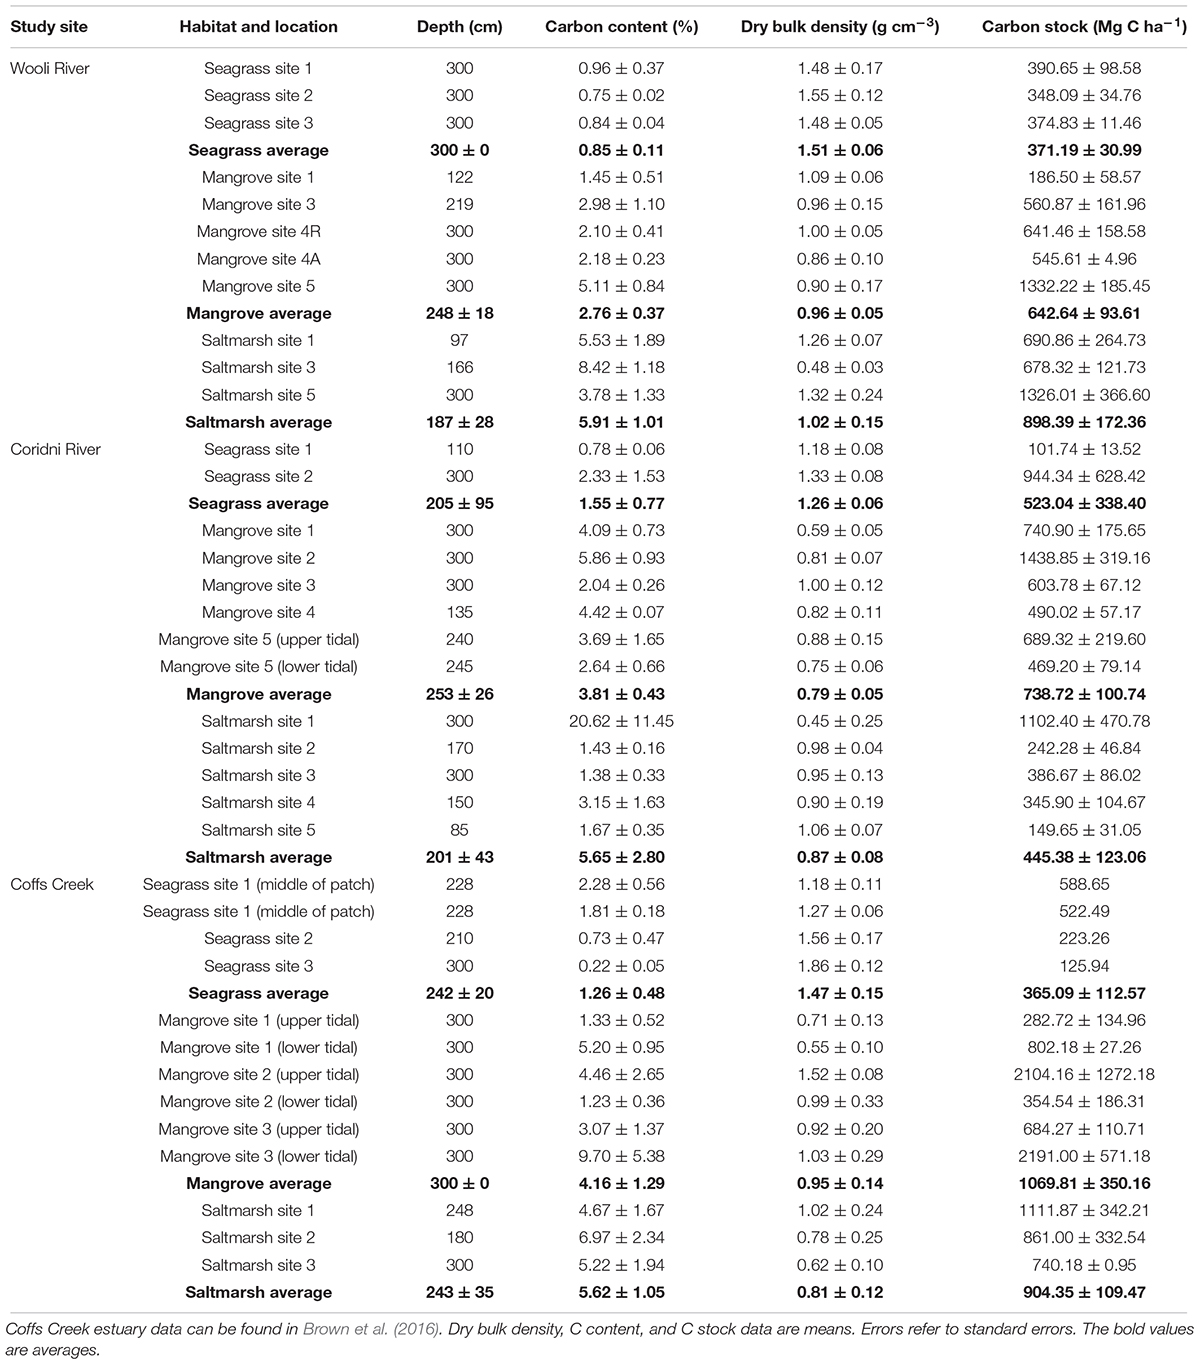
Table 2. Depth (cm), C content (%), dry bulk density (g cm-3), and C stocks (Mg C ha-1) for seagrass, mangrove, and saltmarsh cores collected from Wooli and Corindi River estuaries.
Mangrove
Carbon content in the mangrove sediment samples from the Wooli River estuary ranged from 1.45 to 5.11% with an average of 2.76 ± 0.37% (Table 2). The DBD ranged from 0.86 to 1.09 g cm-3 with an average DBD of 0.96 ± 0.05 g cm-3. From these, sedimentary mangrove carbon stocks were estimated between 187 and 1332 Mg C ha-1, with an overall average of 642 ± 94 Mg C ha-1.
Saltmarsh
Carbon content in the saltmarsh sediment samples from the Wooli River estuary ranged from 3.78 to 8.42% with an average of 5.91 ± 1.01% (Table 2). The DBD ranged from 0.48 to 1.32 g cm-3 with an average DBD of 1.02 ± 0.15 g cm-3. From these, sedimentary saltmarsh carbon stocks were estimated between 678 and 1326 Mg C ha-1, with an overall average of 898 ± 172 Mg C ha-1.
Corindi River Estuary
Seagrass
Carbon content in the seagrass sediment samples ranged from 0.78 to 2.33% with an average of 1.55 ± 0.77% (Table 2). The DBD ranged from 1.18 to 1.33 g cm-3 with an average DBD of 1.26 ± 0.06 g cm-3. From these, sedimentary seagrass carbon stocks were estimated between 102 and 944 Mg C ha-1, with an average of 523 ± 338 Mg C ha-1.
Mangrove
Carbon content in the mangrove sediment samples ranged from 2.04 to 5.86% with an average of 3.81 ± 0.43% (Table 2). The DBD ranged from 0.59 to 1.00 g cm-3 with an average DBD of 0.79 ± 0.05 g cm-3. From these, sedimentary mangrove carbon stocks were estimated between 469 and 1439 Mg C ha-1 with an average of 739 ± 101 Mg C ha-1.
Saltmarsh
Carbon content in the saltmarsh sediment samples ranged from 1.38 to 20.62% with an average of 5.65 ± 2.80% (Table 2). The DBD ranged from 0.45 to 1.06 g cm-3 with an average DBD of 0.87 ± 0.08 g cm-3. From these, sedimentary saltmarsh carbon stock estimates were estimated between 150 and 1102 Mg C ha-1 with an average of 445 ± 123 Mg C ha-1.
Coffs Creek Estuary
Seagrass
Carbon content in the seagrass sediment samples ranged from 0.22 to 2.28% with an average of 1.26 ± 0.48% (Table 2). The DBD ranged from 1.18 to 1.86 g cm-3 with an average DBD of 1.47 ± 0.15 g cm-3. From these, sedimentary seagrass carbon stocks were estimated between 126 and 589 Mg C ha-1, with an average of 365 ± 113 Mg C ha-1.
Mangrove
Carbon content in the mangrove sediment samples ranged from 1.23 to 9.70% with an average of 4.17 ± 1.29% (Table 2). The DBD ranged from 0.55 to 1.52 g cm-3 with an average DBD of 0.95 ± 0.14 g cm-3. From these, sedimentary mangrove carbon stocks were estimated between 283 and 2191 Mg C ha-1 with an average of 1070 ± 350 Mg C ha-1.
Saltmarsh
Carbon content in the saltmarsh sediment samples ranged from 4.67 to 6.97% with an average of 5.62 ± 1.05% (Table 2). The DBD ranged from 0.62 to 1.02 g cm-3 with an average DBD of 0.81 ± 0.12 g cm-3. From these, sedimentary saltmarsh carbon stock estimates were estimated between 740 and 1112 Mg C ha-1 with an average of 904 ± 109 Mg C ha-1.
Statistical Analysis
Despite the variabilities in sedimentary C stocks observed within and between estuaries (Table 3), the results of the PERMANOVA revealed no significant interaction between C stock per unit area, C density or C content between locations (p = 0.46, pseudo-F = 0.79), habitats (p = 0.15, pseudo-F = 2.10), or habitat amongst locations (p = 0.55, pseudo-F = 0.77). There was however, a significant difference among replicates (cores) within each habitat and location (p = 0.004, pseudo-F = 2.30) (Table 3). Differences in C stock, C density and C content among cores within the same habitat and location were responsible for the greatest components of variation (Table 3). All results however, must be interpreted with caution as sample size within locations and habitats was relatively low.
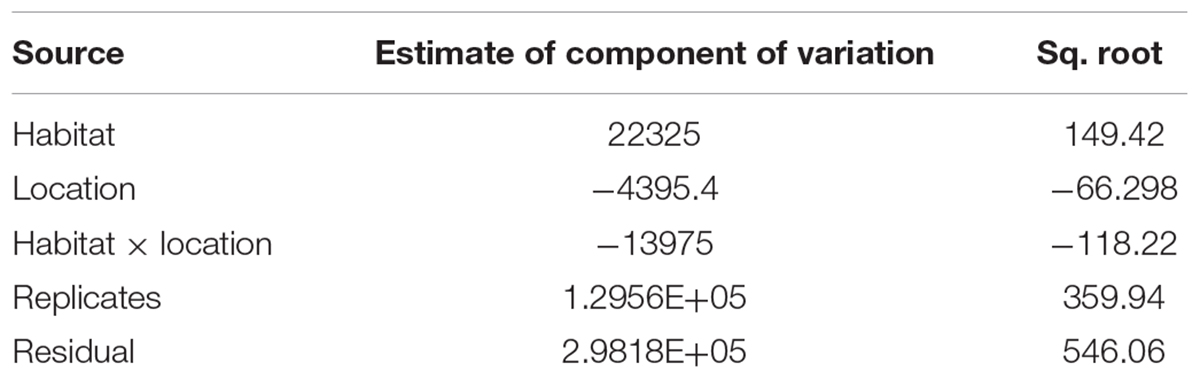
Table 3. Estimates of components of variation from PERMANOVA.
Discussion
Variabilities in Sedimentary Blue Carbon Stocks
Global averages indicate that mangroves systems have generally higher sedimentary organic C densities than any other blue carbon system (Chmura et al., 2003). However, the results of this study indicate no significant difference in sedimentary C stocks per area (based on the top 3 m of sediment) between all three studied blue C systems (Figure 2). Global distribution of blue C systems is primarily governed by physical tolerances to climatic conditions such as temperature and rainfall, which limits and restricts mangrove and seagrass production toward temperate climates (Duarte et al., 2013), while saltmarsh are generally more adapted to cooler climates (Chmura et al., 2003). Given that all three estuaries are within close proximity and are all located in the subtropical climatic region, the climatic conditions may be favorable for saltmarsh production and less favorable for mangrove and seagrass, resulting in similar sedimentary C stocks. However, these interpretations should be taken with caution as sample size within locations and habitats was relatively low.
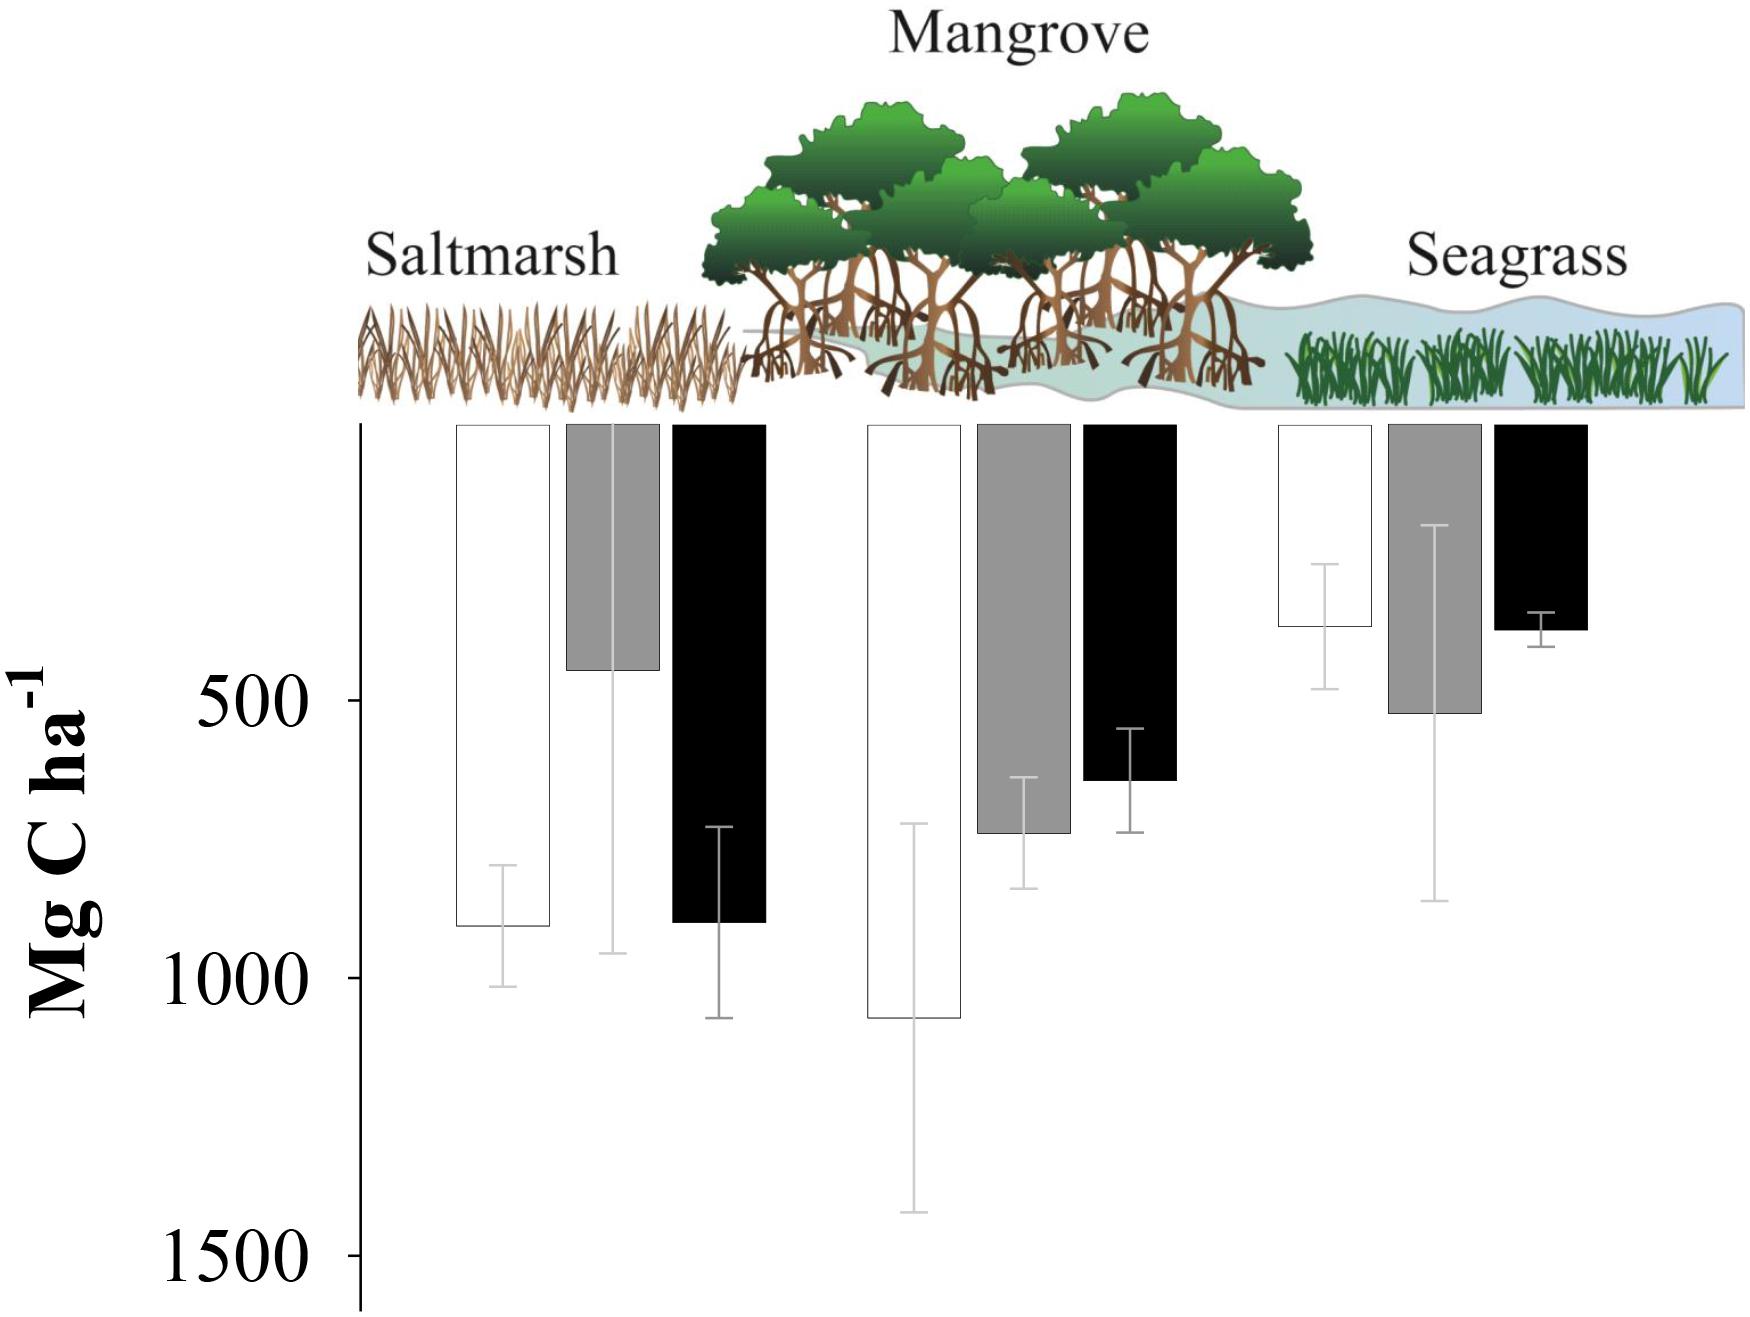
Figure 2. Carbon stocks (Mg C ha-1) of the urbanized Coffs Creek estuary (white), the agriculturally impacted Corindi River estuary (gray) and the pristine Wooli River estuary (black). Data are presented in means while bars represent standard errors. Analysis of variance found no significant differences between habitat type or location.
The results here suggest that the various degrees of development across the three estuaries in this study had no significant influence on C stocks per unit area among each blue carbon system. There was however, a significant difference among replicate C stock estimates within each blue carbon system in each estuary; suggesting that local conditions may influence the variabilities more so than regional scale processes. Local scale conditions such as elevation and subsequent tidal inundation, geomorphic location within the estuary, and proximity to allochthonous carbon sources as well as nutrient inputs have been identified in the literature to be major drivers of sedimentary blue carbon stock variabilities (McLeod et al., 2011; Sanders et al., 2014). Although the causes of variability in sedimentary C stocks estimates in this study are not clear, a significantly negative relationship was noted between the carbon content and the DBD (Figure 3). This relation suggests that DBD of blue carbon sediments are directly related to the organic matter as also described by Morris et al. (2016) for tidal wetlands.
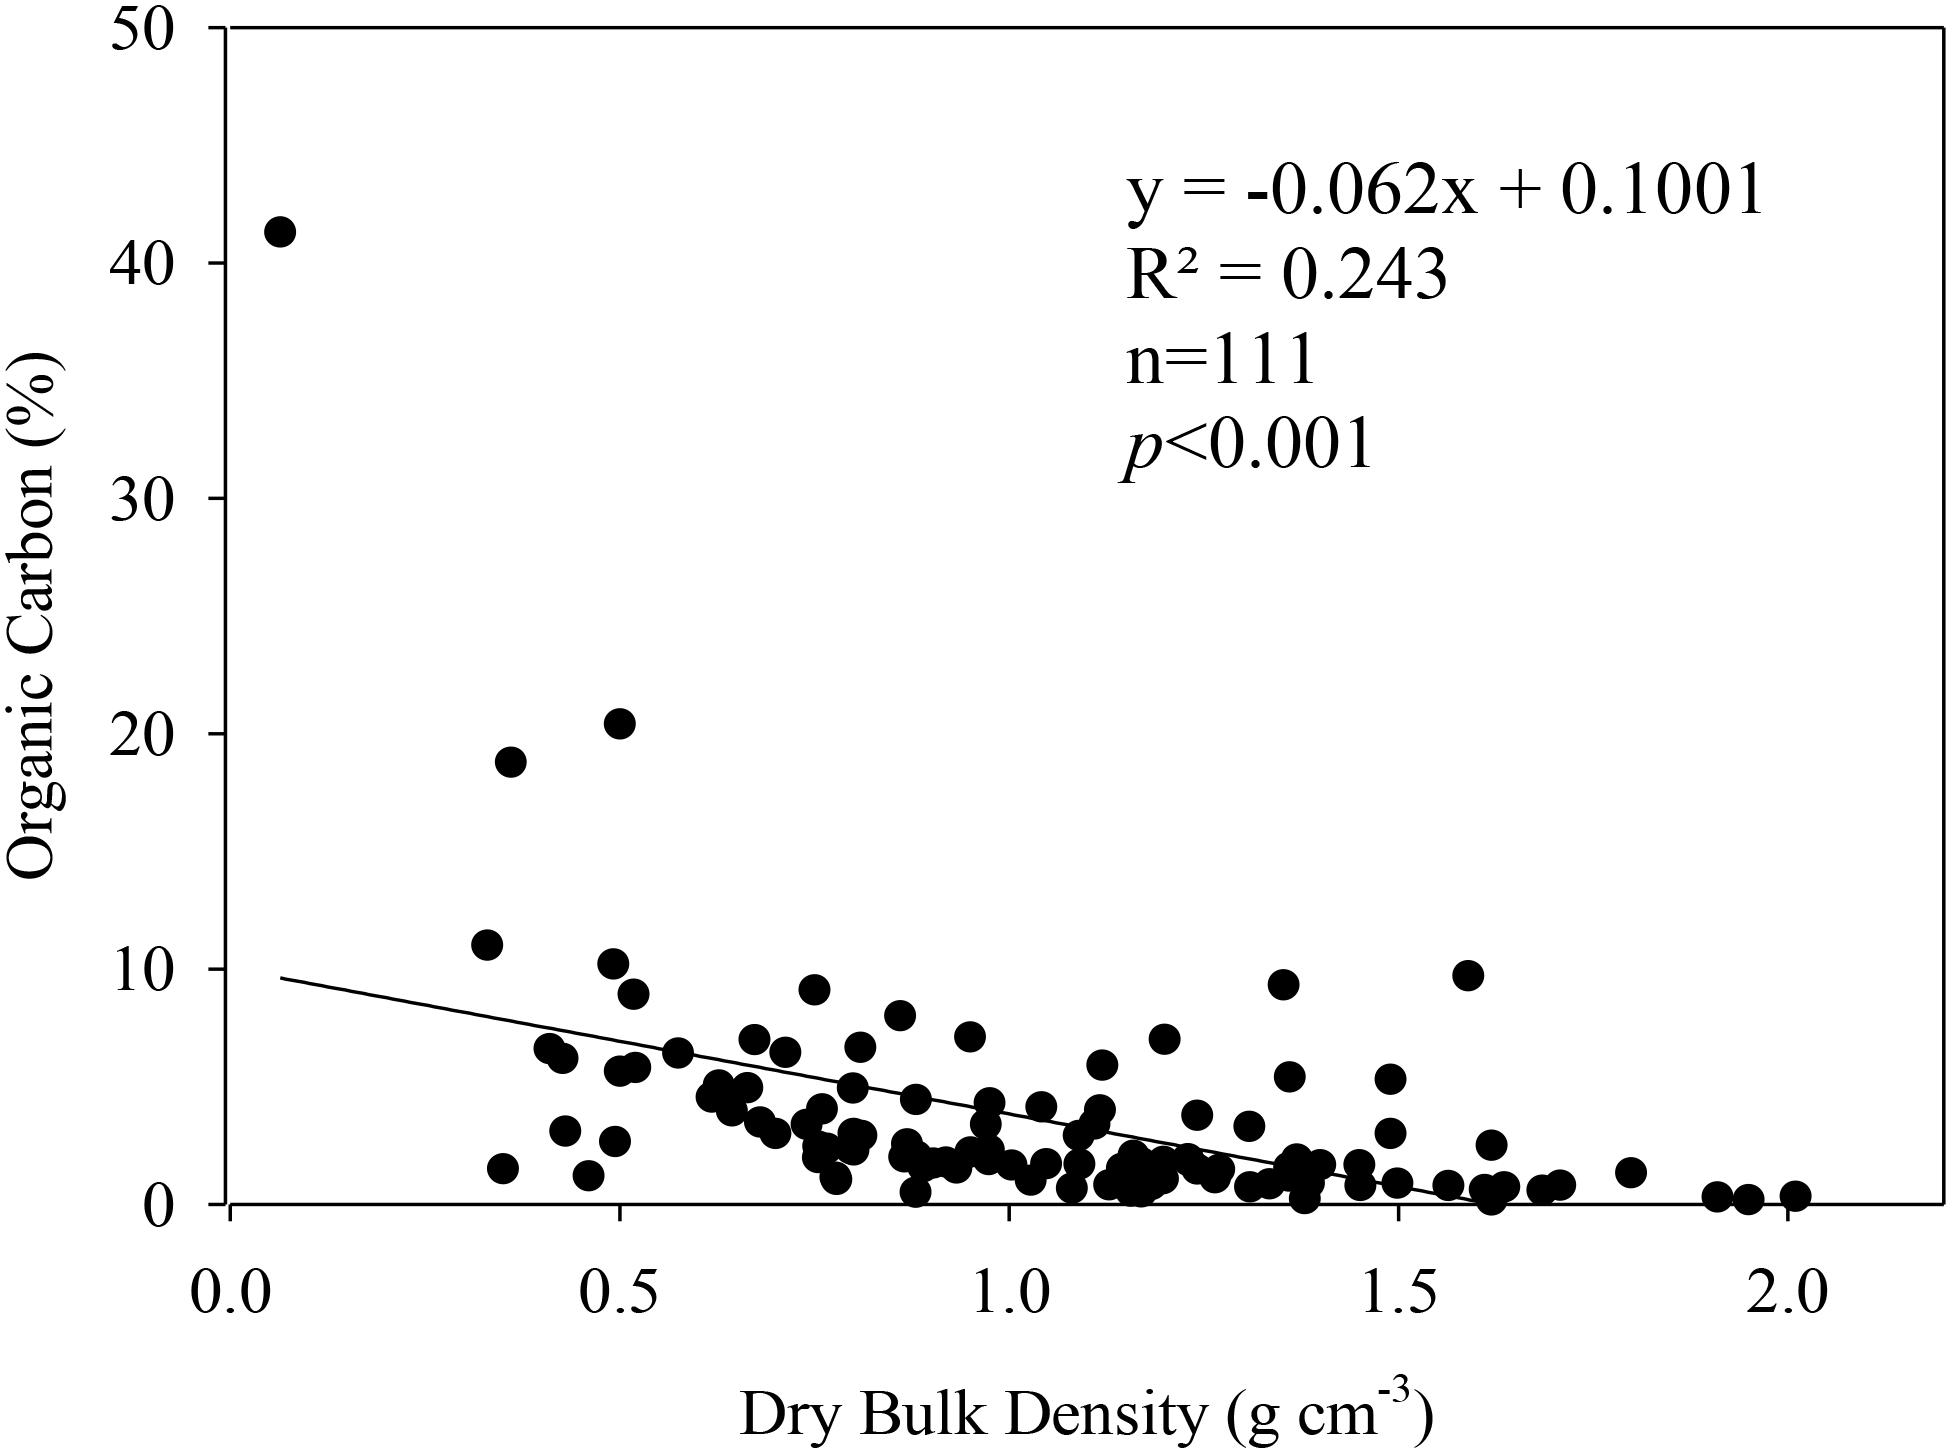
Figure 3. Negative relation between organic carbon content (%) and dry bulk density (g cm-3 year-1) from the sediment core intervals of this work.
The sedimentary C stock data from this study adds to the growing understanding of regional C storage in coastal blue carbon systems. While we have shown C stocks per area in seagrass, mangroves and saltmarsh sediments to be similar in subtropical estuaries with various stages of development (Figure 2), the effects of development itself on the areal extent of these systems can have severe consequences in regards to the total C stored within an estuary. For instance, the areal extent of each blue carbon system identified in Table 1 decreased with increasing development across the three estuaries (i.e., from the relatively pristine Wooli River estuary through to the sparsely developed Corindi River estuary and severely urbanized Coffs Creek estuary). Subsequently, the decreased areal extent of each blue carbon system resulted in the observed decrease in total C stocks with increasing development across the three estuaries (Figure 4).
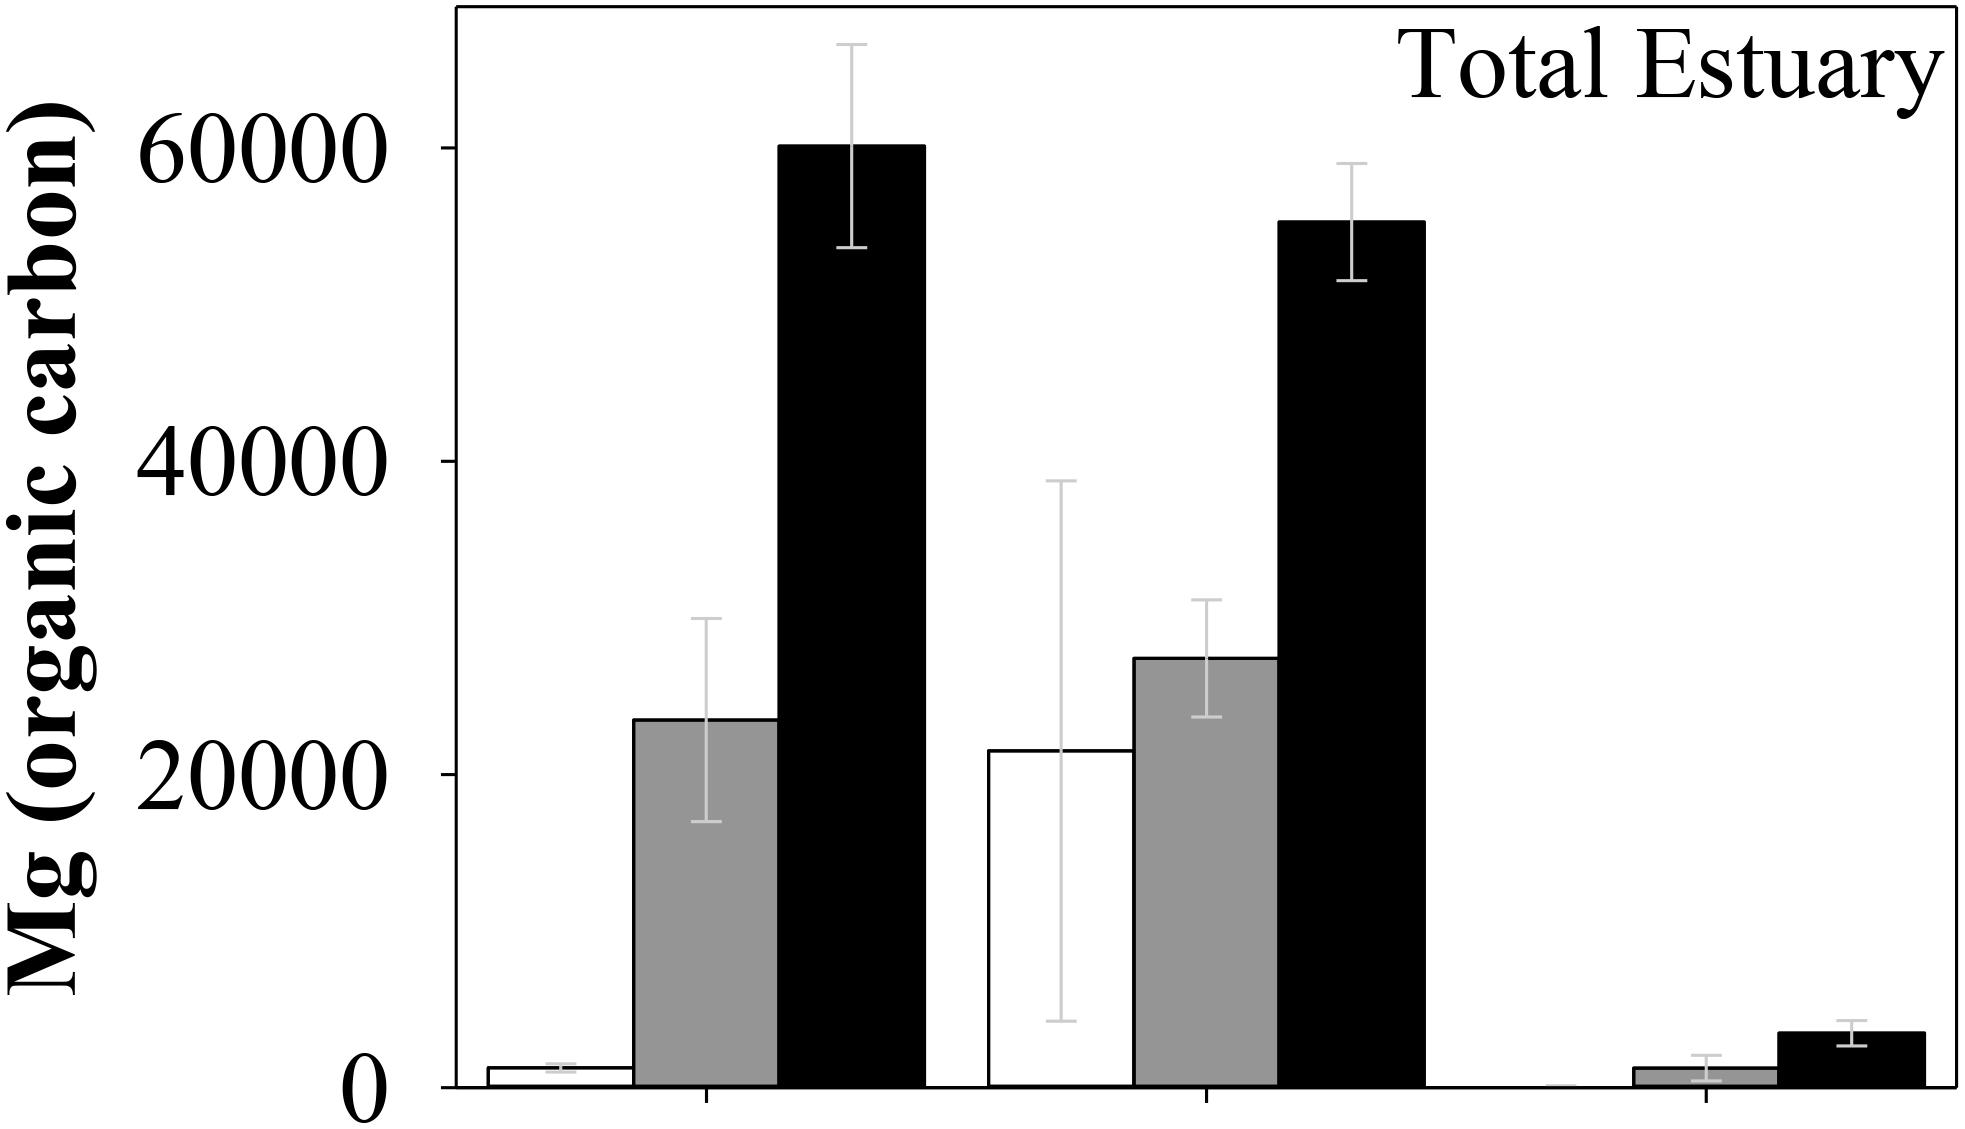
Figure 4. Total carbon stock estimates for seagrass, mangrove and saltmarsh in Coffs Creek (white), Corindi estuary (gray), and Wooli estuary (black) (Mg C). Error bars indicate the standard error.
Another important influence on coastal habitat area between the three estuaries may be related to water quality. Greater urban development has led to elevated suspended sediment and nutrient concentrations in Coffs Creek (Ryder et al., 2011, 2012). In a 2011 study of water quality, turbidity measurements at estuarine sites within Wooli and Corindi Creek were below ANZECC trigger values, while Coffs Creek estuarine sites exceeded turbidity trigger values between 20 and 33% of the sampling events. Increased turbidity may be related to inhibited light penetration to the seagrass systems along Coffs Creek, causing degradation of these seagrass habitats. In addition, nutrient concentrations of estuarine surface waters are higher in Coffs Creek than in Wooli and to a lesser extent Corindi (Ryder et al., 2011, 2012). Increases in catchment nutrient discharge promotes algal phase shift, influencing the seagrass habitat health and leading to meadow scale mortality (Orth et al., 2006; Burkholder et al., 2007; Ryder et al., 2011).
Potential Blue Carbon Emissions From Regional Development
Based on the average sedimentary carbon stocks for each blue carbon ecosystems in this study, and combined with the monetary value of carbon at a price of $AUD 12.14 per Mg, established by the Australian Emissions Reduction Fund auctions (ERF), it is estimated that over $AUD 2.35 ± 0.59 million worth of carbon could be stored within the top 3 m of sediments of the three small estuaries in this study alone (Table 4). Despite the similar C stocks per unit area between the three studied estuaries, the blue C systems of the relatively pristine Wooli River estuary are responsible for 61.3% of this monetary value, followed by the agriculturally developed Corindi River estuary (26.9%) and urbanized Coffs Creek estuary (11.8%). The greater areal extent of all three blue C systems in the Wooli River and to a lesser extent the Corindi River estuary allow for higher total C stocks as opposed to the urbanized Coffs Creek Estuary in which blue carbon system expansion or migration is limited along the estuary.
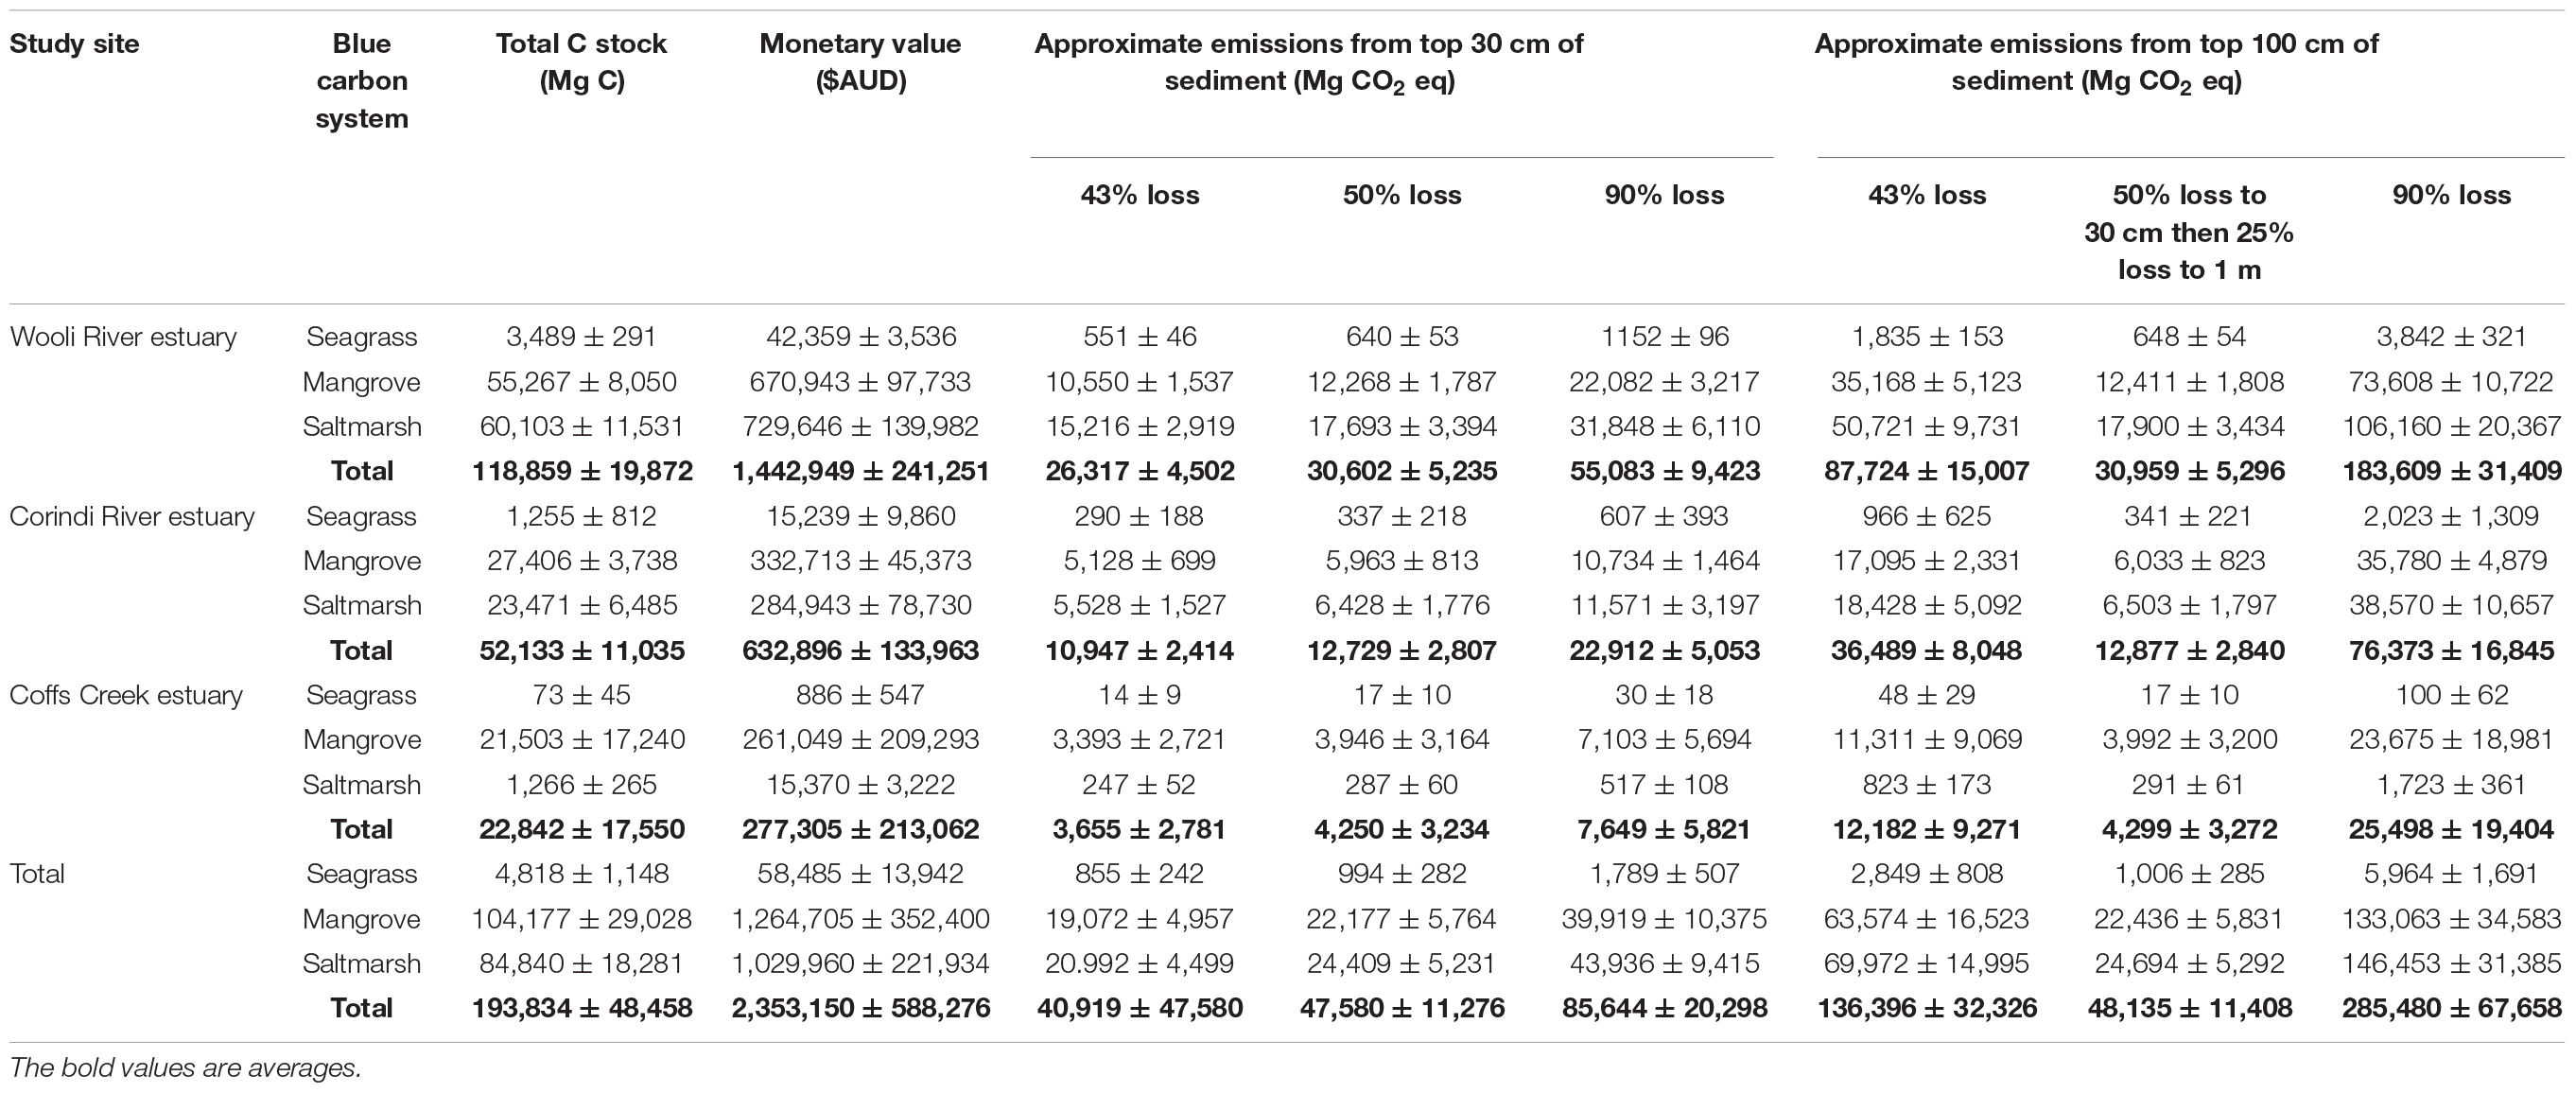
Table 4. Total C stock values from each blue C system in this study and associatedmonetary values as well as potential CO2 emissions.
Quantifying the emissions potential (often measured in carbon dioxide equivalent, or CO2e) of potentially remineralized C as a result of regional development and land use change is an important step toward protecting these systems and understanding these anthropogenic impacts on greenhouse gas forcing (Atwood et al., 2017). Despite this, there are uncertainties within the literature in regards to the amount of organic C that may be remineralized to CO2 from blue C habitat degradation. For instance, Murray et al. (2011) estimated that 90% of organic C in the top meter of sediment is remineralized to CO2 emissions while Donato et al. (2011) estimates that only 50% of organic C is remineralized from the top 30 cm and 25% of organic C is remineralized from 30 cm to 1 m depth. Furthermore, a recent study by Atwood et al. (2017) compiled carbon emissions data from several studies of blue C habitat disturbances to estimate 43% organic C remineralization to CO2 in the top 1 m of sediment within 1 year after disturbance. For consistency and comparability, CO2 equivalents in this study were calculated using organic C remineralization estimates from previous studies (Donato et al., 2011; Murray et al., 2011; Atwood et al., 2017) along with a conversion factor of 3.67 to account for differences in molecular weight of CO2 compared to C (Murray et al., 2011; Lewis et al., 2017) for this study are shown on Table 4.
Lewis et al. (2017) estimated low and high potentials for organic C remineralization from blue C systems of Victoria, Australia to be between 2,681,271 ± 198,795 and 4,826,288 ± 357,831 Mg CO2e (assuming 50 and 90% remineralization, respectively, to a depth of 30 cm). As indicated on Table 4, assuming 50 and 90% remineralization to a depth of 30 cm, the values found in this study by extrapolating New South Wales is estimated to be 1,099,081 ± 168,057 and 1, 978,347 ± 302,504 Mg CO2e, respectively. Atwood et al. (2017) compiled carbon emissions data from several mangrove habitat disturbances to estimate 43% organic C remineralization to CO2 in the top 1 m of sediment within 1 year after disturbance. Using this more recent emissions estimate of 43% remineralization (Atwood et al., 2017) and a conversion factor of 3.67 to CO2e (Murray et al., 2011), we estimate that three estuaries have potential emissions of 10,458 ± 2,965, 233,318 ± 60,639, and 256,798 ± 55,032 tons CO2e from seagrass, mangrove, and saltmarsh, respectively. It should be noted that this estimate only assumes emissions from 1 m of sediment, and during the first year after disturbance. More research should be conducted to decrease uncertainties of CO2 emissions and the long term (>1 year after disturbance) effects of blue C habitat degradation. However, these emission estimates are useful when informing managers involved in C trading schemes, such as the ERF.
Conclusion
Sediment cores from seagrass, mangrove, and saltmarsh habitats revealed high variability and similarity in organic carbon stocks of a nearly pristine Wooli River estuary as compared to the nearby agriculturally developed Corindi River estuary and urbanized Coffs Creek estuary. These results indicate similar C stocks per area between the three locations within the same region (within 50 km). Furthermore, even though the total carbon stocks decrease with increasing development, information in terms of loss of vegetated area as a result of land use change is not available, which would be important to consider for comparative purposes between each estuary studied and the effects of development. Based on the assumptions outlined in this manuscript, the relatively small regional estuaries have potential emissions of 500,574 ± 118,635 tons of CO2e. This study highlights that the presence of more vegetation due to less development provides a greater area for C storage by incremental increases in total estuary sedimentary blue carbon stocks. However, urban blue C habitats (such as Coffs Creek) and agriculturally impacted blue C habitats (such as Corindi) also have the potential to continue providing valuable ecosystem services. Therefore, the conservation and restoration of blue C habitats in both urban and less developed estuaries are justified to maximize organic C sequestration and reduce atmospheric C emissions.
Author Contributions
All authors did the field work and wrote the manuscript.
Funding
This study is was conducted as the field work component of the course “Frontiers in Marine Science I – Biological Systems and Management” at Southern Cross University, National Marine Science Center in 2017 and 2018. CJS was supported by the Australian Research Council (DE160100443) and PGA was supported by a “la Caixa” Fellowship for post-graduate studies.
Conflict of Interest Statement
The authors declare that the research was conducted in the absence of any commercial or financial relationships that could be construed as a potential conflict of interest.
Supplementary Material
The Supplementary Material for this article can be found online at: https://www.frontiersin.org/articles/10.3389/fmars.2018.00518/full#supplementary-material
References
Alongi, D. M. (2002). Present state and future of the world’s mangrove forests. Environ. Conserv. 29, 331–349. doi: 10.1017/S0376892902000231
Anderson, M. J. (2008). Animal-sediment relationships re-visited: characterising species’ distributions along an environmental gradient using canonical analysis and quantile regression splines. J. Exp. Mar. Biol. Ecol. 366, 16–27, doi: 10.1016/j.jembe.2008.07.006
Atwood, T. B., Connolly, R. M., Almahasheer, H., Carnell, P. E., Duarte, C. M., Lewis, C. J. E., et al. (2017). Global patterns in mangrove soil carbon stocks and losses. Nat. Clim. Chang. 7, 523–528. doi: 10.1038/nclimate3326
Beaumont, N. J., Jones, L., Garbutt, A., Hansom, J. D., and Toberman, M. (2014). The value of carbon sequestration and storage in coastal habitats. Estuar. Coast. Shelf Sci. 137, 32–40. doi: 10.1016/j.ecss.2013.11.022
Brown, D. R., Conrad, S., Akkerman, K., Fairfax, S., Fredericks, J., Hanrio, E., et al. (2016). Seagrass, mangrove and saltmarsh sedimentary carbon stocks in an urban estuary; Coffs Harbour, Australia. Reg. Stud. Mar. Sci. 1, 1–6. doi: 10.1016/j.rsma.2016.08.005
Burkholder, J. M., Tomasko, D. A., and Touchette, B. W. (2007). Seagrasses and eutrophication. J. Exp. Mar. Biol. Ecol. 350, 46–72. doi: 10.1016/j.jembe.2007.06.024
Chmura, G. L., Anisfeld, S. C., Cahoon, D. R., and Lynch, J. C. (2003). Global carbon sequestration in tidal, saline wetland soils. Glob. Biogeochem. Cycles 17:1111. doi: 10.13227/j.hjkx.2016.06.049
Conrad, S. R., Sanders, C. J., Santos, I. R., and White, S. A. (2018). Investigating water quality in Coffs coastal estuaries and the relationship to adjacent land use. Part 1: Sediments. National Marine Science Centre, Southern Cross University, Coffs Harbour, NSW, 42.
Duarte, C. M., Losada, I. J., Hendriks, I. E., Mazarrasa, I. and Marbà, N. (2013). The role of coastal plant communities for climate change mitigation and adaptation. Nat. Clim. Chang. 3, 961–968. doi: 10.1038/nclimate1970
Donato, D. C., Kauffman, J. B., Murdiyarso, D., Kurnianto, S., Stidham, M., and Kanninen, M. (2011). Mangroves among the most carbon-rich forests in the tropics. Nat. Geosci. 4, 293–297. doi: 10.1038/ngeo1123
Friess, D. A., and Webb, E. L. (2014). Variability in mangrove change estimates and implications for the assessment of ecosystem service provision. Glob. Ecol. Biogeogr. 23, 715–725. doi: 10.1111/geb.12140
Gedan, K. B., Silliman, B., and Bertness, M. (2009). Centuries of human-driven change in salt marsh ecosystems. Mar. Sci. 1, 117–141. doi: 10.1146/annurev.marine.010908.163930
Hayes, M. A., Jesse, A., Hawke, B., Baldock, J., Tabet, B., Lockington, D., et al. (2017). Dynamics of sediment carbon stocks across intertidal wetland habitats of Moreton Bay, Australia. Glob. Chang. Biol. 23, 4222–4234. doi: 10.1111/gcb.13722
Hopkinson, C. S., Cai, W.-J., and Hu, X. (2012). Carbon sequestration in wetland dominated coastal systems — a global sink of rapidly diminishing magnitude. Curr. Opin. Environ. Sustain. 4, 186–194. doi: 10.1016/j.cosust.2012.03.005
Howard, J., Mcleod, E., Thomas, S., Eastwood, E., Fox, M., Wenzel, L., et al. (2017). The potential to integrate blue carbon into MPA design and management. Aquat. Conserv. 27, 100–115. doi: 10.1002/aqc.2809
Irving, A. D., Connell, S. D., and Russell, B. D. (2011). Restoring coastal plants to improve global carbon storage: reaping what we sow. PLoS One 6:e18311. doi: 10.1371/journal.pone.0018311
Kelleway, J., Serrano, O., Baldock, J., Cannard, T., Lavery, P., Lovelock, C., et al. (2017). Technical Review of Opportunities for Including Blue Carbon in the Australian Government’s Emissions Reduction Fund. Canberra, ACT: CSIRO.
Lavery, P. S., Mateo, M. -Á, Serrano, O., and Rozaimi, M. (2013). Variability in the carbon storage of seagrass habitats and its implications for global estimates of blue carbon ecosystem service. PLoS One 8:e73748. doi: 10.1371/journal.pone.0073748
Lewis, C. J. E., Carnell, P. E., Sanderman, J., Baldock, J. A., and Macreadie, P. I. (2017). Variability and vulnerability of coastal ‘blue carbon’stocks: a case study from Southeast Australia. Ecosystems 21, 263–279. doi: 10.1007/s10021-017-0150-z
Lovelock, C. E., Atwood, T., Baldock, J., Duarte, C. M., Hickey, S., Lavery, P. S., et al. (2017). Assessing the risk of carbon dioxide emissions from blue carbon ecosystems. Front. Ecol. Environ. 15:257–265. doi: 10.1002/fee.1491
Lovelock, C. E., Cahoon, D. R., Friess, D. A., Guntenspergen, G. R., Krauss, K. W., Reef, R., et al. (2015). The vulnerability of Indo-Pacific mangrove forests to sea-level rise. Nature 526, 559–563. doi: 10.1038/nature15538
Macreadie, P. I., Nielsen, D. A., Kelleway, J. J., Atwood, T. B., Seymour, J. R., Petrou, K., et al. (2017a). Can we manage coastal ecosystems to sequester more blue carbon? Front. Ecol. Environ. 15, 206–213. doi: 10.1002/fee.1484
Macreadie, P. I., Ollivier, Q., Kelleway, J., Serrano, O., Carnell, P., Lewis, C. E., et al. (2017b). Carbon sequestration by Australian tidal marshes. Sci. Rep. 7:44071. doi: 10.1038/srep44071
Maher, D. T., Call, M., Santos, I. R., and Sanders, C. J. (2018). Beyond burial: lateral exchange is a significant atmospheric carbon sink in mangrove forests. Biol. Lett. 14:20180200. doi: 10.1098/rsbl.2018.0200
McLeod, E., Chmura, G. L., Bouillon, S., Salm, R., Björk, M., Duarte, C. M., et al. (2011). A blueprint for blue carbon: toward an improved understanding of the role of vegetated coastal habitats in sequestering CO 2. Front. Ecol. Environ. 9, 552–560. doi: 10.1890/110004
Morris, J. T., Barber, D. C., Callaway, J. C., Chambers, R., Hagen, S. C., Hopkinson, C. S., et al. (2016). Contributions of organic and inorganic matter to sediment volume and accretion in tidal wetlands at steady state. Earth’s Future 4, 110–121. doi: 10.1002/2015EF000334
Murray, B. C., Pendleton, L., Jenkins, W. A., and Sifleet, S. (2011). Green Payments for Blue carbon: Economic Incentives for Protecting Threatened Coastal Habitats. Durham: Nicholas Institute for Environmental Policy Solutions.
Orth, R. J., Carruthers, T. J., Dennison, W. C., Duarte, C. M., Fourqurean, J. W., Heck, K. L., et al. (2006). A global crisis for seagrass ecosystems. AIBS Bull. 56, 987–996. doi: 10.1641/0006-3568(2006)56[987:AGCFSE]2.0.CO;2
Pendleton, L., Donato, D. C., Murray, B. C., Crooks, S., Jenkins, W. A., Sifleet, S., et al. (2012). Estimating global “blue carbon” emissions from conversion and degradation of vegetated coastal ecosystems. PLoS One 7:e43542. doi: 10.1371/journal.pone.0043542
Ricart, A. M., York, P. H., Rasheed, M. A., Pérez, M., Romero, J., Bryant, C. V., et al. (2015). Variability of sedimentary organic carbon in patchy seagrass landscapes. Mar. Pollut. Bull. 100, 476–482. doi: 10.1016/j.marpolbul.2015.09.032
Roper, T., Creese, B., Scanes, P., Stephens, K., Williams, R., Dela-Cruz, J., et al. (2011). “Assessing the condition of estuaries and coastal lake ecosystems,” in NSW Monitoring, Evaluation and Reporting Program, (Sydney: Office of Environment and Heritage).
Ryder, D., Burns, A., Veal, R., Schmidt, J., Robertson, M., Stewart, M., et al. (2012). Coffs Creek Estuary Coastal Zone Management Plan Literature and Information Review, ed. O. O. E. A. Heritage (Coffs Harbour, NSW: Coffs Harbour City Council).
Ryder, D., Veal, R., Sbrocchi, C., and Schmidt, J. (2011). Bellinger-Kalang Rivers EcohealthProject: Assessment of River and Estuarine Condition 2009-2010. Bellingen, NSW: Bellingen Shire Council.
Sanders, C. J., Eyre, B. D., Santos, I. R., Machado, W., Luiz-Silva, W., Smoak, J. M., et al. (2014). Elevated rates of organic carbon, nitrogen, and phosphorus accumulation in a highly impacted mangrove wetland. Geophys. Res. Lett. 41, 2475–2480. doi: 10.1002/2014GL059789
Sanders, C. J., Maher, D. T., Tait, D. R., Williams, D., Holloway, C., Sippo, J. Z., et al. (2016). Are global mangrove carbon stocks driven by rainfall? J. Geophys. Res. 121, 2600–2609. doi: 10.1002/2016JG003510
Keywords: soil carbon stocks, seagrass, mangrove, saltmarsh, estuaries, Australia
Citation: Conrad S, Brown DR, Alvarez PG, Bates B, Ibrahim N, Reid A, Monteiro LS, Silva DA, Mamo LT, Bowtell JR, Lin HA, Tolentino NL and Sanders CJ (2019) Does Regional Development Influence Sedimentary Blue Carbon Stocks? A Case Study From Three Australian Estuaries. Front. Mar. Sci. 5:518. doi: 10.3389/fmars.2018.00518
Received: 13 October 2018; Accepted: 21 December 2018;
Published: 14 January 2019.
Edited by:
Vanessa F. Fonseca, Center for Marine and Environmental Sciences (MARE), PortugalReviewed by:
Alice R. Jones, University of Adelaide, AustraliaJongseong Ryu, Anyang University, South Korea
Copyright © 2019 Conrad, Brown, Alvarez, Bates, Ibrahim, Reid, Monteiro, Silva, Mamo, Bowtell, Lin, Tolentino and Sanders. This is an open-access article distributed under the terms of the Creative Commons Attribution License (CC BY). The use, distribution or reproduction in other forums is permitted, provided the original author(s) and the copyright owner(s) are credited and that the original publication in this journal is cited, in accordance with accepted academic practice. No use, distribution or reproduction is permitted which does not comply with these terms.
*Correspondence: Christian Joshua Sanders, Y2hyaXN0aWFuLnNhbmRlcnNAc2N1LmVkdS5hdQ==
†These authors have contributed equally to this work