 Céline C. Michiels1,2
 Julia A. Huggins1,2
 Karina E. Giesbrecht3
 Jenifer S. Spence1,2
 Rachel L. Simister1,2Diana E. Varela4
 Steven J. Hallam1,5,6,7,8
 Sean A. Crowe1,2,8*
- 1Department of Microbiology and Immunology, The University of British Columbia, Vancouver, BC, Canada
- 2Department of Earth, Ocean and Atmospheric Sciences, The University of British Columbia, Vancouver, BC, Canada
- 3School of Earth and Ocean Sciences, University of Victoria, Victoria, BC, Canada
- 4Department of Biology, School of Earth and Ocean Sciences, University of Victoria, Victoria, BC, Canada
- 5ECOSCOPE Training Program, The University of British Columbia, Vancouver, BC, Canada
- 6Graduate Program in Bioinformatics, The University of British Columbia, Vancouver, BC, Canada
- 7Genome Science and Technology Training Program, The University of British Columbia, Vancouver, BC, Canada
- 8Peter Wall Institute for Advanced Studies, The University of British Columbia, Vancouver, BC, Canada
Marine oxygen minimum zones (OMZs) support 30–50% of global fixed-nitrogen (N) loss but comprise only 7% of total ocean volume. This N-loss is driven by canonical denitrification and anaerobic ammonium oxidation (anammox), and the distribution and activity of these two processes vary greatly in space and time. Factors that regulate N-loss processes are complex, including organic matter availability, oxygen concentrations, and NO2− and NH4+ concentrations. While both denitrification and anammox produce N2, the overall geochemical outcome of these processes are different, as incomplete denitrification, for example, produces N2O, which is a potent greenhouse gas. Information on rates of anammox and denitrification and more detailed ecophysiological knowledge of the microorganisms catalyzing these processes are needed to develop more robust models of N-loss in OMZs. To this end, we conducted monthly incubations with 15N-labeled N during under anoxic conditions and during a deep water renewal cycle in Saanich Inlet, British Columbia, a persistently anoxic fjord. Both denitrification and anammox operated throughout the low oxygen water column with depth integrated rates of anammox and denitrification ranging from 0.15 ± 0.03 to 3.4 ± 0.3 and 0.02 ± 0.006 to 14 ± 2 mmol N2 m−2 d−1, respectively. Most N2 production in Saanich Inlet was driven by denitrification, with high rates developing in response to enhanced substrate supply from deep water renewal. Dynamics in rates of denitrification were linked to shifts in microbial community composition. Notably, periods of intense denitrification were accompanied by blooms in an Arcobacter population against a background community dominated by SUP05 and Marinimicrobia. Rates of N2 production through denitrification and anammox, and their dynamics, were then explored through flux-balance modeling with higher rates of denitrification linked to the physiology of substrate uptake. Overall, both denitrification and anammox operated throughout the year, contributing to an annual N-loss of 2 × 10⁻³ Tg N2 yr−1, 37% of which we attribute to anammox and 63% to complete denitrification. Extrapolating these rates from Saanich Inlet to all similar coastal inlets in BC (2478 km2), we estimate that these inlets contribute 0.1% to global pelagic N-loss.
Introduction
Nitrogen (N) is an essential element to life and is used as a building block for proteins and nucleic acids in all terrestrial and marine organisms. The bioavailability of N, therefore, can limit primary production in both terrestrial and aquatic compartments of the biosphere (Falkowski, 1997; Falkowski et al., 2008). The largest pool of N at the Earth’s surface is N2 in the atmosphere and this N2 is made available to life mostly through energetically expensive microbial N-fixation (Canfield et al., 2010a). The abundance of fixed-N in the oceans is governed by the balance between N-fixation into biomass, biomass deposition and ultimate burial in marine sediments, and the return of fixed-N to the atmosphere through a modular series of redox reactions that ultimately lead to anaerobic N2 production (Gruber, 2004). The processes that comprise the N-cycle are spatially decoupled with most N-fixation occurring in the euphotic surface ocean (Capone, 2001), the oxidative components distributed throughout much of the ocean, and anaerobic N2 production partitioned between the low oxygen waters (30–50%) that typically develop at intermediate water depths and in eutrophic coastal regions, as well as in bottom sediments (50–70%) (Codispoti, 2007). The availability of N to marine life, therefore, depends on the relative rates of N-fixation versus N-loss, and N-loss is expected to scale with the extent and intensity of low oxygen marine waters, which are currently expanding throughout the global ocean with unconstrained feedbacks on marine N inventories (Keeling et al., 2010; Schmidtko et al., 2017; Breitburg et al., 2018).
Under low oxygen conditions (<20 μM O2 concentration), NO3− is used as an electron acceptor in anaerobic microbial energy transduction leading, in part, to N2 production and closure of the N- cycle. Such low oxygen conditions commonly develop in the open ocean at intermediate water depths, in restricted basins, and in eutrophic coastal regions, when respiratory oxygen consumption outpaces physical mixing and oxygenic photosynthesis. Low oxygen marine waters are commonly referred to as Oxygen Minimum Zones (OMZs), and are pervasive features of the modern oceans comprising 7% of current total ocean volume [with O2 <20 μM] (Paulmier and Ruiz-Pino, 2009). The anoxic cores of OMZs, which contain oxygen concentrations below the limit of detection of oxygen sensors generally used in oceanographic research (<5 μM, but as low as 1 nM), constitute only 0.1% of the ocean’s total volume (Codispoti et al., 2001; Ulloa et al., 2012). Despite their relatively low volumes, OMZs play an outsized role in N biogeochemistry driving up to 50% of marine fixed N-loss with a lower estimate of the annual pelagic N-sink of 150 Tg N (Codispoti, 2007).
N2 production and thus N-loss in OMZs is driven by two entirely different microbial metabolisms: canonical denitrification and anaerobic ammonium oxidation (anammox). In denitrification a suite of either inorganic [sulfide (HS−), ferrous iron (Fe(II))] or organic electron donors is used to reduce NO3− through a series of intermediates; NO2−, NO, and N2O to ultimately produce N2 (see Eqs. 1 and 2).
Organoheterotrophic denitrification (Mucciet al., 2000):
Chemotrophic denitrification:
Anammox directly couples NO2− reduction to the oxidation of NH4+ through hydroxylamine and hydrazine intermediates to produce N2 (see Eq. 3).
Both pathways are fuelled, in part, by relatively oxidized N species and yield N2 as their ultimate metabolic products, and thus can occupy overlapping niches. Denitrification and anammox, however, diverge in both their ecophysiology and their biogeochemical outcomes including possible leakages of intermediate N species and their overall influence on the carbon (C) cycle (Voss et al., 2013). Denitrification, for example, can either consume or produce CO2 depending on the electron donor used, as denitrifiers can be heterotrophic or autotrophic. Anammox, on the other hand, is considered exclusively autotrophic and only consumes CO2. Denitrification, furthermore, yields N2O as an intermediate, a potent greenhouse gas, that may accumulate during partial denitrification and play a role in global climate forcing (Fowler et al., 2013). The differing ecophysiologies of the organisms conducting denitrification and anammox are thus expected to interact with one another in different ways across a spectrum of anaerobic conditions. These differences confound attempts to model N-cycle dynamics and its interactions with other cycles, without explicit descriptions for both anammox and denitrification and their regulation.
Process rate measurements are beginning to define the relationships between anammox, denitrification and the N-cycle. In OMZs globally, anammox appears to support most N2 production (Kuypers et al., 2005; Thamdrup et al., 2006; Hamersley et al., 2007; Lam et al., 2009; Canfield et al., 2010b; Jensen et al., 2011; Kalvelage et al., 2013; De Brabandere et al., 2014), while denitrification may dominate ephemerally (Ward et al., 2009; Bulow et al., 2010; Dalsgaard et al., 2012; Babbin et al., 2014). In open ocean OMZs, the relative contributions of anammox and denitrification to N2 production are theoretically constrained by the stoichiometry of settling organic matter and the NH4+ supply from remineralization of organic matter to anammox (Codispoti et al., 2001; Van Mooy et al., 2002; Devol, 2003; Koeve and Kähler, 2010; Babbin et al., 2014). This constraint develops when anammox is limited by NH4+ supplied through ammonification of organic N during heterotrophic NO3− respiration (organotrophic denitrification). In this case, N2 production should occur 71% through denitrification and 29% through anammox based on Redfieldian organic matter stoichiometry of 106C:16N (Van Mooy et al., 2002; Dalsgaard et al., 2003; Devol, 2003).
Here, denitrification produces 16 moles of NH4+ and 16 moles of NO2− that fuel anammox, producing 16 moles out of a total 55.2 moles N2, hence 29% of the total N2 production (Eqs. 5 and 6).
This expected ratio between anammox and denitrification, however, is rarely observed in the ocean and deviations from the ratio can be at least partially explained through variability in organic matter composition and departures from the Redfield ratio (Babbin et al., 2014). While this stoichiometric variability appears to account for differences observed in the role of anammox in N2 production in some open ocean OMZs, it remains unclear to what extent organic matter stoichiometry can explain the apparently outsized role of anammox in global N2 production, more generally. Denitrification is commonly undetected in many OMZs, and this then raises the question as to what supplies NH4+ to anammox when denitrification appears absent. One possibility is microbial NO3− reduction to NH4+ (DNRA), which has been detected in the Peruvian OMZ and above the Omani shelf, and could be partially responsible for directly supplying NH4+ to anammox (Lam et al., 2009; Jensen et al., 2011). While DNRA could provide NH4+ for anammox in some cases, it is unlikely the universal source as the rates of DNRA measured are generally insufficient to fully support the NH4+ requirements of concurrent anammox (Lam et al., 2009). Other possible sources of NH4+ include remineralization of organic matter through NO3− reduction to NO2−, microaerobic respiration, and sulfate reduction (Canfield et al., 2010b), and in certain shallow settings, benthic release of NH4+ (Lam et al., 2009; Kalvelage et al., 2013). While we are gaining a clearer picture of the controls on rates of anammox and denitrification in OMZs, there remain no universal rules that allow quantitative prediction of the partitioning between these two pathways.
Beyond observations from canonical OMZs, anammox and denitrification have been reported from other anoxic environments, including marine sediments, anoxic fjords and lakes, and wastewater treatment facilities. In marine sediments for example, it has been shown that the relative contribution of anammox to N2 production increases dramatically with both distance from the coast and water depth (Thamdrup and Dalsgaard, 2002; Trimmer and Nicholls, 2009) with anammox comprising up to 80% of the total N-loss at 700 m depth (Engstrom et al., 2005). This trend may be attributed to decreased organic matter content in deeper sediments (Trimmer and Nicholls, 2009). Indeed, availability of organic matter, rather than its reactivity or quality, appears to regulate the relative importance of denitrification and anammox in estuarine sediments (Nicholls and Trimmer, 2009). The relative contribution of anammox to sediment N2 production also appears to increase when NO3− concentrations are persistently high in overlying waters (Rich et al., 2008; Nicholls and Trimmer, 2009). Notably, in sediments underlying low oxygen marine waters, nearly all N2 production was supported by anammox (Prokopenko et al., 2013). In these sediments, NH4+ was supplied to anammox through DNRA. This implies then that the relative importance of anammox to sediment N2 production may in part depend on the activity of DNRA. HS− may also play a role in regulating anammox and denitrification. While HS− is a common electron donor and thus a suitable substrate for denitrification, it has been shown to inhibit anammox at micromolar levels, possibly through toxicity (Jensen et al., 2009). This is consistent with the distribution of anammox, which appears to operate above the sulphidic zone in the Black Sea (Jensen et al., 2008). Likewise, anammox contributes up to 30% of the N2 production in lacustrine water columns, but the highest rates of anammox occur in nearly hydrogen sulfide (HS−) free waters (Wenk et al., 2013). In contrast, anammox appears entirely excluded from ferruginous (iron-rich) lake waters and sediments (Michiels et al., 2017; Robertson and Thamdrup, 2017), and ferruginous estuarine sediments (Roberts et al., 2014; Robertson et al., 2016). Taken together, the emerging picture suggests that the regulation of the relative importance of anammox and denitrification to total N2 production is convoluted and development of predictive knowledge will require comprehensive and detailed studies across the broad range of systems where these processes are known to operate.
We have conducted a time-series study of the rates of denitrification and anammox and their relative contribution to N2 production in Saanich Inlet (SI). SI is a persistently anoxic fjord that provides a tractable ecosystem in which to study anaerobic microbial metabolisms that are relevant and extensible to low oxygen environments, globally. Biogeochemical research has been conducted in SI since 1965 (Richards, 1965) and has culminated with instrumented real-time monitoring and a more than 10 years continuous time-series experiment (Walsh et al., 2009; Zaikova et al., 2010; Hawley et al., 2017b; Torres-Beltrán et al., 2017), making it one of the best studied anoxic fjords on Earth. The inlet is situated on the southern tip of Vancouver Island (see Figure 1A) and is up to 228 m deep with a 75 m deep glacial sill at its entrance that restricts hydrological connection to the Strait of Georgia and the mixing of deep basin waters. Similar to OMZs, aerobic respiration in the SI water column outpaces O2 supply through physical water mixing and photosynthesis in the surface waters, rendering low oxygen conditions below 100 m for most of the year (Figure 1B). In contrast to most open ocean OMZs, however, sulphidic conditions develop in the bottom waters of SI as a result of either water column sulfate reduction (Anderson and Devol, 1973) and/or sulfide efflux from underlying sediments (Devol et al., 1984). Most years, SI stagnant deep waters transition from sulphidic to oxic at the end of the summer (late August – early September) in response to upwelling off the coast of Vancouver Island that forces dense well-oxygenated waters into the Strait of Georgia and over the sill into the inlet (Anderson and Devol, 1973), in connection to weak tidal currents (Manning et al., 2010). The inlet thus can exist in two main states during the year if renewal occurs: a state of “stagnation” referring to low oxygen concentrations in the deep-waters and a state of renewal when oxygenated waters penetrate the inlet and mix with low oxygen deep-waters. These physical–chemical characteristics combine to support microbial communities with anaerobic metabolisms that couple the C, N and S-cycles and are broadly analogous to those we expect to find in other low oxygen and anoxic marine waters globally (Wright et al., 2012).
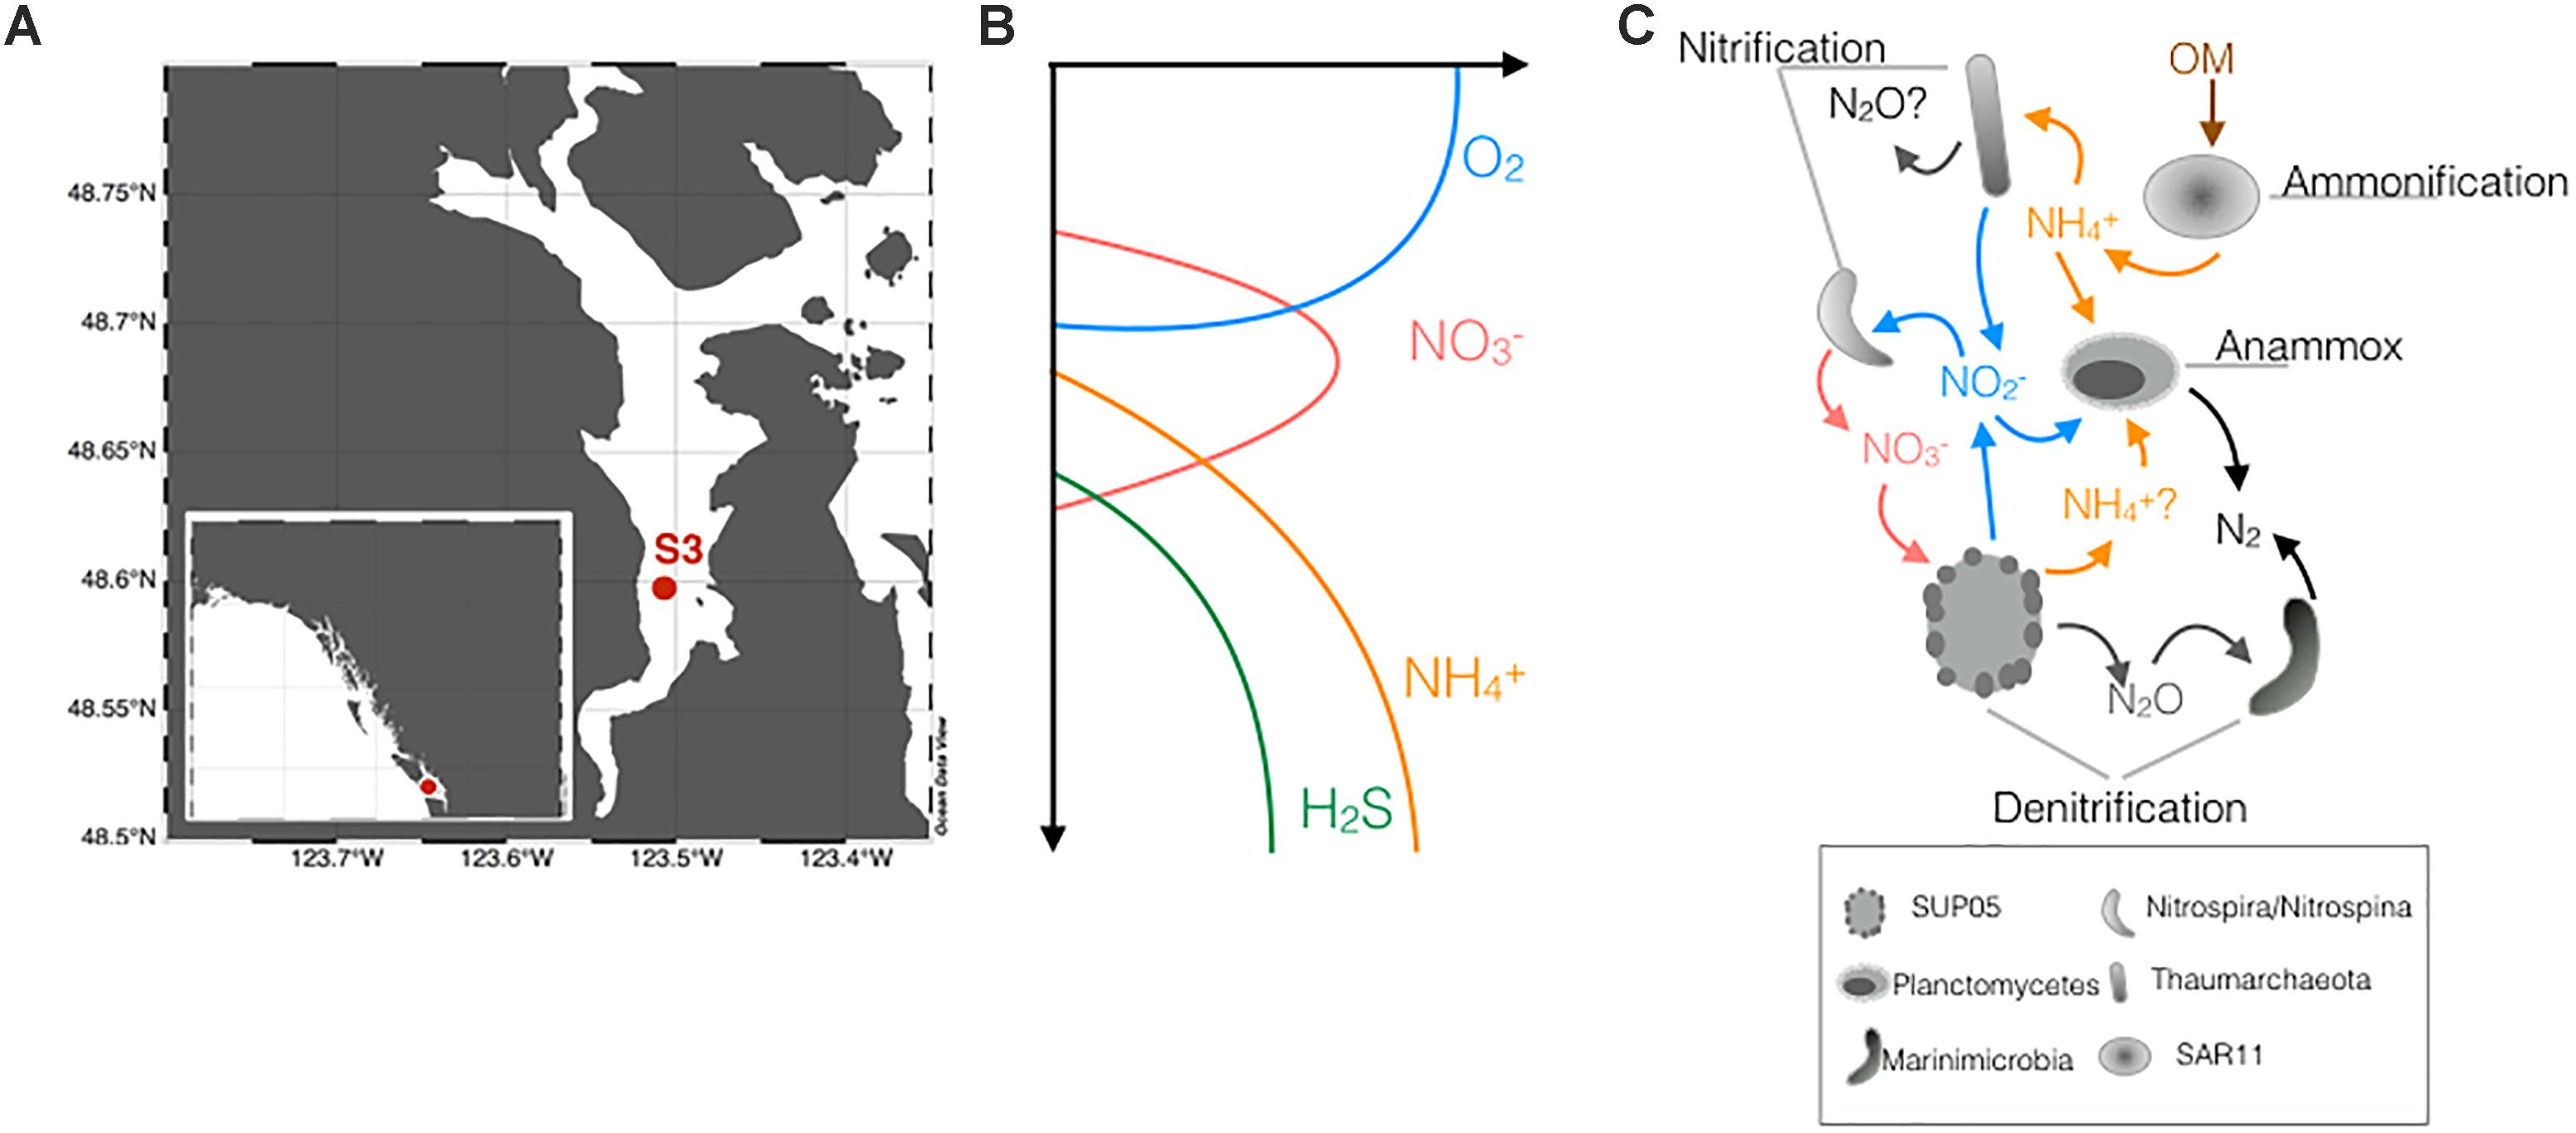
Figure 1. (A) Sampling of Station S3 in Saanich Inlet, on Vancouver Island, British Columbia (Canada). Sampling of S3 happened once a month within a historic time series data collection. (B) Typical redox gradients found in SI. These gradients move vertically depending on the season. (C) Active microbial metabolisms of the N-cycle present along the redox gradients of SI, modified from Hawley et al. (2014).
N-cycling and its interactions with the other cycles in SI have been previously interrogated using a variety of geochemical and microbiological analyses. Geochemical data indirectly imply that SI supports relatively high rates of both pelagic and benthic N-loss (Manning et al., 2010; Bourbonnais et al., 2013) that vary seasonally, with the highest rates in the winter (December–February, 8.1 mmol m−2 d−1) and lowest in the summer (May–August, 1.7 mmol m−2 d−1) (Manning et al., 2010). Multi-omic analyses revealed that microbial communities in SI harbor the metabolic potential to catalyze many components of the N-cycle and to link N to cycling of C and S (Walsh et al., 2009; Hawley et al., 2014, 2017a). These metabolic pathway reconstructions have led to a conceptual model describing the microbial interactions that underpin N-cycling in SI, and low oxygen waters more broadly. Specifically, this model (reproduced in Figure 1C from Hawley et al., 2014) proposes that Thaumarchaeota are responsible for the first step of nitrification (NH4+ to NO2−) and that two different species of bacteria, Nitrospina gracilis and Nitrospira defluvii, oxidize NO2− to NO3−. Along with nitrification, the SAR11 are the most abundant aerobic heterotrophs, and they are thought to degrade settling organic matter and release NH4+ to the oxic water column (Figure 1C). Lower in the water column, the model suggests that Planctomycetes produce N2 through the anammox process, while bacteria from the SUP05 clade (Gammaproteobacteria) were implicated in reducing NO3− to N2O (Figure 1C). The final step of denitrification remained more elusive but analyses of Single Cell Amplified Genomes (SAGs) reveal metabolic potential for N2O reduction to N2 in the Marinimicrobia ZA3312c-A and SHBH1141 (previously known as Marine Group-A) (Hawley et al., 2017a). Notably, the taxonomic affiliations and genomic make-up of the key organisms that drive N-cycling in SI are closely related to those found across OMZs and other anoxic marine environments globally (Wright et al., 2012). For example, the Gammaproteobacteria SUP05 - with a single cultivated strain, Ca. Thioglobus autotrophicus strain EF1 (Shah et al., 2017) – appears to be a ubiquitous member of OMZ microbial communities with the metabolic potential for partial denitrification (Stevens and Ulloa, 2008; Walsh et al., 2009; Hawley et al., 2014), along with bacteria from the group Marinimicrobia that reduce N2O to N2 (Hawley et al., 2017a) and are some of the most widely distributed and abundant taxa in marine OMZs.
The conceptual metabolic model for coupled C, N, and S cycling in OMZs was recently expanded into a quantitative ‘gene-centric’ model that integrates metabolic potential derived from multi-omic information with geochemical data to predict process rates (Louca et al., 2016). Modeled rates were validated through direct measurements, but these rates were an order of magnitude lower than the rates needed to support previous geochemical data (Manning et al., 2010). These observations highlight a discontinuity between current conceptual and quantitative models of the N-cycle in SI and a need for data that more fully capture and integrate the dynamics of N-cycling across multiple seasons.
Here, we used isotope labeling experiments to directly quantify rates and pathways of anaerobic N cycling in SI over an entire year. These measurements allowed us to calculate annual N-loss from Saanich inlet, determine the specific microbial pathways that are responsible, and to assess the biogeochemical controls on the rates and pathways of N-loss in the inlet. Overall, our data reveal that fixed N-loss from SI has strong seasonality and that periods of intense N-loss during the summer are driven primarily through sulfide-dependent denitrification, which is likely fuelled by benthic sulfide supply and new input of NO3− from a partial renewal of the water column. Anammox also contributed to N-loss at relatively constant rates throughout the year.
Materials and Methods
Study Site and Sampling
Saanich Inlet (SI) is a marine fjord located on the west coast of Vancouver Island, British Columbia, Canada (Figure 1). We conducted a monthly time series experiment between January and December 2015 (Table 1) and sampled at station S3 (Figure 1 – 48° 35.5 N and 123° 30.3 W, 227 m deep). A standard profile of 16 depths was sampled every month with 12L GO-FLO bottles attached in-series to a steel cable (10, 20, 40, 60, 75, 85, 90, 97, 100, 110, 120, 135, 150, 165, 185, and 200 m). Depths were set using a metered winch cable with a precision of plus or minus 0.5 m and the accuracy of the depth reached was checked with the CTD depth profile. CTD profiles [pressure (SBE 29), conductivity (SBE 4C), temperature (SBE 3F), and oxygen (SBE 43)] were obtained with the SBE25 Sealogger CTD (SBE). Oxygen concentrations measured with the SBE 43 sensor were calibrated monthly against Winkler titrations (Grasshoff et al., 1999) with a limit of detection <1 μM. The CTD, attached at the end of the winch cable, and the bottles were lowered to their final depths and left there to equilibrate with surrounding water for at least a minute before closing.
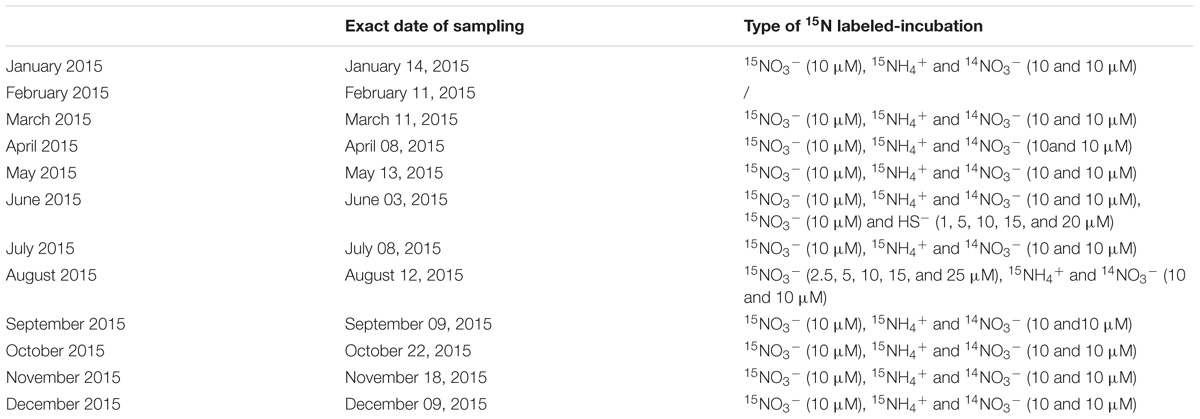
Table 1. Addition of labeled N-species and electron donors to incubations in 2015.
Samples for nutrient concentration measurements were immediately filtered and put on ice for later analysis. Samples for sulfide analyses were fixed in 0.5% zinc acetate final concentration without prior filtration and frozen at −20°C for later analysis. 250 mL serum bottles destined for isotope labeling experiments were overfilled three times with water from 7 depths (90, 100, 120, 135, 150, 165, and 200 m). The overfilling of the bottle as well as capping with blue halobutyl stoppers (previously boiled in NaOH, Bellco, United Kingdom) minimized oxygen contamination (De Brabandere et al., 2012). Samples for chlorophyll a determination were collected in carboys from four depths corresponding to 100, 50, 15, and 1% of the surface incident irradiance as measured by the PAR sensor on the CTD. Carboys were kept cool and dark until further subsampling back in the lab. 500 mL subsamples from each carboy were filtered for phytoplankton biomass (chl a). Filters were kept frozen at −20°C until analysis.
Nutrient and Process Rate Measurements
Samples for NO2−, NH4+ and HS− determinations were thawed immediately prior to analysis and measured with spectrophotometric assays: the Griess assay, the indophenol blue method, and the Cline assay, respectively (Grasshoff et al., 1999). NOx concentrations (NO3− and NO2−) was measured by chemiluminescence following reduction to NO with vanadium (Braman and Hendrix, 1989), and we subtracted NO2− from the total NOx concentrations to obtain NO3− concentrations (Antek instruments 745 and 1050, Houston, TX, United States). Chlorophyll a samples collected on filters (0.7 μm nominal porosity) were extracted for 24 h with 90% acetone at −20°C, and the extracted chlorophyll a measured in a Turner Designs 10AU fluorometer, using an acidification method and corrected for phaeopigment interference Parsons et al. (1984). DIN deficit (DINdef) was calculated according to Bourbonnais et al. (2013) and corrected for the release and dissolution of iron and manganese oxyhydroxide-bound PO43− under anoxic conditions.
Dark carbon fixation rates were measured by overfilling 60 mL serum bottles 3 times to minimize O2 contamination and amending 14C-HCO3 to the incubation bottles following the JGOFS protocol (Knap et al., 1996).
The protocol used for measuring rates of denitrification and anammox was modified from Thamdrup and Dalsgaard (2002), using 15N-labeled incubations. In an attempt to minimize bottle effects arising from the use of small sample volumes, we incubated the water in 250 mL serum bottles closed with blue butyl rubber stoppers. At the start of the incubation, we inserted a 20 mL helium headspace into the bottle and then added the 15N labeled N-species (10 μM 15NO3− or 10 μM 15NH4+, see Table 1 for details) and electron donors to the bottles (Table 1). Helium gas entering the serum bottle was passed through an oxygen scrubber (Cu-CuO, Glasgerätebau Ochs - Germany) to limit O2 from being introduced to the incubation vessels. Oxygen in the incubation vessels remained below our detection limit (<0.2 μmol L−1), which was measured with flow-through cell oxygen optode (Pyroscience). For incubations of oxygen contaminated water, adding a 20 mL headspace decreases the amount of oxygen in the seawater by about 30 times due to preferential partitioning of O2 into the headspace gas. In contrast, given the distribution of sulfide between aqueous and gaseous species in seawater, less than 2% of the total sulfide in our incubation vessels resides in the headspace. Samples were collected approximately every 6, 12, 24, and 48 h during the incubations to both allow maximum sensitivity and capture intervals with constant rates. In between time points, incubations were kept in the dark at 15°C. To determine the time-course of 15N labeled-N2 production, gas samples were taken with a 1 mL gas-tight syringe (Hamilton) previously flushed with He and then with the headspace gas. Gas samples were stored in 3 mL exetainers previously filled with milliQ water. Liquid samples were taken to follow the production or consumption of NO2−, NO3−, or NH4+. Liquid samples were collected with a plastic 5 mL syringe previously flushed with He, filtered and then stored at −20°C for later analysis. The 15N content of N2 was determined in gas samples collected during the incubations on an isotope-ratio mass spectrometer (Delta V with continuous flow inlet, Thermo Scientific). Concentrations of N2 were calibrated with standards by injecting different amounts of gas from N2 flushed exetainer vials at 1 atmosphere. The excess 14N15N and 15N15N in the gas samples was calculated as described by Thamdrup and Dalsgaard (2000). Then, rates were calculated through least squares fitting of the slope of 15N accumulation versus time for the linear region of 5N excess ingrowth (i.e., constant rates), correcting for the 15N labeling percentages of the initial substrate pool and accounting for the initial pool of substrate present. Rates were determined to be significant if the slope of the linear regression was considered different from 0 (p < 0.05). Denitrification rates were determined from the accumulation of 30N2 in the bottle headspace from the 15NO3− additions, and anammox rates were calculated from the accumulation of 29N2 from the 15NH4++14NO3− additions according to Thamdrup et al. (2006) with modifications and compared to the accumulation of 29N2 from the 15NO3− additions. The detection limit on these rates were calculated as the median of the standard error on the slope used to calculate all significant rates (De Brabandere et al., 2014; Bonaglia et al., 2016) and was determined to be 0.04 and 0.4 nM h−1 for anammox and denitrification, respectively. To produce integrated rates of denitrification and anammox for each month, we first scaled potential rates (Rpot) to in situ rates or “corrected rates” (Rcor) by using Michaelis–Menten half saturation constants Km and in situ substrate concentrations for each process, respectively (see Eq. 7).
For denitrification, we used Km determined through the addition of different 15NO3− concentrations in the incubations (see Table 1 and Figure 4A). For anammox, we used a Km from the literature (Awata et al., 2013). Then, we integrated the corrected rates over the sampling depth intervals to attain area specific process rates.
Microbial Community Profiling
Six different depths (10, 100, 120, 135, 150, and 200 m) were sampled for microbial community profiling and water from these depths was returned to the lab for same-day filtering. 10 L of water was filtered onto 0.22 μm Sterivex (Millipore) filters with a 2.7 μm glass fiber pre-filter. Filtered biomass was soaked in lysis buffer then frozen immediately in liquid nitrogen. Filters were stored at −80°C until further analysis. DNA was extracted according to Wright et al. (2009). Extracted DNA was quantified using the picogreen assay (Invitrogen) and checked for amplification of the small subunit ribosomal RNA (SSU or 16S rRNA) gene using universal primers targeting the V4–V5 region (515F-Y/926R) (Walters et al., 2016). DNA was sent to the Joint Genome Institute (Walnut Creek, CA, United States) for 16S rRNA amplicon sequencing on the Illumina MiSeq platform1.
Once sequenced, amplicons were quality filtered using the JGI “itaggerReadQC” pipeline2,3. Quality filtered reads were run through USEARCH (Edgar et al., 2011) and QIIME (Caporaso et al., 2010). First, we identified chimeras using UCHIME (Edgar et al., 2011). We then picked OTUs de novo with the sumaclust method at 97% OTU threshold (Kopylova et al., 2016). We filtered singletons from the OTU table and assigned taxonomy to a representative set of sequences with rdp classifier using the QIIME release Silva database V128 (Quast et al., 2013). Chao1 diversity indices were calculated with R. Clustering of the samples was performed in R based on a dissimilarity matrix using the Euclidean method4.
We also quantified total bacterial and archaeal 16S rRNA genes present in our samples via qPCR by targeting the V1–V3 region of the 16S rRNA genes with the primers 27F(bacterial)/20F(archaeal) (5′-AGAGTTTGATCCTGGCTCAG, 5′-TTCCGGTTGATCCYGCCRG) and DW519R (5′-GNTTTACCGCGGCKGCTG) (Zaikova et al., 2010). Standards used for total bacteria and total archaea quantification were obtained from SSU rRNA gene clone libraries as described in Zaikova et al. (2010). qPCR program was as followed: (1) 95° for 3 min, (2) 95° for 20 s, (3) 55° for 30 s, (4) plate read, repeat (2) to (4) 44 times, measuring the melting curve by incremental increases by 0.5° from 55 to 95° every second. qPCR reactions were performed in low-profile PCR 96 well-plates (Bio-Rad) in a 20 μL reaction volume on a CFX Connect Real-Time thermocycler (Bio-Rad). Results can be found in the Supplementary Material.
Flux Balance Modeling
Flux balance modeling was conducted to describe rates of anammox, NO3− reduction to NO2− and complete denitrification (NO2− to N2) based on cell abundance, input fluxes of substrates, and kinetic descriptions of these processes. The script for the simulation was written in Matlab (version R2015b) and can be found in the Supplementary Material. More details can be found in the discussion section that follows as well as in the Supplementary Material.
Results
General Water Column Physical, Chemical, and Biological Properties
A salinity profile (Figure 2A), shows relatively uniform bottom waters with monthly variability in the surface waters. Figure 2B shows the relatively homogeneous temperature in the SI water column with a warming in the surface waters during the summer (June–September 2015) and the extension of this warming to deeper water depths in the following months. The chlorophyll a data (Figure 2C) shows peaks of fluorescence in the surface waters in March, May, and September 2015 with the highest concentrations, at 44 μg L−1 chlorophyll a in March just below the surface. O2 concentration profiles (Figure 2D) were also determined with the CTD probe, revealing O2 depletion to less than the sensor limit of detection (<1 μM) in the deep-waters for all of 2015. The upper boundary of the oxycline (depths where there is a sharp gradient in oxygen concentration) is generally around 80m and oxygen penetrates to at least 120 m, though penetration can be as deep as 150 m, as seen in July and September. Low O2 concentrations and anoxia thus characterize the deeper waters of SI (>120 m depth) throughout 2015. NO3− concentrations (Figure 2E) are high in surface waters (up to 32 μM) and generally decline with increasing depth within the oxycline and often remain detectable in deeper low-oxygen waters. A peak in NO2− concentrations (Figure 2F) can be detected sporadically in both the surface waters and/or around 120–135 m where it can reach concentrations as high as 2.5 μM. Surface waters are largely devoid of any NH4+ (Figure 2G), which tends to accumulate below 140 m in anoxic waters and reaches the highest measured concentrations (up to 32 μM) by 200 m. Sulfide (HS−) was only present in bottom waters, reaching concentrations up to 41 μM in February 2015, and was generally detected at 135 m and below (Figure 2H). In Figure 2I, we show DIN deficit (Bourbonnais et al., 2013) calculated for the year 2015 with values varying from 0 in the surface waters to 60 in the bottom waters for February 2015. Overall, values reflected a DIN deficit in the anoxic waters and increased with depth (Figure 2I).
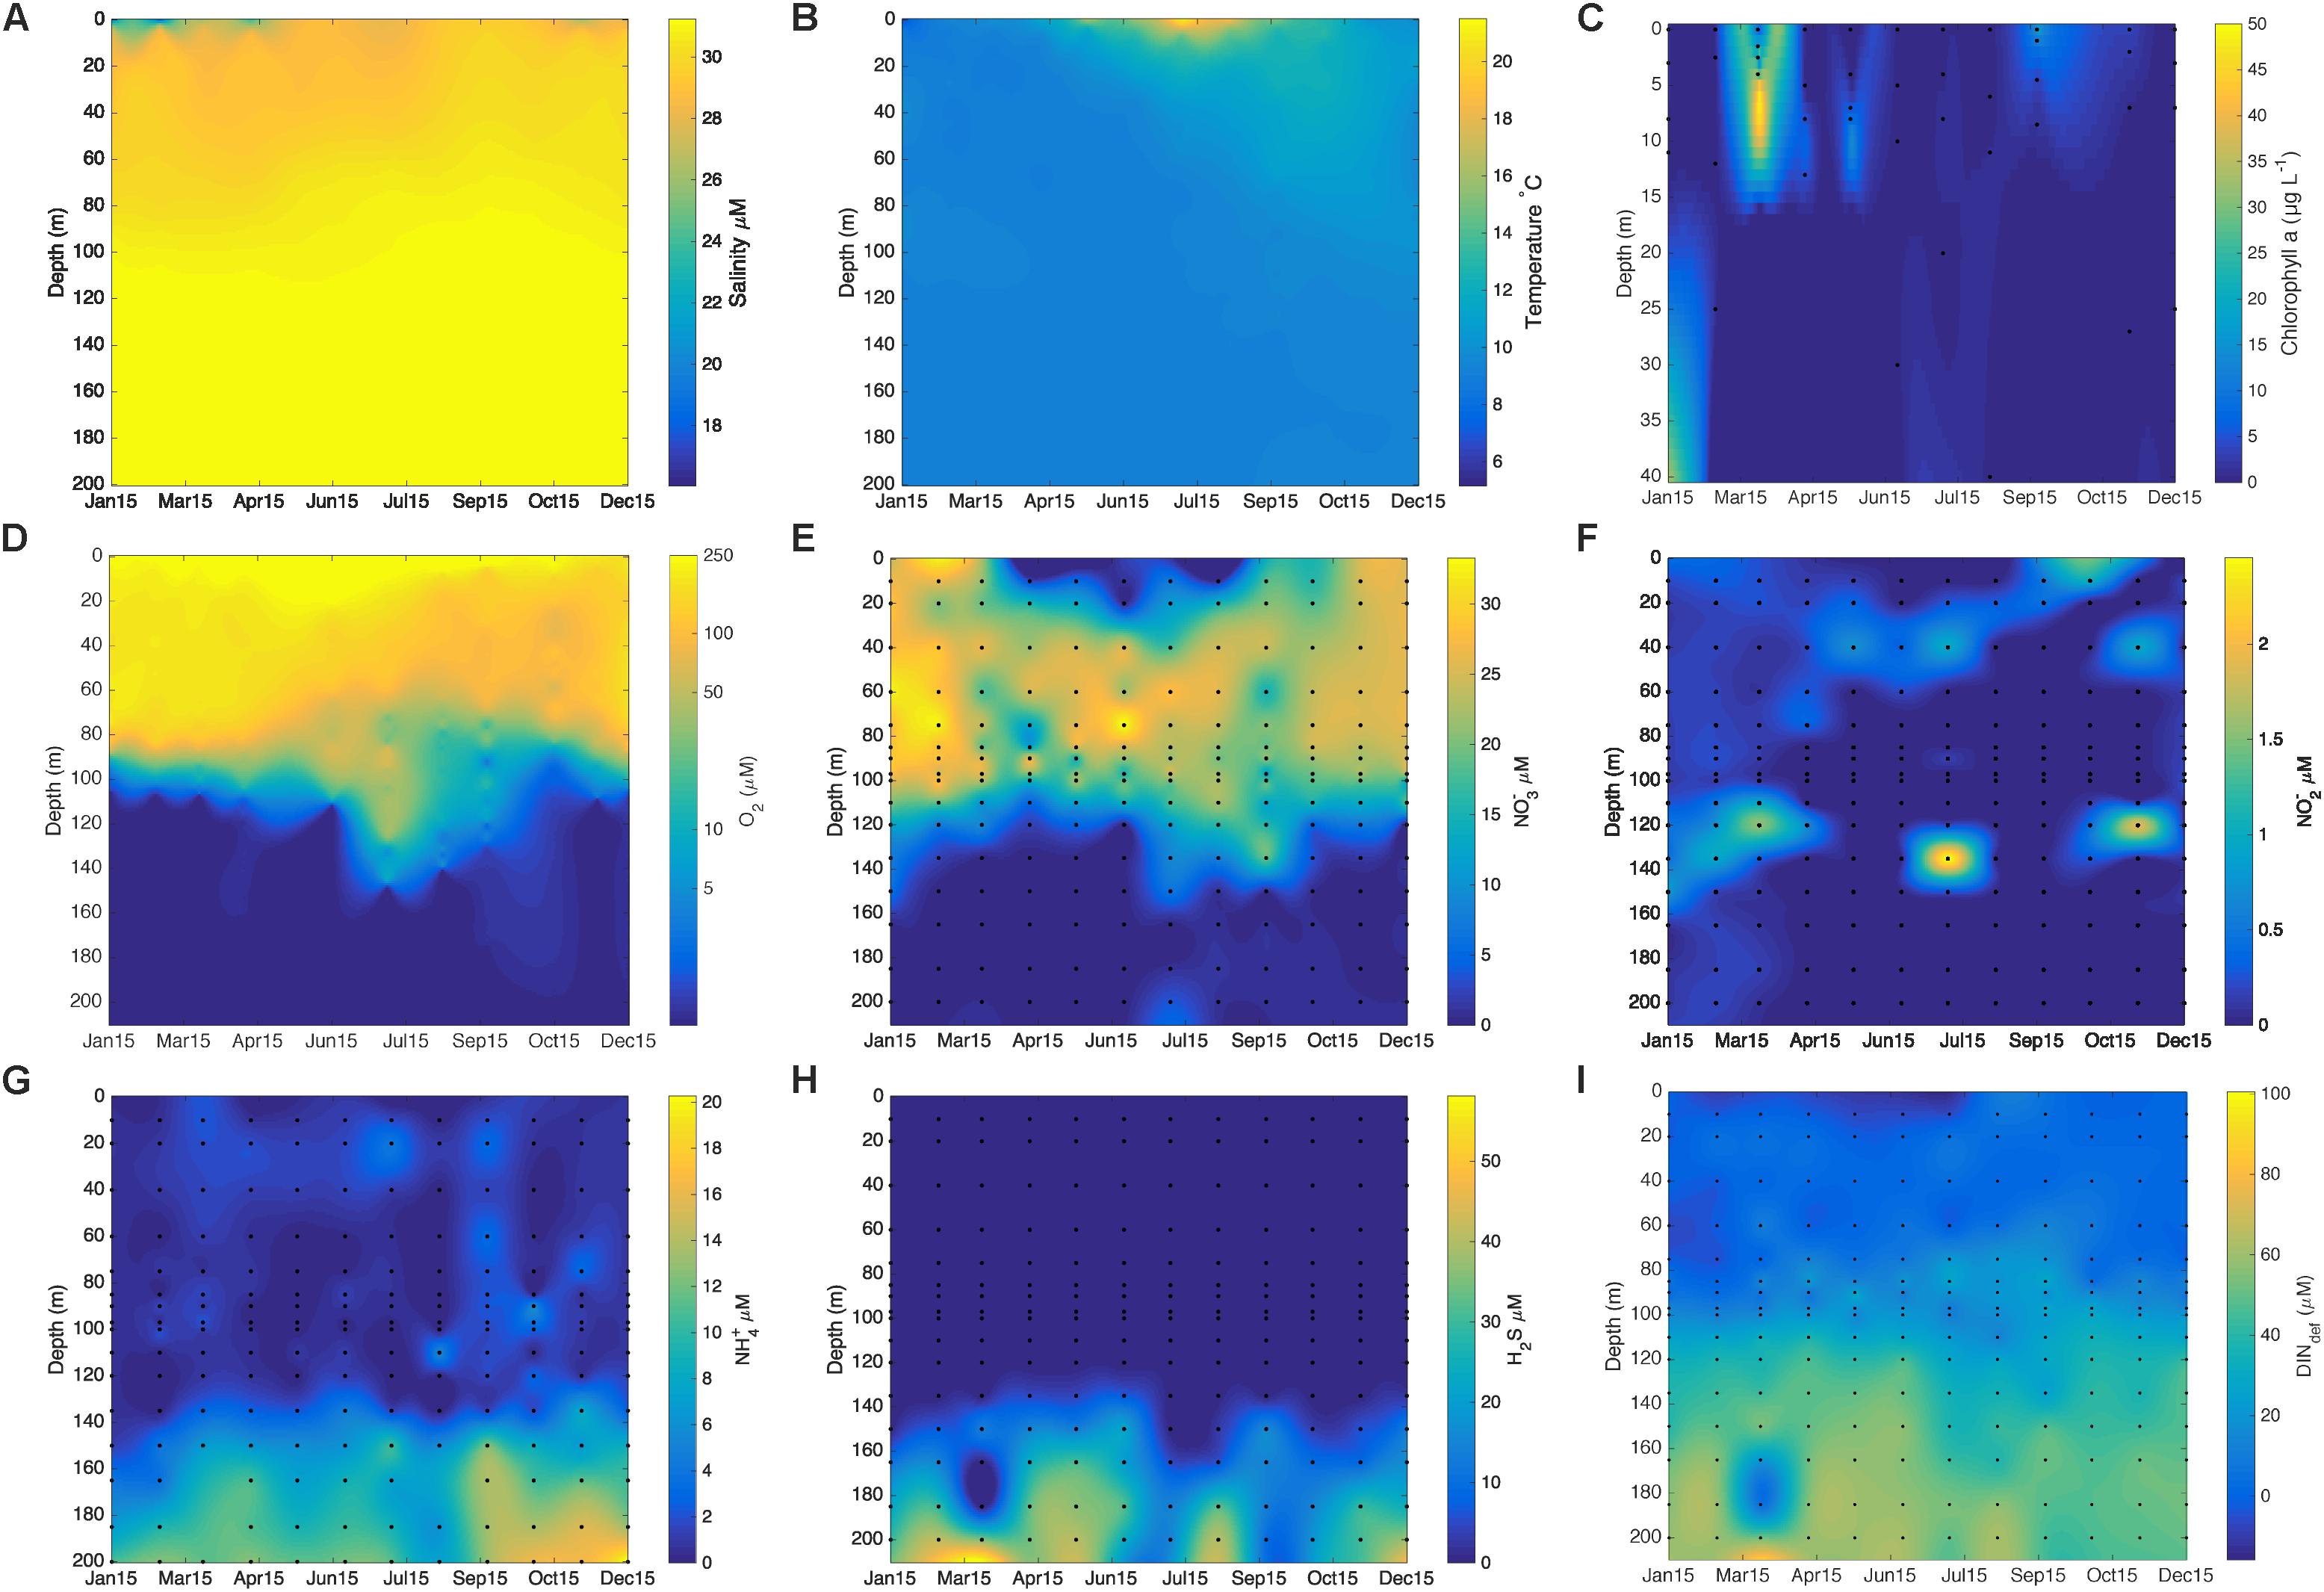
Figure 2. (A) Salinity (g kg−1); (B) temperature (°C); (C) chlorophyll a (μg L−1); (D) oxygen profiles (μM); (E) NO3− concentrations (μM); (F) NO2− concentrations (μM); (G) NH4+ concentrations (μM); (H) HS− concentrations (μM); (I) calculated DIN deficit values (see section “Materials and Methods” in main text) for Saanich Inlet during the year 2015 at station S3. (A,B,D) Values have been obtained from the CTD profiles monthly. Intermediate values have been interpolated in matlab using the gridfit function (specifically the nearest neighbor). (C–G) Values were obtained from discrete sampled depths as indicated by black dots on graphs and interpolated in matlab using the gridfit function (specifically the nearest neighbor). Note that figure (C) only goes down to 40 m depth as the values obtained for the chlorophyll a profile were sampled mostly above 40 m.
Rates of Denitrification, Anammox and Dark Carbon Fixation
Both anammox and denitrification were active throughout the year in the low oxygen waters where we conducted 15N-labeled incubations. Rates of denitrification, corrected for in situ substrate concentrations, varied between 0.28 ± 0.03 and 140 ± 14 nM hr−1 (Figure 3B) based on the accumulation of 30N2 in 15NO3− amended incubations (see Table 1). Similarly, rates of anammox varied throughout the year, between 0.07 ± 0.01 and 13.2 ± 0.4 nM hr−1 (Figure 3C) based on the accumulation of 29N2 in 15NH4+ + 14NO3− amended incubations. We also compared rates of anammox obtained through the accumulation of 29N2 with the addition of 15NO3− (Figure 3A) and found that they were of the same order of magnitude as rates obtained from 15NH4+ + 14NO3− incubations (Figure 3C). Overall, rates of denitrification, when detected, were equal to or higher than rates of anammox, although anammox dominated N2 production in 55% of the measurements made. However, the fact that rates of denitrification were generally higher, when detected, led to a higher annual proportion of N2 production through denitrification (see section “Depth-Integrated Rates of N-Loss”). Dark carbon fixation rates were measured for most of the water column and ranged between 0.24 and 400 nmoles C L−1 hr−1 (Figure 3D).
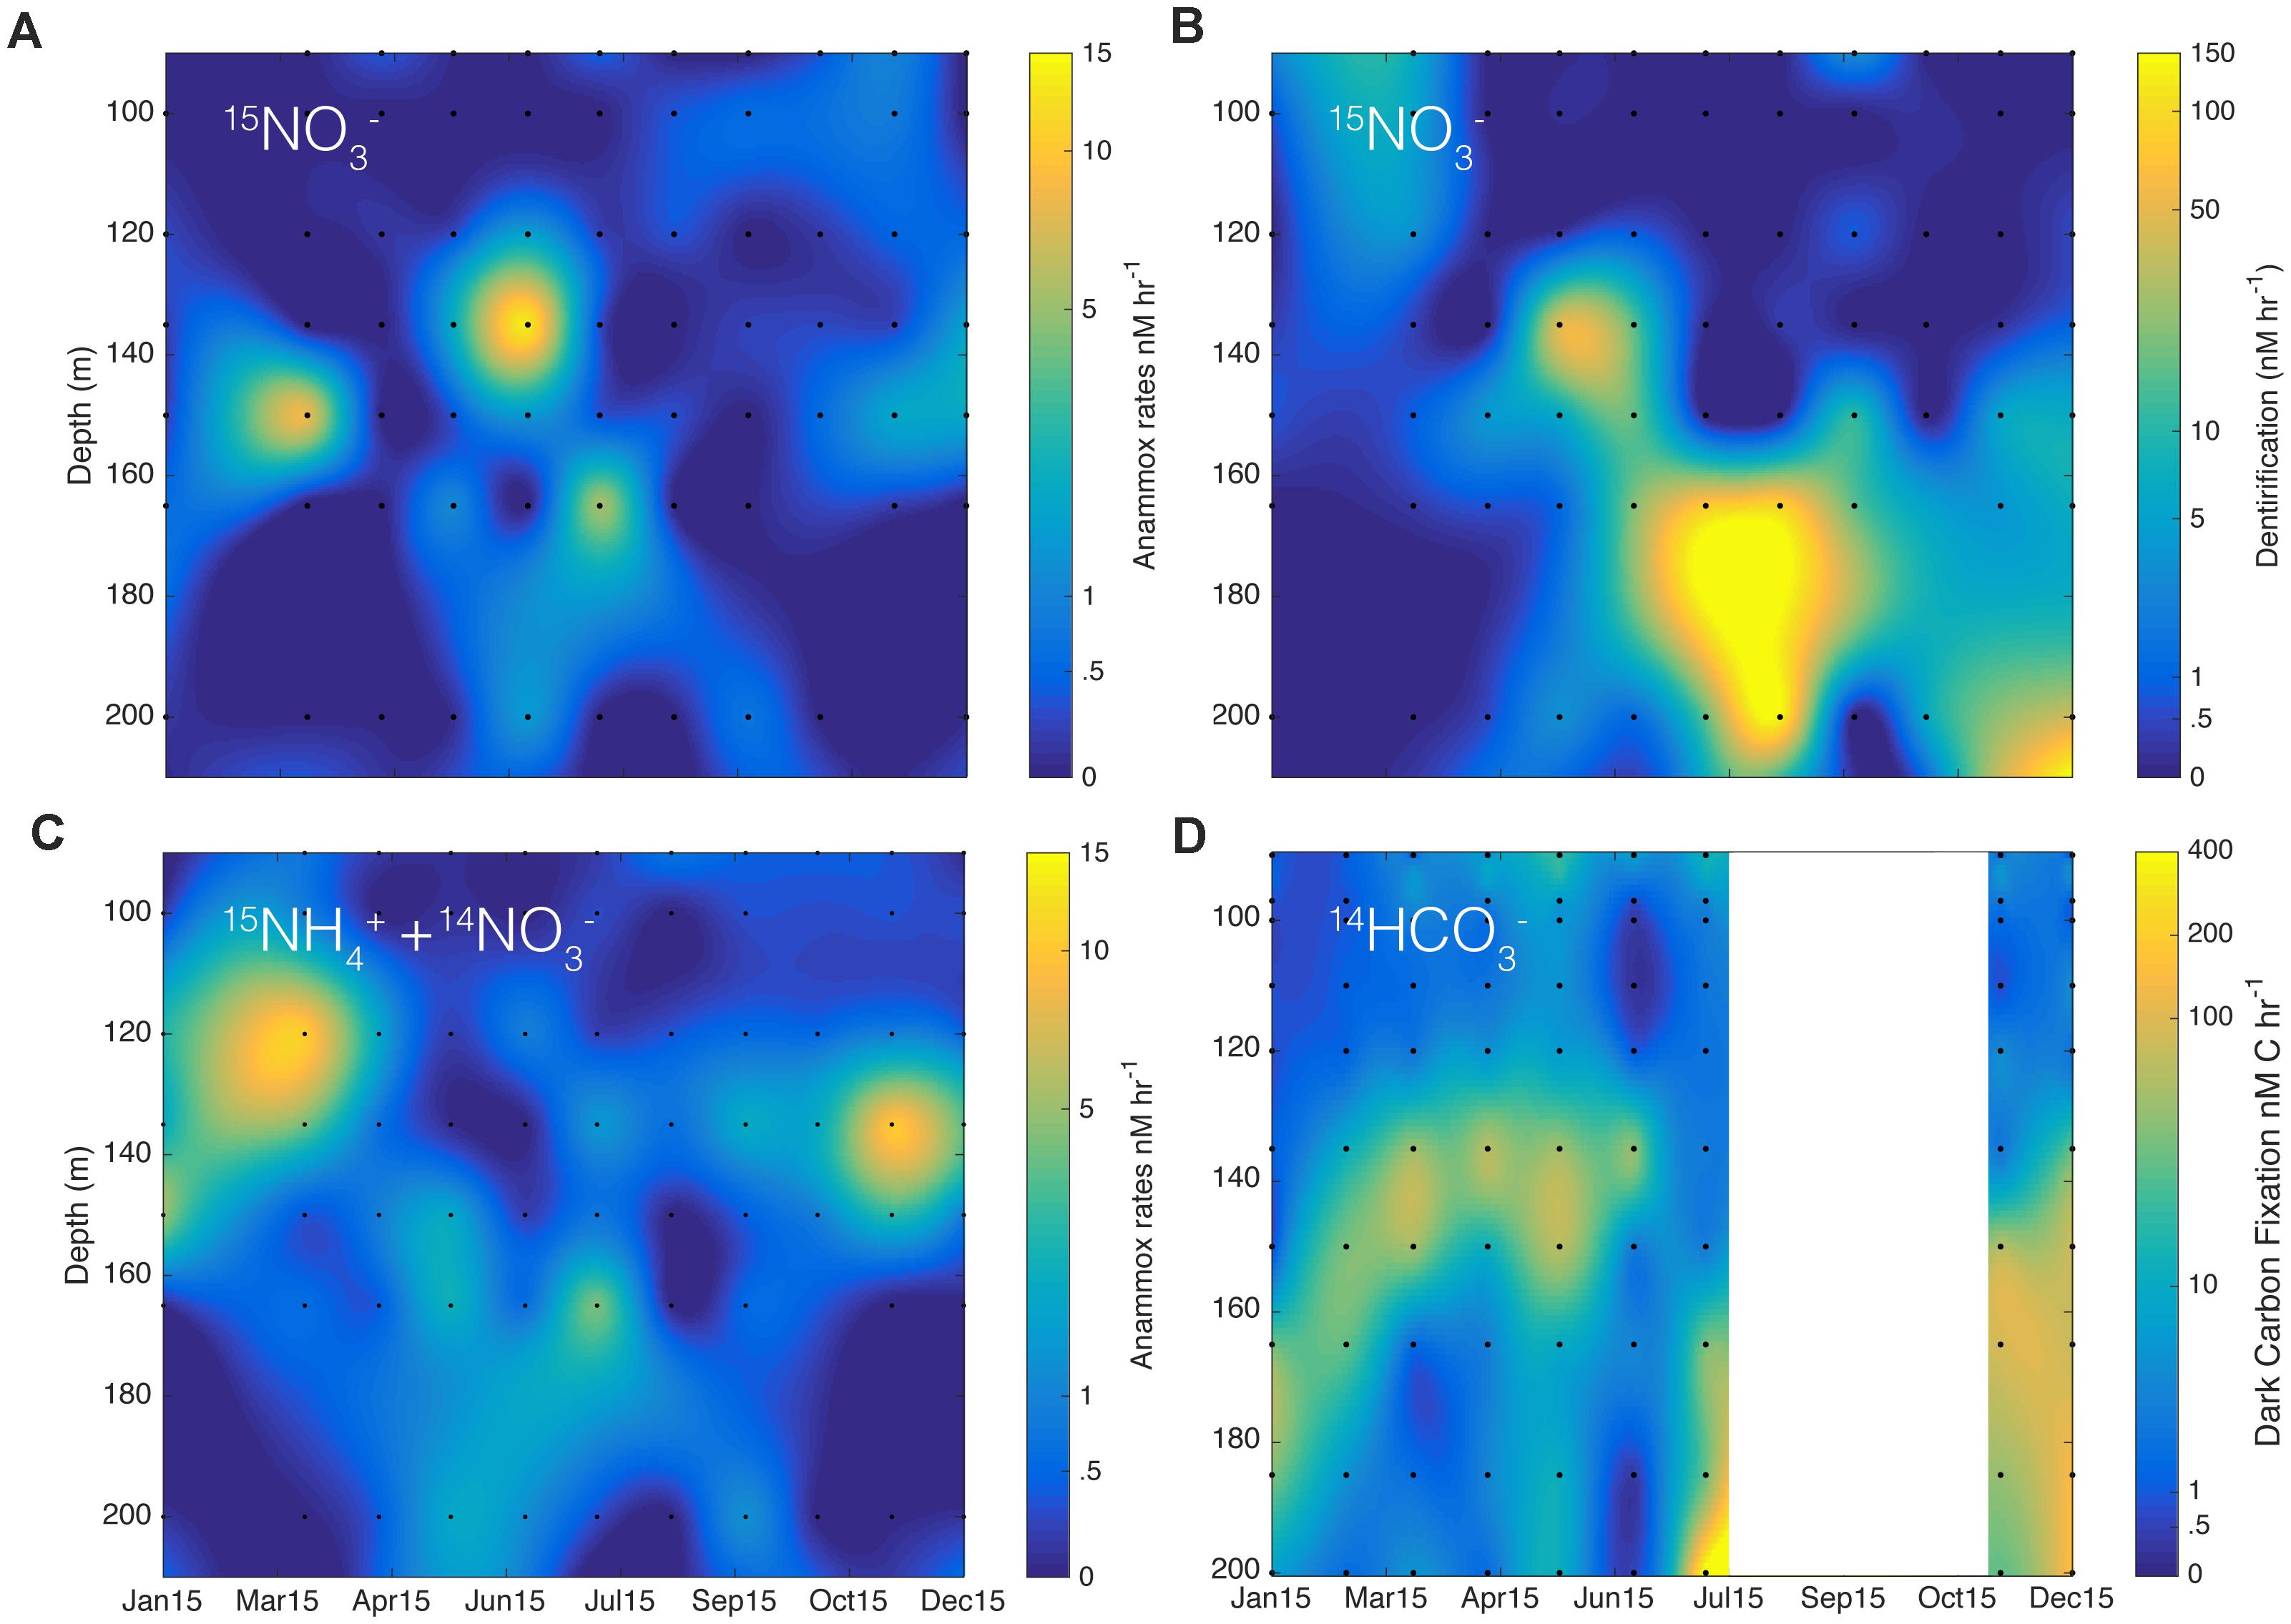
Figure 3. Potential rates of (A) anammox (nM hr−1) and (B) denitrification (nM hr−1) calculated from the incubated samples with 15NO3− for the year 2015 at station S3. (C) Shows potential rates of anammox of samples incubated with 15NH4+ + 14NO3−. In (D), graph shows rates of dark carbon fixation from incubation with H14CO3− in nM hr−1. The scale bar is in log scale.
Response of Denitrification and Anammox to Amendments
Between 1 and 20 μM 15NO3− was amended to seawater collected from 165 m depth in August 2015. This depth contained 1 μM NO3− in situ and was therefore at the lower end of NO3− concentrations found within the anoxic waters of Saanich Inlet. Hence, NO3− concentrations may be expected to limit denitrification, NO3− reduction to NO2−, and anammox at this depth. Rates of denitrification, based on the accumulation of 30N2, increased with increasing NO3− concentrations up to 20 μM (Figure 4A), and the relationship between rates and NO3− concentration could be modeled with a Michaelis–Menten formulation. Our data could be described with a maximum rate of denitrification (Vmax) and a half-saturation constant, Km, for NO3− of 112 nM hr−1 and 5 μM (Figures 4D,F and Table 2), respectively. The rate of denitrification found at 20 μM NO3−, however, is lower than for 15 μM and did not follow predictions from the Michaelis–Menten model in Figure 4F. Anammox was not detected. We also determined changes in the concentrations of NOx and NH4+ when we added different 15NO3− concentrations (Figures 4A,B). We observed that NO2− accumulates with increasing 15NO3− concentrations reaching a maximum of 9 μM when 20 μM 15NO3− was added (Figures 4A,E). NH4+ concentrations, on the other hand, remain relatively constant between 8 and 12 μM (Figure 4B). Rates of NO3− reduction varied, between 0 and 430 nM hr−1, and rates of NO2− accumulation varied between 0 and 286 nM hr−1 (Figure 4E). The latter rates combined with the rates of denitrification are enough to explain the rates of NO3− reduction and thus no accumulation of other intermediates such as N2O is expected.
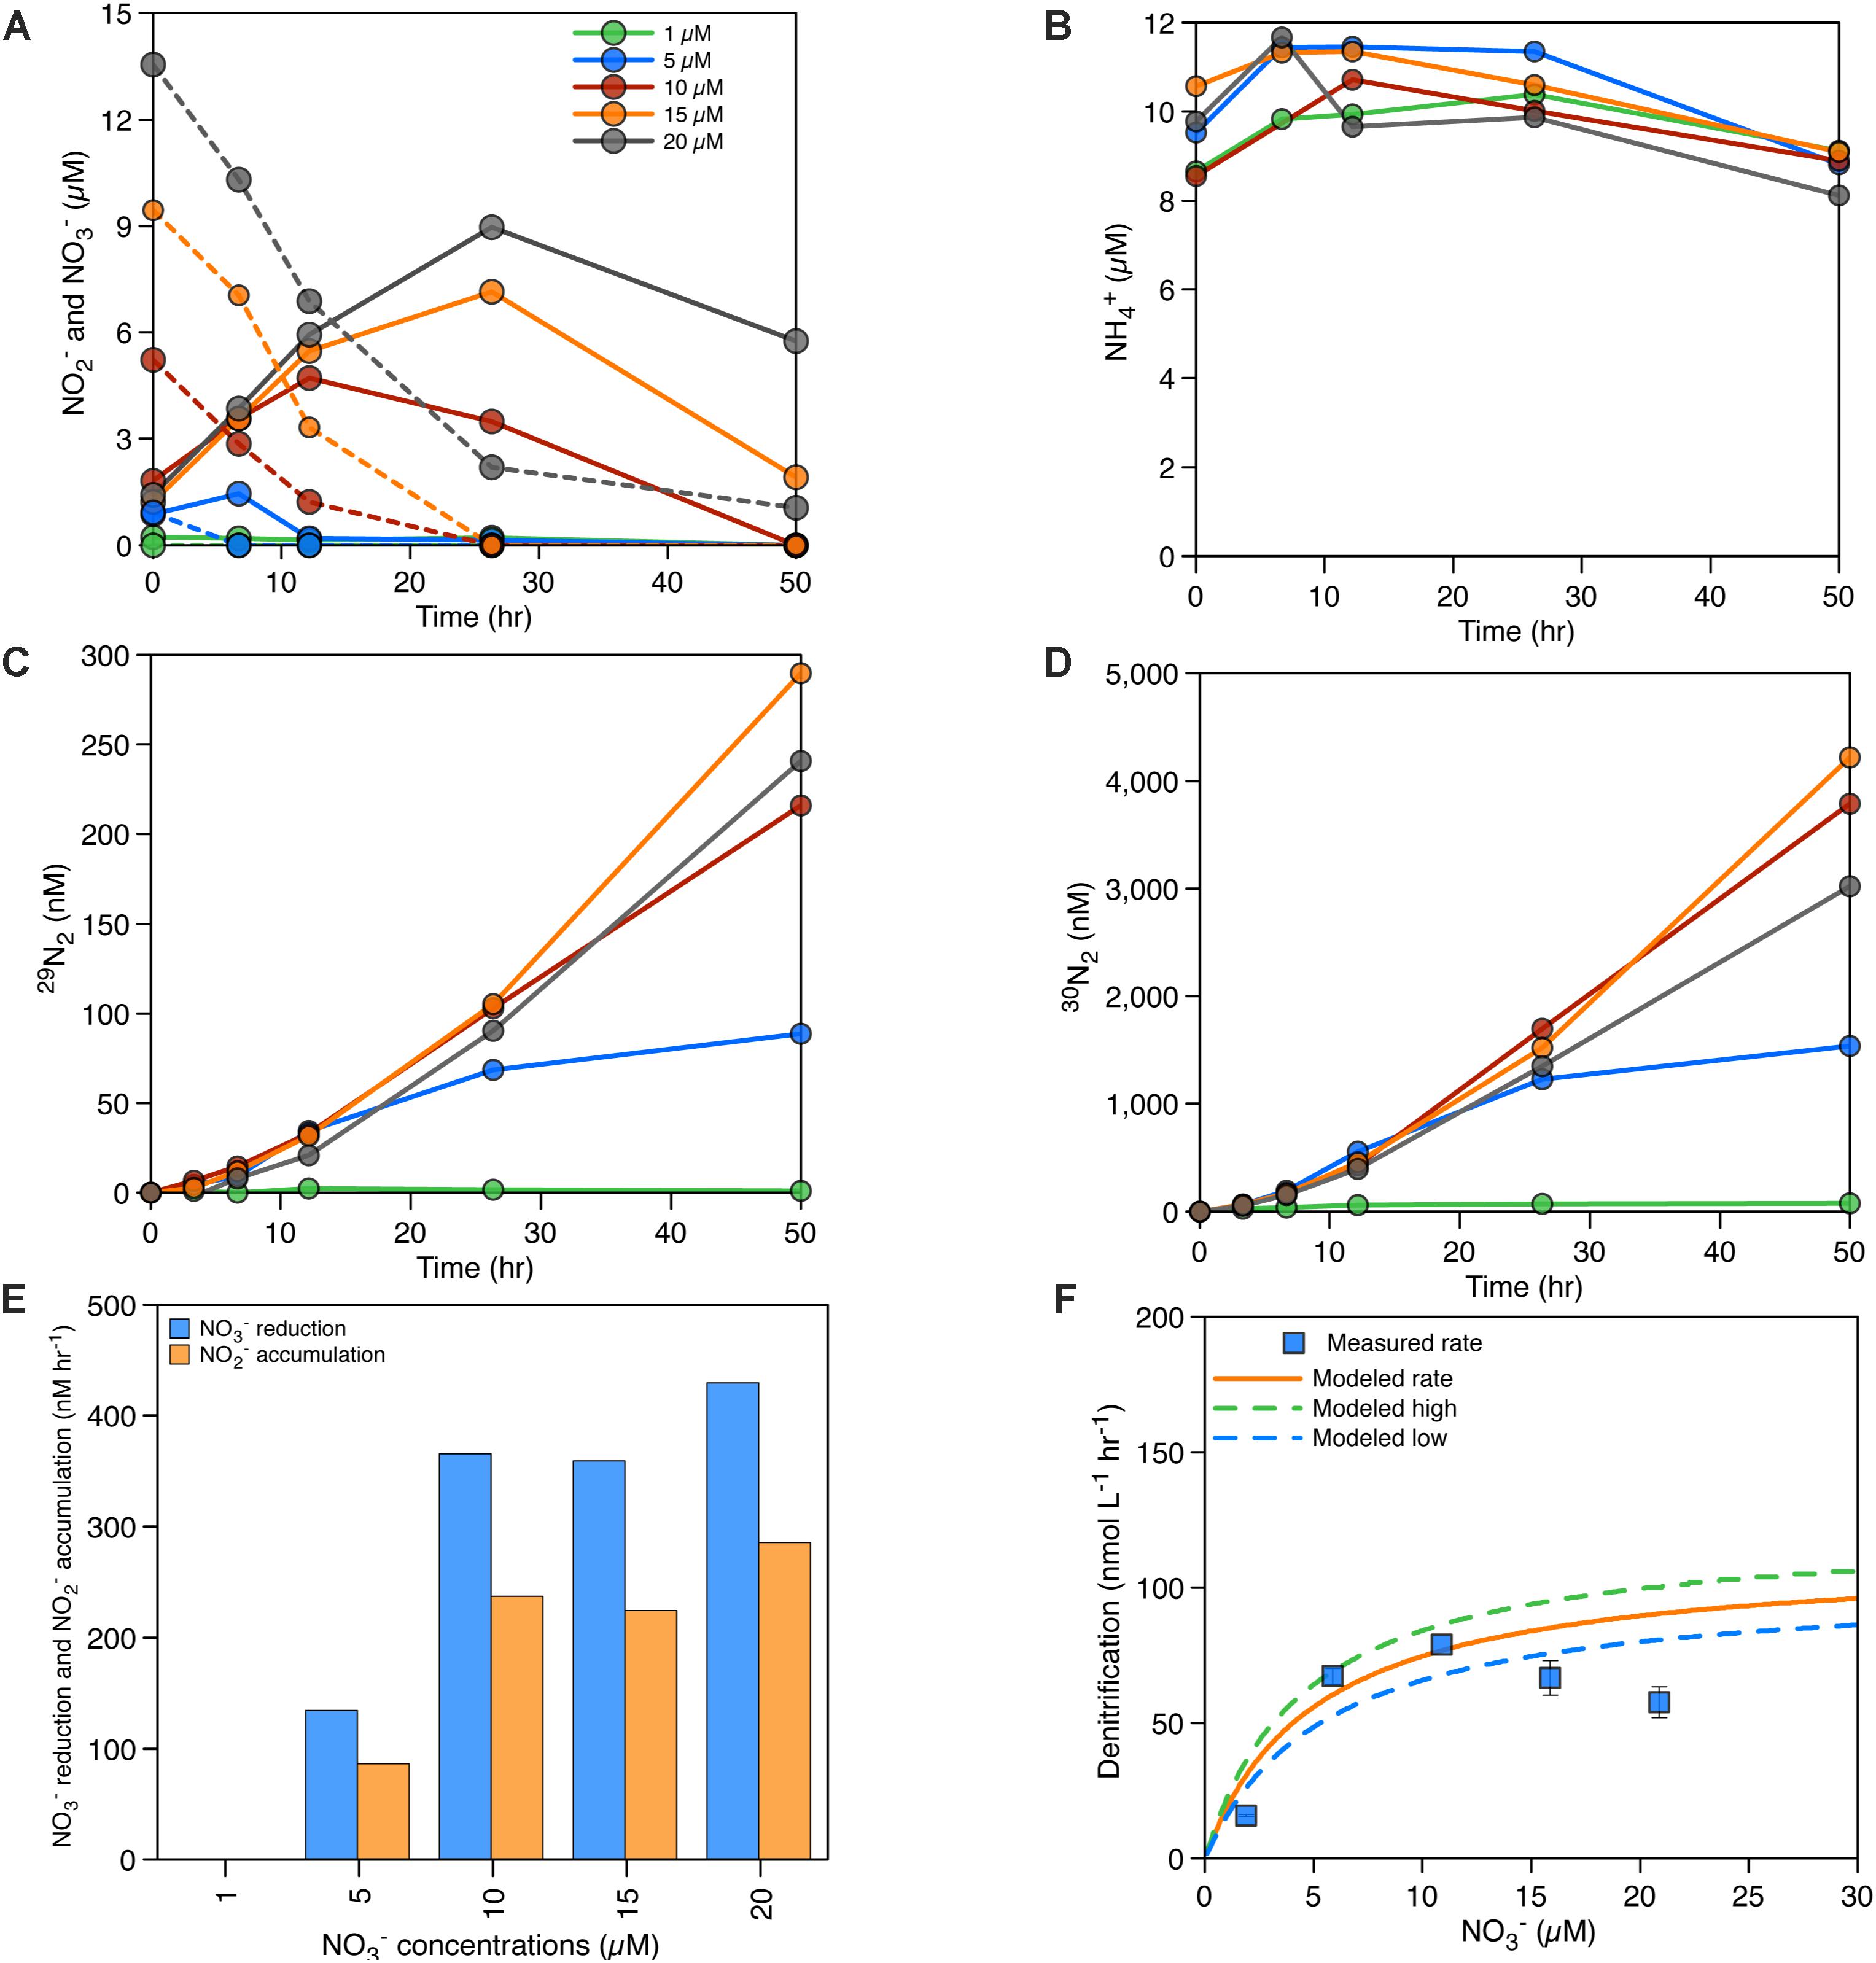
Figure 4. (A) NOx accumulation/consumption over time with the addition of different NO3− concentrations – NO3− concentrations in dashed lines, NO2− concentrations in solid lines. (B) NH4+ accumulation/consumption over time with the addition of different NO3− concentrations. (C) Production of 29N2 in the incubations (nM). (D) Production of 30N2 in the incubations (nM), (E) rates of NO3− reduction and NO2− accumulation (nM hr−1). (F) Michaelis–Menten curve and measured denitrification rates for different NO3− concentrations in August 2015, see Table 2 for details on the Michaelis–Menten parameters used in (F).
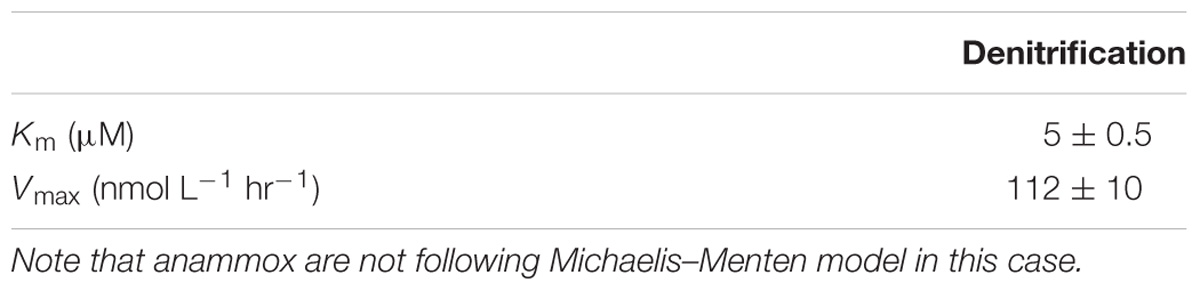
Table 2. Michaelis–Menten parameters, Km (μM) and Vmax (nmol L−1 hr−1) for NO3− dependency of denitrification at 165 m in August 2015.
We also amended seawater collected from 120 m depth in June 2015 with HS− ranging from 1 to 10 μM, in addition to 10 μM 15NO3− to examine the influence of HS− on rates of denitrification and anammox. This depth was chosen because it does not contain any detectable sulfide in situ. Instead, it immediately overlies the sulphidic deep waters and thus likely receives a flux of HS− from below that fails to accumulate to detectable concentrations at 120 m depth and implies sulfide oxidation at this depth. Results show an increase in denitrification rates with increasing HS− concentrations (see Figures 5D,F) above an apparent threshold of 2.5 μM HS−. These experiments reveal a seemingly linear trend, but scarcity in data precludes the delineation of the precise relationship (Figures 5E,F). Anammox occurs (Figures 5C,E) with 1 and 2.5 μM HS− amendments but was not detected with 5 and 10 μM HS− amendments. NOx concentrations were constant over time in these experiments except for the highest HS− concentrations (Figure 5A), and NH4+ concentrations decreased over time (Figure 5B).
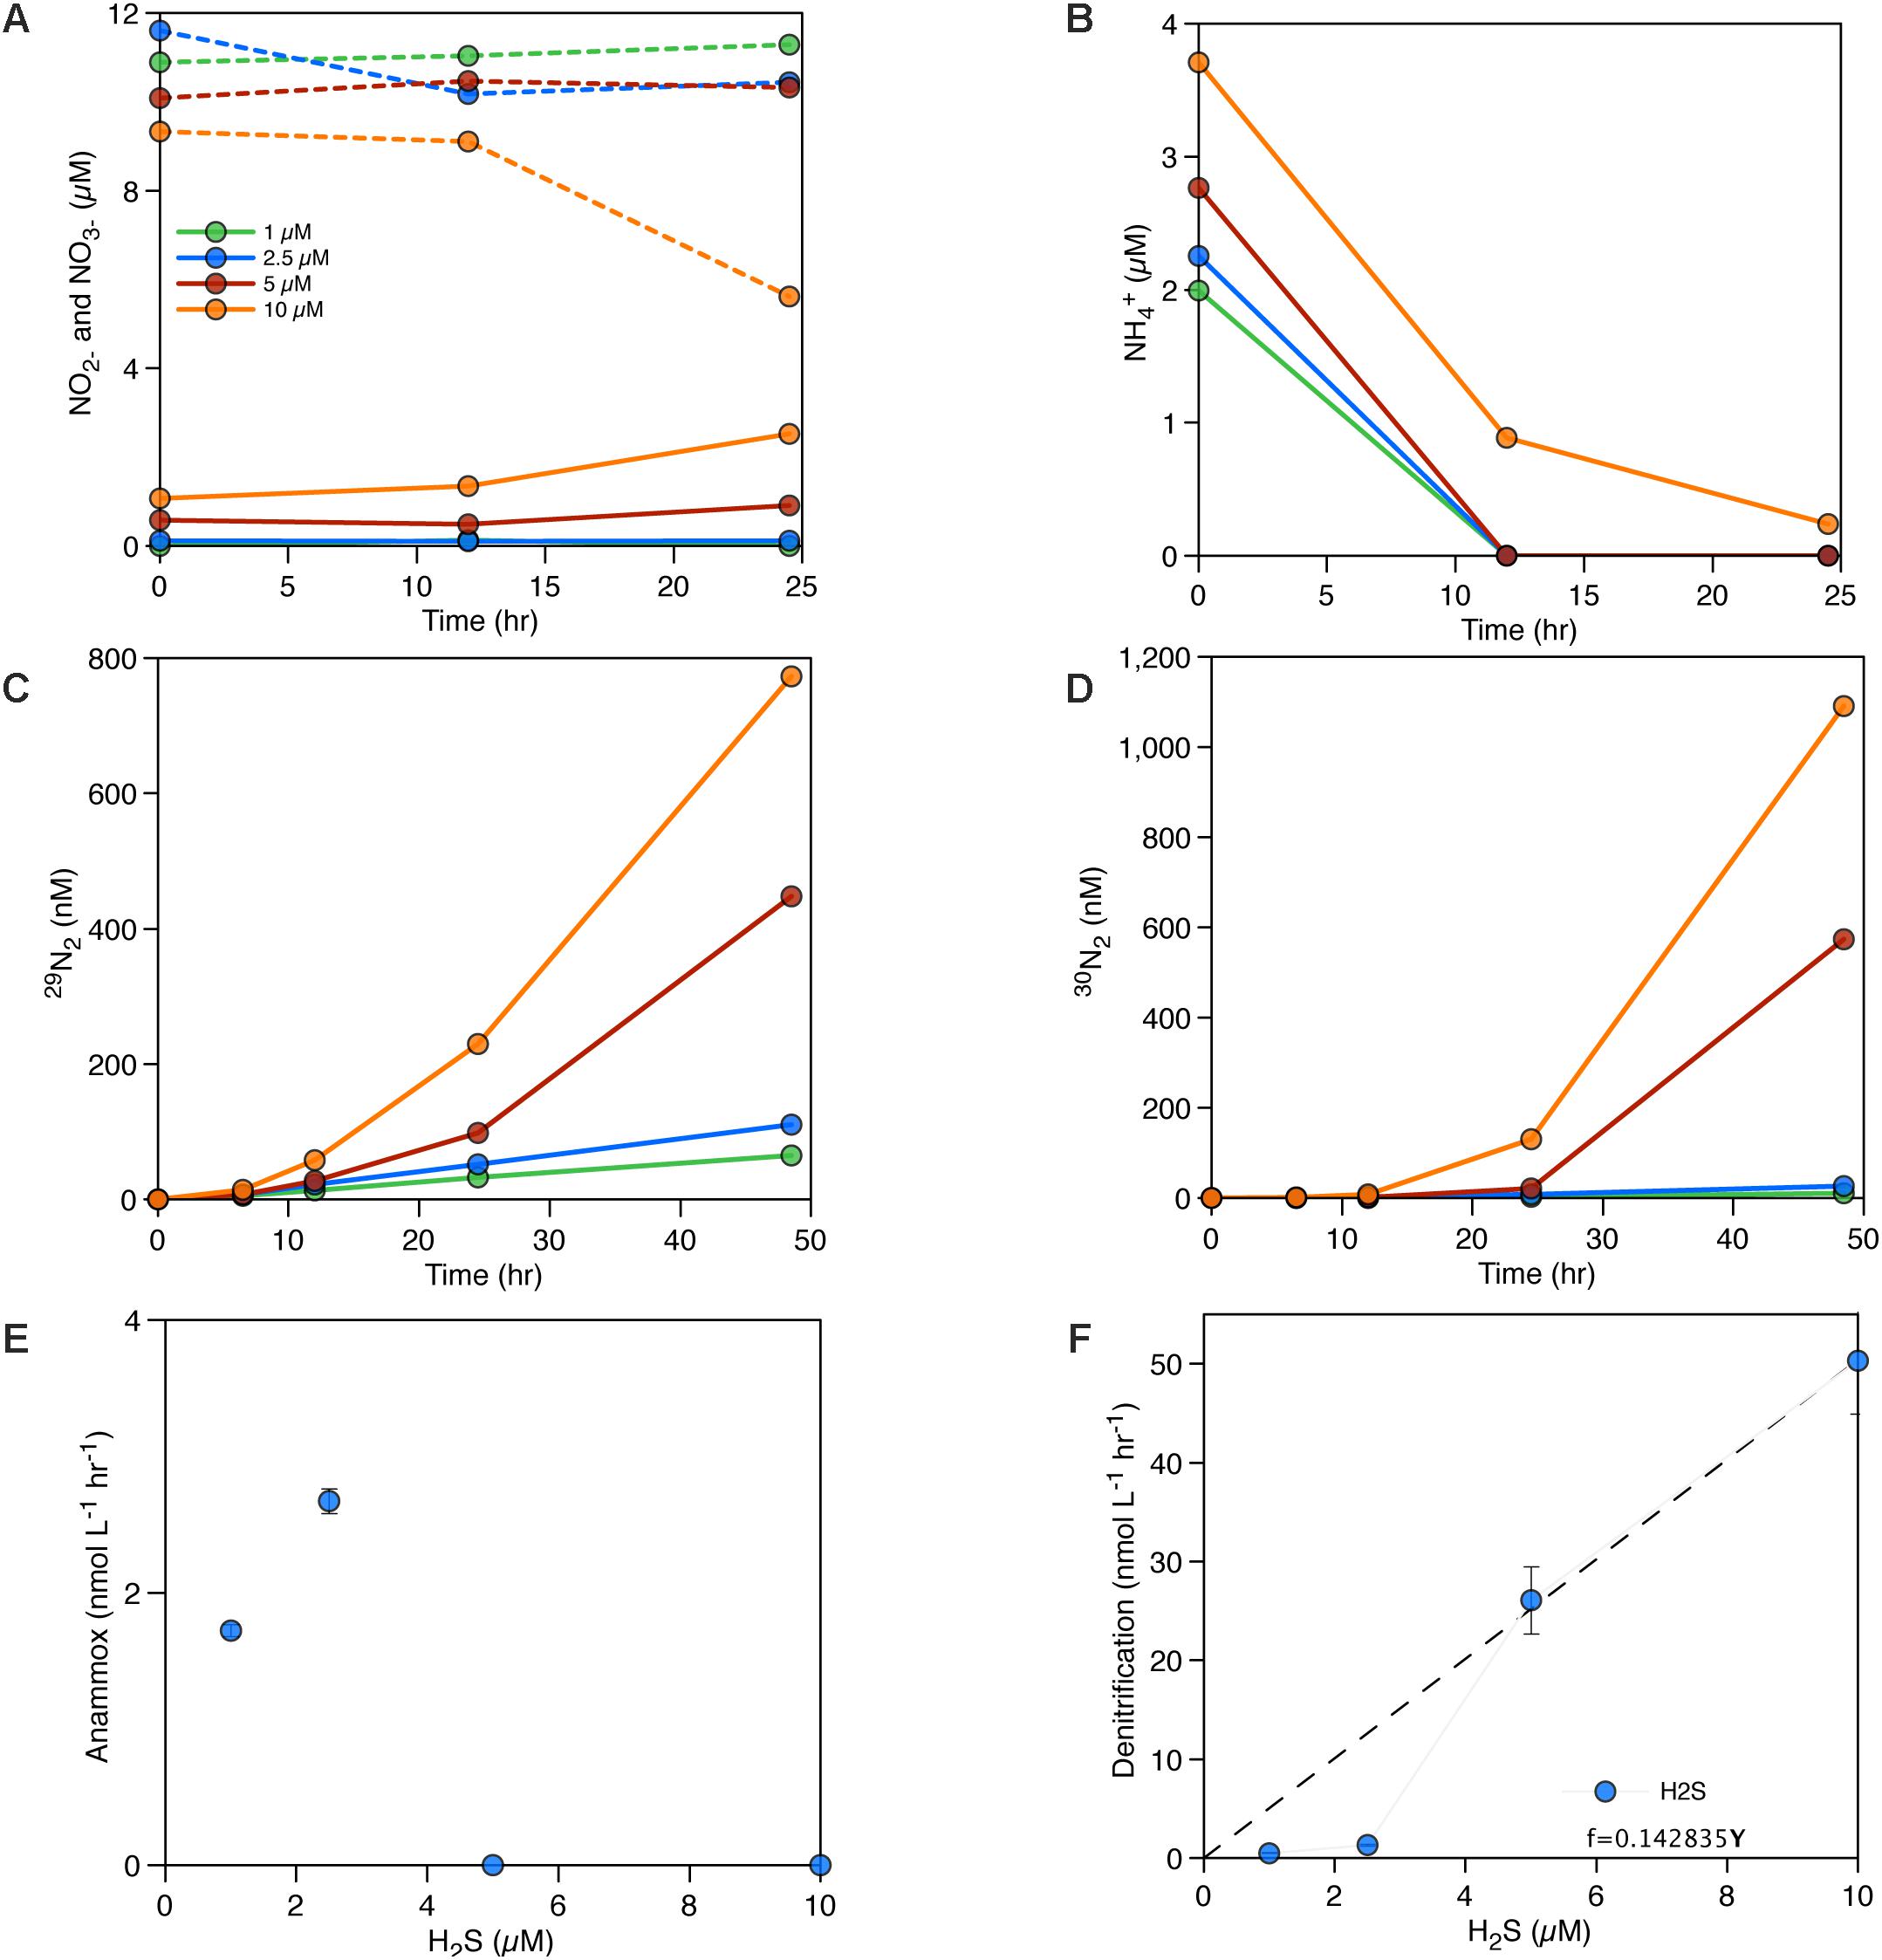
Figure 5. (A) NOx accumulation/consumption over time with the addition of different HS− concentrations – NO3− concentrations in dashed lines, NO2− concentrations in solid lines. (B) NH4+ accumulation/consumption over time with the addition of different HS− concentrations. (C) Production of 29N2 in the incubations (nM). (D) Production of 30N2 in the incubations (nM), (E) measured anammox rates (nM hr−1) for different HS− concentrations in June 2015, (F) measured denitrification rates (nM hr−1) for different HS− concentrations in June 2015.
Depth-Integrated Rates of N-Loss
Depth-integrated rates of N2 production varied over the year, with a greater contribution from denitrification (63%) than anammox (37%) (Figure 6). Rates of denitrification ranged between from 0.02 ± 0.006 to 14 ± 2 mmol m−2 d−1 (Figure 6), with the highest rates following renewal in July and August. Anammox rates, on the other hand, were comparatively constant throughout the year, and varied between 0.15 ± 0.03 and 3.4 ± 0.3 mmol m−2 d−1 (Figure 6). Anammox dominated N2 production in January, April, May, June, October, and November (>50% of N2 production). Nevertheless, results show that denitrification dominates the yearly N2 production in the water column (Figure 6).
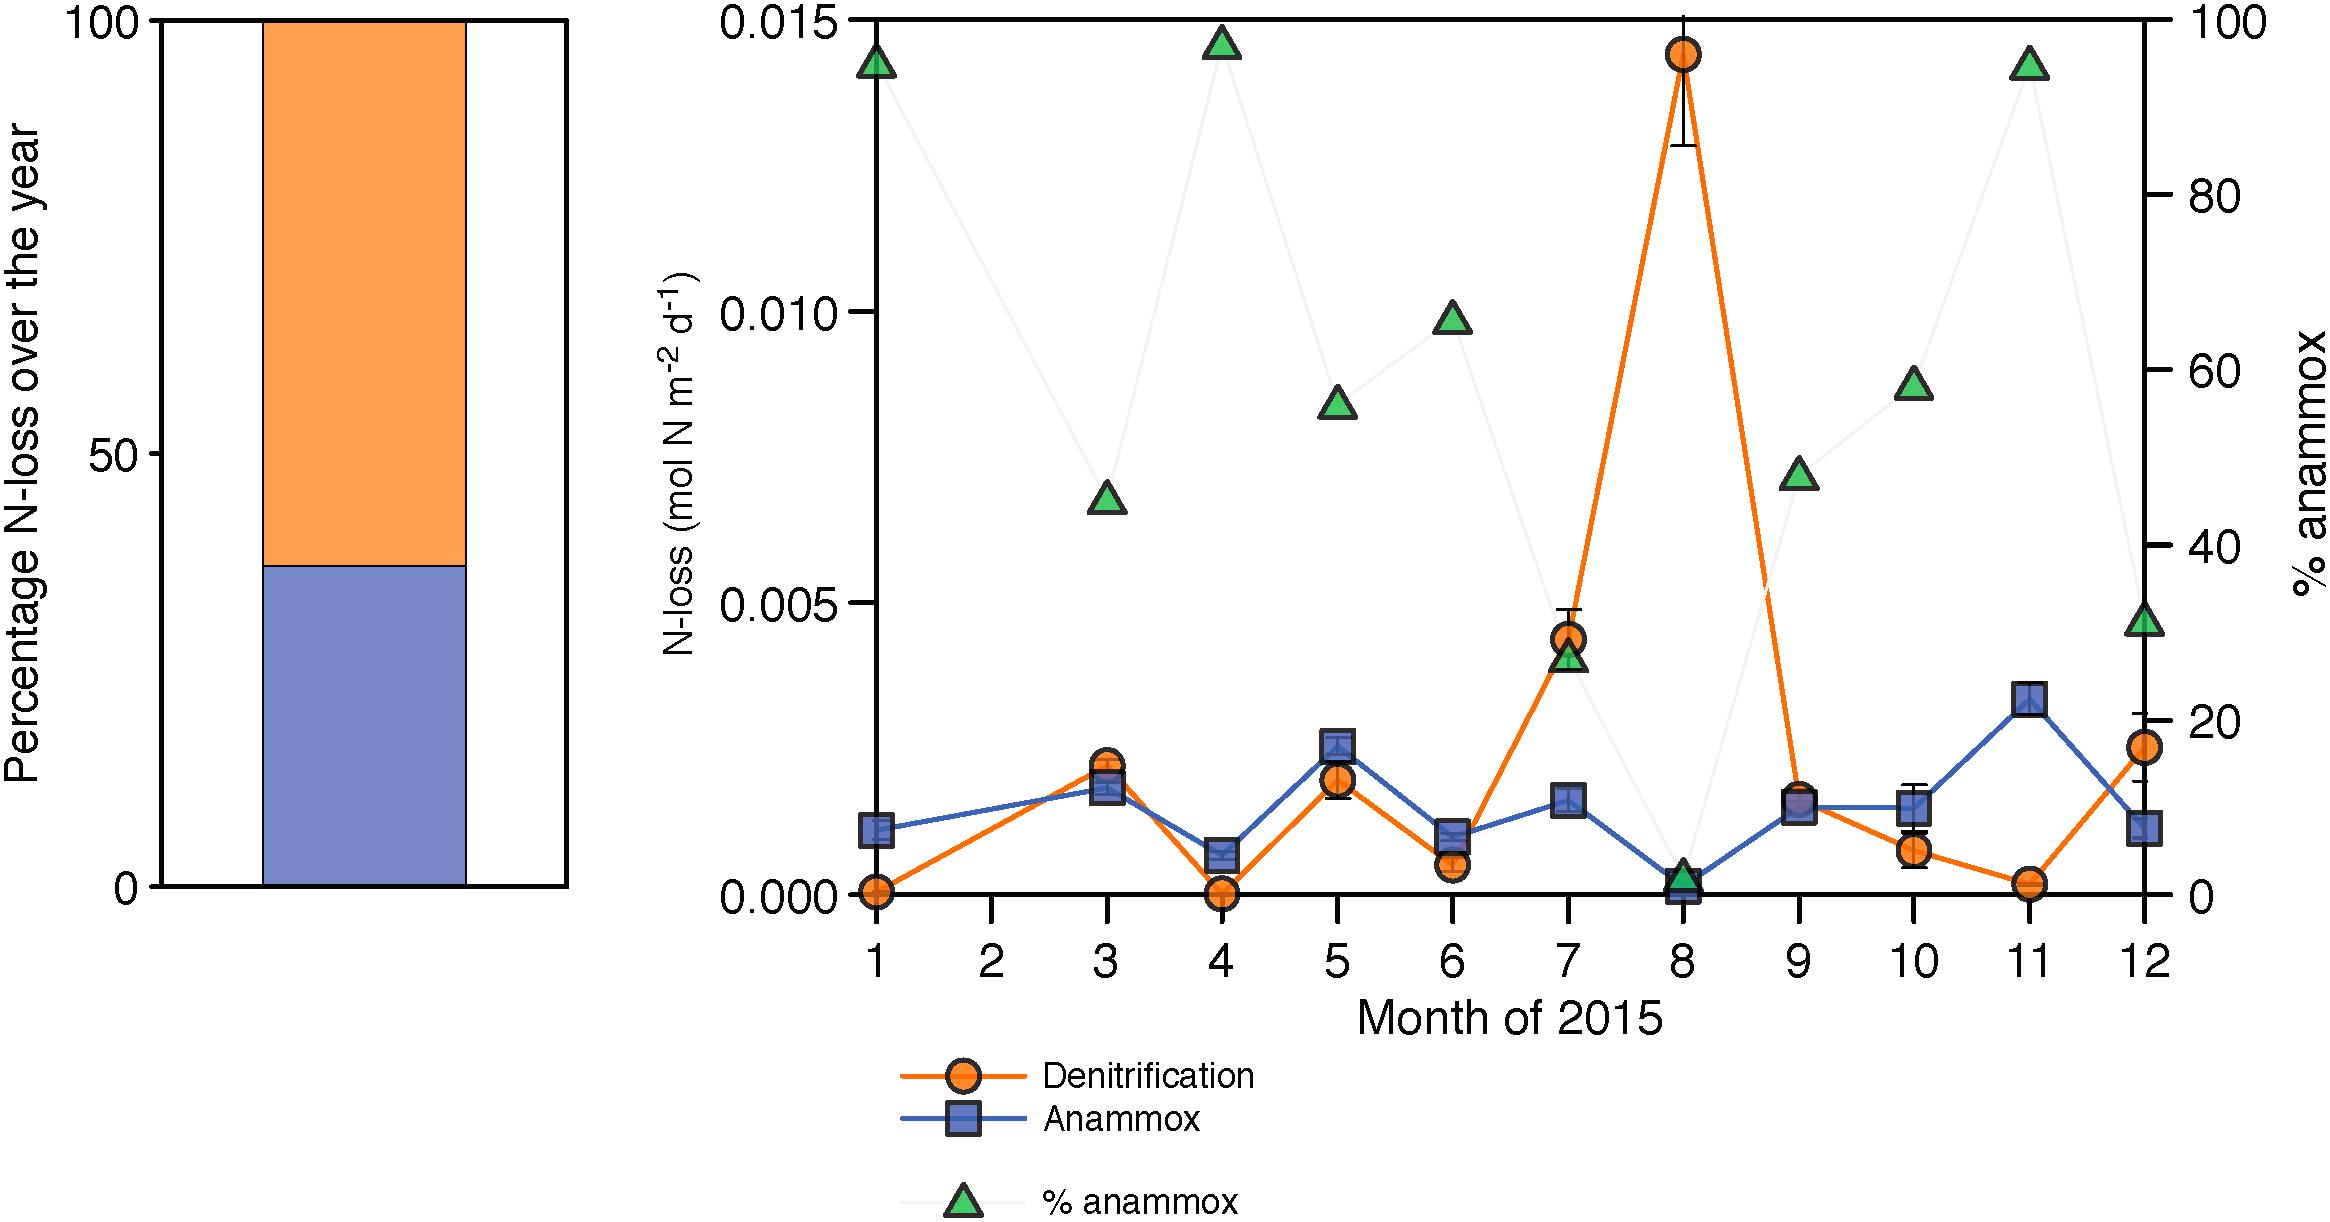
Figure 6. Integrated N-loss rates over the year through denitrification in orange and through anammox in blue. The black dotted line represents the percentage of N-loss occurring through anammox (in %). The stacked bar represents the averaged N-loss over the entire year.
Microbial Community Composition
From a total of 6,889,880 sequences quality filtered by the JGI, 0.3% of the reads were discarded because they were too short or too long and 2% of the sequences were identified as chimeras and discarded. The final read count per sample can be found in Supplementary Table S1 of the Supplementary Material. After clustering at the 97% identify threshold, 28,947 OTUs were resolved across 72 samples. The estimated community diversity (chao1) was low and variable in the surface waters and comparably higher and more stable at deeper depths. These results are summarized in Supplementary Figure S1 and Supplementary Table S1 of the Supplementary Material.
The microbial community in SI is vertically stratified with strong shifts in community compositions apparent between the surface waters (10 m) and the deeper waters (100 m and below) (Figures 7, 8). In particular, there is a shift between high relative abundances of Alphaproteobacteria and Bacteroidetes (together, 42–85.3%) in the surface to a higher relative abundance of Gammaproteobacteria (23.4–68.5%) in the deeper waters (between 100 and 200 m) (Figure 7). In the surface waters, Alphaproteobacteria were mainly comprised of the SAR11 clade and Bacteroidetes of the Flavobacteriales. The cyanobacterial population present early in the year decreased to <1% during the spring bloom (April, May, and June), along with a sharp increase in Flavobacteriales for these 3 months (Figure 7). In deeper waters, the overwhelming majority of Gammaproteobacteria are associated with two OTUs belonging to the SUP05 cluster (Oceanospiralles clade) (Figures 7, 9, and Supplementary Material). This trend was constant throughout the year. Another Gammaproteobacterial group – Ectothiorhodospiraceae (purple sulfur bacteria) – were present throughout the year in deeper waters (100–200 m), with one OTU representing between 1 and 30% (Supplementary Figure S3). Thaumarchaeotal (Marine Group 1) relative abundance was generally low in the surface waters and increased up to 28% at 100 m where NO3− concentrations generally peaked (Figure 7 and Supplementary Figures S2, S3). In the deeper waters (100–200 m), the Marinimicrobia clade totalled a few percent throughout the year and increased to up to 12% in November at 135 m. Epsilonproteobacteria were mostly comprised of an OTU from the genus Arcobacter, which reached up to 30% at 200 m in July 2015 during deep water renewal and remained present at relatively high abundances until September (Figures 7, 9 and Supplementary Figure S3). Several OTUs from the genera Ca. Scalindua (Planctomycetes) were present throughout the water column with a total up to 5.7% at 100 m in December 2015 (Figures 7, 9). Members of the Woesearchaeota phylum were most abundant at depths from 100 to 200 m (0.3–12.2%). These results indicate a strong vertical stratification of the water column microbial community and relative consistency in this stratified community throughout the year, with notable exceptions (Figure 8). Surface waters, for example, exhibited considerable dynamics in microbial communities during the spring blooms (April–June), and deeper waters shifted composition following renewal in July (Figure 8).
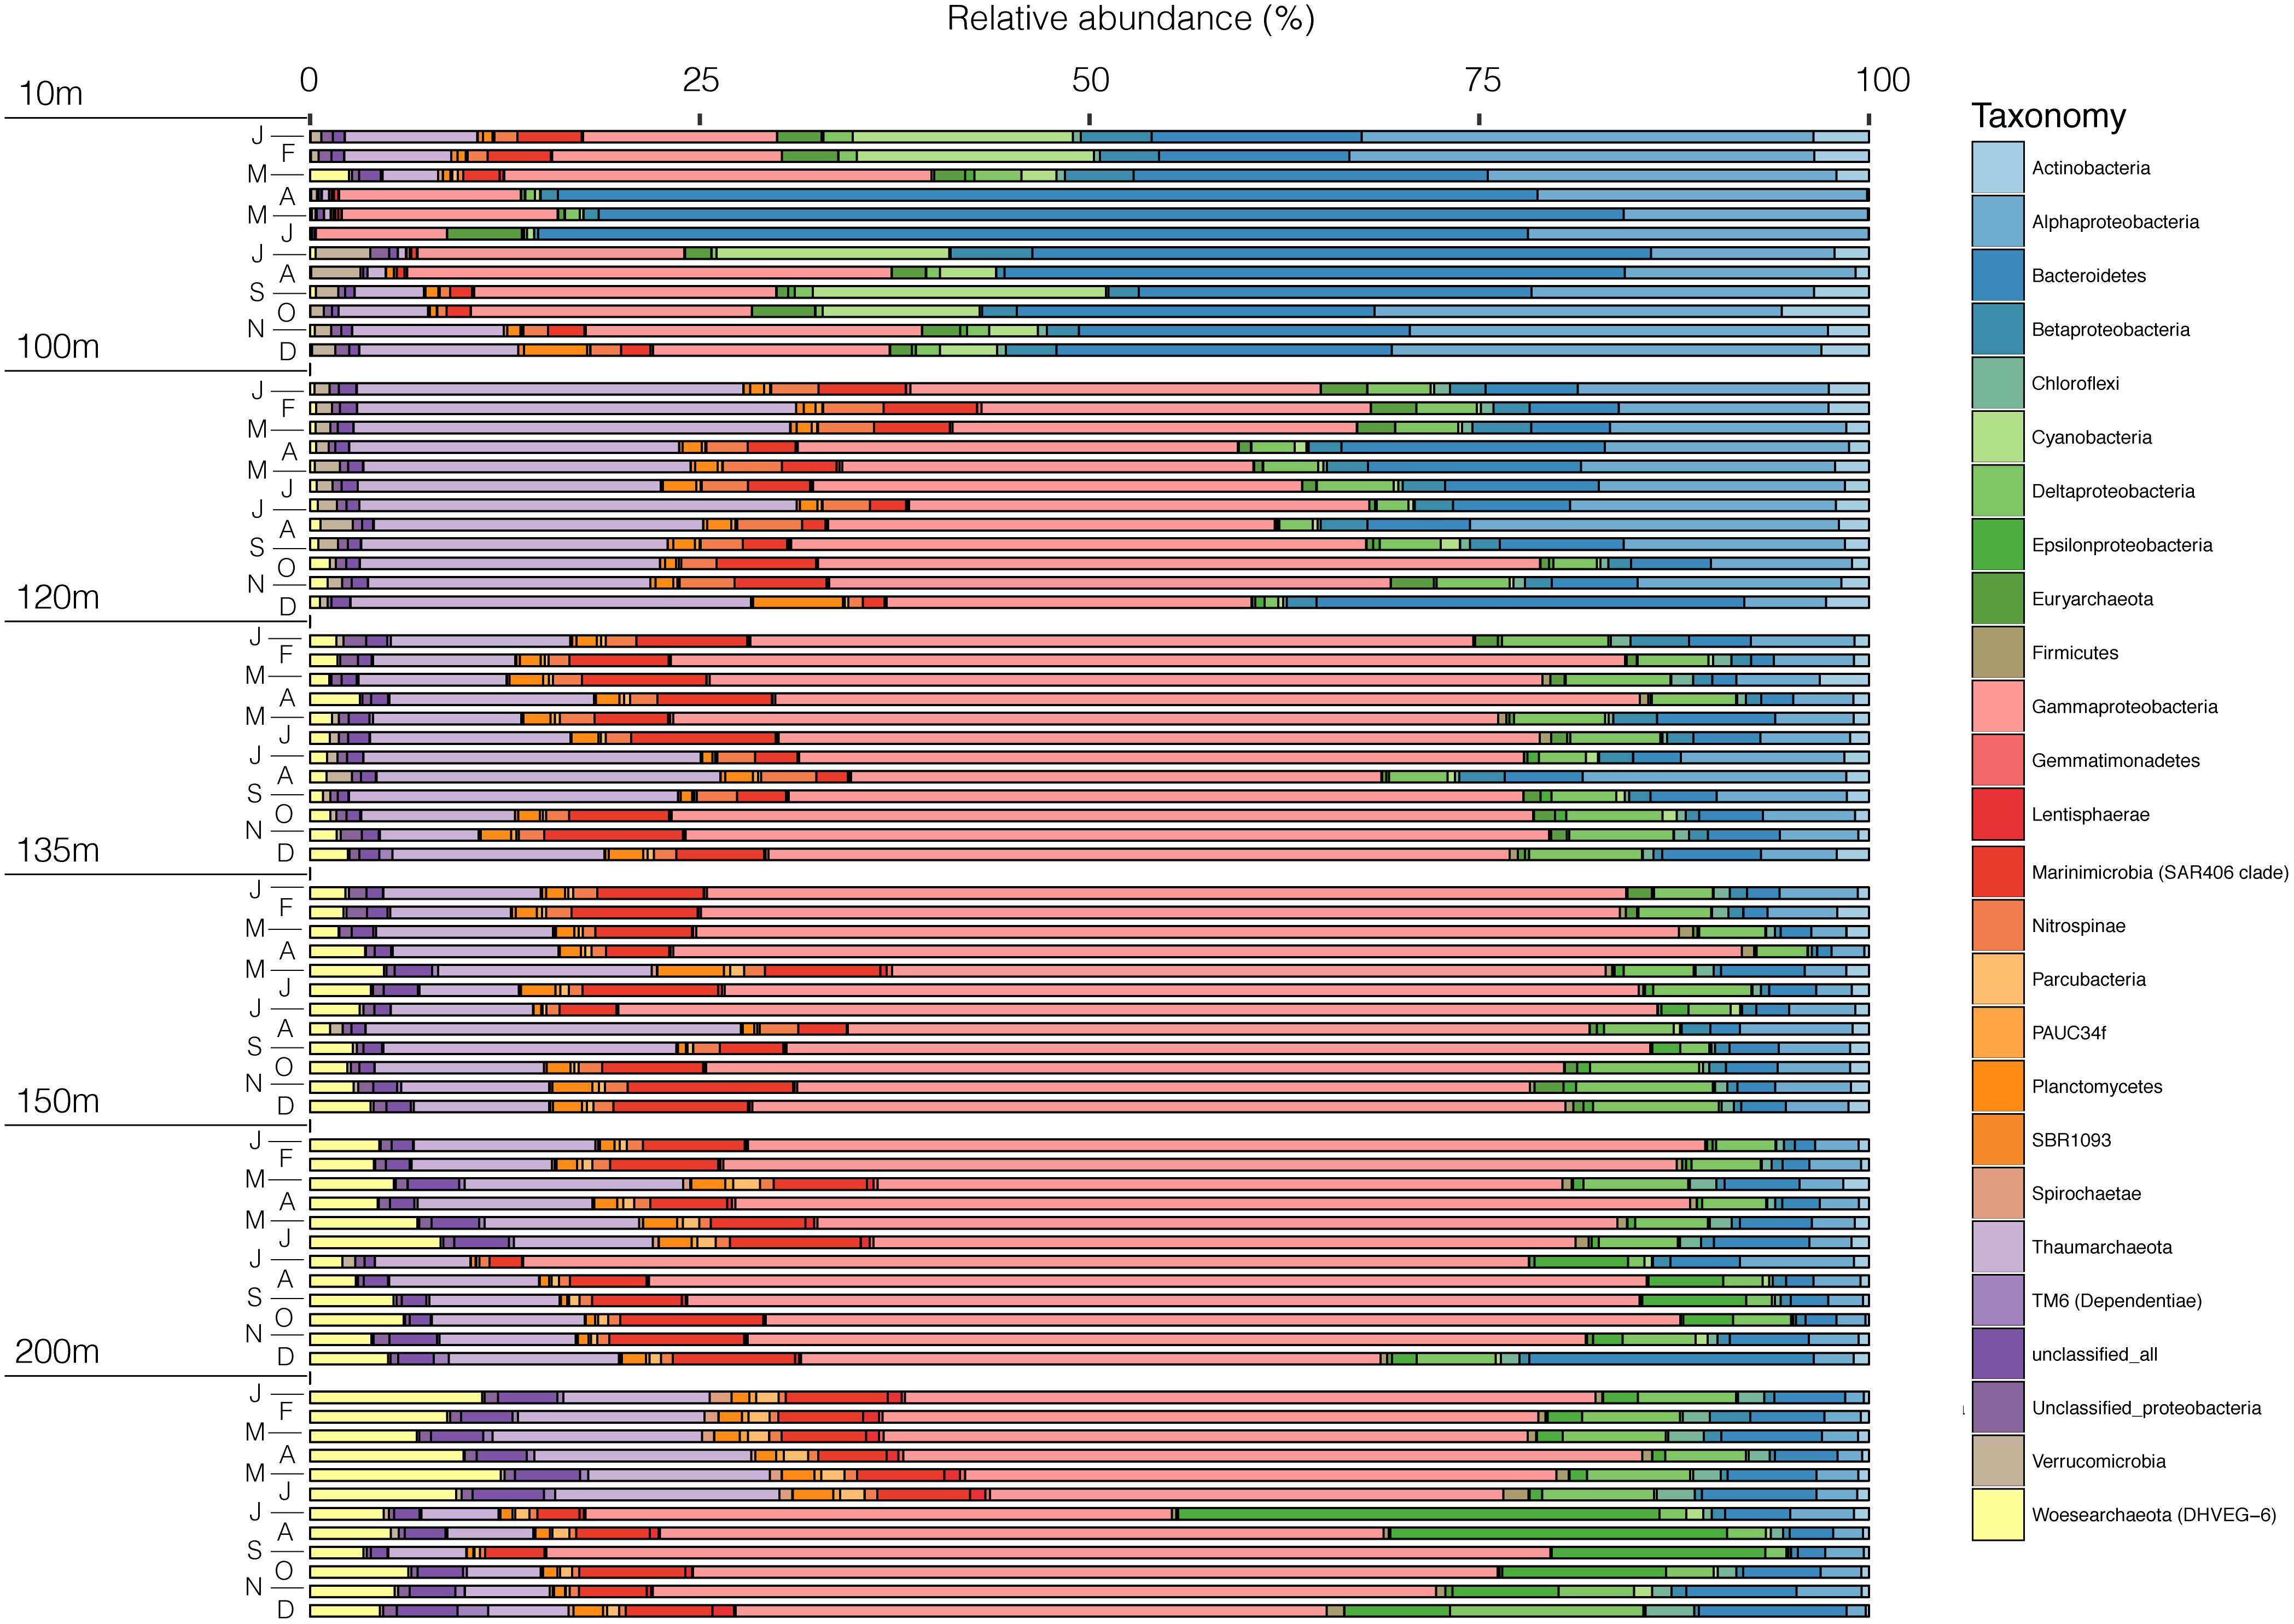
Figure 7. Microbial community composition of SI in 2015 for 6 depths (10, 100, 120, 135, 150, and 200 m) at the phylum level in relative abundance.
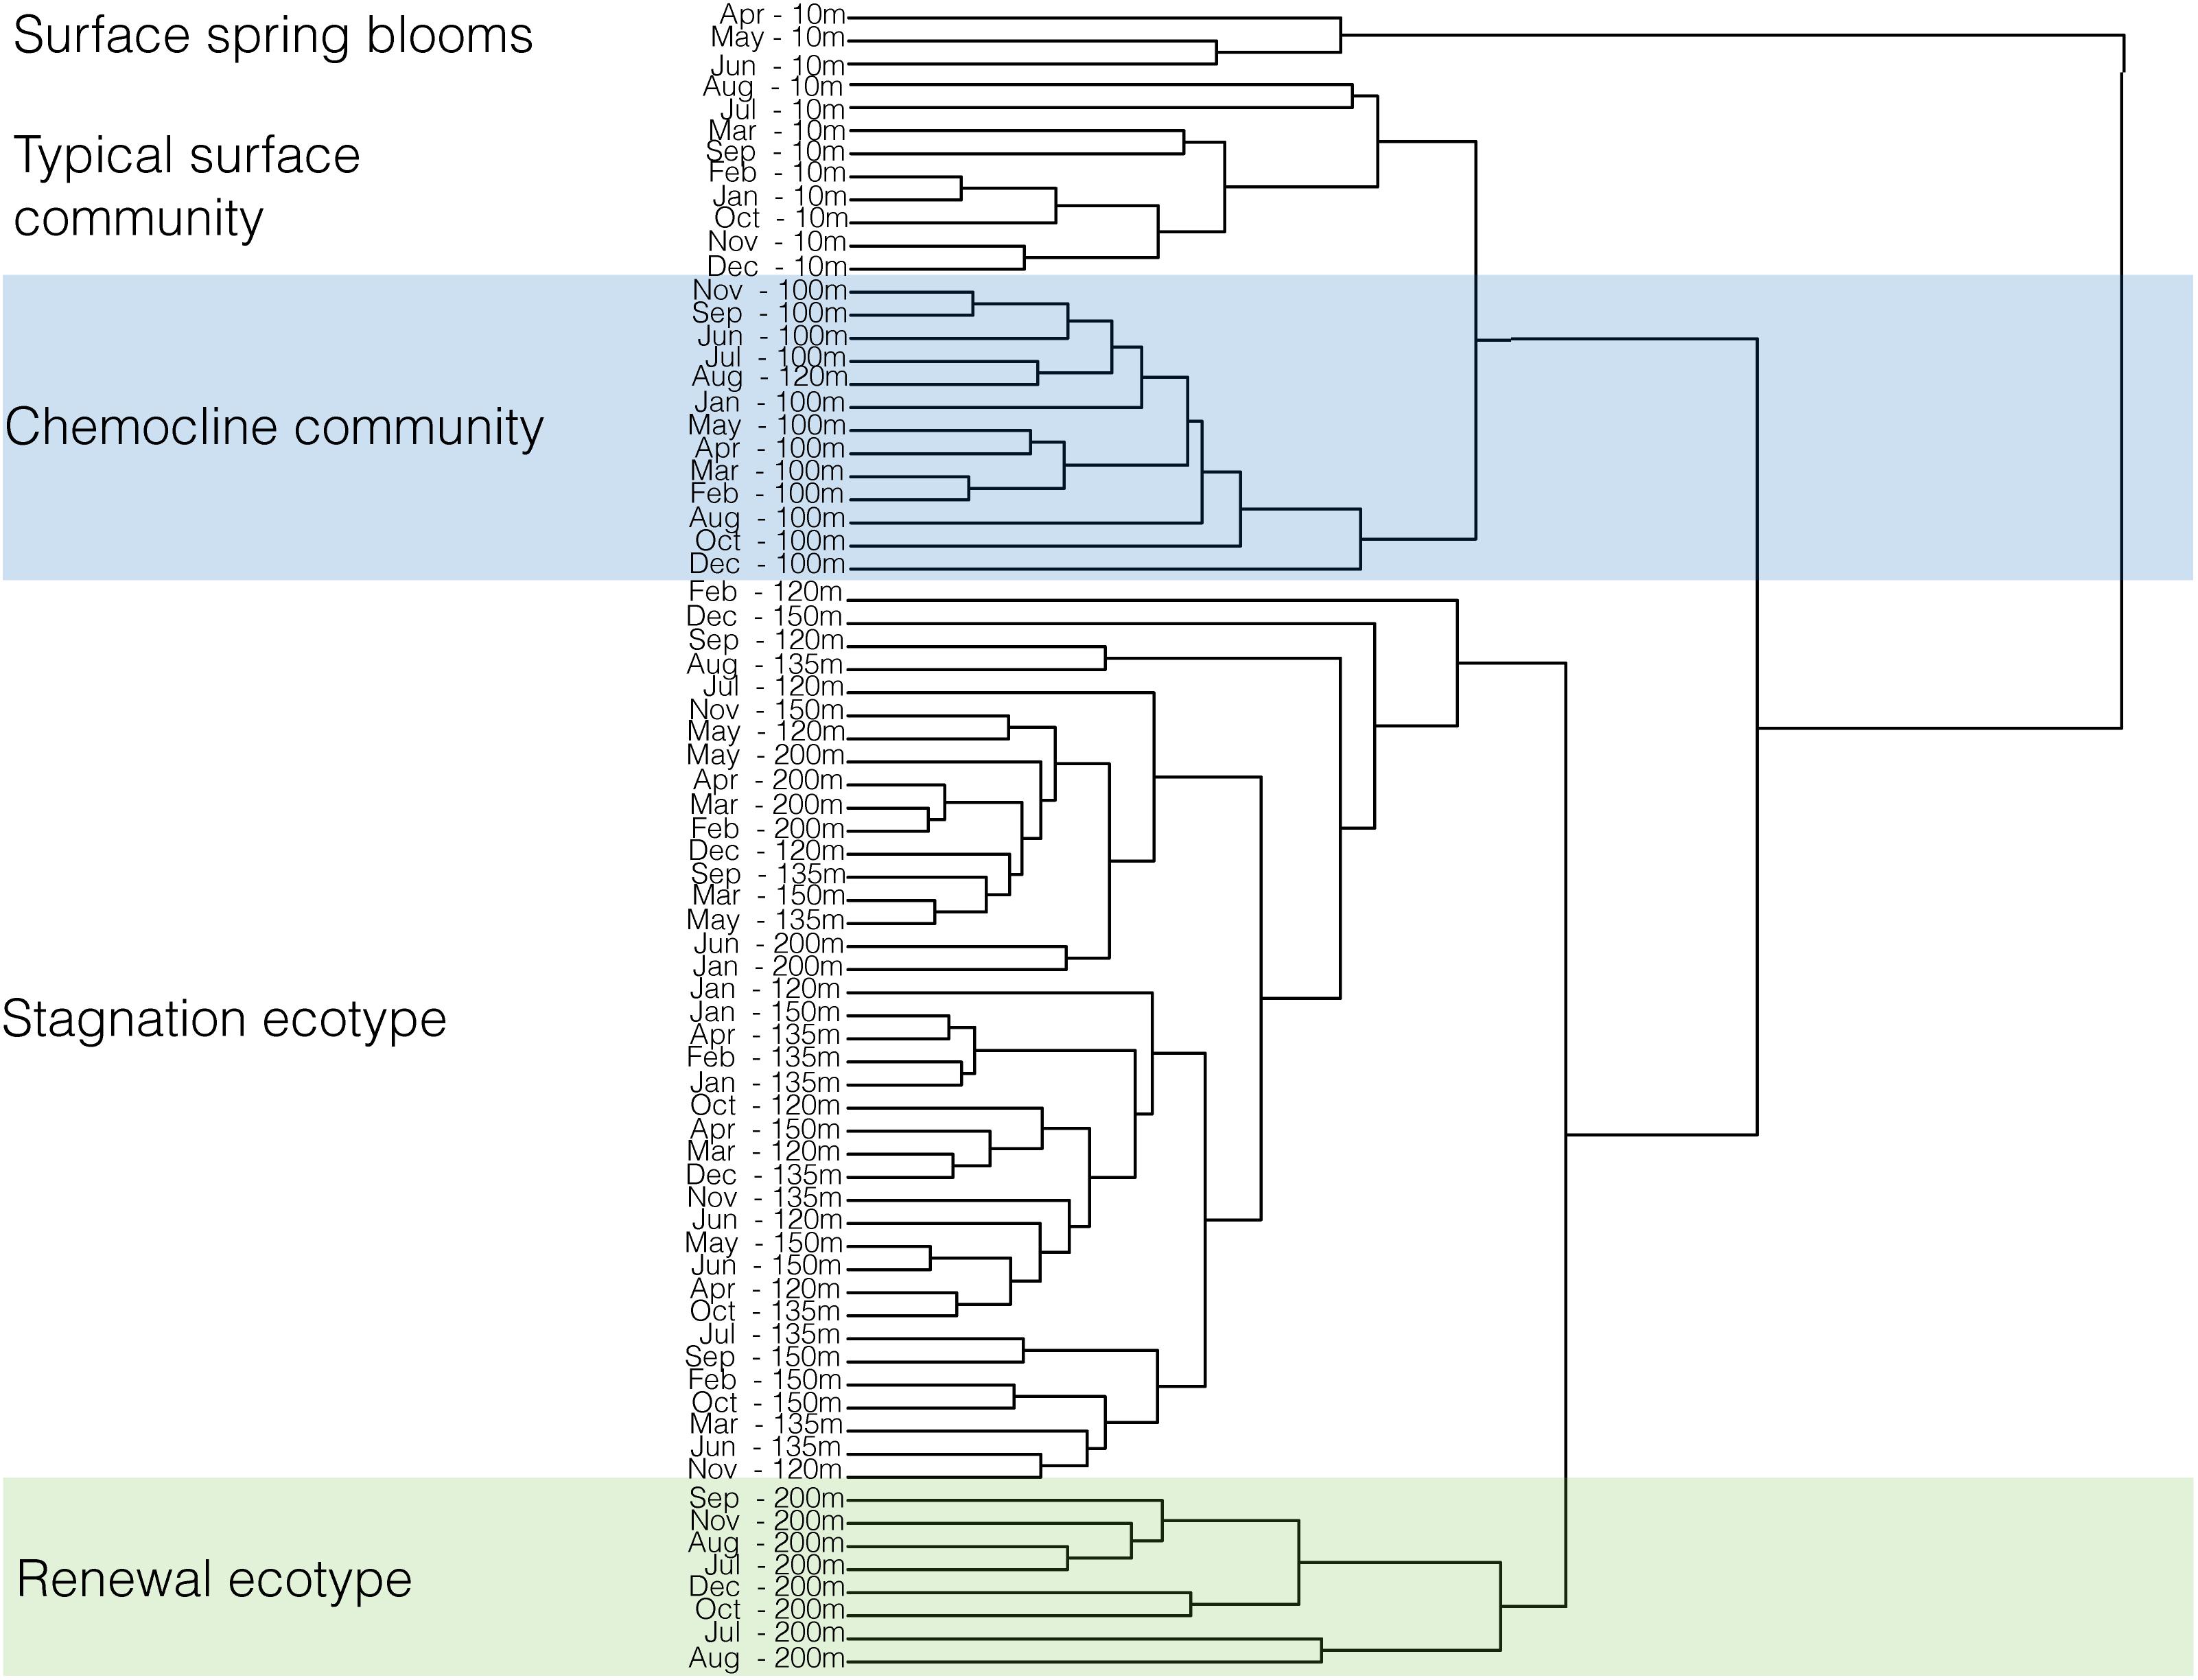
Figure 8. Clustering of the microbial community composition of SI in 2015 for 6 depths (10, 100, 120, 135, 150, and 200 m) and 12 months. Dissimilarities between samples is shown by the height of the fusion of the dendrogram: the higher the fusion, the more dissimilar samples are between each other. Clustering of samples was performed in R with the Euclidean method.
Discussion
Partitioning of N-Loss in SI, and the Seasonality of Anammox and Denitrification
15N-labeled incubations indicate that both anammox and denitrification operated simultaneously throughout the year in the anoxic water column of SI. Although anammox dominated (responsible for >50% N-loss) in 55% of the measurements in which N2 production was detected (Figures 3A–C), depth-integrated rates of denitrification show that it accounts for up to 63% of the total N-loss from SI (Figure 6). Overall, depth-integrated rates of denitrification and anammox ranged between 0.02 and 14.4 mmol m−2 d−1 and 0.15 and 3.36 mmol m−2 d−1, respectively (Figure 6). Annual pelagic N-loss from the inlet was calculated using these measurements by taking the average of the depth-integrated rates, and multiplying these by the surface area of SI’s anoxic basin (33 km2). Annual N-loss totalled 0.002 Tg N yr−1 in 2015. N-loss rates previously reported based solely on geochemical measurements (Manning et al., 2010) implied N-loss of between 1.7 and 8.1 mmol m−2 d−1. Given that 50% of the N-loss previously reported is from benthic N2 production, the rates that we measure here, that only capture pelagic N-loss, appear appreciably higher and may thus suggest inter-annual variability in N2 production rates. Rates of denitrification and anammox were previously reported for 2 months during peak “stagnation” in SI in 2010 (Louca et al., 2016) and while these are at the lower end of the range of rates measured here, they generally agree with the rates we detected during peak stagnation.
The monthly variability in rates of N-loss from Saanich inlet are driven through dynamics in rates of both anammox and denitrification. Thus, knowledge on the regulation of both anammox and denitrification is key to knowing how N-budgets in Saanich inlet, and by extension, other anoxic fjords, vary. Partitioning of N-loss between these pathways for the entire year reveals 63% denitrification and 37% anammox. This ratio is close to the theoretical ratio calculated for the partitioning of N-loss in the open ocean through anammox and denitrification (29–71% anammox/denitrification ratio). This ratio applies when substrate (NH4+) supply rates for anammox are constrained by the stoichiometry of settling organic matter (Codispoti et al., 2001; Van Mooy et al., 2002; Devol, 2003; Koeve and Kähler, 2010; Babbin et al., 2014). Excursions beyond this ratio might indicate additional sources of NH4+, such as sulfate reduction, and/or an input of NH4+ from the underlying sediments. Excursion below this ratio more likely signals competition for nitrite or chemoautotrophic denitrification, which would not liberate NH4+. In July and December of 2015, N-loss was close to the theoretical ratio (27 and 31%, respectively), which is consistent with the canonical scenario in which heterotrophic denitrification supplies anammox with NH4+. The ratio deviates from this throughout much of the rest of the year, with generally higher proportions of anammox (40% and beyond), implying that an additional supply of NH4+, beyond that supplied through heterotrophic denitrification, is needed.
Rates of denitrification and anammox are expected to respond to supply of the principal substrates: NO3−, organic matter or HS− for denitrification, and NH4+ and NO2− for anammox; as well as possible inhibitors like HS− for anammox and O2 for both anammox and denitrification. In July 2015, O2 and NO3− both penetrate to 150 m (Figures 2D,E) signaling the intrusion of oxygenated NO3− rich waters to intermediate depths, and although devoid of O2, deep waters (185 and 200 m) contain detectable NO3−. These observations indicate intermediate- and deep-water renewal in July. Although our monthly nutrient profiles do not record a strong deep-water renewal that would have oxygenated the deep waters, we do observe changes in nutrient concentrations, which coincide with higher rates of denitrification in July and August (Figure 6). Thus, the regulation of denitrification in SI appears linked to renewal, and is further enhanced by the accumulation of HS− in August.
A dramatic increase in deep water NH4+ concentrations is reflected by relatively high rates of anammox recorded in September, October, and November (Figure 6), along with lower concentrations of HS−, implying that increased deep-water NH4+ leads to higher rates of anammox. The NH4+ in the deep waters could originate from the remineralization of sinking organic matter supplied through primary production in the surface waters. Chlorophyll a peaks in the surface waters of SI, a proxy for the abundance of photosynthetic organisms, vary over the year, and peak during the spring/early summer (Figure 2C). Organic matter from primary production is exported to the deep waters and sediments as particles and fecal pellets. Given that both particles and fecal pellets would sediment to the deep waters in less than a week (Sancetta and Calvert, 1988), we expect deep water NH4+ concentrations to respond to blooms in the surface waters within 15 days. As we sampled approximately every 4 weeks, it is possible that we lacked the temporal resolution to capture intense degradation activity following a bloom. However, as blooms are a common occurrence during the summer months (Takahashi et al., 1977; Grundle et al., 2009), the increase in the deep-water NH4+ concentrations in September (Figure 2G) likely originates from a corresponding increase in surface water primary production. Therefore, the combination of relatively high productivity in surface water and the ensuing high NH4+ concentrations in the deep waters likely support relatively high rates of anammox toward the end of the summer.
Though ultimately sourced from primary production, the detailed biogeochemical pathways through which the NH4+ is made available to anammox can vary. These pathways include: ammonification due to organotrophic denitrification; DNRA; ammonification associated with sulfate reduction; or benthic NH4+ efflux. We thus consider these possible sources and their relative fluxes in relation to rates of anammox. Rates of denitrification measured in SI could have supplied 25% of the NH4+ needed to support co-occurring anammox on average, assuming Redfieldian OM stoichiometry and 100% organotrophic denitrification (in August 2015, Figure 6). This is unlikely as HS− clearly influences rates of denitrification, and is consistent with previously reported genomic information (Walsh et al., 2009; Hawley et al., 2014), which implies chemoautotrophic denitrification in SI. Another source of NH4+ could be organotrophic NO3− reduction to NO2−.
We calculate that the highest potential rates of NO3− reduction to NO2− recorded in August 2015 (Figure 4E, 400 nM N hr−1 for 20 μM NO3− addition), are sufficiently high such that all of the NH4+ needed to support the highest rates of anammox could come from this reaction (13.7 nM hr−1). However, in situ NO3− concentrations are generally not as high as the concentrations in these amended incubations, and thus rates of NO3− reduction to NO2− might not supply all the NH4+. Remineralization of organic matter through partial or complete denitrification is thus likely only partly responsible for NH4+ supply to anammox. Similarly, SO42− reduction could also produce NH4+ through remineralization of organic matter in the water column. In SI, however, sulfate reduction remains unmeasured through direct process rate experiments and the functional markers for canonical sulfate reduction were absent from the metaproteomes generated to date (Hawley et al., 2014). DNRA can also supply NH4+ to anammox, as it does in the Peruvian OMZ (Lam et al., 2009). A DNRA catalyzing-like protein, hydroxylamine-oxidoreductase, was recovered in metaproteomes and appears to be associated with the denitrifier– SUP05 (Hawley et al., 2014). DNRA, however, has not been detected in SI to date, though modeling predicts appreciable DNRA for September 2009, and DNRA, if operating in SI, could thus contribute to dynamics in anammox activity (Louca et al., 2016). Given that the pelagic pathways for NH4+ delivery to anammox appear insufficient to support the measured rates, we consider the possibility that NH4+ efflux from the bottom sediments also contributes NH4+ to anammox. Indeed, high rates of organic matter remineralization through sulfate reduction characterize SI sediments (Devol et al., 1984). Some of the NH4+ liberated in the process would diffuse from the sediment and could advect upward to fuel anammox in the overlying water. Based on our calculations (see Supplementary Section 1), NH4+ fluxes from the sediment in SI could fuel 88 to 100% of the NH4+ required to support anammox. We thus expect a combination of these multiple NH4+ sources fuels anammox and contributes to its variability throughout the year.
Kinetics of Denitrification and Anammox
External forcing by substrate supply rates places overall constraints on material fluxes and thus microbial community metabolism, but microbial community structure and function also depend on the specific ecophysiologies of relevant organisms, such as an organism’s ability to take up and metabolize a given substrate. We showed that denitrification in SI appears to depend on NO3− concentrations (Figure 4C and Table 2), and the Km for NO3− obtained at 165 m in August 2015 was 5 μM and in the same range as earlier reports from both environmental measurements and cultured denitrifiers (1.7–10 μM) (Jensen et al., 2009). These prior kinetic constants come from pure cultures of organotrophic denitrifiers (Parsonage et al., 1985; Christensen and Tiedje, 1988), sediment microbial communities (Murray et al., 1989; Dalsgaard and Thamdrup, 2002), and an anoxic sulfidic fjord (Jensen et al., 2009). When NO3− concentrations exceeded 15 μM, however, the rates of complete denitrification decreased (Figure 4F). This is in line with the observation that microorganism tend to favor the first step of denitrification, NO3− reduction to NO2−, over complete NO3− reduction to N2, when NO3− concentrations are high. Similar observations were made previously in Mariager fjord (Jensen et al., 2009) where NO3− reduction to NO2− took over when NO3− concentrations exceeded 5 μM.
Rates of denitrification and anammox in SI are sensitive to the HS− concentrations present. When seawater from 120 m (June 2015) was amended with HS−, rates of denitrification increased with respect to HS− concentrations (Figure 5) for HS− concentrations higher than 2.5 μM. The rates then seemed to exhibit a linear response, possibly because the enzyme saturation for sulfide oxidation is much higher (Jensen et al., 2009). This observation is similar to reports of a linear dependency of denitrification on HS− concentrations, with no sign of saturation, up to 40 μM HS− in Mariager Fjord, Denmark (Jensen et al., 2009). Measurements of NO3− and NO2− indicate low or no NO2− accumulation during these incubations and, given the low rates of denitrification for 2.5 μM HS−, this implies a shunting of the NO2− produced to anammox. Indeed, anammox occurs at low HS− concentrations (Figure 5D). Anammox occurrence at low HS− concentrations was previously observed in a sulphidic alpine lake (Wenk et al., 2013). This stands in contrast to most previous marine observations, which found that anammox was inhibited by HS− at concentrations as low as 1.6 μM (Dalsgaard et al., 2003; Jensen et al., 2008). The stimulation of anammox at low HS− concentrations in SI may reflect the production of NO2− through partial denitrification and the bypass of complete denitrification due to a higher affinity of anammox bacteria for NO2− (Dalsgaard and Thamdrup, 2002). This is supported by the fact that NO2− did not accumulate during these incubations (Figure 5A), implying that sulfide dependent partial denitrification (NO3− to NO2−) underpins nitrite leakage to anammox in SI when HS− is low.
As rates of anammox appear to be sensitive to higher fluxes of NH4+ in the water column (see above), we plotted the rates of anammox obtained for the whole year vs. the in situ NH4+ concentrations (Figure 10). However, the lack of a coherent positive relationship between rates of anammox and NH4+ concentrations generally implies insensitivity of anammox to NH4+ concentrations higher than 2 μM. These results could indicate that the Km for NH4+ of anammox bacteria is lower than the in situ NH4+ concentrations. Alternatively, this could also indicate that anammox bacteria could obtain the NH4+ needed through tight coupling between anammox and DNRA (Prokopenko et al., 2013) or through ammonification in particle-associated processes (Ganesh et al., 2014), which would not be specifically recorded in the ambient NH4+ concentrations in SI.
Vertical Partitioning of the Microbial Communities in SI
The strongest difference in microbial community composition was between the surface waters at 10 m depth and deep waters below 100 m depth (Figure 8), while temporal variations were most notable in the surface waters (Figure 8). Variation in community composition between 120 and 200 m depth was comparatively small as were dynamics in deep water community composition throughout the year, with the exception of OTUs assigned to the Epsilonproteobacterium, Arcobacter (Figures 7, 9). Such vertical stratification in microbial community composition is typical for aquatic ecosystems including OMZs (Stevens and Ulloa, 2008; Wright et al., 2012; İnceoğlu et al., 2015), and has been previously observed in SI (Zaikova et al., 2010; Hawley et al., 2014). Indeed, niche partitioning along redox gradients is generally expected (Wright et al., 2012). A conceptual model previously developed (Hawley et al., 2014) describes microbial community structure and function in SI and provides a benchmark framework through which to view temporal and vertical dynamics in microbial community composition (Figures 1C, 7–9 and Supplementary Figures S2, S3). The key taxa that comprise this model, including SUP05, Marinimicrobia, Thaumarchaeota, SAR11, and Planctomycetes were prevalent SI community members in 2015. These taxa were present throughout the water column, with Thaumarchaeota and SAR11 most abundant at 100 m and SUP05 increasing in abundance with depth. Planctomycetes were low in the surface water and increased to a few percent in the deeper waters, similar to Marinimicrobia. In addition to these taxa, our community profiles reveal dynamics in relatively abundant Bacteroidetes, which increase in the surface waters during the spring bloom (from 20 to 65% in April, May, and June), and Arcobacter that appears to bloom in the deep waters (from <1% up to 30% at 200 m) in association with renewal in July and subsequently decreases in relative abundance in the following month.
A closer analysis of microbial community dynamics in the surface waters reveals that of the 15 most abundant OTUs, there were high relative abundances of 3 OTUs of the Flavobacteriaceae and 1 OTU of the Rhodobacterales family in April, May, and June, and correspondingly low abundances of an OTU belonging to the SAR11 clade (see Supplementary Figure S3). This particular microbial community composition appears contemporaneous with photosynthetic blooms. Flavobacteriaceae and Rhodobacterales are generally considered participants in biomass degradation (Bergauer et al., 2018) and their relatively high abundance in the spring may thus be a response to relatively strong photosynthetic activity (Figure 2C). While photosynthetic blooms are evident from pigment distributions (Figure 2C), we did not observe correspondingly high relative abundances of photosynthetic bacterial taxa (cyanobacteria) at this time. This likely indicates that cyanobacteria play a limited role in this bloom, which instead is the response of diatom growth, as previously reported (Sancetta and Calvert, 1988). Diatom blooms in April, May and June thus appear to stimulate a number of microbial taxa linked to organic matter degradation in the surface waters, while cyanobacterial contributions to microbial community composition are marginalized at this time.
One of the most abundant OTUs present throughout the water column was assigned to the SUP05 cluster (Supplementary Figure S3), which varied between a few percent in the surface water to a maximum of 48% in July and September at 150 and 200 m, respectively (Figure 9 and Supplementary Figure S3). Based on its metabolic potential to couple sulfide oxidation to NO2− reduction to N2O and its relatively high abundance, SUP05 has been implicated as a key-player in coupled C, N, and S cycling and N-loss from SI (Walsh et al., 2009; Hawley et al., 2014), and more broadly throughout low oxygen marine waters globally (Wright et al., 2012; Anantharaman et al., 2013; Glaubitz et al., 2013; Callbeck et al., 2018). Consistent with this, we find that N2 production through denitrification was active throughout the year when SUP05 was a ubiquitously abundant community member (Figures 7, 9 and Supplementary Figure S3). Likewise, water collected from 120 m in June had a microbial community composition of 28% SUP05, and rates of denitrification in this water increased in response to HS− addition, indirectly linking SUP05 to sulfide dependent denitrification. However, N2O did not accumulate in our incubations, and we thus suspect that other taxa also play a role in denitrification, by reducing N2O to N2.
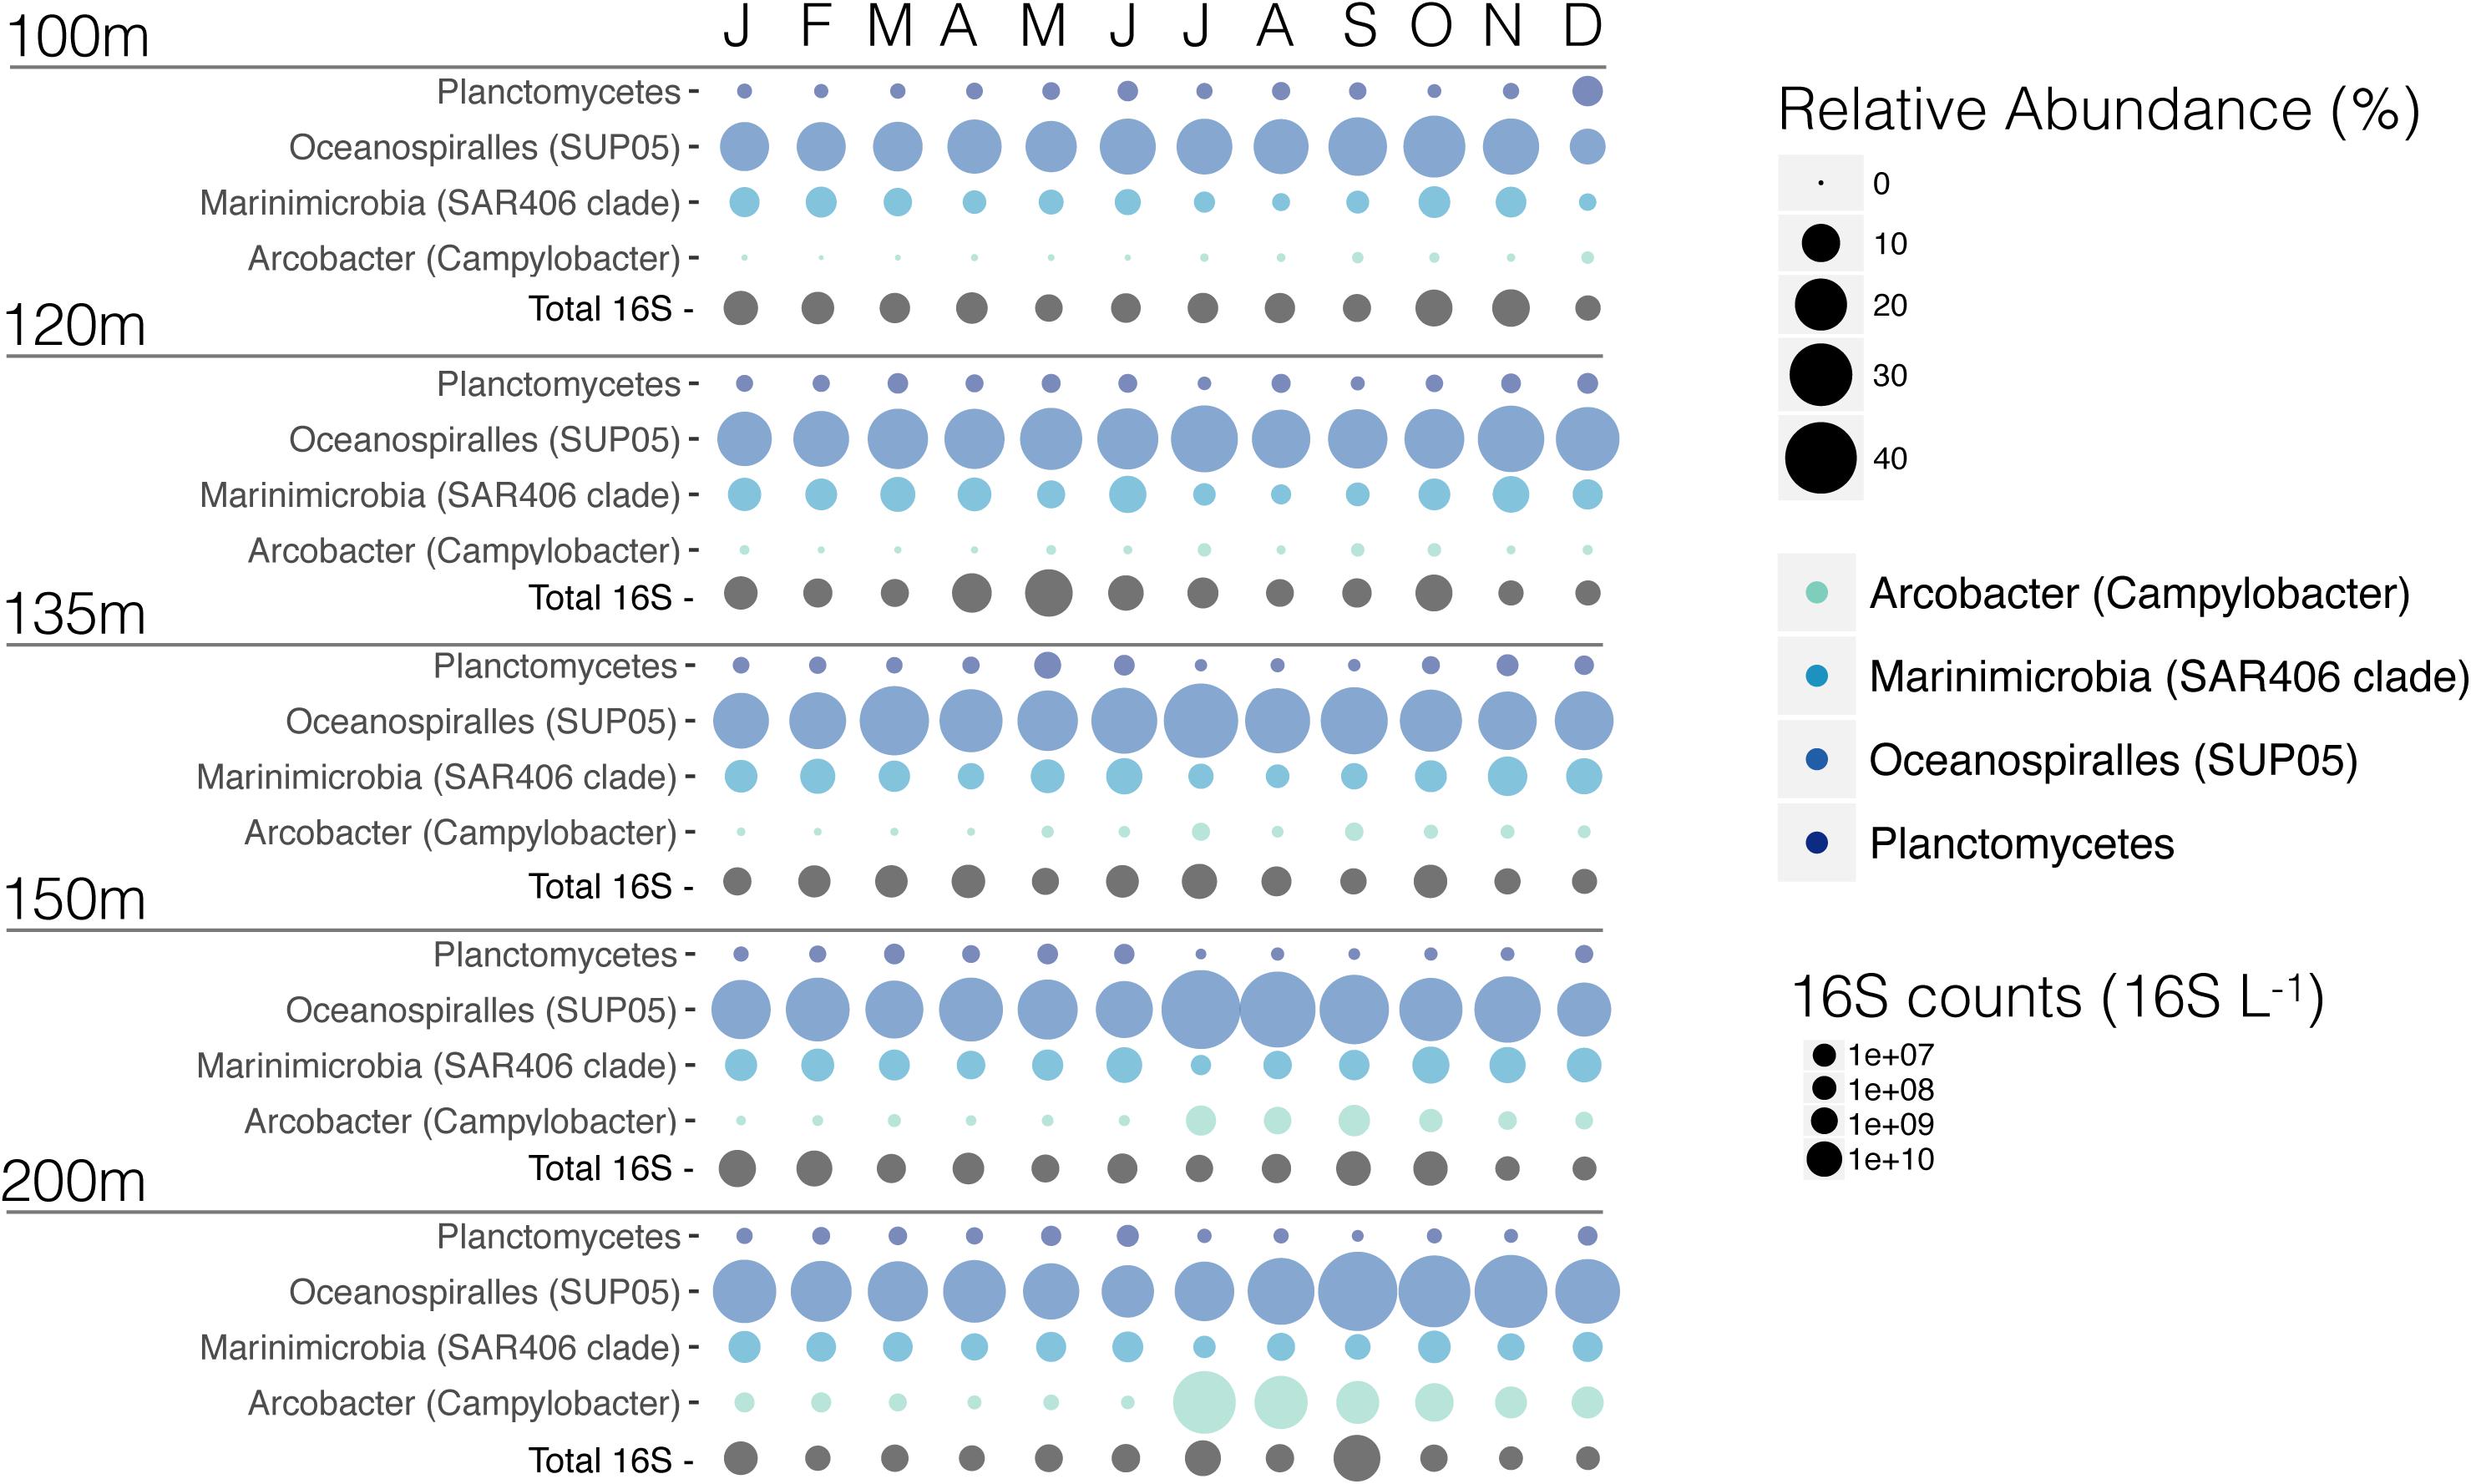
Figure 9. Comparison of the relative abundance of Planctomycetes, SUP05 cluster, Marinimicrobia, and newly highlighted Arcobacter bacteria. In addition to the relative abundance of these clades, we added total 16S counts (16S L−1) for each of these samples.
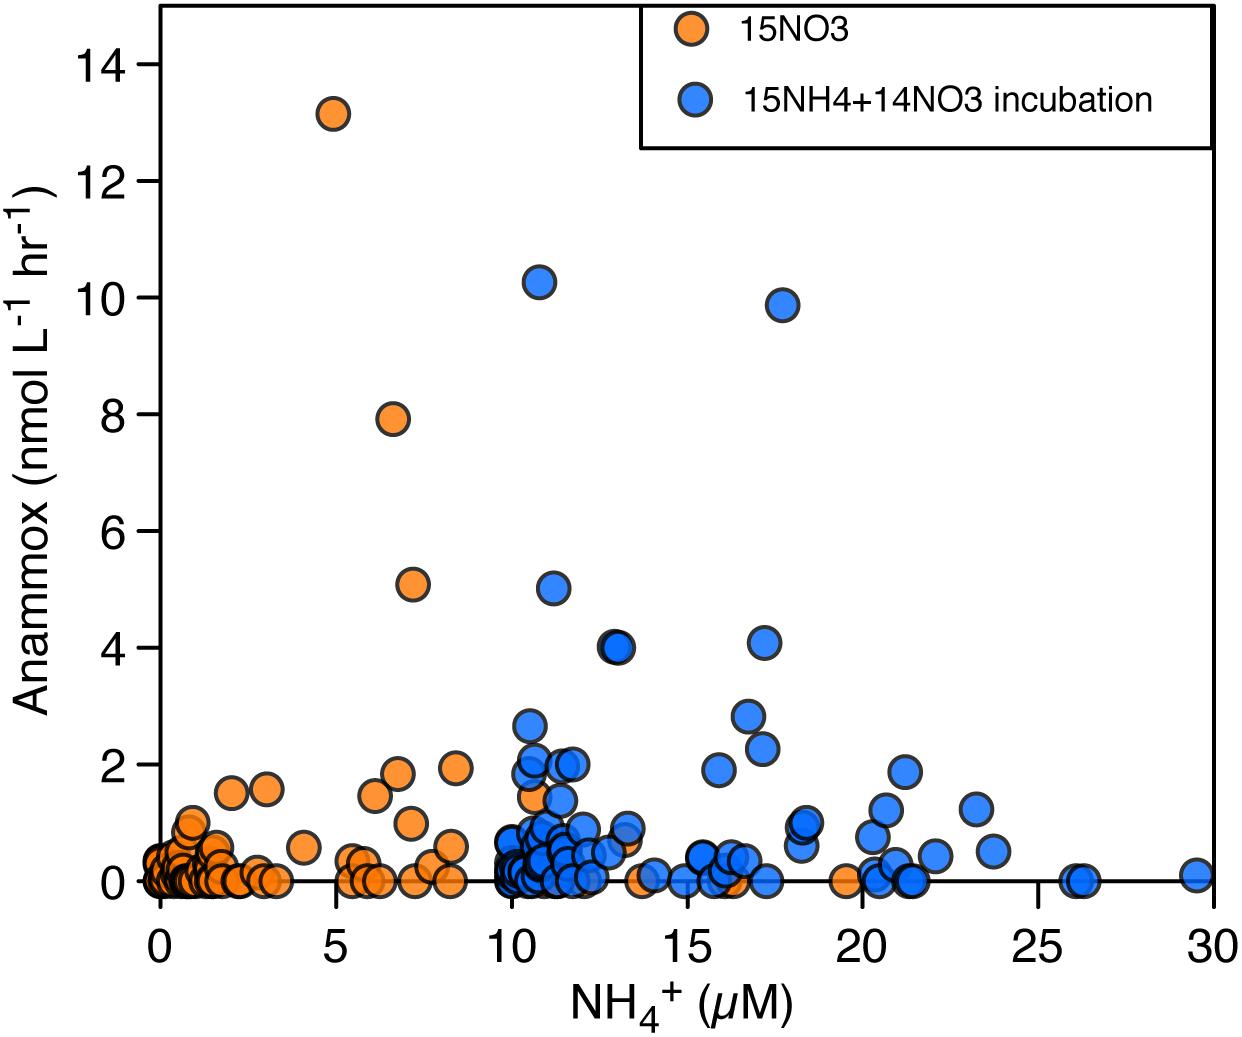
Figure 10. Comparison of anammox rates vs. in situ NH4+ concentrations (taking into account the addition of 15NH4+). In orange, rates of anammox obtained through the production of 29N2 with the addition of 15NH4+ and 15NO3−. In blue, rates of anammox obtained through the production of 29N2 with the addition of 15NO3−.
Some Marinimicrobia clades indeed possess the nosZ gene and have the metabolic potential to perform this last step in denitrification (Hawley et al., 2017a). Like SUP05, Marinimicrobia were relatively abundant in the deep waters where they comprised 4 different OTUs that together comprised up to 12% of the total microbial community at 135 m in November 2015 (Figures 7, 9, 11A and Supplementary Figure S3). These 4 OTUs were phylogenetically compared to previously identified Marinimicrobia genome bins and SAGs [Figure 11B, (Hawley et al., 2017a)] and were found to be affiliated to 4 different clades: 3 SI clones (SHBH1141, SHBH319, and SHAN400) as well as an Arctic clone (Arctic96B-7). Interestingly, only SHBH1141 appears to carry the nosZ gene (Hawley et al., 2017a), making it the most likely microorganism in SI to reduce N2O to N2 coupled to HS− oxidation (Hawley et al., 2014). The SHBH1141 clade increased with depth, with the overall highest relative abundance at 150 m (Figure 11A). However, SHBH1141’s relative abundance decreased in July, in association with the renewal event. Comparatively, the SHAN400 clade remained relatively constant between 100 and 200 m and both Arctic96B-7 and SHBH391 have higher relative abundances at 120 m than at 100 m and remain constant down to 200 m. From SAGs, SHAN400 and Arctic96B-7 were shown to carry NO3− reduction to NO coupled to HS− oxidation, thus participating in partial denitrification, whereas no genes involved in the N-cycle were found for SHBH391 (Hawley et al., 2017a).
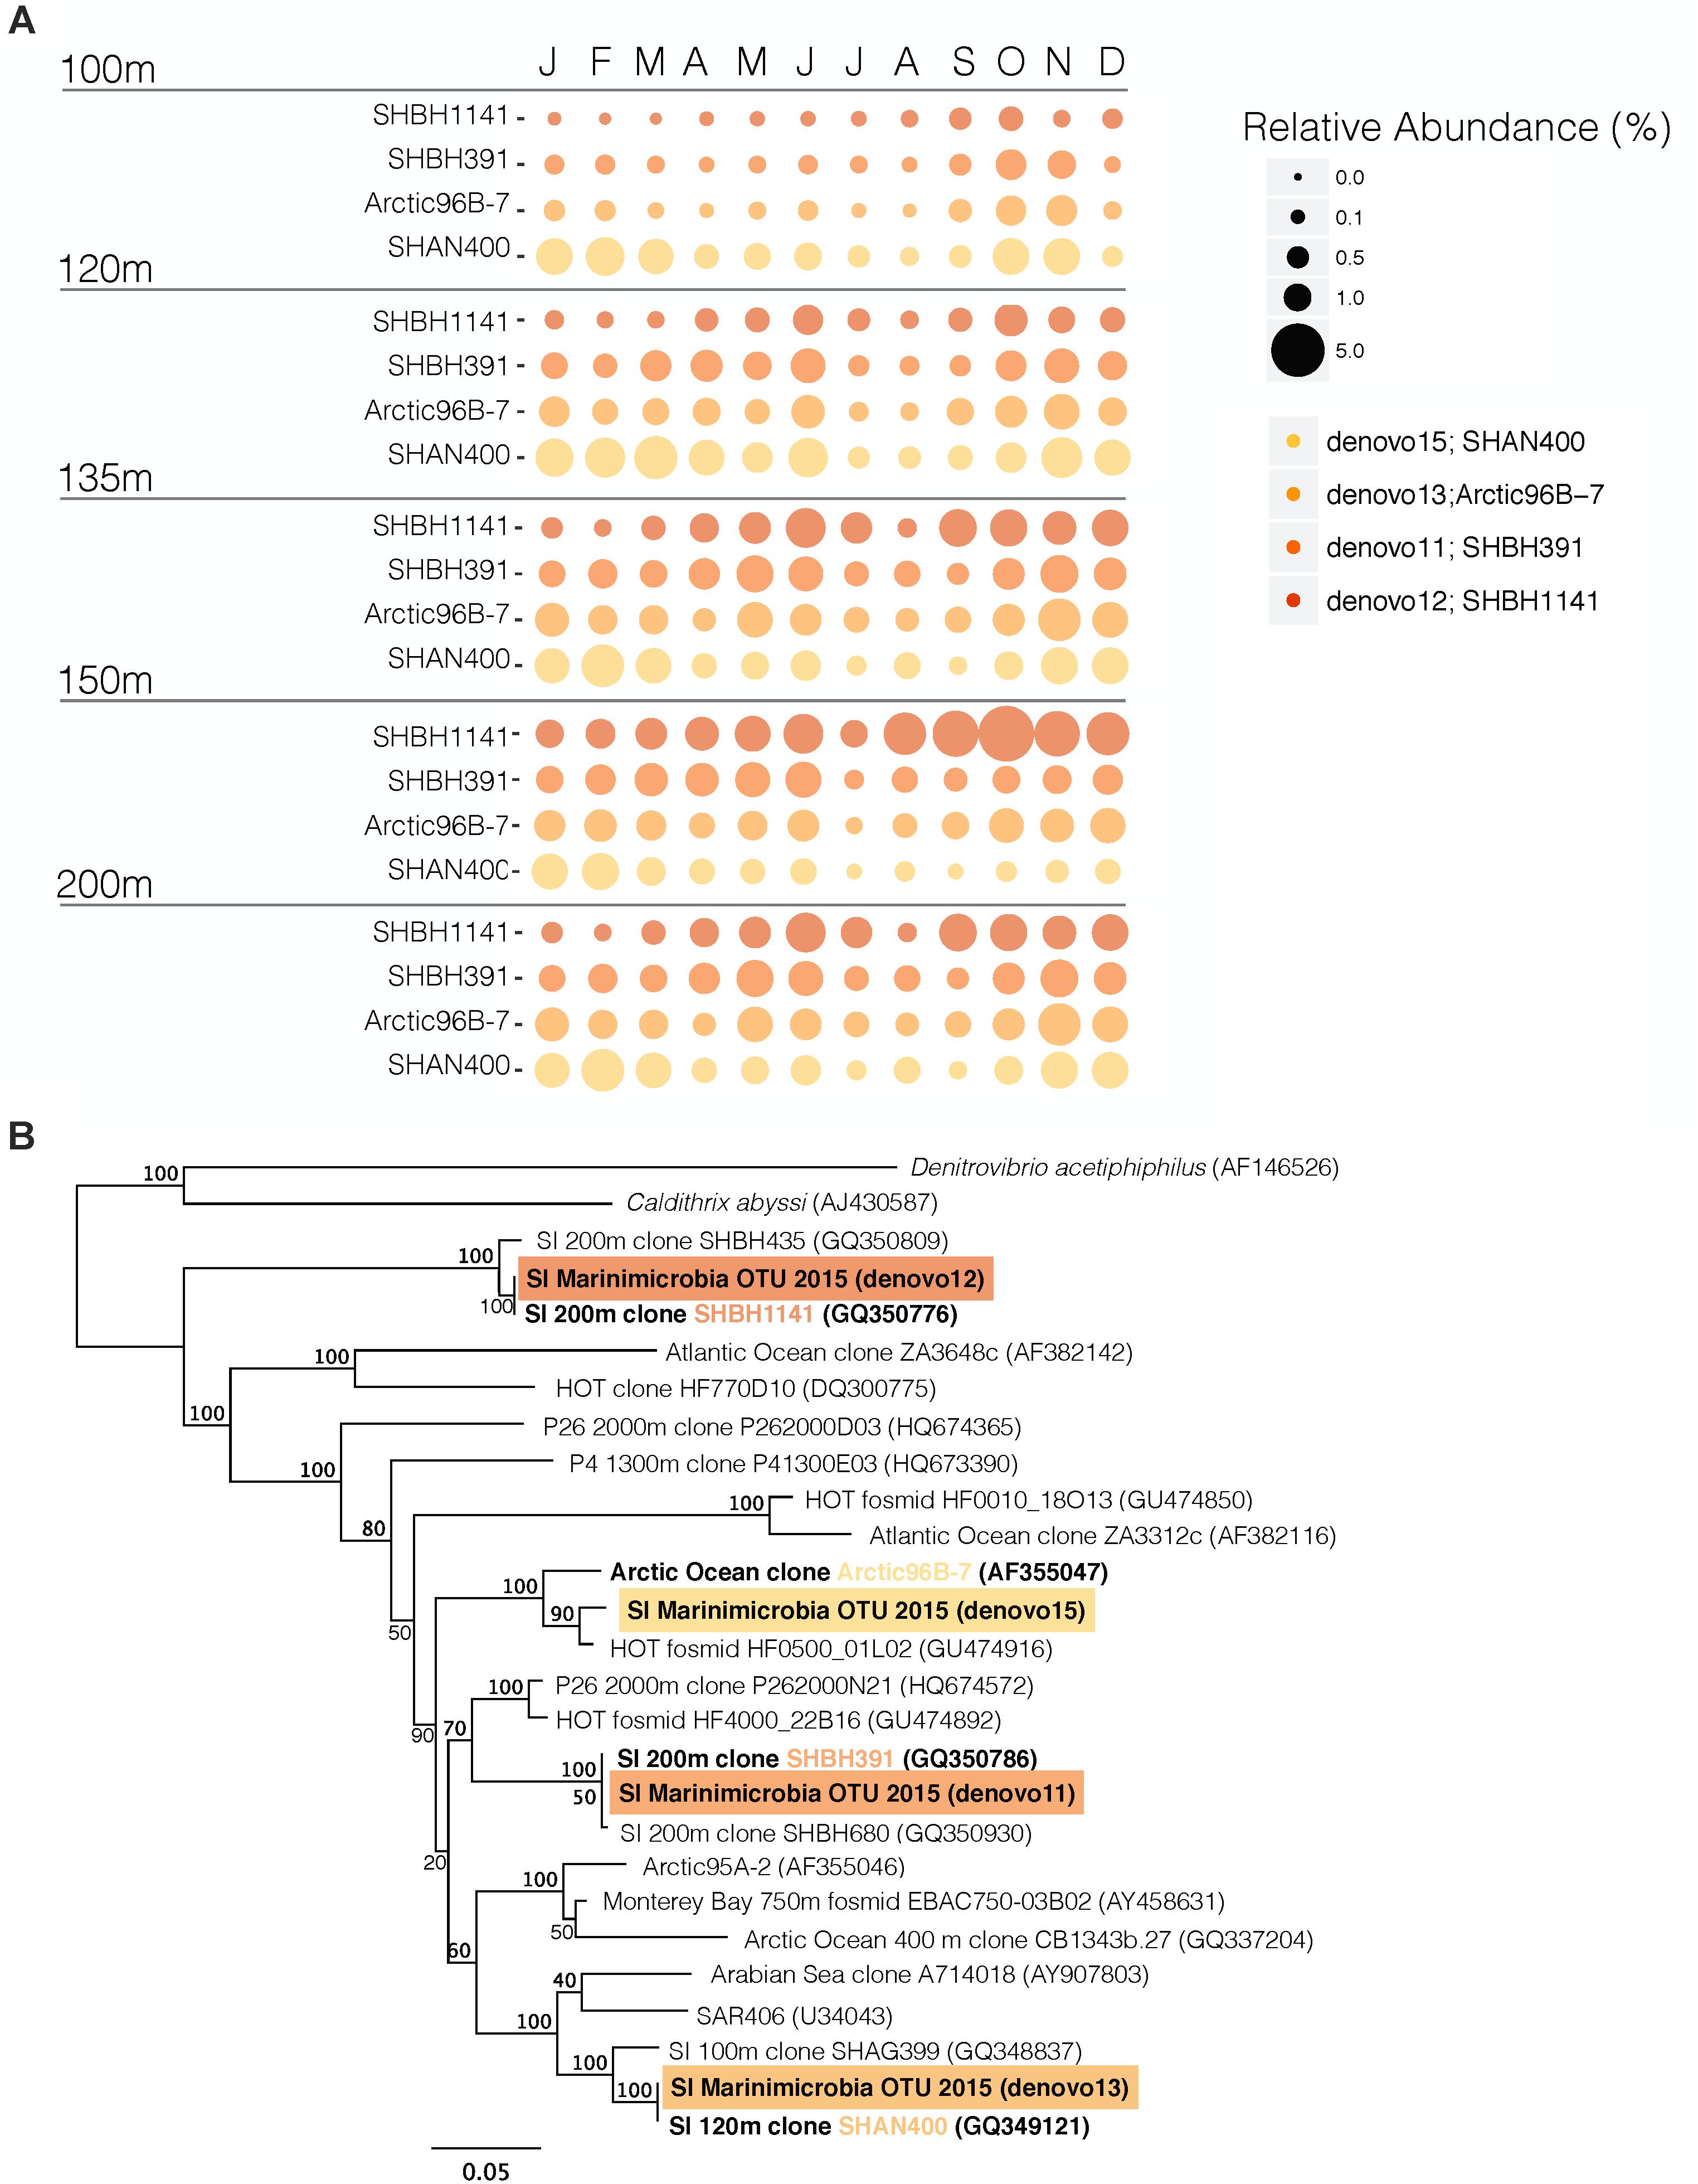
Figure 11. OTUs from the Marinimicrobia phylum in SI. (A) Relative abundance of the 4 most abundant OTUs of the Marinimicrobia phylum in SI plotted by depths and months (B) maximum-likelihood phylogenetic tree of the small subunit rRNA for sequences of the Marinimicrobia clade (ML implemented with RaxML, 100 bootstraps). OTUs identified in this study are highlighted in a colored box. Previously identified SAGs or genome bins are in bold. The bar represents 5% estimated sequence divergence. Bootstrap value at the branch node indicate the robustness of the branching of the tree.
Anammox was also operative throughout the entire year in 2015, and accordingly, we found members of the Planctomycetes phylum were present at up to 5% in the water column (Figures 7–9). Indeed, Planctomycetes is the only phylum known to contain bacteria that perform anammox. The metabolic potential for anammox is restricted in the Planctomycetes to the order Brocadiales. SI hosts mainly Ca. Scalindua, a well-known marine anammox bacterium which comprised up to 2.6% of the community at 135 m in May (Figure 9). Altogether, microbial community profiling reveals that the key taxa that comprise previous conceptual models for coupled microbial C, N, and S cycling in SI are present and relatively abundant at depths between 100 and 200 m throughout the year. At the community level, these taxa collectively underpin N cycling and loss from Saanich inlet, which we demonstrate through contemporaneous process rate measurements.
In addition to the taxa discussed above, it appears that an OTU assigned to the Epsilonproteobacteria Arcobacter increases dramatically in relative abundance in the deep waters, notably at 200 m where it goes from <1% in June, to 30% in July, becoming one of the 15 most abundant OTUs in SI, and then drops to 20% in August. This increase in relative abundance appears to be a response to deep water renewal and is strongly correlated with the enhanced rates of denitrification found in July and August, relative to the rest of the year, as well as the highest rates of dark carbon fixation (Figure 2D). Indeed, a number of Arcobacter isolates are known to perform complete denitrification (NO3− to N2) (Canion et al., 2013), as well as sulfide oxidation (Wirsen et al., 2002). The high relative abundances of Arcobacter in July and the fact that Marinimicrobia OTUs decreased at the same time posits an important role for Arcobacter in the SI N-cycle (Figures 9, 11A).
Considering our observations of microbial community and biogeochemical dynamics across the year, we suggest that the inlet exists in two principle biogeochemical states: throughout much of the year, the inlet is relatively stagnant, anaerobic N2 production is distributed between anammox and denitrification and we suggest that Ca. Scalindua, SUP05, and Marinimicrobia are the key taxa responsible; during the summer renewal the input of NO3− to deep sulfide-rich waters stimulates the growth of Arcobacter, which drives most N2 production through denitrification marginalizing anammox. These two states thus define microbial community phenotypes representing background or ‘stagnation’ periods and ‘renewal’ periods, respectively.
Shifts between stagnation and renewal phenotypes imply that the relevant community members possess differing ecophysiology. In particular, the bloom in Arcobacter in response to renewal implies that these organisms have higher maximum cell specific growth rates and/or lower biomass yield than the combination of SUP05 and Marinimicrobia. Without any existing information on biomass yield, we thus estimated cell-specific rates of N2 production through denitrification during stagnation and renewal periods. We expect for the combined Marinimicrobia/SUP05 population to have lower cell specific rates in comparison to the Arcobacter population, which produces N2 at higher rates for similar cell abundance. For the ‘stagnation’ phenotype we used an average cell abundance of 1.6 × 10⁹ cells L−1 for the combined abundance of Marinimicrobia and SUP05, which we estimated by combining qPCR of the bacterial 16S rRNA gene as a proxy for total community size with the relative Marinimicrobia/SUP05 abundance from our amplicon sequence data (see Supplementary Material). Marinimicrobia, in association with SUP05, are likely responsible for the production of N2 throughout most of the year, and we used the lowest and highest rates of denitrification in the stagnant period (0.01–38.45 nM hr−1) to come up with a range of cell specific denitrification rates for Marinimicrobia/SUP05 between 0.0001 and 0.6 fmol N2 cell−1 d−1.
To compare against the renewal phenotype, we estimated Arcobacter cell abundance (based on total bacterial 16S rRNA gene copies for July at 200 m, 3.05 × 10⁹ cells L−1 combined with the relative abundance of Arcobacter from our amplicon sequence data— see Supplementary Material) and with the corresponding rates of denitrification obtained cell-specific rates of 1.08 fmol N2 cell−1 d−1 for Arcobacter. The cell-specific rates for Marinimicrobia are therefore lower than the cell-specific rate calculated for Arcobacter. Thus, it is likely that SUP05/Marinimicrobia population has a higher growth yield than Arcobacter, shown by similar cell abundance but lower cell-specific rate for the former.
The low relative abundance of Planctomycetes associated with lower N2 production rates indicate that the anammox bacteria present in SI have a high cell-specific growth rate with a low growth yield. Again, based on the 16S abundance obtained from qPCR analysis (see Supplementary Material) applied to the average relative abundance of anammox bacteria, cell specific rates for anammox vary between 0.02 and 6.72 fmoles NH4+ cell−1 d−1, using average cell counts for anammox for the year (2.3 × 10⁷ anammox cells L−1) and the highest and lowest rates measured in SI in 2015. Our measured rates encompass the cell specific rates obtained from the Namibian OMZ [4.5 fmol NH4+ cell−1 d−1, (Kuypers et al., 2005)], the Black Sea [3–4 fmol NH4+ cell−1 d−1, (Jensen et al., 2008)], and diverse bioreactors [2–20 fmol NH4+ cell−1 d−1, (Strous et al., 1999)]. The lower end of our measured rates might be explained by small fractions of active versus total anammox bacteria present, which would increase the cell-specific rates calculated here. This highlights that, even though anammox bacteria are generally present in at lower relative abundances than denitrifiers (SUP05, Marinimicrobia and/or Arcobacter), they play a similar role in N-species transformations and N2 production as well as overall energy transduction in low-oxygen and anoxic marine waters.
Model of NO2− Competition Between Anammox and Complete Denitrification
Based on the results described above, we built a flux balance model to study the competition for NO2− between anammox and complete denitrification, testing if we could reproduce the rates corresponding to the two community phenotypes proposed (high or low N2 production). Lower rates of denitrification are attributed to a ‘stagnation’ phenotype, whereas higher rates of denitrification correspond to a ‘renewal’ phenotype (Figure 12). The rates of anammox, NO3− reduction to NO2−, and complete denitrification (NO2− to N2), are described through Michaelis–Menten equations, depending on both substrates (electron donors and electron acceptors), their respective kinetic parameters (Km and Vmax) for each of these substrates, cell abundance and biomass yield (Y) (see Supplementary Material for a complete description of the model). Both NO3− reduction to NO2−, and complete denitrification are sulfide-dependent. Nutrient concentrations of interest (NO3−, NO2−, NH4+, and HS−) are calculated based on the rates of anammox, NO3− reduction to NO2−, and complete denitrification, as well as fixed input fluxes of the substrates through possible advection and diffusion (See Supplemental Material, section 3). These fluxes, however, are fixed throughout the simulation and do not reflect the highly dynamic nature of the nutrient fluxes found in SI, specifically through a renewal event. This model has thus been built to represent the two phenotypes introduced in the previous section in a steady-state scenario.
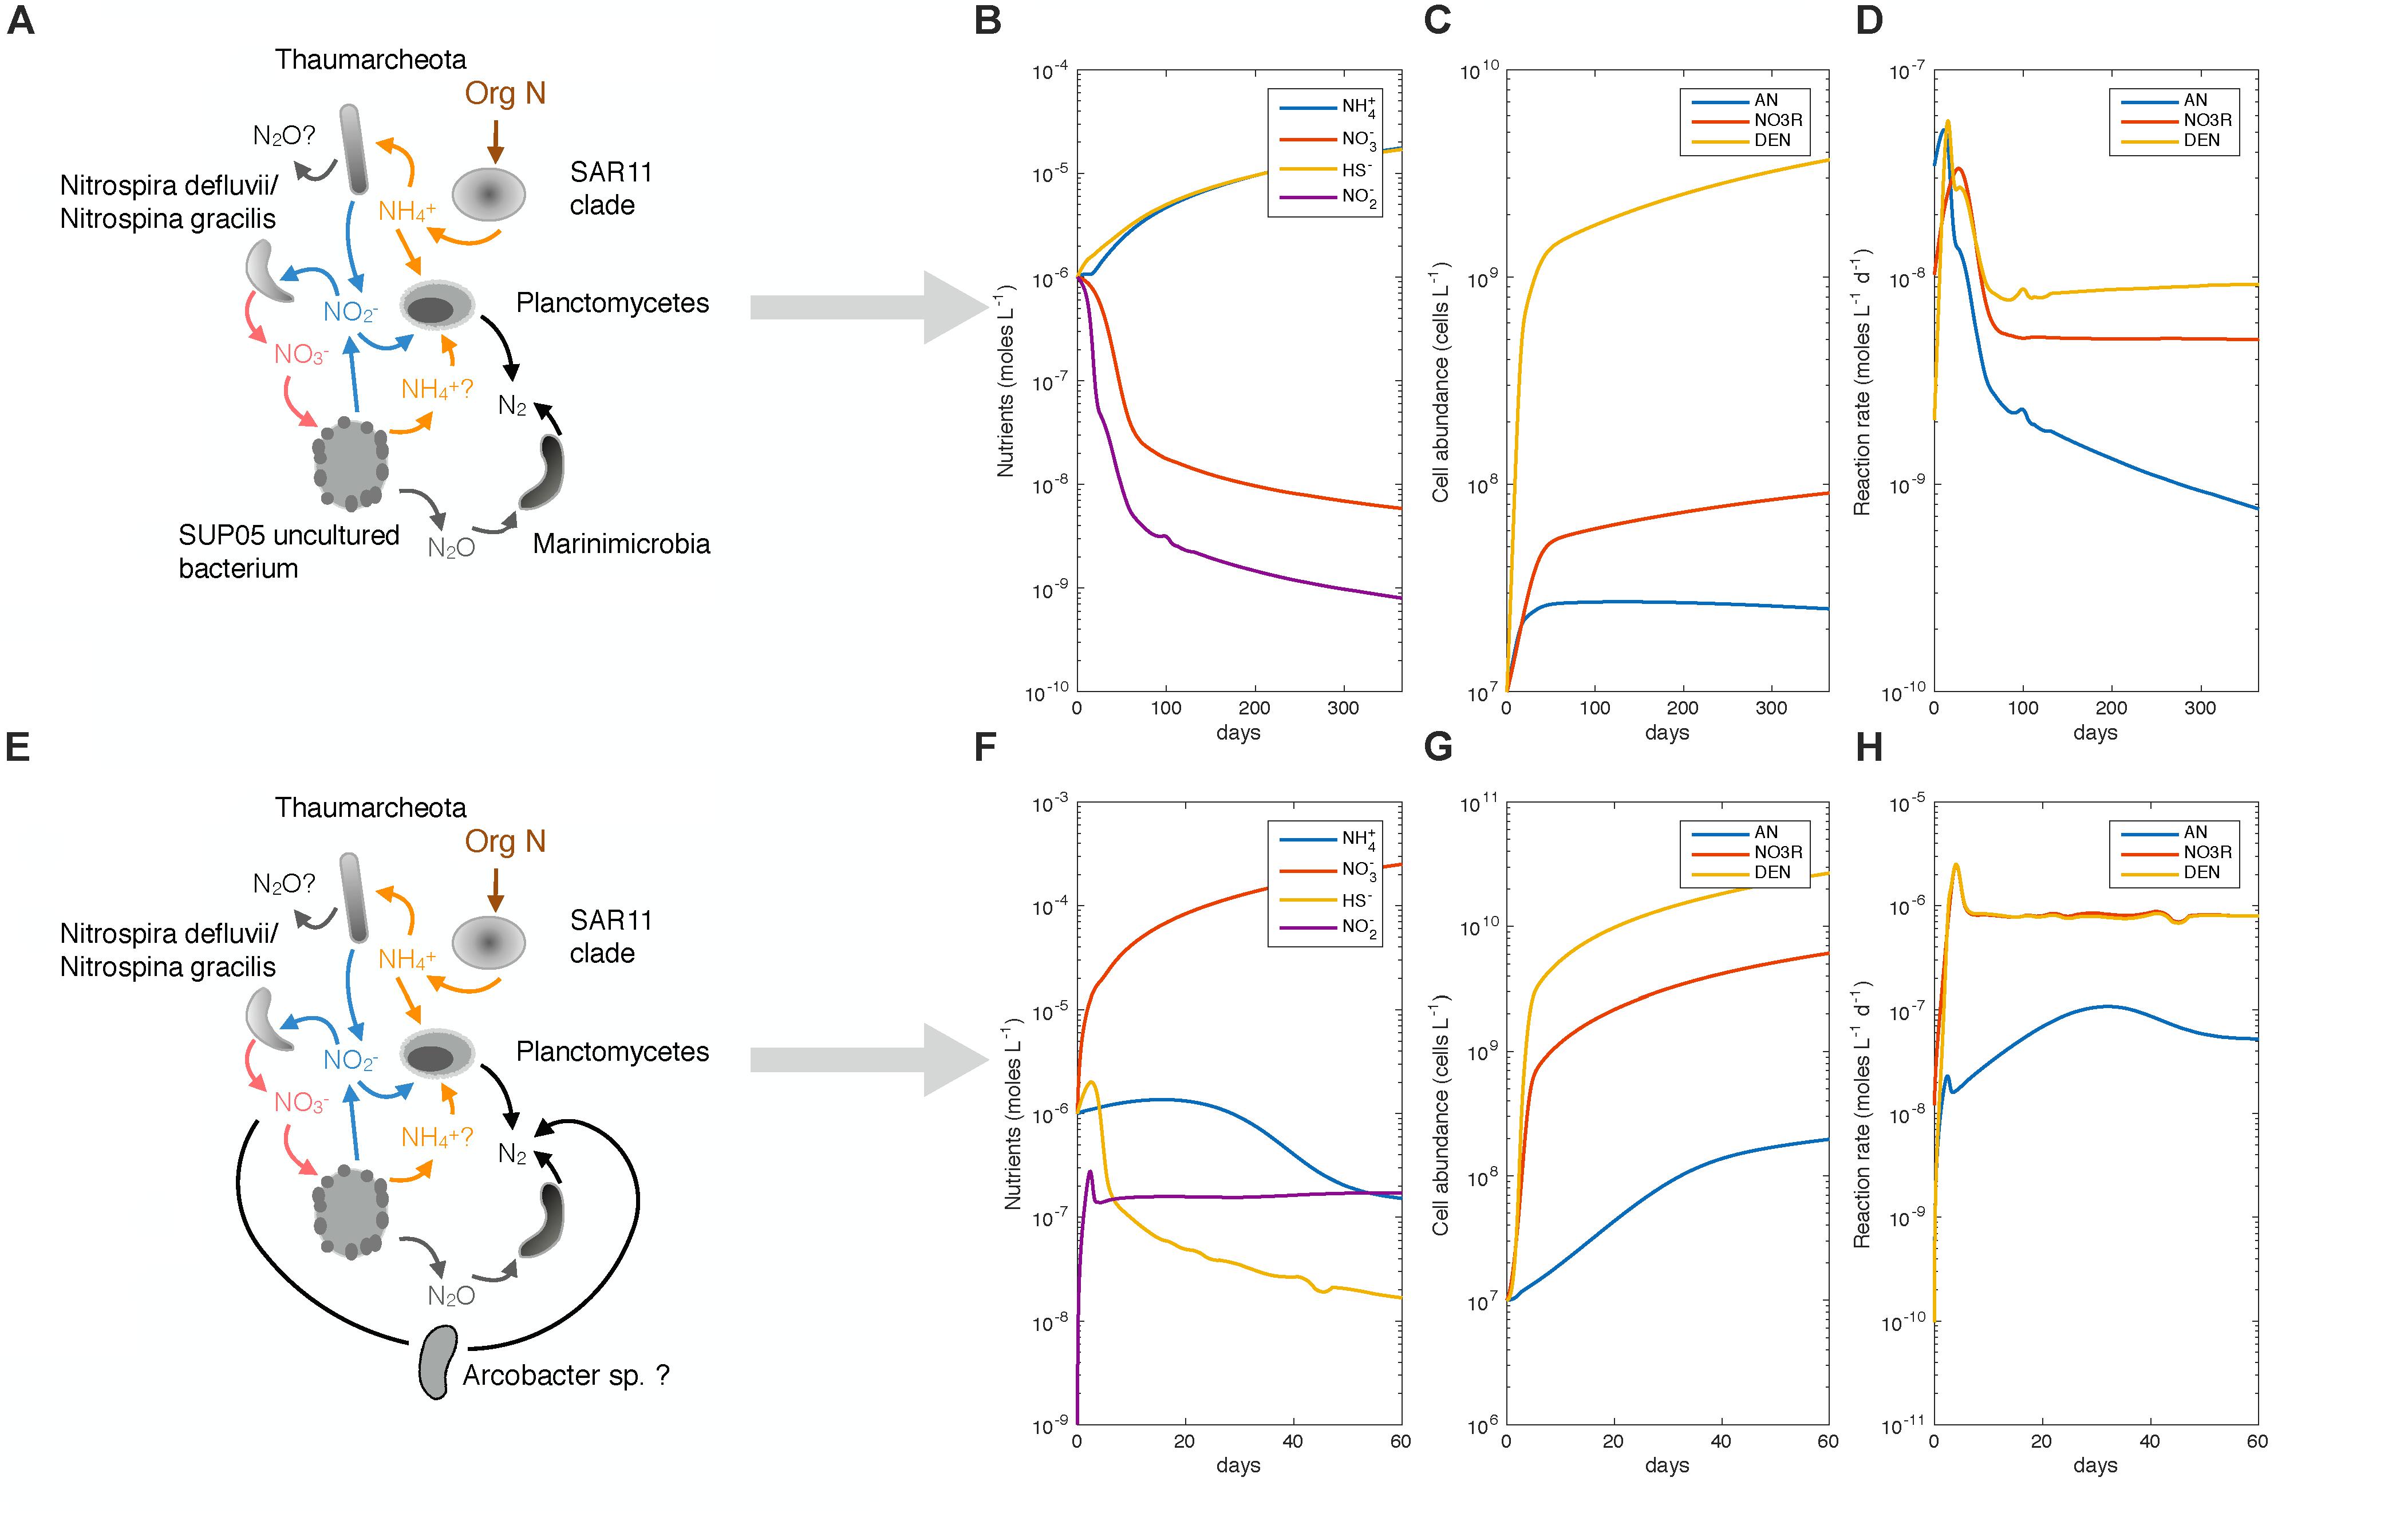
Figure 12. Model of NO2− competition between anammox and complete denitrification for the 2 ecotypes found in SI, “stagnation phenotype” and “renewal phenotype”. (A) Represents the ecotype found in SI during stagnant periods of time. (B–D) Shows a simulation of the model that tested to see if the phenotype of the ecotype could be reproduced through modeling. Parameters used to model this simulation can be found in Table 3. (E) Represents the second ecotype found in SI during renewal event, leading to higher N2 production (F–H) shows that the model reproduced higher rates of N2 production. Parameters used in this simulation can be found in Table 3.
The stagnation phenotype represents the background state and characterizes the inlet throughout most of the year, with limited input of NO3− and higher fluxes of NH4+ and HS− coming from the sediments underlying the anoxic water. To mimic this situation, we thus chose lower input flux of NO3− in comparison to NH4+ and HS− (Figure 12 and Table 3). Kinetic parameters (km and Vmax) for anammox bacteria were taken from the literature (Awata et al., 2013). Kinetic parameters measured for denitrification in SI were determined during the renewal phenotype (August 2015, 165 m) and therefore, the stagnation phenotype kinetic parameters remained unconstrained. Thus, kinetic parameters for the SUP05/Marinimicrobia consortium (or stagnation ecotype) were fit to yield rates of the same order of magnitude for denitrification as those measured in SI during stagnation (Figures 12A–D, Table 3, and Supplementary Material). However, cell-specific growth rates (Vmax) and growth yield (Y) were estimated based on rates of denitrification and cell abundance (see above). With nutrient fluxes appropriate for the stagnation period and reasonable physiological parameters for the relevant organisms, we find that rates of both denitrification and anammox are similar, and fall within the range observed in SI outside of a renewal period (Figures 3, 12A–D). The dominance of one pathway over another could be inverted by changing the relative Km values for denitrification and anammox, as these appear to be similar to one another in the stagnation period (see Supplementary Material). Modeled abundances of anammox bacteria were similar to those observed in SI (2.3 × 10⁷ anammox cells L−1) as were the modeled abundances of complete denitrifiers compared to abundances observed in SI (cell abundance of Marinimicrobia/SUP05 = 109 cells L−1). Therefore, we could reproduce with a simple flux balance model rates of the same order of magnitude for anammox and complete denitrification measured during the year 2015 during peak stratification in SI.
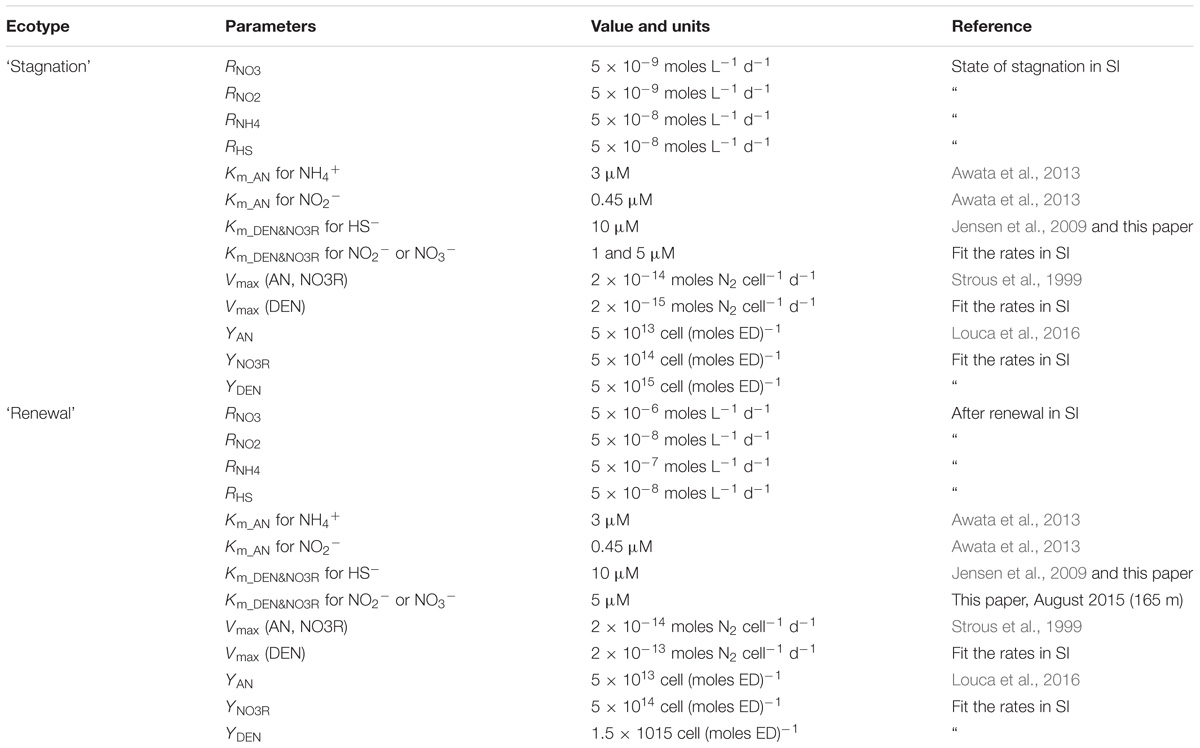
Table 3. Parameters used in model for competition of NO2− between anammox and complete denitrification (see Figure 12).
Deep water renewal in SI introduces oxygenated water to the deep basin, where NO3− is produced through rapid nitrification, and the NO3− produced is in turn lost through anaerobic NO3− reduction and N2 production following renewal. The renewal event is thus far from steady-state, and we therefore tried to reproduce the high rates of denitrification in 60 days of the simulation, corresponding to the approximate duration of the event based on the geochemical profiles and rate measurements. The kinetic parameters for anammox were identical to simulations of the stagnation phenotype, however, we changed the kinetic parameters for denitrification to represent Arcobacter in the renewal phenotype. As NO3− dependency was measured in August 2015, corresponding to higher rates of N2 production, we chose to use the Michaelis–Menten constants modeled from this data to describe complete denitrification (NO3− to N2) (Tables 2, 3). We also chose a higher biomass yield than in the ‘stagnation’ phenotype (Table 3), as it appears that the Arcobacter population grows rapidly from <1% to 30% of relative abundance within a month’s time (Table 3). The simulation reveals that under the conditions described here (Figures 12E–H and Table 3), rates of denitrification reach 10−6 N2 M d−1, which corresponds to the highest rates measured in July 2015 at 200 m (Figure 3). Rates of anammox remain similar to the rates that can be found after renewal in SI (Figures 3, 12E–H). The abundance of complete denitrifiers reaches 109 cells L−1 after only 15 days of simulation, which is again similar to abundances observed in SI during renewal. However, to fully describe and model the input fluxes to SI, the model would need to have dynamic fluxes that can be changed over time. In addition to dynamic fluxes, competition between two different populations of complete denitrifiers should be implemented to fully describe and reconstruct the transition from one phenotype to the other.
SI as a Model Ecosystem for Coastal OMZs
We have extrapolated the annual N-loss calculated for SI (33 km2) to all similar coastal inlets in BC (2478 km2) in order to estimate the potential importance of BC coastal fjords to N-loss from the North Eastern Sub-Arctic Pacific Ocean. We estimate that these inlets could contribute up to 0.12 Tg N yr−1, which constitutes 0.1% to global pelagic N-loss (Codispoti, 2007) if they are all anoxic and similar to SI. On an area-specific basis this is extremely high in comparison to the ETSP, for example, which has a surface area of 1.2 × 10⁶ km2 and supports up to 10 Tg N yr−1 (Kalvelage et al., 2013). This highlights that coastal OMZs are hotspots for N-loss and could also, in the near future, be subject to changes due to increased anthropogenic influence.
The low oxygen conditions in SI support pelagic anaerobic microbial metabolisms including denitrification and anammox that co-occur and underpin high rates of N-loss from the water column. We showed that denitrification is the most important contributor to N2 production and its rates and the organisms responsible vary seasonally. Rates of anammox, in contrast, are relatively constant throughout the year, contributing 37% of the N-loss from SI. Anammox is often reported as the primary pathway of N-loss from OMZs (Kuypers et al., 2005; Thamdrup et al., 2006; Hamersley et al., 2007; Lam et al., 2009; Canfield et al., 2010b; Jensen et al., 2011; Kalvelage et al., 2013; De Brabandere et al., 2014), and our time-series observations from SI may be more broadly extensible to low oxygen marine waters globally. In SI, rates and pathways of N-loss and the responsible microbial taxa are dynamic responding to substrate fluxes driven by physical forcing. Analogous dynamics in upwelling and horizontal transport or large-scale eddies in open ocean OMZs may also lead to strong microbial responses with corresponding biogeochemical outcomes (Altabet et al., 2012; Bourbonnais et al., 2015). While sulphidic conditions that characterize SI are rare in modern open ocean OMZs, they could become more prevalent with progressive ocean deoxygenation (Ulloa et al., 2012; Callbeck et al., 2018). Information on microbial responses to system dynamics and on the ecophysiology the underpins coupled C, N, and S cycling in Saanich Inlet and other experimentally tractable coastal ecosystems is key for predicting broader global responses to ocean deoxygenation and the expansion of marine anoxia.
Data Availability
The datasets generated for this study can be found in the JGI – database (https://genome.jgi.doe.gov/portal/), Project ID: 1175277.
Author Contributions
CM and SC designed the experiments, analyzed the data, and wrote the manuscript. CM performed the experiments. SH provided help in the design of the experiments and provided editorial support. JS, JH, and RS participated in the analysis of part of the data. DV and KG provided data regarding the chlorophyll a concentration.
Funding
This work was supported by the Natural Sciences and Engineering Research Council (NSERC) discovery grant 04867. Sequencing was performed at the DOE Joint Genome Institute under the CSP Program. The sequencing work was conducted in part by the United States Department of Energy Joint Genome Institute.
Conflict of Interest Statement
The authors declare that the research was conducted in the absence of any commercial or financial relationships that could be construed as a potential conflict of interest.
Acknowledgments
We would like to thank all the people involved in the sampling and processing of samples for Saanich Inlet during the year 2015: the crew of the MSV Strickland, Chris Payne and Lora Pakhomova, Andreas Mueller, Melanie Scoffield, Jade Shiller, Diane Fairley, Sam Kheirandish, Alyse Hawley, Monica Torres-Beltran, Kohen Bauer, Kate Thompson, Andrew Hefford, Annie Cheng, Belle Cheng, and all of those who made the sampling easier by helping out before and after Saanich days.
Supplementary Material
The Supplementary Material for this article can be found online at: https://www.frontiersin.org/articles/10.3389/fmars.2019.00027/full#supplementary-material
Footnotes
- ^ https://jgi.doe.gov/wp-content/uploads/2016/06/DOE-JGI-iTagger-methods.pdf
- ^ https://bitbucket.org/berkeleylab/jgi_itagger/
- ^ https://jgi.doe.gov/wp-content/uploads/2016/06/DOE-JGI-iTagger-methods.pdf
- ^ https://uc-r.github.io/hc_clustering
References
Altabet, M. A., Ryabenko, E., Stramma, L., Wallace, D. W. R., Frank, M., Grasse, P., et al. (2012). An eddy-stimulated hotspot for fixed nitrogen-loss from the Peru oxygen minimum zone. Biogeosciences 9, 4897–4908. doi: 110.5194/bg-9-4897-2012
Anantharaman, K., Breier, J. A., Sheik, C. S., and Dick, G. J. (2013). Evidence for hydrogen oxidation and metabolic plasticity in widespread deep-sea sulfur-oxidizing bacteria. Proc. Natl. Acad. Sci. U.S.A. 110, 330–335. doi: 10.1073/pnas.1215340110
Anderson, J. J., and Devol, A. H. (1973). Deep water renewal in Saanich Inlet, an intermittently anoxic basin. Estuar. Coast. Mar. Sci. 1, 1–10. doi: 10.1016/0302-3524(73)90052-2
Awata, T., Oshiki, M., Kindaichi, T., Ozaki, N., Ohashi, A., and Okabe, S. (2013). Physiological characterization of an anaerobic ammonium-oxidizing bacterium belonging to the “Candidatus Scalindua” group. Appl. Environ. Microbiol. 79, 4145–4148. doi: 10.1128/Aem.00056-13
Babbin, A. R., Keil, R. G., Devol, A. H., and Ward, B. B. (2014). Organic matter stoichiometry, flux, and oxygen control nitrogen loss in the ocean. Science 344, 406–408. doi: 10.1126/science.1248364
Bergauer, K., Fernandez-Guerra, A., Garcia, J. A. L., Sprenger, R. R., Stepanauskas, R., Pachiadaki, M. G., et al. (2018). Organic matter processing by microbial communities throughout the Atlantic water column as revealed by metaproteomics. Proc. Natl. Acad. Sci. U.S.A. 115, E400–E408. doi: 10.1073/pnas.1708779115
Bonaglia, S., Klawonn, I., De Brabandere, L., Deutsch, B., Thamdrup, B., and Bruchert, V. (2016). Denitrification and DNRA at the Baltic Sea oxic-anoxic interface: substrate spectrum and kinetics. Limnol. Oceanogr. 61, 1900–1915. doi: 10.1002/lno.10343
Bourbonnais, A., Altabet, M. A., Charoenpong, C. N., Larkum, J., Hu, H., Bange, H. W., et al. (2015). N-loss isotope effects in the Peru oxygen minimum zone studied using a mesoscale eddy as a natural tracer experiment. Glob. Biogeochem. Cycles 29, 793–811. doi: 10.1002/2014GB005001
Bourbonnais, A., Lehmann, M. F., Hamme, R. C., Manning, C. C., and Juniper, S. K. (2013). Nitrate elimination and regeneration as evidenced by dissolved inorganic nitrogen isotopes in Saanich Inlet, a seasonally anoxic fjord. Mar. Chem. 157, 194–207. doi: 10.1016/j.marchem.2013.09.006
Braman, R. S., and Hendrix, S. A. (1989). Nanogram nitrite and nitrate determination in environmental and biological materials by vanadium(III) reduction with chemiluminescence detection. Anal. Chem. 61, 2715–2718. doi: 10.1021/ac00199a007
Breitburg, D., Levin, L. A., Oschlies, A., Grégoire, M., Chavez, F. P., Conley, D. J., et al. (2018). Declining oxygen in the global ocean and coastal waters. Science 359:eaam7240. doi: 10.1126/science.aam7240
Bulow, S. E., Rich, J. J., Naik, H. S., Pratihary, A. K., and Ward, B. B. (2010). Denitrification exceeds anammox as a nitrogen loss pathway in the Arabian Sea oxygen minimum zone. Deep Sea Res. Part I Oceanogr. Res. Pap. 57, 384–393. doi: 10.1016/j.dsr.2009.10.014
Callbeck, C. M., Lavik, G., Ferdelman, T. G., Fuchs, B., Gruber-Vodicka, H. R., Hach, P. F., et al. (2018). Oxygen minimum zone cryptic sulfur cycling sustained by offshore transport of key sulfur oxidizing bacteria. Nat. Commun. 9:1729. doi: 10.1038/s41467-018-04041-x
Canfield, D. E., Glazer, A. N., and Falkowski, P. G. (2010a). The evolution and future of Earth’s nitrogen cycle. Science 330, 192–196. doi: 10.1126/science.1186120
Canfield, D. E., Stewart, F. J., Thamdrup, B., De Brabandere, L., Dalsgaard, T., Delong, E. F., et al. (2010b). A cryptic sulfur cycle in oxygen-minimum-zone waters off the Chilean coast. Science 330, 1375–1378. doi: 10.1126/science.1196889
Canion, A., Prakash, O., Green, S. J., Jahnke, L., Kuypers, M. M. M., and Kostka, J. E. (2013). Isolation and physiological characterization of psychrophilic denitrifying bacteria from permanently cold Arctic fjord sediments (Svalbard, Norway). Environ. Microbiol. 15, 1606–1618. doi: 10.1111/1462-2920.12110
Capone, D. G. (2001). Marine nitrogen fixation: what’s the fuss? Curr. Opin. Microbiol. 4, 341–348. doi: 10.1016/S1369-5274(00)00215-0
Caporaso, J. G., Kuczynski, J., Stombaugh, J., Bittinger, K., Bushman, F. D., Costello, E. K., et al. (2010). QIIME allows analysis of high-throughput community sequencing data. Nat. Methods 7, 335–336. doi: 10.1038/nmeth.f.303
Christensen, S., and Tiedje, J. M. (1988). Sub-parts-per-billion nitrate method: use of an N(2)O-producing denitrifier to convert NO(3) or NO(3) to N(2)O. Appl. Environ. Microbiol. 54, 1409–1413.
Codispoti, L. A. (2007). An oceanic fixed nitrogen sink exceeding 400 Tg Na-1 vs the concept of homeostasis in the fixed-nitrogen inventory. Biogeosciences 4, 233–253.
Codispoti, L. A., Brandes, J. A., Christensen, J. P., Devol, A. H., Naqvi, S. W. A., Paerl, H. W., et al. (2001). The oceanic fixed nitrogen and nitrous oxide budgets: moving targets as we enter the anthropocene? Sci. Mar. 65, 85–105.
Dalsgaard, T., Canfield, D. E., Petersen, J., Thamdrup, B., and Acuna-Gonzalez, J. (2003). N2 production by the anammox reaction in the anoxic water column of Golfo Dulce, Costa Rica. Nature 422, 606–608. doi: 10.1038/nature01526
Dalsgaard, T., and Thamdrup, B. (2002). Factors controlling anaerobic ammonium oxidation with nitrite in marine sediments. Appl. Environ. Microbiol. 68,3802–3808.
Dalsgaard, T., Thamdrup, B., Farias, L., and Revsbech, N. P. (2012). Anammox and denitrification in the oxygen minimum zone of the eastern South Pacific. Limnol. Oceanogr. 57, 1331–1346. doi: 10.4319/lo.2012.57.5.1331
De Brabandere, L., Canfield, D. E., Dalsgaard, T., Friederich, G. E., Revsbech, N. P., Ulloa, O., et al. (2014). Vertical partitioning of nitrogen-loss processes across the oxic-anoxic interface of an oceanic oxygen minimum zone. Environ. Microbiol. 16, 3041–3054. doi: 10.1111/1462-2920.12255
De Brabandere, L., Thamdrup, B., Revsbech, N. P., and Foadi, R. (2012). A critical assessment of the occurrence and extend of oxygen contamination during anaerobic incubations utilizing commercially available vials. J. Microbiol. Methods 88, 147–154. doi: 10.1016/j.mimet.2011.11.001
Devol, A. H., Anderson, J. J., Kuivila, K., and Murray, J. W. (1984). A model for coupled sulfate reduction and methane oxidation in the sediments of Saanich inlet. Geochim. Cosmochim. Acta 48, 993–1004. doi: 10.1016/0016-7037(84)90191-1
Edgar, R. C., Haas, B. J., Clemente, J. C., Quince, C., and Knight, R. (2011). UCHIME improves sensitivity and speed of chimera detection. Bioinformatics 27, 2194–2200. doi: 10.1093/bioinformatics/btr381
Engstrom, P., Dalsgaard, T., Hulth, S., and Aller, R. C. (2005). Anaerobic ammonium oxidation by nitrite (anammox): implications for N-2 production in coastal marine sediments. Geochim. Cosmochim. Acta 69, 2057–2065. doi: 10.1016/j.gca.2004.09.032
Falkowski, P. G. (1997). Evolution of the nitrogen cycle and its influence on the biological sequestration of CO2 in the ocean. Nature 387, 272–275. doi: 10.1038/387272a0
Falkowski, P. G., Fenchel, T., and Delong, E. F. (2008). The microbial engines that drive Earth’s biogeochemical cycles. Science 320, 1034–1039. doi: 10.1126/science.1153213
Fowler, D., Coyle, M., Skiba, U., Sutton, M. A., Cape, J. N., Reis, S., et al. (2013). The global nitrogen cycle in the twenty-first century. Philos. Trans. R. Soc. B Biol. Sci. 368:20130165.
Ganesh, S., Parris, D. J., DeLong, E. F., and Stewart, F. J. (2014). Metagenomic analysis of size-fractionated picoplankton in a marine oxygen minimum zone. ISME J. 8, 187–211. doi: 10.1038/ismej.2013.144
Glaubitz, S., Kießlich, K., Meeske, C., Labrenz, M., and Jürgens, K. (2013). SUP05 dominates the gammaproteobacterial sulfur oxidizer assemblages in pelagic redoxclines of the central baltic and black seas. Appl. Environ. Microbiol. 79, 2767–2776. doi: 10.1128/aem.03777-12
Grasshoff, K., Ehrhardt, M., Kremling, K., and Anderson, L. G. (1999). Methods of Seawater Analysis. New York, NY: Wiley-VCH.
Gruber, N. (2004). “The dynamics of the marine nitrogen cycle and its influence on atmospheric CO2 variations,” in The Ocean Carbon Cycle and Climate, eds M. Follows and T. Oguz (Dordrecht: Kluwer Academic), 97–148.
Grundle, D. S., Timothy, D. A., and Varela, D. E. (2009). Variations of phytoplankton productivity and biomass over an annual cycle in Saanich Inlet, a British Columbia fjord. Cont. Shelf Res. 29, 2257–2269. doi: 10.1016/j.csr.2009.08.013
Hamersley, M. R., Lavik, G., Woebken, D., Rattray, J. E., Lam, P., Hopmans, E. C., et al. (2007). Anaerobic ammonium oxidation in the Peruvian oxygen minimum zone. Limnol. Oceanogr. 52, 923–933. doi: 10.4319/lo.2007.52.3.0923
Hawley, A. K., Brewer, H. M., Norbeck, A. D., Pasa-Tolic, L., and Hallam, S. J. (2014). Metaproteomics reveals differential modes of metabolic coupling among ubiquitous oxygen minimum zone microbes. Proc. Natl. Acad. Sci. U.S.A. 111, 11395–11400. doi: 10.1073/pnas.1322132111
Hawley, A. K., Nobu, M. K., Wright, J. J., Durno, W. E., Morgan-Lang, C., Sage, B., et al. (2017a). Diverse Marinimicrobia bacteria may mediate coupled biogeochemical cycles along eco-thermodynamic gradients. Nat. Commun. 8:1507. doi: 10.1038/s41467-017-01376-9
Hawley, A. K., Torres-Beltrán, M., Zaikova, E., Walsh, D. A., Mueller, A., Scofield, M., et al. (2017b). A compendium of multi-omic sequence information from the Saanich Inlet water column. Sci. Data 4:170160. doi: 10.1038/sdata.2017.160
İnceoğlu, Ö., Llirós, M., García-Armisen, T., Crowe, S. A., Michiels, C., Darchambeau, F., et al. (2015). Distribution of bacteria and Archaea in meromictic tropical lake Kivu (Africa). Aquat. Microb. Ecol. 74, 215–233.
Jensen, M. M., Kuypers, M. M. M., Gaute, L., and Thamdrup, B. (2008). Rates and regulation of anaerobic ammonium oxidation and denitrification in the Black Sea. Limnol. Oceanogr. 53, 23–36. doi: 10.4319/lo.2008.53.1.0023
Jensen, M. M., Lam, P., Revsbech, N. P., Nagel, B., Gaye, B., Jetten, M. S. M., et al. (2011). Intensive nitrogen loss over the Omani Shelf due to anammox coupled with dissimilatory nitrite reduction to ammonium. ISME J. 5, 1660–1670. doi: 10.1038/ismej.2011.44
Jensen, M. M., Petersen, J., Dalsgaard, T., and Thamdrup, B. (2009). Pathways, rates, and regulation of N-2 production in the chemocline of an anoxic basin, Mariager Fjord, Denmark. Mar. Chem. 113, 102–113. doi: 10.1016/j.marchem.2009.01.002
Kalvelage, T., Lavik, G., Lam, P., Contreras, S., Arteaga, L., Loscher, C. R., et al. (2013). Nitrogen cycling driven by organic matter export in the South Pacific oxygen minimum zone. Nat. Geosci. 6, 228–234. doi: 10.1038/Ngeo1739
Keeling, R. F., Kortzinger, A., and Gruber, N. (2010). Ocean deoxygenation in a warming world. Annu. Rev. Mar. Sci. 2, 199–229. doi: 10.1146/annurev.marine.010908.163855
Knap, A. H., Michaels, A., Close, A. R., Ducklow, H., and Dickson, A. G. (1996). Protocols for the Joint Global Ocean Flux Study (JGOFS) Core Measurements. Paris: UNESCO.
Koeve, W., and Kähler, P. (2010). Heterotrophic denitrification vs. autotrophic anammox – quantifying collateral effects on the oceanic carbon cycle. Biogeosciences 7, 2327–2337. doi: 10.5194/bg-7-2327-2010
Kopylova, E., Navas-Molina, J. A., Mercier, C., Xu, Z. Z., Mahe, F., He, Y., et al. (2016). Open-source sequence clustering methods improve the state of the art. mSystems 1:e00003-15. doi: 10.1128/mSystems.00003-15
Kuypers, M. M. M., Lavik, G., Woebken, D., Schmid, M., Fuchs, B. M., Amann, R., et al. (2005). Massive nitrogen loss from the Benguela upwelling system through anaerobic ammonium oxidation. Proc. Natl. Acad. Sci. U.S.A. 102, 6478–6483. doi: 10.1073/pnas.0502088102
Lam, P., Lavik, G., Jensen, M. M., van de Vossenberg, J., Schmid, M., Woebken, D., et al. (2009). Revising the nitrogen cycle in the Peruvian oxygen minimum zone. Proc. Natl. Acad. Sci. U.S.A. 106, 4752–4757. doi: 10.1073/Pnas.0812444106
Louca, S., Hawley, A. K., Katsev, S., Torres-Beltran, M., Bhatia, M. P., Kheirandish, S., et al. (2016). Integrating biogeochemistry with multiomic sequence information in a model oxygen minimum zone. Proc. Natl. Acad. Sci. U.S.A. 113, E5925–E5933. doi: 10.1073/pnas.1602897113
Manning, C. C., Hamme, R. C., and Bourbonnais, A. (2010). Impact of deep-water renewal events on fixed nitrogen loss from seasonally-anoxic Saanich Inlet. Mar. Chem. 122, 1–10. doi: 10.1016/j.marchem.2010.08.002
Michiels, C. C., Darchambeau, F., Roland, F. A. E., Morana, C., Lliros, M., Garcia-Armisen, T., et al. (2017). Iron-dependent nitrogen cycling in a ferruginous lake and the nutrient status of Proterozoic oceans. Nat. Geosci. 10, 217–221. doi: 10.1038/Ngeo2886
Mucci, A., Sundby, B., Gehlen, M., Arakaki, T., Zhong, S., and Silverberg, N. (2000). The fate of carbon in continental shelf sediments of eastern Canada: a case study. Deep Sea Res. Part II Top. Stud. Oceanogr. 47, 733–760. doi: 10.1016/S0967-0645(99)00124-1
Murray, R. E., Parsons, L. L., and Smith, M. S. (1989). Kinetics of nitrate utilization by mixed populations of denitrifying bacteria. Appl. Environ. Microbiol. 55, 717–721.
Nicholls, J. C., and Trimmer, M. (2009). Widespread occurrence of the anammox reaction in estuarine sediments. Aquat. Microb. Ecol. 55, 105–113. doi: 10.3354/ame01285
Parsonage, D., Greenfield, A. J., and Ferguson, S. J. (1985). The high affinity of Paracoccus denitrificans cells for nitrate as an electron acceptor. Analysis of possible mechanisms of nitrate and nitrite movement across the plasma membrane and the basis for inhibition by added nitrite of oxidase activity in permeabilised cells. Biochim. Biophys. Acta 807, 81–95. doi: 10.1016/0005-2728(85)90055-6
Parsons, T. R., Maita, Y., and Lalli, C. M. (eds). (1984). “4.3 - fluorometric determination of chlorophylls,” in A Manual of Chemical & Biological Methods for Seawater Analysis, (Amsterdam: Pergamon), 107–109.
Paulmier, A., and Ruiz-Pino, D. (2009). Oxygen minimum zones (OMZs) in the modern ocean. Prog. Oceanogr. 80, 113–128. doi: 10.1016/j.pocean.2008.08.001
Prokopenko, M. G., Hirst, M. B., De Brabandere, L., Lawrence, D. J., Berelson, W. M., Granger, J., et al. (2013). Nitrogen losses in anoxic marine sediments driven by Thioploca-anammox bacterial consortia. Nature 500, 194–198. doi: 10.1038/nature12365
Quast, C., Pruesse, E., Yilmaz, P., Gerken, J., Schweer, T., Yarza, P., et al. (2013). The SILVA ribosomal RNA gene database project: improved data processing and web-based tools. Nucleic Acids Res. 41, D590–D596. doi: 10.1093/nar/gks1219
Rich, J. J., Dale, O. R., Song, B., and Ward, B. B. (2008). Anaerobic ammonium oxidation (anammox) in Chesapeake Bay sediments. Microb. Ecol. 55, 311–320. doi: 10.1007/s00248-007-9277-3
Roberts, K. L., Kessler, A. J., Grace, M. R., and Cook, P. L. M. (2014). Increased rates of dissimilatory nitrate reduction to ammonium (DNRA) under oxic conditions in a periodically hypoxic estuary. Geochim. Cosmochim. Acta 133, 313–324.
Robertson, E. K., Roberts, K. L., Burdorf, L. D. W., Cook, P., and Thamdrup, B. (2016). Dissimilatory nitrate reduction to ammonium coupled to Fe(II) oxidation in sediments of a periodically hypoxic estuary. Limnol. Oceanogr. 61, 365–381. doi: 10.1002/lno.10220
Robertson, E. K., and Thamdrup, B. (2017). The fate of nitrogen is linked to iron(II) availability in a freshwater lake sediment. Geochim. Cosmochim. Acta 205, 84–99. doi: 10.1016/j.gca.2017.02.014
Sancetta, C., and Calvert, S. E. (1988). The annual cycle of sedimentation in Saanich inlet, British-Columbia - implications for the interpretation of diatom fossil assemblages. Deep Sea Res. Part A Oceanogr. Res. Pap. 35, 71–90. doi: 10.1016/0198-0149(88)90058-1
Schmidtko, S., Stramma, L., and Visbeck, M. (2017). Decline in global oceanic oxygen content during the past five decades. Nature 542, 335–339. doi: 10.1038/nature21399
Shah, V., Chang, B. X., and Morris, R. M. (2017). Cultivation of a chemoautotroph from the SUP05 clade of marine bacteria that produces nitrite and consumes ammonium. ISME J. 11, 263–271. doi: 10.1038/ismej.2016.87
Stevens, H., and Ulloa, O. (2008). Bacterial diversity in the oxygen minimum zone of the eastern tropical South Pacific. Environ. Microbiol. 10, 1244–1259. doi: 10.1111/j.1462-2920.2007.01539.x
Strous, M., Fuerst, J. A., Kramer, E. H. M., Logemann, S., Muyzer, G., van de Pas-Schoonen, K. T., et al. (1999). Missing lithotroph identified as new planctomycete. Nature 400, 446–449.
Takahashi, M., Seibert, D. L., and Thomas, W. H. (1977). Occasional blooms of phytoplankton during summer in Saanich Inlet, Bc, Canada. Deep Sea Res. 24, 775–780. doi: 10.1016/0146-6291(77)90499-4
Thamdrup, B., and Dalsgaard, T. (2000). The fate of ammonium in anoxic manganese oxide-rich marine sediment. Geochim. Cosmochim. Acta 64,4157–4164. doi: 10.1016/S0016-7037(00)00496-8
Thamdrup, B., and Dalsgaard, T. (2002). Production of N(2) through anaerobic ammonium oxidation coupled to nitrate reduction in marine sediments. Appl. Environ. Microbiol. 68, 1312–1318.
Thamdrup, B., Dalsgaard, T., Jensen, M. M., Ulloa, O., Farías, L., and Escribano, R. (2006). Anaerobic ammonium oxidation in the oxygen-deficient waters off northern Chile. Limnol. Oceanogr. 51, 2145–2156. doi: 10.4319/lo.2006.51.5.2145
Torres-Beltrán, M., Hawley, A. K., Capelle, D., Zaikova, E., Walsh, D. A., Mueller, A., et al. (2017). A compendium of geochemical information from the Saanich Inlet water column. Sci. Data 4:170159. doi: 10.1038/sdata.2017.159
Trimmer, M., and Nicholls, J. C. (2009). Production of nitrogen gas via anammox and denitrification in intact sediment cores along a continental shelf to slope transect in the North Atlantic. Limnol. Oceanogr. 54, 577–589. doi: 10.4319/Lo.2009.54.2.0577
Ulloa, O., Canfield, D. E., DeLong, E. F., Letelier, R. M., and Stewart, F. J. (2012). Microbial oceanography of anoxic oxygen minimum zones. Proc. Natl. Acad. Sci. U.S.A. 109, 15996–16003. doi: 10.1073/pnas.1205009109
Van Mooy, B. A. S., Keil, R. G., and Devol, A. H. (2002). Impact of suboxia on sinking particulate organic carbon: enhanced carbon flux and preferential degradation of amino acids via denitrification. Geochim. Cosmochim. Acta 66, 457–465. doi: 10.1016/S0016-7037(01)00787-6
Voss, M., Bange, H. W., Dippner, J. W., Middelburg, J. J., Montoya, J. P., and Ward, B. (2013). The marine nitrogen cycle: recent discoveries, uncertainties and the potential relevance of climate change. Philos. Trans. R. Soc. Lond. B Biol. Sci. 368:20130121. doi: 10.1098/rstb.2013.0121
Walsh, D. A., Zaikova, E., Howes, C. G., Song, Y. C., Wright, J. J., Tringe, S. G., et al. (2009). Metagenome of a versatile chemolithoautotroph from expanding oceanic dead zones. Science 326, 578–582. doi: 10.1126/science.1175309
Walters, W., Hyde, E. R., Berg-Lyons, D., Ackermann, G., Humphrey, G., Parada, A., et al. (2016). Improved bacterial 16S rRNA gene (V4 and V4-5) and fungal internal transcribed spacer marker gene primers for microbial community surveys. mSystems 1:e00009-15. doi: 10.1128/mSystems.00009-15
Ward, B. B., Devol, A. H., Rich, J. J., Chang, B. X., Bulow, S. E., Naik, H., et al. (2009). Denitrification as the dominant nitrogen loss process in the Arabian Sea. Nature 461, 78–81. doi: 10.1038/nature08276
Wenk, C. B., Blees, J., Zopfi, J., Veronesi, M., Bourbonnais, A., Schubert, C. J., et al. (2013). Anaerobic ammonium oxidation (anammox) bacteria and sulfide-dependent denitrifiers coexist in the water column of a meromictic south-alpine lake. Limnol. Oceanogr. 58, 1–12. doi: 10.4319/lo.2013.58.1.0001
Wirsen, C. O., Sievert, S. M., Cavanaugh, C. M., Molyneaux, S. J., Ahmad, A., Taylor, L. T., et al. (2002). Characterization of an autotrophic sulfide-oxidizing marine Arcobacter sp. That produces filamentous sulfur. Appl. Environ. Microbiol. 68, 316–325. doi: 10.1128/aem.68.1.316-325.2002
Wright, J., Lee, S., Zaikova, E., Walsh, D. A., and Hallam, S. (2009). DNA extraction from 0.22 μM sterivex filters and cesium chloride density gradient centrifugation. J. Vis. Exp. 31:1352.
Wright, J. J., Konwar, K. M., and Hallam, S. J. (2012). Microbial ecology of expanding oxygen minimum zones. Nat. Rev. Microbiol. 10, 381–394. doi: 10.1038/nrmicro2778
Keywords: anammox, denitrification, N2 production, sulphidic, anoxia
Citation: Michiels CC, Huggins JA, Giesbrecht KE, Spence JS, Simister RL, Varela DE, Hallam SJ and Crowe SA (2019) Rates and Pathways of N2 Production in a Persistently Anoxic Fjord: Saanich Inlet, British Columbia. Front. Mar. Sci. 6:27. doi: 10.3389/fmars.2019.00027
Received: 05 October 2018; Accepted: 21 January 2019;
Published: 21 February 2019.
Edited by:
Perran Cook, Monash University, AustraliaReviewed by:
Arvind Singh, Physical Research Laboratory, IndiaAnnie Bourbonnais, University of South Carolina, United States
Copyright © 2019 Michiels, Huggins, Giesbrecht, Spence, Simister, Varela, Hallam and Crowe. This is an open-access article distributed under the terms of the Creative Commons Attribution License (CC BY). The use, distribution or reproduction in other forums is permitted, provided the original author(s) and the copyright owner(s) are credited and that the original publication in this journal is cited, in accordance with accepted academic practice. No use, distribution or reproduction is permitted which does not comply with these terms.
*Correspondence: Sean A. Crowe, c2Vhbi5jcm93ZUB1YmMuY2E=