 María Algueró-Muñiz1*†
 Henriette G. Horn1,2†
 Santiago Alvarez-Fernandez1Carsten Spisla1,3
 Nicole Aberle1,4
 Lennart T. Bach3
 Wanchun Guan5
 Eric P. Achterberg3
 Ulf Riebesell3
 Maarten Boersma1,6
- 1Biologische Anstalt Helgoland, Alfred-Wegener-Institut Helmholtz-Zentrum für Polar- und Meeresforschung, Bremerhaven, Germany
- 2Department of Estuarine and Delta Systems, NIOZ Royal Netherlands Institute for Sea Research and Utrecht University, Yerseke, Netherlands
- 3GEOMAR Helmholtz Centre for Ocean Research Kiel, Kiel, Germany
- 4Department of Biology, Trondheim Biological Station, Norwegian University of Science and Technology, Trondheim, Norway
- 5Department of Marine Biotechnology, School of Laboratory Medicine and Life Science, Wenzhou Medical University, Wenzhou, China
- 6Department of Biology/Chemistry, University of Bremen, Bremen, Germany
Ocean acidification (OA) is affecting marine ecosystems through changes in carbonate chemistry that may influence consumers of phytoplankton, often via trophic pathways. Using a mesocosm approach, we investigated OA effects on a subtropical zooplankton community during oligotrophic, bloom, and post-bloom phases under a range of different pCO2 levels (from ∼400 to ∼1480 μatm). Furthermore, we simulated an upwelling event by adding 650 m-depth nutrient-rich water to the mesocosms, which initiated a phytoplankton bloom. No effects of pCO2 on the zooplankton community were visible in the oligotrophic conditions before the bloom. The zooplankton community responded to phytoplankton bloom by increased abundances in all treatments, although the response was delayed under high-pCO2 conditions. Microzooplankton was dominated by small dinoflagellates and aloricate ciliates, which were more abundant under medium- to high-pCO2 conditions. The most abundant mesozooplankters were calanoid copepods, which did not respond to CO2 treatments during the oligotrophic phase of the experiment but were found in higher abundance under medium- and high-pCO2 conditions toward the end of the experiment, most likely as a response to increased phyto- and microzooplankton standing stocks. The second most abundant mesozooplankton taxon were appendicularians, which did not show a response to the different pCO2 treatments. Overall, CO2 effects on zooplankton seemed to be primarily transmitted through significant CO2 effects on phytoplankton and therefore indirect pathways. We conclude that elevated pCO2 can change trophic cascades with significant effects on zooplankton, what might ultimately affect higher trophic levels in the future.
Introduction
Anthropogenic emissions are increasing atmospheric CO2 concentrations from pre-industrial levels of ∼280 μatm to current levels of over 400 μatm, and increases up to 1000 μatm by the end of the century are projected for the RCP8.5 emission scenario (IPCC, 2013). The oceans act as carbon sinks, absorbing about one third of the anthropogenic CO2 emission (Sabine et al., 2004). This oceanic CO2 uptake causes a shift in carbonate chemistry with a decrease in seawater pH, commonly known as ocean acidification (OA). Recent years of intense research have shown that OA may cause substantial changes to marine ecosystems (IPCC, 2013; Kroeker et al., 2013).
Despite the large body of literature related to biological responses to OA, most studies investigated single species responses, which may rarely provide a sufficient basis to understand long-term responses in complex ecological environments (Harley, 2011; Queirós et al., 2015). Moreover, changes in pCO2 may promote changes in trophic interactions, leading to the dampening or amplification of single species effects and hence promoting shifts in community composition (Lischka et al., 2011; Rossoll et al., 2012, 2013). Consequently, in situ community studies are important in order to evaluate OA effects at the level of assemblages and ecosystems (Guinotte and Fabry, 2008; Riebesell and Gattuso, 2015).
Focusing on marine plankton, nutrient conditions can determine how communities respond to OA (Alvarez-Fernandez et al., 2018), being the most noticeable pCO2 effects often observed under limiting inorganic nutrient conditions (Paul et al., 2015; Sala et al., 2015; Bach et al., 2016b). This is because elevated CO2 levels cause an increase in phytoplankton standing stocks —more pronounced in smaller-sized taxa— and this effect on primary producers may be transferred differently into heterotroph primary consumers depending on the inorganic nutrient availability (Alvarez-Fernandez et al., 2018). The present study focussed on an oligotrophic system around the island of Gran Canaria within the Canary Archipelago, located in the subtropical North Atlantic Ocean. Despite its overall oligotrophic character, this region experiences a short-term period of deep-water nutrient inputs in later winter (February–March) (de León and Braun, 1973; Cianca et al., 2007) as well as recurrent mesoscale upwelling events that act as an offshore pump of organic matter and carbon (Sangrà et al., 2009). The so-called late winter bloom usually causes an increase in primary production and chlorophyll a concentration in the euphotic zone (Menzel and Ryther, 1961; Arístegui et al., 2001). Typically, mesozooplankton grazing pressure exerted on phytoplankton is low in the study area (Arístegui et al., 2001; Hernández-León et al., 2004), and mesozooplankters are considered to feed on microzooplankton which, in turn, control primary production (Hernández-León et al., 2001; Quevedo and Anadón, 2001; Calbet and Alcaraz, 2007). The microzooplankton community is usually dominated by small dinoflagellates and aloricate ciliates (Quevedo and Anadón, 2001), while the most important mesozooplankton during the annual cycle are copepods (Hernández-León et al., 2007). However, the plankton community typically changes during bloom conditions \(Arístegui et al., 2001; Hernández-León et al., 2004; Schmoker et al., 2012). An increase in copepod abundances follows the increase in primary production, and a trophic cascade caused by the consumption of microzooplankton by mesozooplankton allows a further increase in autotrophic biomass by the combined effect of top-down control and nutrient remineralization (Hernández-León, 2009; Schmoker et al., 2012). This bloom situation may cause a reduction in the efficiency of the food web, considering that trophic transfer efficiency (i.e., zooplankton growth per unit phytoplankton production) tends to be diminished under nutrient enrichment conditions due to the limited capacity of grazers to use the boosted algae production (Calbet et al., 1996; Kemp et al., 2001; Calbet et al., 2014).
In order to assess the impacts of OA on zooplankton communities we must consider not only direct effects on zooplankton caused by pH reductions, but also effects that reach consumers indirectly, through trophic pathways (Boersma et al., 2008; Rossoll et al., 2012; Cripps et al., 2016). Detrimental indirect pCO2 effects have been described in single species of herbivores (Schoo et al., 2013; Meunier et al., 2016) and secondary consumers (Lesniowski et al., 2015). In the case of copepods, bottom-up influences of OA seem to be largely associated with interspecific differences among prey items with regard to their sensitivity to elevated pCO2 levels, as observed when analyzing the cellular stoichiometry of copepods’ photosynthetic preys (Isari et al., 2015; Meunier et al., 2016). In turn, microzooplankton may be affected by the effect of high pCO2 levels on phytoplankton availability or quality such as an increase in picophytoplankton standing stock or changes in their cellular carbon-to-nutrient ratios (Bach et al., 2016b; Meunier et al., 2016). In addition, a high pCO2 scenario is likely to favor harmful algal blooms (Wells et al., 2015) with substantial consequences for energy transfer from primary producers to consumers within marine communities.
Plankton community OA studies to date have been mostly carried out in relatively eutrophic environments (but see Sala et al., 2015; Gazeau et al., 2017), and led to varying conclusions. Some studies showed the lack of major effects of elevated pCO2 levels in micro- (Aberle et al., 2013; Horn et al., 2016) and mesozooplankton abundances (Niehoff et al., 2013), while others detected both changes in community size distributions and biomass (Lischka et al., 2017; Taucher et al., 2017b) as well as positive bottom-up pCO2 responses on mesozooplankton abundances (Algueró-Muñiz et al., 2017). Inorganic nutrient availability can control these different responses to OA in planktonic communities, thereby the nutrient-deplete phases could determine the transfer of the pCO2 effects on primary producers to primary consumers (Alvarez-Fernandez et al., 2018). Taking this into account, studying OA effect in oligotrophic systems —which represent most of the global surface ocean— becomes of paramount importance. To accomplish this goal, we performed an experiment that allowed us to study the contrast between nutrient-depleted and nutrient-replete periods. Our aim was to analyze the effects of OA on the development of an autumn zooplankton community from the subtropical North Atlantic, including a simulated bloom situation. We assessed the effects of pCO2 on (1) the abundance of subtropical micro- and mesozooplankton under oligotrophic and upwelling conditions, (2) the size and reproductive output of an important copepod species and (3) the trophic efficiency within the plankton community under different conditions.
Materials and Methods
Mesocosms Setup and Experimental Design
The experiment was conducted from 27th September (t-4) until 26th November 2014 (t56) within the framework of the BIOACID II project (Biological Impacts of Ocean ACIDification) and was hosted by the Plataforma Oceánica de Canarias (PLOCAN, Spain). In order to study the effects of changing carbonate chemistry conditions on the plankton community succession, nine mesocosms (KOSMOS, M1–M9: “Kiel Off-Shore Mesocosms for Ocean Simulation”), were deployed in Gando Bay (27°55′41″ N, 15°21′55″ W), on the west coast of Gran Canaria (Canary Islands, Spain) (Taucher et al., 2017a). The nine cylindrical mesocosm units (13 m deep, 2 m diameter) enclosed water volumes (∼35 m3) sealed by sediment traps installed at the bottom of each mesocosm bag (Boxhammer et al., 2016). Target pCO2 was reached at the beginning of the experiment by adding CO2 saturated seawater to the mesocosms following the protocol described in Riebesell et al. (2013). The carbonate chemistry of the enclosed seawater was manipulated by stepwise additions of CO2-saturated seawater in four steps over 7 days. Two further CO2 additions were conducted on days 21 and 38 to compensate for the loss of CO2 through air-sea gas exchange. As pCO2 treatments we established a gradient from current levels to end-of-century scenarios, representing IPCC predictions for mitigation scenarios (RCP 2.6) as well as medium (RCP 6.0) and high (RCP 8.5) pCO2 levels (IPCC, 2013). The mean pCO2 values per mesocosms between t1 and t55 were M1 = 369, M2 = 887, M3 = 563, M4 = 716, M5 = 448, M7 = 668, M8 = 1025 and M9 = 352 μatm. Analyzing the oligotrophic phase of the experiment, we could differentiate three pCO2 groups by a k-means cluster analysis (Jain, 2010). The outcome showed three distinguishable clusters: low-pCO2 (M1, M9, M5; k = 460 μatm) medium-pCO2 (M3, M7, M4; k = 721 μatm) and high-pCO2 levels (M2, M8; k = 1111 μatm) (Figure 1A) which were used for the analyses presented throughout this paper. Unfortunately, we detected a hole in the enclosure bag of the third high-pCO2 mesocosm (M6 = 976 μatm) on t27, so M6 was excluded from sampling and analyses after that date.
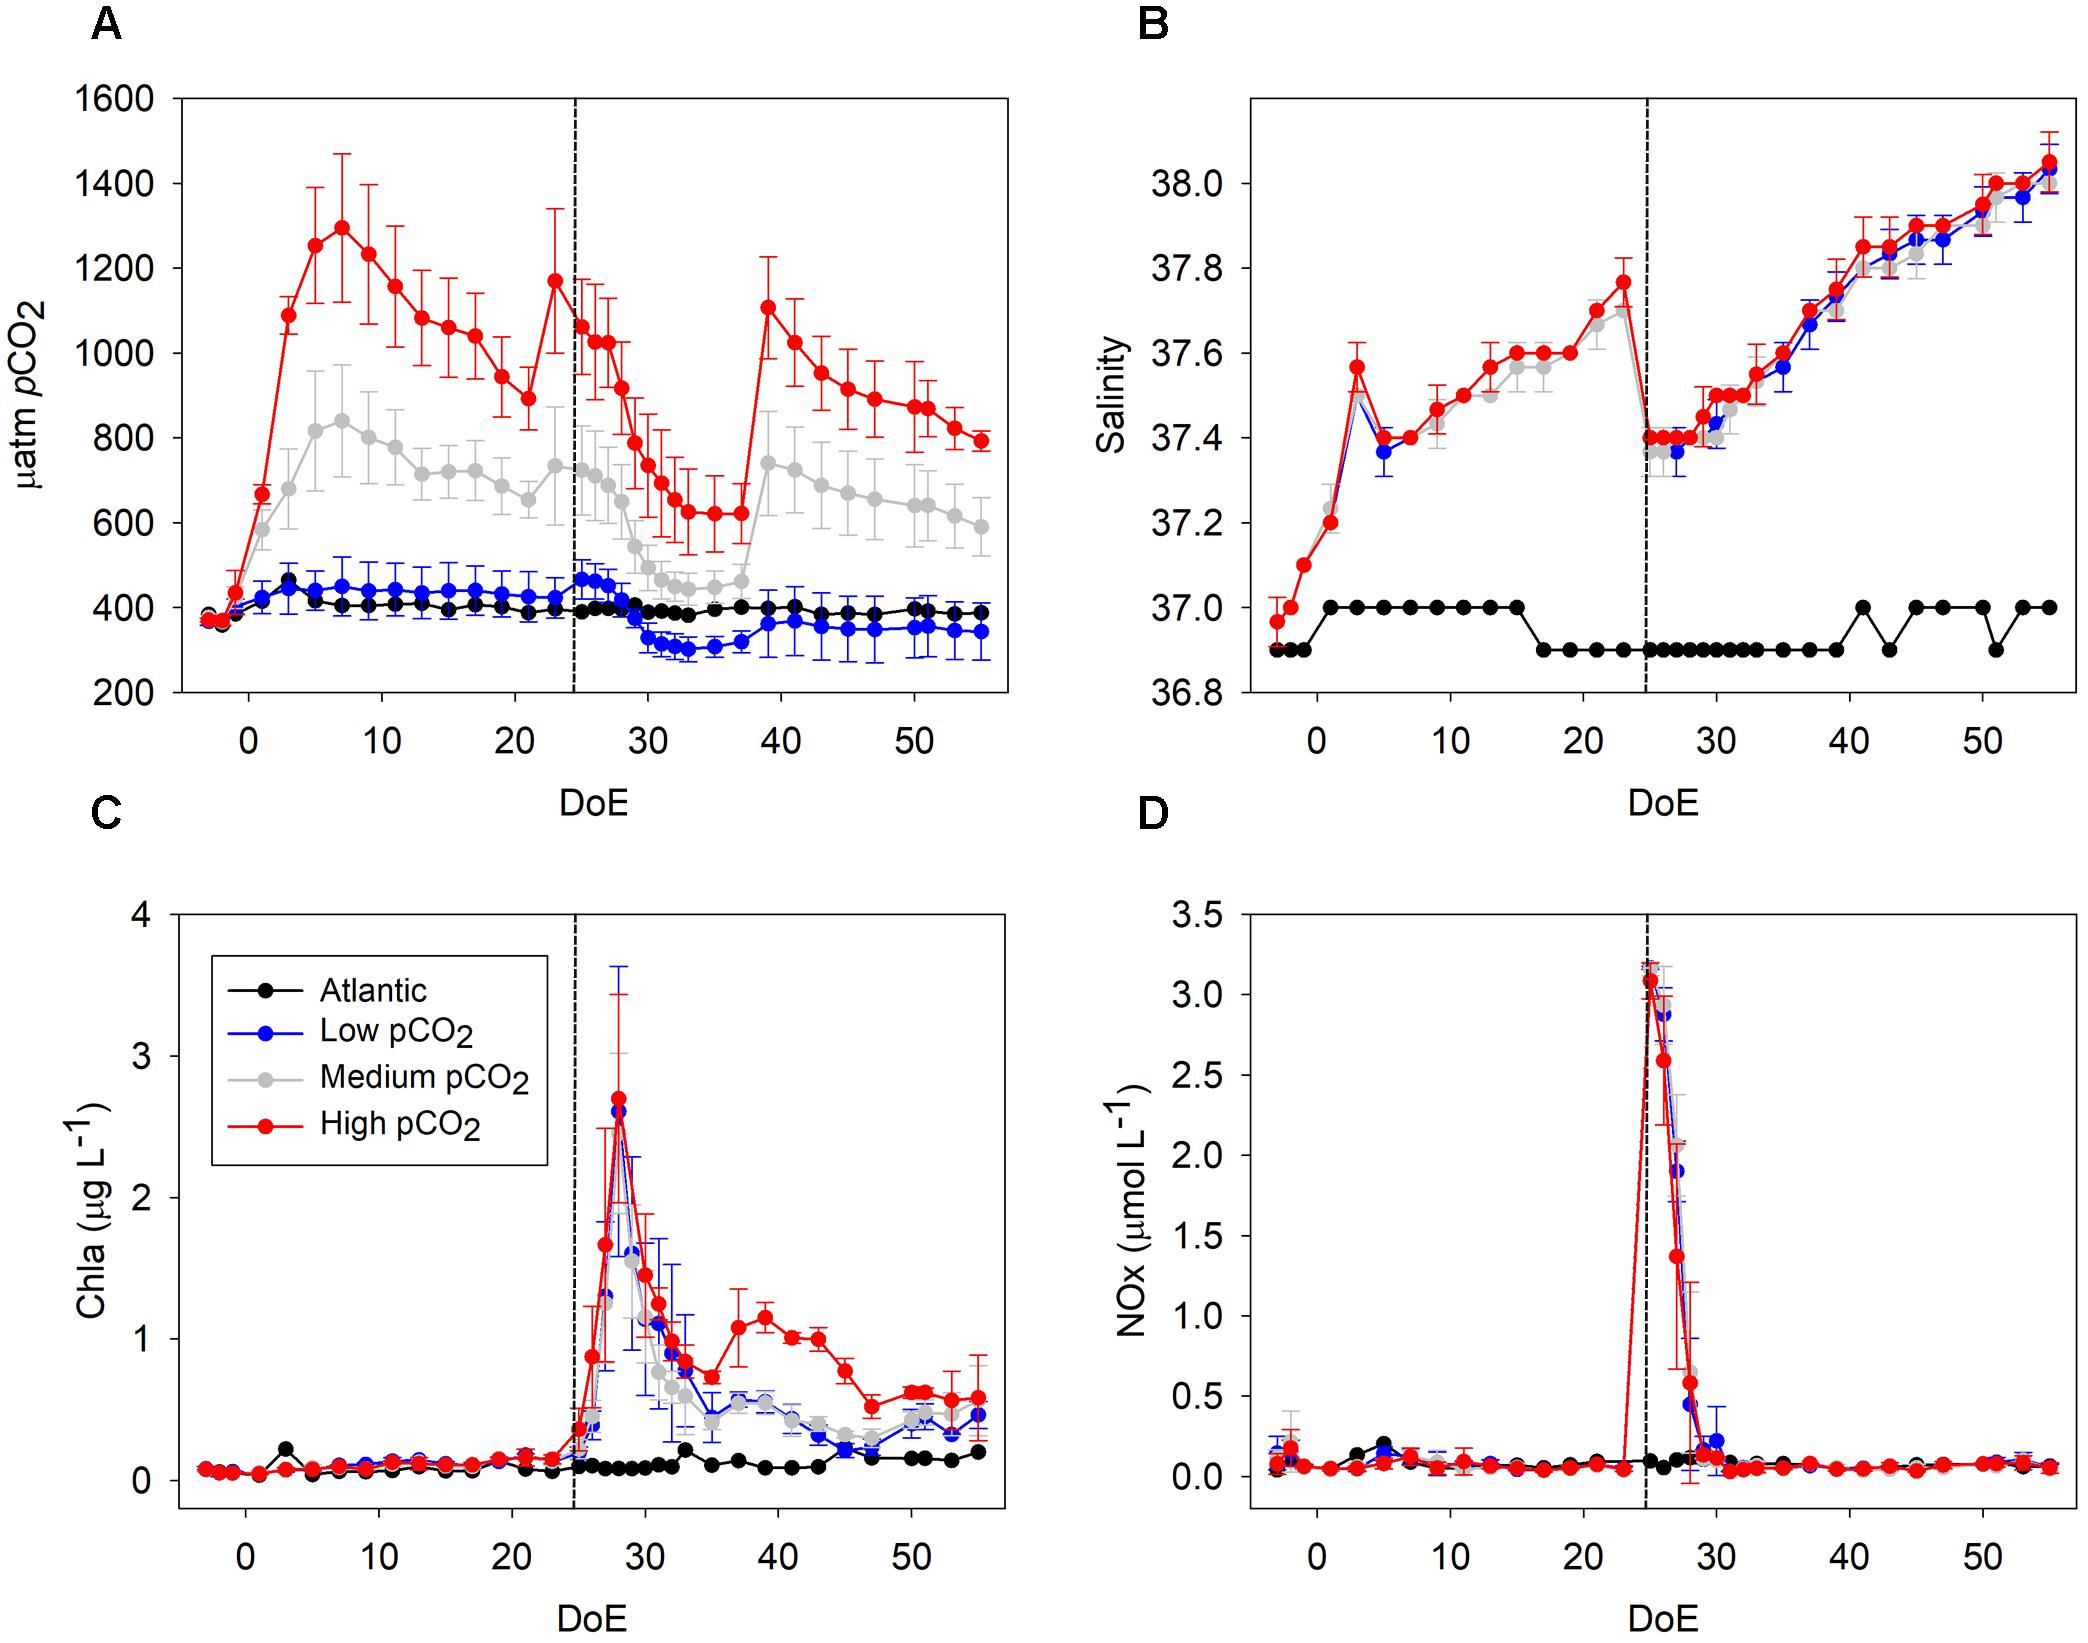
Figure 1. Development of core parameters throughout the experiment. (A) pCO2 (μatm), (B) salinity, (C) Chla (μg L−1), (D) NOx (nitrate + nitrite; μmol L−1). The addition of deep water (DW) in the mesocosms took place during the night between the 24th and 25th day of experiment (DoE); dashed line. Note that a clear draw down of CO2 occurred during the phytoplankton bloom (t25–t35). Color code: black = Atlantic, blue = low-pCO2, gray = medium-pCO2, red = high-pCO2.
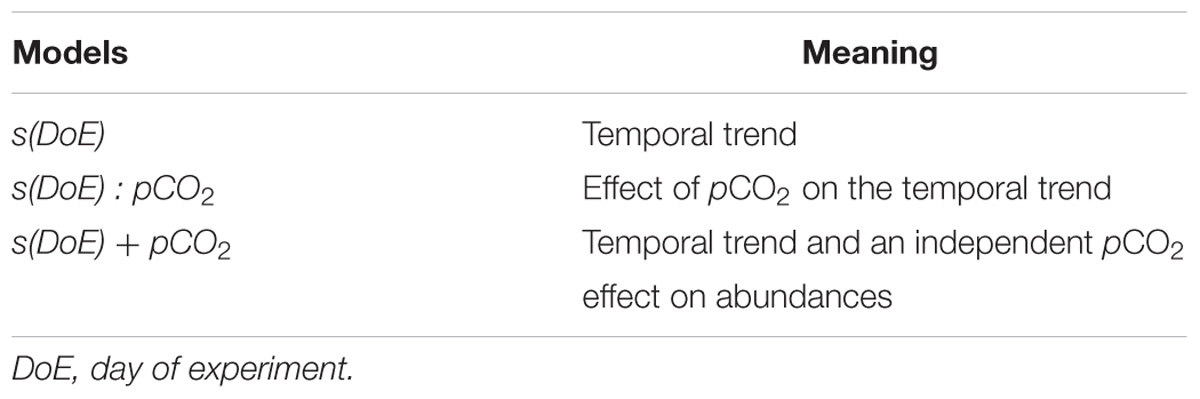
Table 1. Generalized additive mixed model (GAMM) structures.
To simulate a natural upwelling event, we collected deep water (∼84 m3) from 650 m depth on t22, as described by Taucher et al. (2017a). From each mesocosm, a defined volume of water was removed from 5 m depth with a submersible pump (Grundfos SP-17-5R). Consequently, in a process of ∼9 h duration during the night of t24, deep water was pumped into the mesocosms, reaching a mixing ratio of ∼20% and a total mesocosm volume of ∼35 m3 [see Table 1 from Taucher et al. (2017a)]. Continuous up and down movement of the injection device during deep-water addition ensured homogenous vertical distribution of deep water inside the mesocosms.
All sampling methods and analyses are described in detail in the overview paper provided by Taucher et al. (2017a). Briefly, regular sampling — conducted every 2nd day before deep water addition, daily after t25— included CTD casts, water column sampling, and sediment sampling. CTD casts were carried out with a hand-held CTD probe (CTD60M, Sea and Sun Technologies) in each mesocosm and in the surrounding water. Thereby we obtained vertical profiles of temperature, salinity (Figure 1B), pH, dissolved oxygen, chlorophyll a, and photosynthetically active radiation (PAR). Vertical profiles of temperature and salinity showed a uniform distribution of both variables, indicating that there was no stratification and that the water columns in the mesocosms were well-mixed throughout the entire study period (Taucher et al., 2017a). Water column samples were collected with integrating water samplers (IWS, Hydrobios, Kiel), in which a total volume of 5 L from 0 to 13 m depth was collected evenly through the water column. This water was either used for samples sensitive to contamination such as nutrient analyses, which were directly filled into separate containers on board, or stored in carboys for later subsampling for parameters such as phytoplankton and microzooplankton. Some analyses required larger volumes of water than could be sampled with the IWS in a reasonable time frame, e.g., pigment samples for reverse-phase high-performance liquid chromatography (HPLC) analysis. To enable a faster water collection, we used a custom-built pump system connected to a 20 L carboy. By creating a gentle vacuum and moving the inlet of the tube evenly up and down in the mesocosm during pumping, samples similar to those from the IWS were obtained. All carboys were protected from sunlight during sampling and stored in a temperature-controlled room at 16°C upon arrival on shore. Before taking subsamples from the carboys, they were carefully mixed to avoid a bias due to particle sedimentation.
Pigments such as Chlorophyll a (Chla in the following) were analyzed using HPLC (Figure 1C). Nutrients (nitrate + nitrite (NOx), Figure 1D) were measured using an autoanalyzer (SEAL Analytical, QuAAtro) coupled to an autosampler (SEAL Analytical, XY2). NOx are presented here as a proxy for inorganic nutrients spec [see PO43−, Si(OH)4 and NH4+ dynamics in Taucher et al. (2017a)]. Phytoplankton samples for microscopy were obtained every 4 days and fixed with Lugol’s solution. They were analyzed using the Utermöhl (1958) technique and classified to the lowest possible taxonomical level. Biomass of phytoplankton was estimated by using conversion factors, as detailed in Supplementary Table S1 (Tomas and Hasle, 1997; Ojeda, 1998; Leblanc et al., 2012).
Zooplankton: Sampling and Analysis
For the analysis of the microzooplankton community (microZP) —the size class of 20–200 μm— samples from the IWS were taken every 8 days until day 50. 250 mL of mesocosm water was transferred into brown glass bottles, fixed with acidic Lugol’s solution (1–2% final concentration), and stored in the dark. MicroZP was counted and identified with an inverted microscope (Axiovert 25, Carl Zeiss) using the Utermöhl (1958). 50 mL of each sample was transferred into a sedimentation chamber and allowed to settle for 24 h prior to counting. Depending on plankton abundances, the whole or half of the chamber was counted at 100-fold magnification to achieve a count of at least 300–400 individuals for the most common taxa. MicroZP was identified to the lowest possible level (genus or species level) and otherwise grouped into size classes according to their distinct morphology. MicroZP were grouped into ciliates (aloricate and loricate) and dinoflagellates (athecate and thecate, size classes: small (<25 μm) and large (>25 μm)). As most dinoflagellates are capable of heterotrophic feeding (Calbet and Alcaraz, 2007), they can be considered as mixotrophic and were thus included in the microZP. Only few dinoflagellate taxa such as Ceratium or Dinophysis are considered to be predominantly autotrophic and were thus included in the phytoplankton (Tomas and Hasle, 1997). MicroZP biovolumes were estimated using geometric proxies obtained from literature (Ojeda, 1998; Hillebrand et al., 1999; Montagnes et al., 2001; Schmoker et al., 2014), and transformed to carbon biomass using conversion factors provided by Putt and Stoecker (1989) and Menden-Deuer and Lessard (2000) for ciliates and dinoflagellates, respectively (see Supplementary Table S1).
The mesozooplankton community (mesoZP) was sampled in the mesocosms by vertical net hauls with an Apstein net (55 μm mesh size, 17 cm diameter) equipped with a closed cod end. Sampling depth was restricted to 13 m to avoid resuspension of the material accumulated in the sediment traps at 15 m depth. Every net haul consisted in total filtered volume of 295 L. One net haul per mesocosm was carried out once every 8 days, always during the same time of the day (2–4 pm local time) to avoid diel differences in community composition. Samples were rinsed on board with filtered sea water, collected in containers and brought to the on-shore laboratory (PLOCAN, ∼4 nm distance), where samples were preserved in denatured ethanol. For transportation, the samples were placed in cooling boxes until fixation of the organisms.
During analysis, organisms were sorted using a stereomicroscope (Olympus SZX9) and classified to the lowest possible taxonomical level. Copepodites and adults were classified together on a species/genus level, with the exception of the genus Oncaea, for which adults and copepodites were considered separately for a more in-depth study of this copepod. Nauplii from different species were pooled together. Taxonomical analysis was carried out focusing on copepods as the most abundant group (Boltovskoy, 1999). Every sample was sieved using a 50 μm mesh, rinsed with fresh water and divided with a Folsom plankton splitter (1:2, 1:4). Abundant species/taxa (>200 individuals in an aliquot) were only counted from subsamples, while less abundant species/taxa were counted from the whole sample. An in depth analysis of the succession of calcifying zooplankton is provided by Lischka et al. (2018).
As a proxy to explore the system’s energy transfer efficiency from producers to consumers (i.e., trophic transfer efficiency, TTE), we used the quotient autotrophy:heterotrophy (A:H) adapted from Calbet et al. (1996, 2014). This proxy was based on phytoplankton (Guan, 2018), heterotrophic microZP and mesoZP abundances transformed into biomass (see Supplementary Table S1 for further details). Low TTE is indicated by a higher biomass A:H ratio, hence TTE and A:H are inversely correlated.
Oncaea spp. Development
Oncaea is a common genus in the Canary Current System, where it has been typically recorded during the upwelling season (Hernández-León, 1998; Huskin et al., 2001; Hernández-León et al., 2007). Oncaea spp. is of special interest for this study because of (1) its trophic interaction with appendicularians (Go et al., 1998), which in turn may benefit from increased pCO2 levels and nutrient enrichment conditions (Troedsson et al., 2013) and (2) to our knowledge, poecilostomatoid copepods had not been studied in an OA context before. Hence, despite being not the most abundant mesoZP taxon within the mesocosms (Poecilostomatoida; 8% total mesoZP catch) we focused on the condition of Oncaea to investigate direct and/or indirect pCO2 effects on the female copepod length and reproductive output. Females were sorted from the same samples used for species determination, i.e., one sample per mesocosms (M1–M9) every 8 days during the whole study period (see section “Zooplankton: Sampling and Analysis”). The whole sample was scanned under the stereomicroscope (Olympus SZX9) and the first 20 adult females per sample were selected. Prosome length of every individual was measured, and females were classified regarding sexual development (mature/immature) and presence or absence of egg sacks. Females with developing egg sacks were classified as mature, while females which did not present any egg sack or eggs inside the prosome were rated as immature individuals.
Statistical Analyses
We used non-metric multidimensional scaling (NMDS) as exploratory analysis to describe the zooplankton community development in the mesocosms throughout the experiment. In our case the data matrix comprised abundances of each phytoplankton, microZP and mesoZP taxon in each mesocosm and on each sampling day (69 MK_timestep × 96 taxa). The treatment effect was assessed by using permutation tests on the community position in the NMDS space. These permutations check if the area of clusters formed by the treatment in the NMDS are smaller than randomized samples of the same size (Legendre and Anderson, 1999). In a complementary approach, we applied an ANalysis Of SIMilarity (ANOSIM) test (Clarke, 1993) as a post-analysis to compare the mean of ranked dissimilarities between pCO2 treatments to the mean of ranked dissimilarities within treatments. This analysis tests the assumption that ranges of (ranked) dissimilarities within groups are equal, or at least very similar (Buttigieg and Ramette, 2014).
To describe the temporal trends of each taxon during this experiment we used generalized additive mixed models (GAMMs) (Wood, 2006; Zuur et al., 2009) with a Gamma distribution and a logarithmic link. Three different kinds of models were fitted to each abundance group (Table 1).
Each of these models allowed the abundance temporal trend to vary differently between pCO2 treatments, representing (a) an equal temporal trend for all mesocosms [s(DoE)], (b) an effect of pCO2 on the temporal trend [s(DoE):pCO2], and (c) an equal temporal trend with an independent pCO2 effect [s(DoE) + pCO2]. This way, potential differences between pCO2 treatments could be detected as either (b) changes in phenology or (c) an increase/decrease of overall abundance. If necessary, models were fitted with an autocorrelation structure of first order to account for temporal autocorrelation in the data (Zuur et al., 2009). Statistically significant models were compared by the coefficient of determination (R2), which indicates the proportion of the variance in the dependent variable that is predictable from the independent variables. For each taxon, the model with the highest R2 was considered to best represent the abundance data. Models presented here accounted from t1, whilst t-3 abundances have been included in the figures to illustrate conditions prior to pCO2 manipulations within the mesocosms.
Differences in the condition of Oncaea females were analyzed by generalized linear mixed models (GLMMs) comparing the potential effect of pCO2 and time on development, prosome length and reproductive output. The effect of the day of experiment (t1–t56) and pCO2 treatment (low-, medium-, and high-pCO2) on the studied parameters as well as their interaction were considered in the models. A Poisson distribution with a log link was used for the GLMM of count data, while length data was analyzed with a Gamma distribution. Unfortunately, the relatively low zooplankton sampling frequency did not allow for testing pCO2 effects on a continuous manner. As an alternative, different pCO2 levels were grouped in low-, medium-, and high-pCO2 by a k-means cluster analysis, as described in Section “Mesocosms Setup and Experimental Design.”
We used R [version 3.0.2, (R Core Team, 2012)] to fit abundance data with the GAMMs and GLMs. The significance level for all statistical analysis was set to p < 0.05.
Results
Community Change
The 2-dimensional representation of the community (NMDS) showed a strong trend in time (plankton succession), and a divergence of this trend from ca. t25 between the high-pCO2 mesocosms and the low- and medium- ones (Figure 2). Treatments followed a similar trend from t-3 until t17, but tended to separate afterwards, matching the simulated upwelling caused by deep water addition (t24). Permutation tests (with 999 permutations) did not show the areas (i.e., clusters of samples) \representing the different pCO2 treatments to be significantly smaller than randomized areas, indicating that the variation due to CO2 is smaller than the changes over time (i.e., natural succession) (ANOSIM test, p-value = 0.246). Areas representing the sampling day were significantly different from randomized areas using the same test, indicating a temporal trend (p-value = \0.001). Moreover, results for the interaction between sampling day and pCO2 treatment (ANOSIM test, p-value = 0.001) matched with the NMDS, suggesting that there was a significant effect of pCO2 on plankton succession, ultimately affecting the plankton community development after the simulated upwelling event. Consequently, the plankton community developed differently within the different pCO2 treatments, the largest difference being in the high-pCO2 mesocosms.
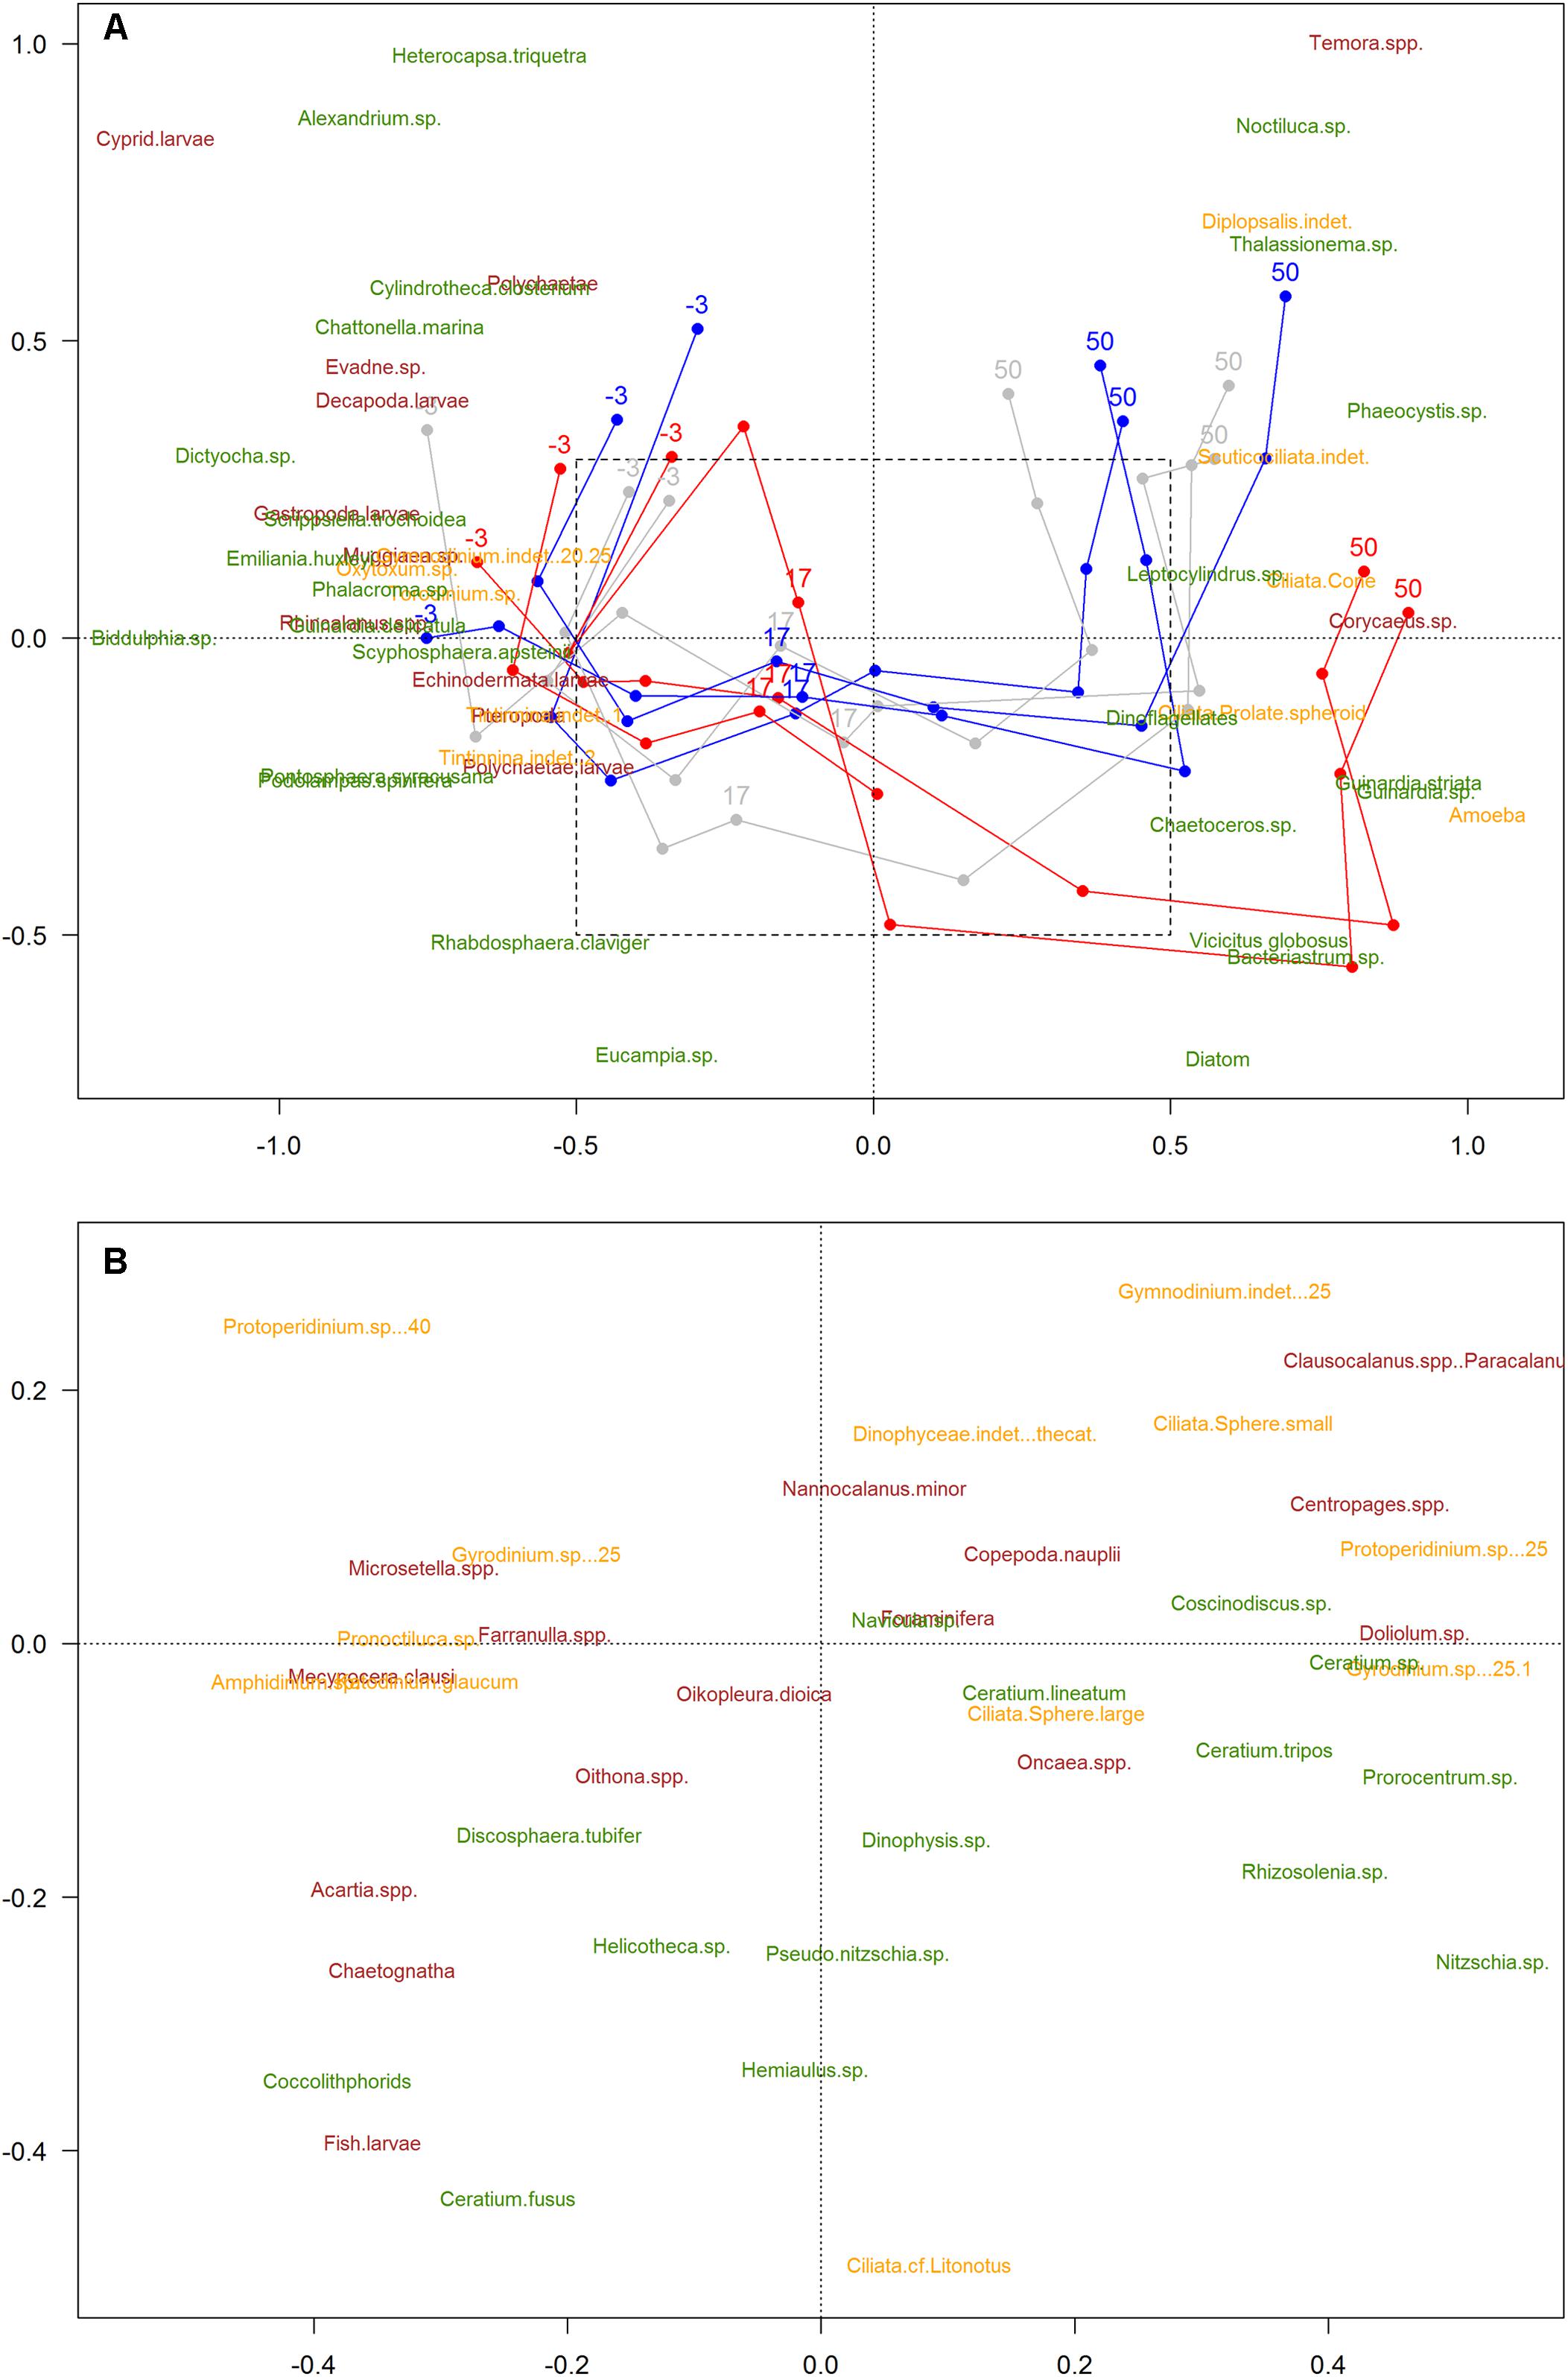
Figure 2. Non-metric Multidimensional Scaling analysis (NMDS) of the plankton community (stress value = 0.18). Color code: blue = low-pCO2 (M1, M5, and M9), gray = medium-pCO2 (M3, M4, and M7), red = high-pCO2 [M2, M6 (until t27), M8]. Only common species (>0.5% total abundances) represented. Taxa names: phytoplankton (green), microzooplankton (yellow), mesozooplankton (burgundy). The numbers -3, 17, and 51 indicate sampling days; lines represent patterns. Species are positioned in the graph according to their relative abundance during the experiment. Days of experiment included in the NMDS analysis were limited to t50, due to the absence of microZP samples for t56. Amplified area (B) is a zoom-in for a clearer view of the species that overlapped in the middle of the first graph [not shown in (A) for the sake of clarity].
Zooplankton Temporal Trends
In view of zooplankton abundance and Chla levels we could define three experimental phases: pre-bloom (from t1 until deep water addition on t24), phytoplankton bloom phase (t25–35) and post-bloom phase (from t35 until the end of the experiment), as shown in Figure 1C.
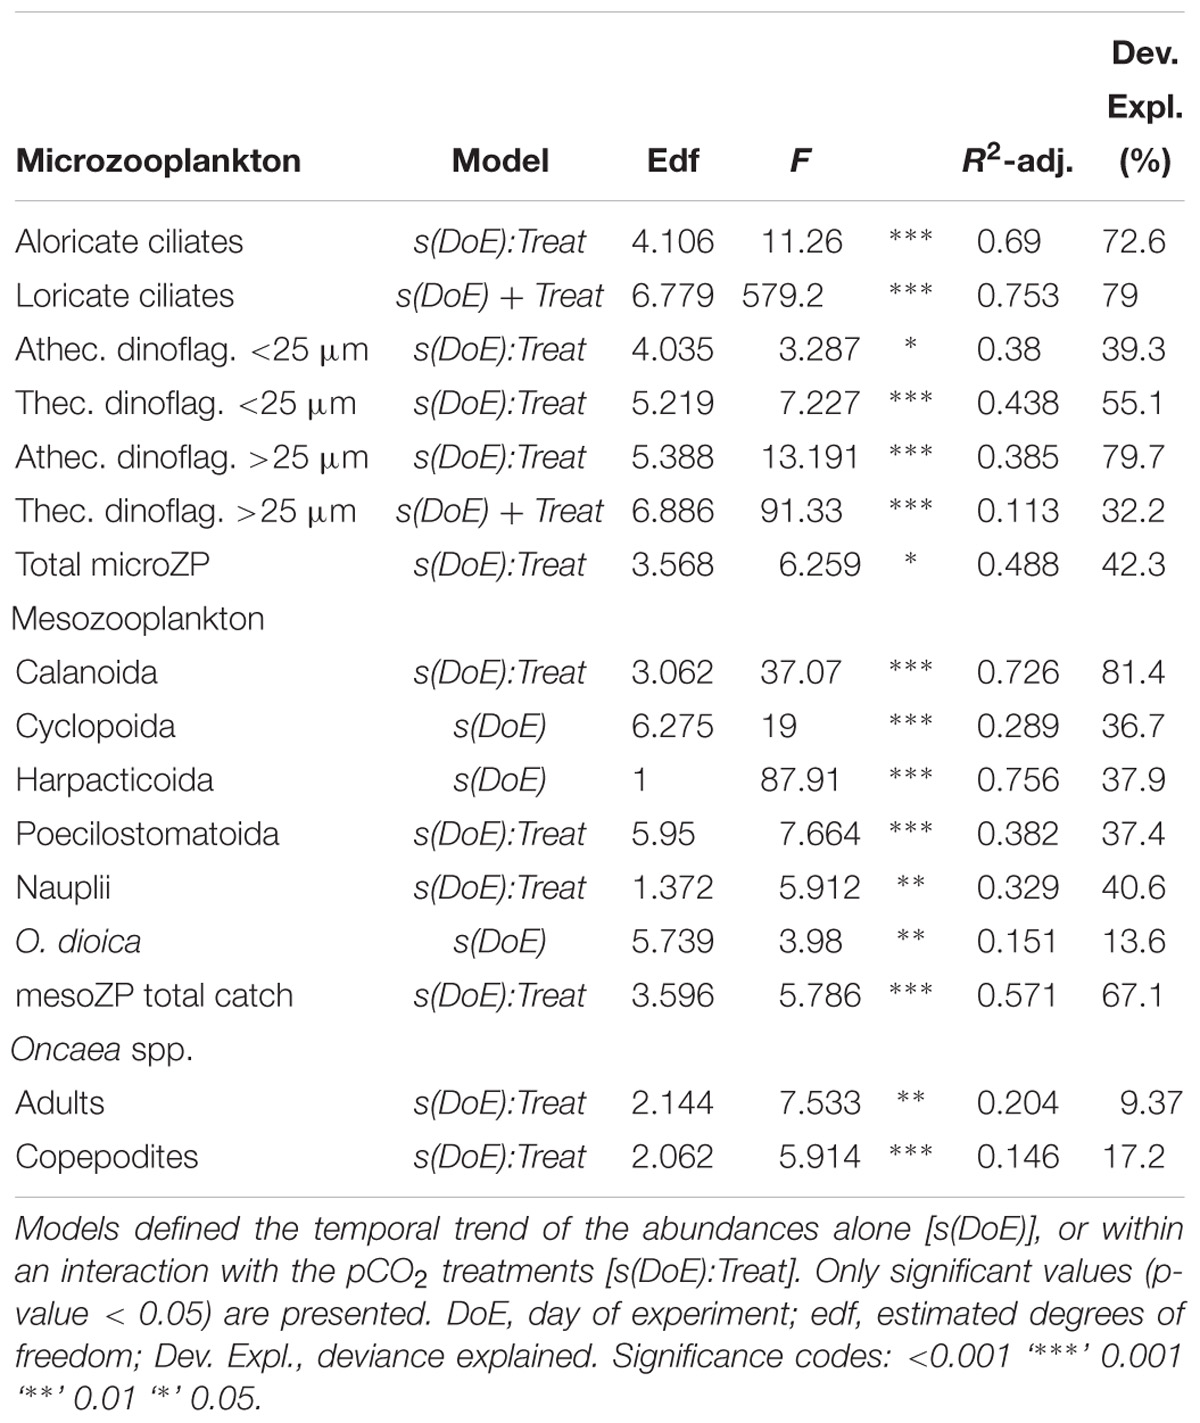
Table 2. Zooplankton GAMM analyses.
The microzooplankton (microZP) community comprised 13 different taxonomic groups of heterotrophic dinoflagellates and ciliates. Temporal trends of total microZP were affected by pCO2 [s(DoE):Treat, Table 2], resulting in higher abundances under the high-pCO2 treatment on the last sampling day. Averaged microZP abundances at the beginning of the experiment (t1) were 4.5 ⋅ 106 ± 2.89 ⋅ 106 individuals per m3 for the low-, \3.45 ⋅ 106 ± 8.03 ⋅ 105 for the medium-, and 4.07 ⋅ 106 ± \9.36 ⋅ 105 for the high-pCO2 treatments, respectively. After deep water addition (t24), abundances increased in all treatments, especially in the medium-pCO2 treatment. Maximum values were reached at the end of the experiment (t50) in the high-pCO2 treatment with 2.14 ⋅ 107 ± 8.94 ⋅ 106 individuals per m3 (1.44 ⋅ 107 ± 6.61 ⋅ 106 and 1.52 ⋅ 107 ± 1.08 ⋅ 107 individuals per m3 in the low- and medium- pCO2 treatments, respectively). MicroZP responded rapidly to phytoplankton bloom formation following the simulated upwelling (t23/24) and showed the strongest increase in abundance in the medium-pCO2 treatment. On t50, however, abundances in the medium-pCO2 treatment decreased again while a pronounced increase in the high-pCO2 was observed (Figure 3G).
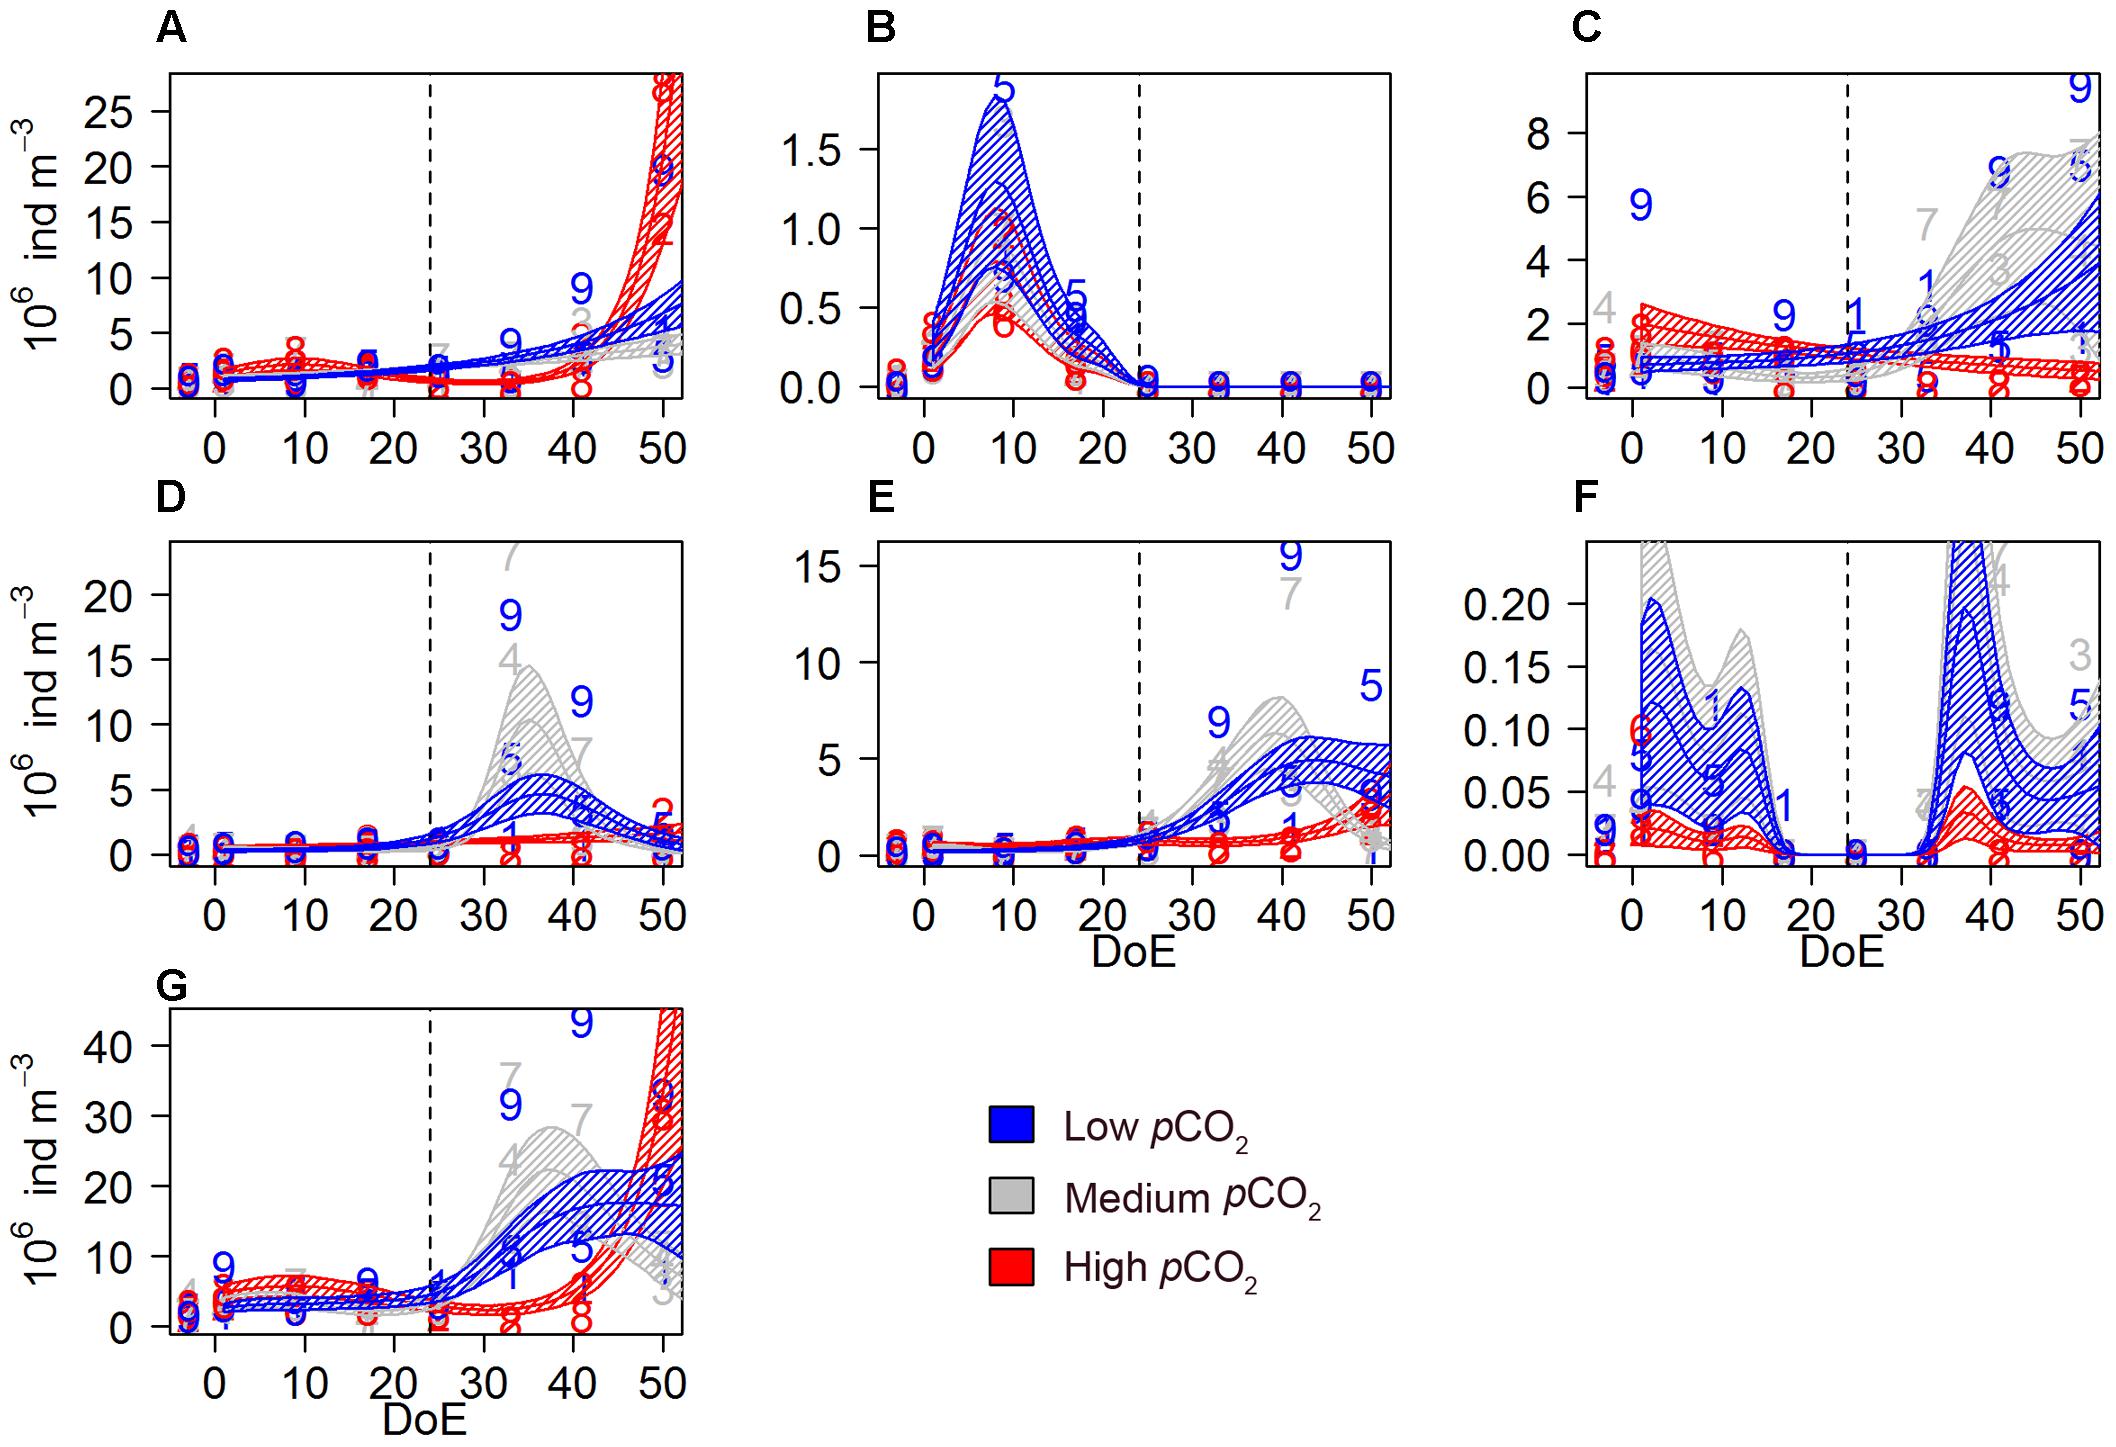
Figure 3. Microzooplankton abundances during the study period. (A) aloricate ciliates, (B) loricate ciliates, (C) small athecate dinoflagellates (<25 μm), (D) small thecate dinoflagellates (<25 μm), (E) large athecate dinoflagellates (>25 μm), (F) large thecate dinoflagellates (>25 μm), (G) total microZP. Color code: blue = low-pCO2 (M1, M5, and M9), gray = medium-pCO2 (M3, M4, and M7), red = high-pCO2 (M2, M6, and M8). DoE, day of experiment. Note that, for a better visibility of the data, y-axes have been adapted to abundances in each panel. Numbers represent abundances for the respective mesocosm (e.g., 9 for M9). Solid lines = prediction from Generalized Additive Mixed Models (GAMMs) (smoother trends p-value < 0.05); shaded area = confidence interval. Dashed line: t24, deep water addition.
Aloricate ciliates, mainly represented by specimen <30 μm, accounted for ∼26% on average of total microZP abundances. Ciliate abundance was lower in high-pCO2 during the bloom phase and increased after t35, matching with Chla decrease (Figure 1). An effect of pCO2 on the temporal trend was detected on these ciliate abundances [s(DoE):Treat], indicating a direct link between CO2-enhanced phytoplankton growth and increases in ciliate abundance under high-pCO2 conditions (Table 2 and Figure 3A). Aloricate ciliates were clearly dominant while loricate ciliates, mainly represented by tintinnids, accounted for only ∼2.5% of total microZP abundance. No significant pCO2 effect was detected on the temporal trend of loricate ciliates [s(DoE) + Treat], even though abundances were higher at lower pCO2 during the oligotrophic phase of the experiment (Table 2 and Figure 3B). Most dinoflagellates in low-and medium-pCO2 treatments responded to the deep-water addition and followed the Chla build-up and decrease (Figure 1) resulting in an increase in dinoflagellates abundance following the addition (t24), although only some (>25 μm athecate) responded to high-pCO2 at the end of the experiment (Figures 3C–F). Small athecate dinoflagellate abundances (Figure 3C) were higher under high-pCO2 conditions during most of the oligotrophic phase, although highest abundances were recorded under medium-pCO2 treatment toward the end of the experiment [s(DoE):Treat]. The most abundant group within the dinoflagellates were small thecate dinoflagellates. The best fitting model was an interaction of pCO2 and the temporal trend resulting in higher abundances at medium pCO2 in the second half of the experiment [s(DoE):Treat]. Thus, higher abundances of this group were recorded at medium- and low-pCO2 treatments during the bloom, followed by a subsequent decrease in the post-bloom phase (Table 2 and Figure 3D). Large athecate dinoflagellates (Figure 3E) showed a similar trend during the bloom phase, but abundance resulted to be ultimately higher under low-pCO2 toward the end of the experiment [s(DoE):Treat]. Large thecate dinoflagellates (Figure 3F) responded differently than other dinoflagellates, reaching lowest abundance before deep water addition and increasing again when the phytoplankton bloom decayed, independent of the pCO2 treatment [s(DoE) + Treat]. Large dinoflagellates were mainly represented by the genus Gyrodinium, comprising ∼12% of the total microZP abundances. Small dinoflagellates from the genera Protoperidinium and Gymnodinium accounted for ∼22 and 20% total microZP abundances, respectively.
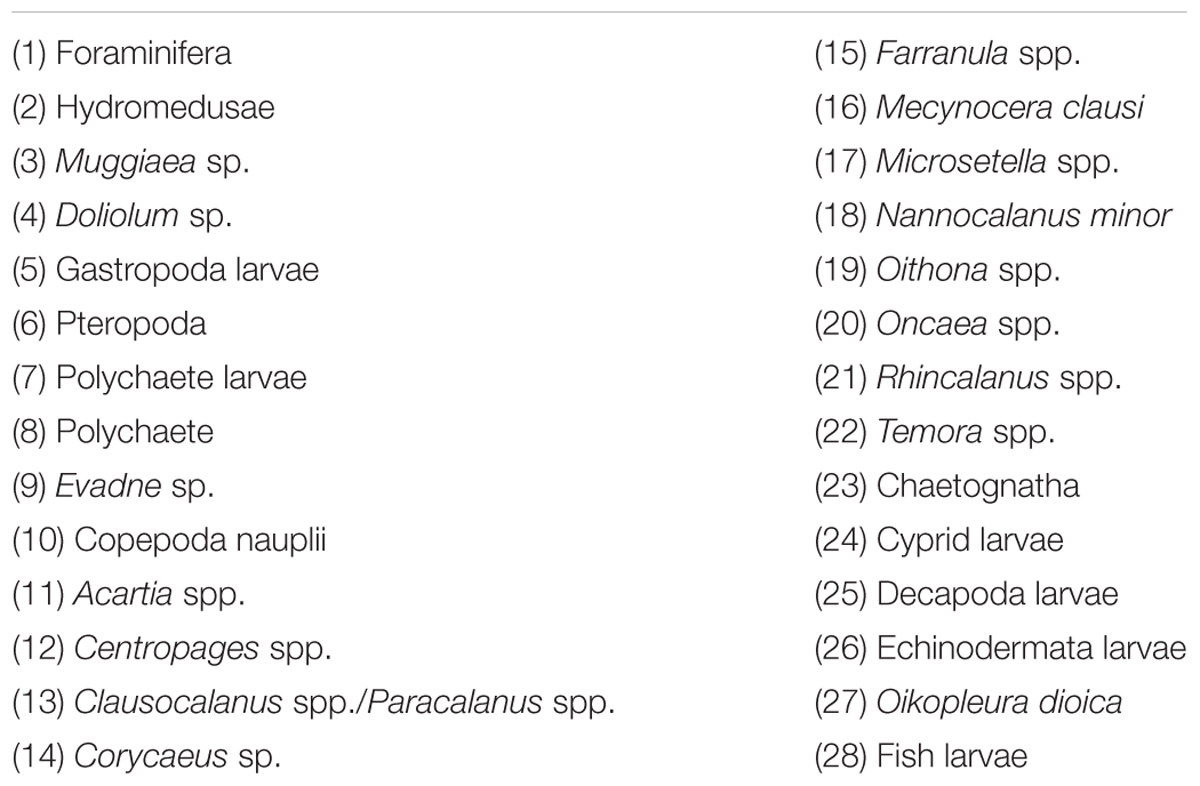
Table 3. Complete list of mesoZP species and taxa detected in the mesocosms registered throughout the study period.
The mesozooplankton (mesoZP) community was dominated by copepods and comprised 28 different species or taxonomic groups (see Table 3). Nauplii were counted from the net hauls (>55 μm) and thus included in the mesoZP category, although we are aware that early copepod life stages would in principle belong to microZP when strictly following Sieburth et al. (1978) \size definition. Total mesoZP catch showed a different temporal trend for each pCO2 treatment [s(DoE):Treat, Table 2]. Averaged mesoZP abundances at the beginning of the experiment (t1) varied between 4730 ± 1202 (low-pCO2), 6023 ± 982 (medium-pCO2), and 5242 ± 369 (high-pCO2) individuals per m3, respectively. Our results showed that mesoZP abundances increased after deep water addition (t24), although this increase was delayed in the high-pCO2 treatment. Highest averaged abundances were recorded for all three treatments on the last sampling day (Figure 4): 23038 ± 9230 individuals per m3 in low-pCO2, 25295 ± 14196 in medium-pCO2 and 24403 ± 10928 in high-pCO2.
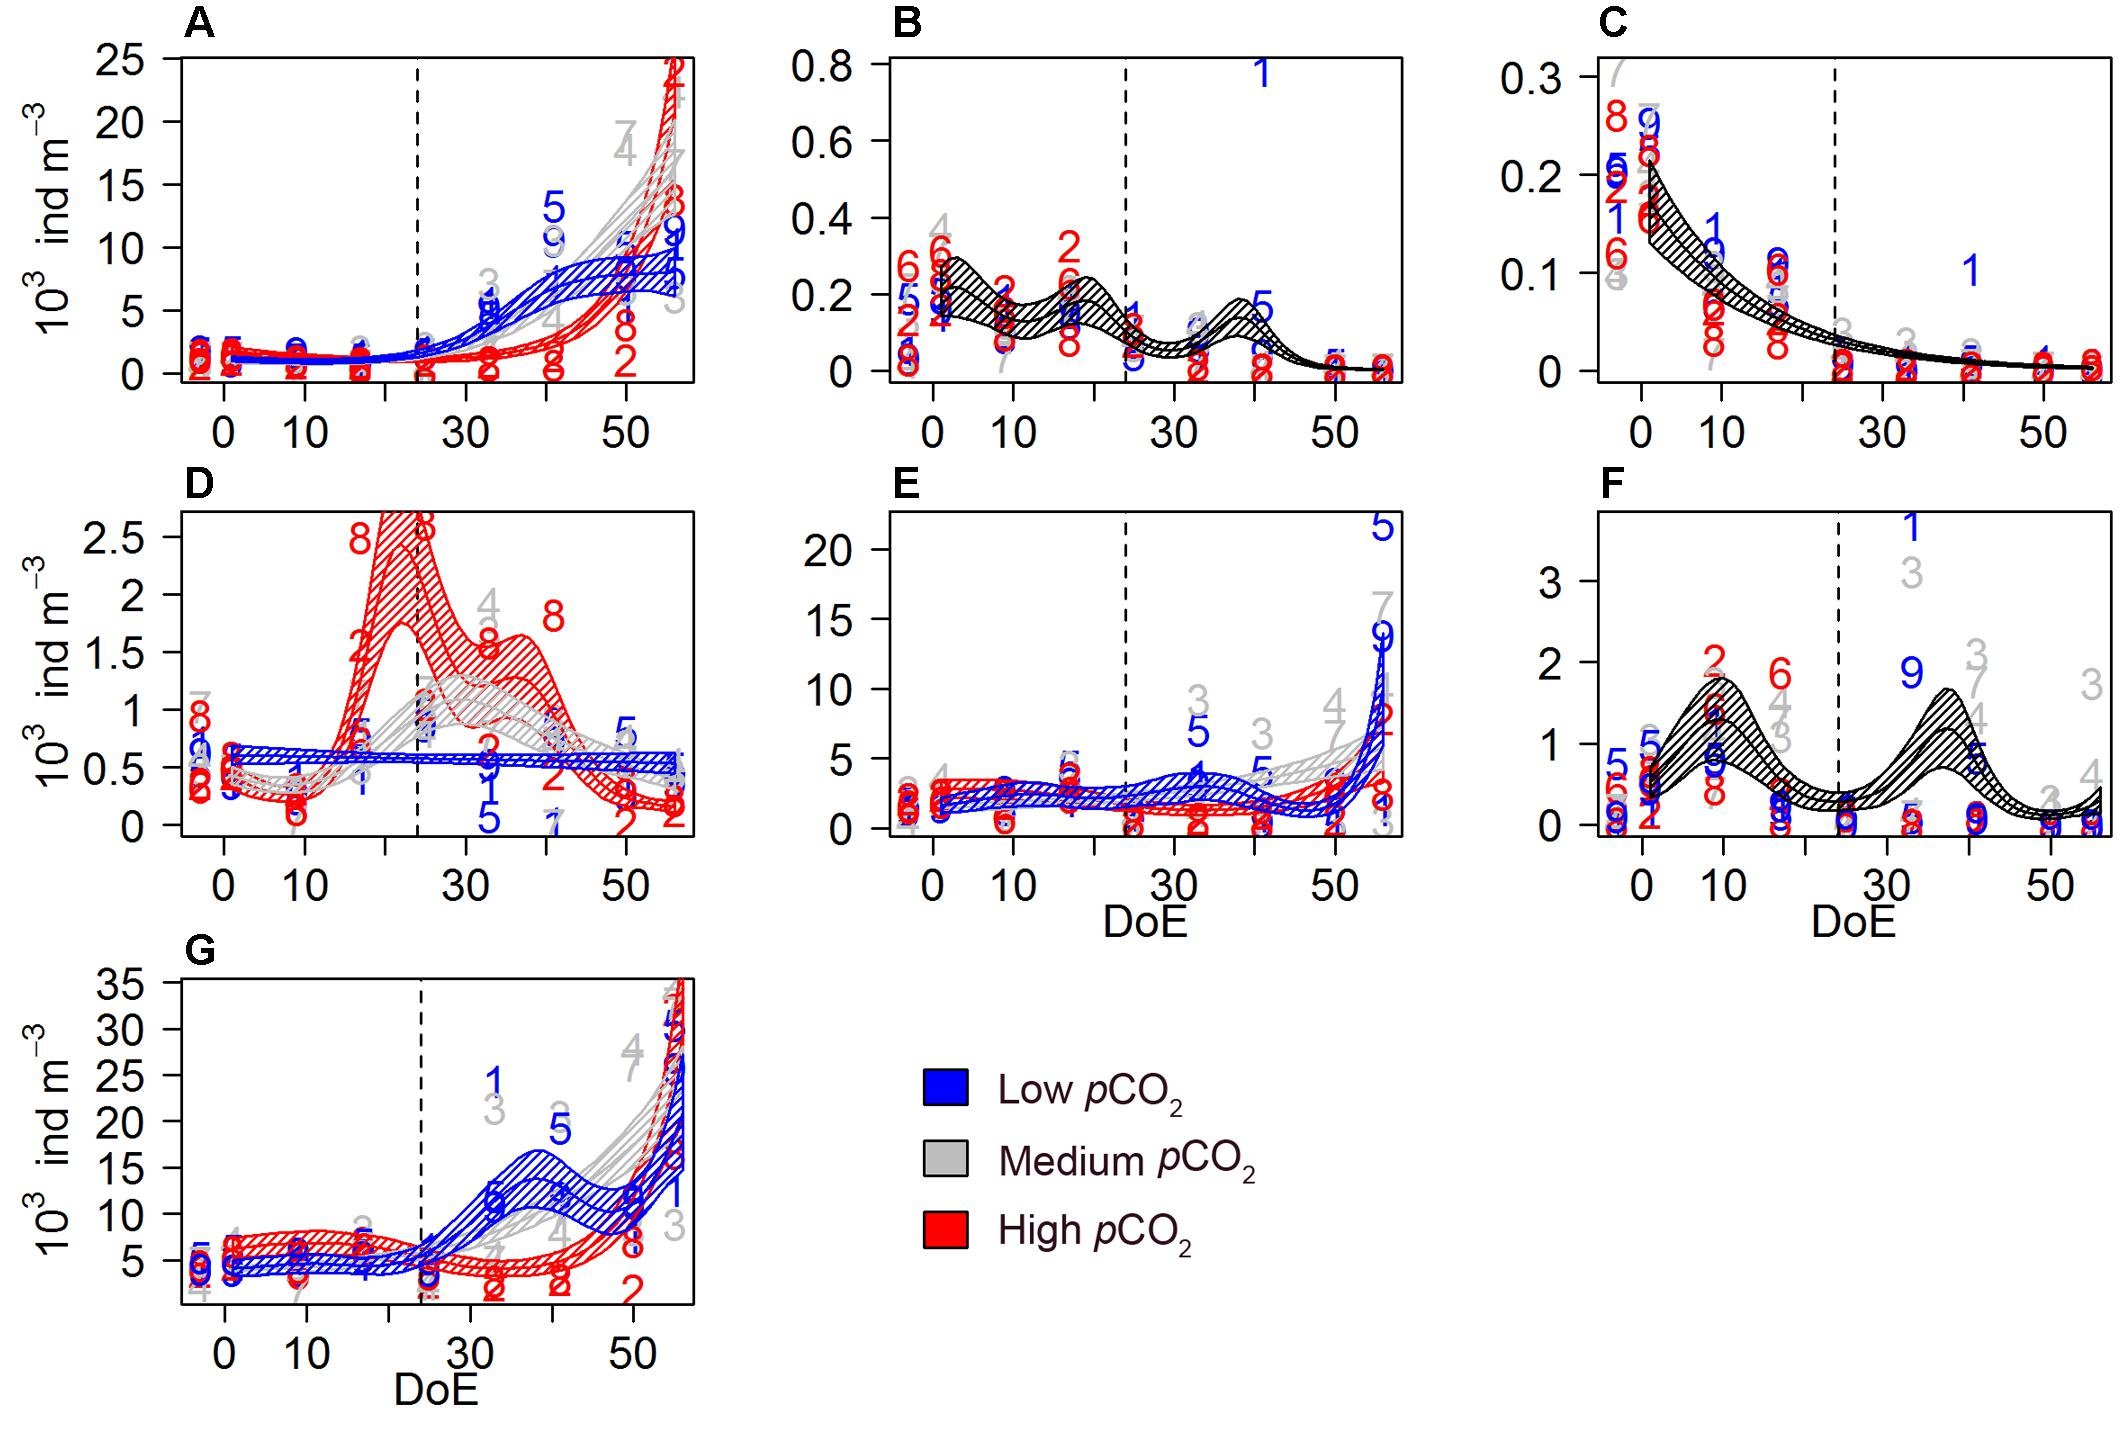
Figure 4. Mesozooplankton abundances during the study period. (A) Calanoida, (B) Cyclopoida, (C) Harpacticoida, (D) Poecilostomatoida, (E) copepod nauplii, (F) O. dioica, (G) mesoZP total catch. Color code: blue = low-pCO2 (M1, M5, and M9), gray = medium-pCO2 (M3, M4, and M7), red = high-pCO2 (M2, M6, and M8). Note that the black lines indicate that the model prediction for the three treatments is the same. DoE, day of experiment. For a better visibility of the data, y-axes have been adapted to abundances in each panel. Numbers represent abundances for the respective mesocosm (e.g., 9 for M9). Solid lines = prediction from Generalized Additive Mixed Models (GAMMs) (smoother trends p-value < 0.05); shaded area = confidence interval. Dashed line: t24, deep water addition.
Different responses to pCO2 treatments were observed among the studied copepod orders. All copepods, including nauplii, represented ∼90% of total mesozooplankton abundances. Calanoid copepods were mainly represented by Clausocalanus spp. and Paracalanus spp. (including e.g., Clausocalanus furcatus, C. arcuicornis, Paracalanus indicus), and accounted for 7–89% (average = 38%) of the total mesozooplankton abundances. An increase in calanoid abundances was detected after deep water addition (t24) in low- and medium-pCO2. Calanoida evolved similarly within the low- and the medium-pCO2 treatments until ∼t40. Afterwards, abundances under medium-pCO2 and high-pCO2 treatments increased, resulting in abundances higher than those in low-pCO2 mesocosms on the last sampling day (Figure 4A). Hence, a significant interaction between pCO2 and temporal trend abundances was detected on calanoid abundances [s(DoE):Treat, Table 2] resulting in higher abundances under elevated pCO2 conditions (medium- and high-) during the last two sampling days.
Cyclopoid copepods abundance (Figure 4B) decreased throughout the experiment independently of the treatment [s(DoE), Table 2]. This order of copepods was mainly represented by Oithona spp. Harpacticoid copepod abundances (Figure 4C) decreased from the start of the experiment, and no pCO2 effect was detected [s(DoE), Table 2]. This order of copepods was only represented by Microsetella spp. during this experiment. A significant effect of pCO2 on the temporal trend was detected on poecilostomatoid copepods (Figure 4D), mainly represented by Oncaea spp. [s(DoE):Treat, Table 2]. Poecilostomatoids abundance was highest in high-pCO2, increasing until ∼t25 and decreasing gradually afterwards until the end of the experiment. A similar trend was observed under medium-pCO2 while abundances under low-pCO2 conditions did not vary much during the experiment. pCO2 had an effect on the temporal trend of nauplii abundances [s(DoE):Treat, Table 2], which accounted for ∼33% of total mesozooplankton abundances. An increase in nauplii abundances under low- and medium-pCO2 conditions was detected after the deep-water addition (t24), with maximum abundances under the medium-pCO2 treatment, while at high-pCO2 abundances did not increase until the last sampling day (Figure 4E).
The appendicularia population — represented by the species Oikopleura dioica— was mainly composed by juveniles and accounted for 0–40% (average = 8%) of total mesozooplankton catch. We could not detect a pCO2 effect on O. dioica during the experiment, even though they were completely absent in the high-pCO2 treatment after deep water addition [s(DoE), Table 2 and Figure 4F]. The absence of a detectable effect could be attributed to the strong within-treatment variability.
Genus Oncaea
A significant effect of pCO2 on the temporal trend was detected on both adults and copepodites [s(DoE):Treat], although no reaction to deep water addition (t24) was observed. Elevated pCO2 levels resulted in higher abundances for both adults (only under high-pCO2) and copepodites (under both medium- and high-pCO2 conditions) (Figure 5 and Table 2).
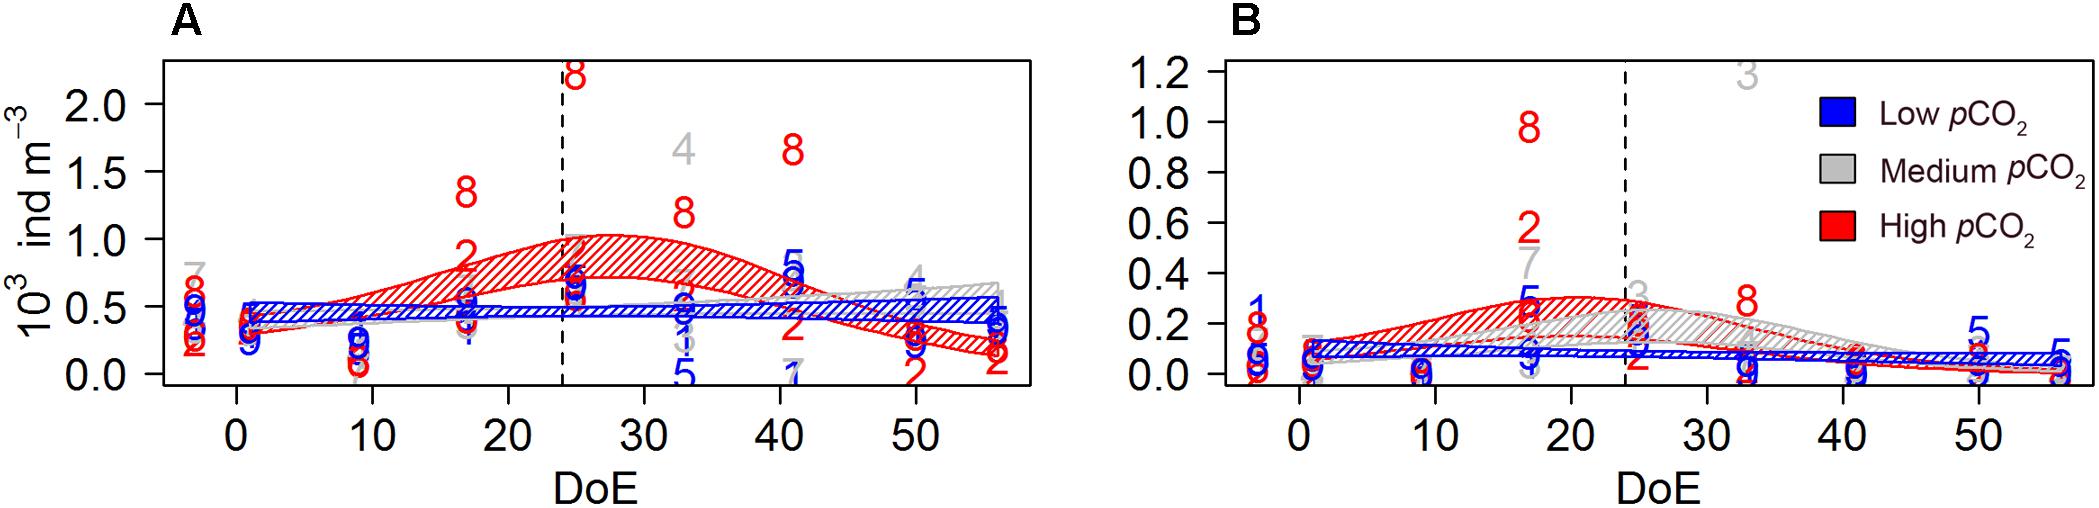
Figure 5. Oncaea spp. abundances during the study period. (A) Adults, (B) copepodites. Color code: blue = low-pCO2 (M1, M5, and M9), gray = medium-pCO2 (M3, M4, and M7), red = high-pCO2 (M2, M6, and M8). DoE, day of experiment. Numbers represent abundances per mesocosm (e.g., 9 for M9). Solid lines = prediction from Generalized Additive Mixed Models (GAMMs) (smoother trends p-value < 0.05); shaded area = confidence interval. Dashed line: t24, deep water addition.

Table 4. Oncaea females’ condition.
A GLMM detected a negative pCO2 effect on females’ sexual development, resulting in higher number of immature females under high- pCO2 conditions [s(DoE):Treat, Table 2 and Figure 6]. Approximately 60% of the females in the high-pCO2 mesocosms were classified as immature, versus ∼30% in medium- and ∼36% low-pCO2 treatments over the whole duration of the experiment. The number of immature females at high- and low-pCO2 increased during the experiment while it decreased under medium-pCO2 (Figure 6A). There were no significant differences between the numbers of mature females without egg sacks across treatments (Figure 6B). In contrast, the number of females carrying eggs during the experiment was significantly different across treatments. At high-pCO2 there were no egg-carrying females after t24, and a clear increase in numbers could only be detected at medium-pCO2 (Figure 6C). Thus, we observed a clear negative effect at high-pCO2 on Oncaea potential offspring (Table 4 and Figure 6), represented by females carrying an egg-sack.
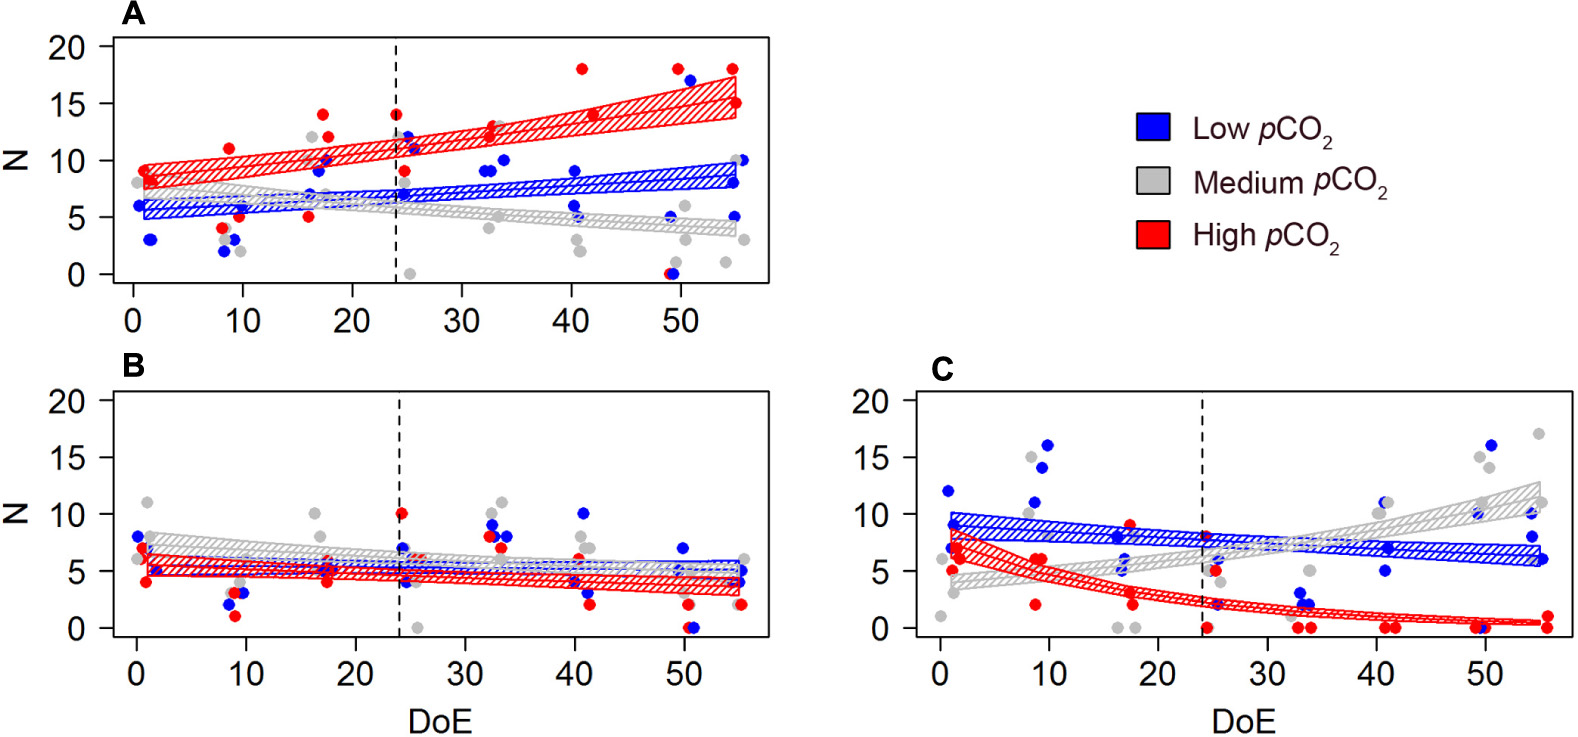
Figure 6. pCO2 effect on Oncaea spp. females’ development and offspring (N). (A) number of immature females, (B) number of mature females (no egg sack), (C) number of egg-carrying females. Color code: blue = low-pCO2 (M1, M5, and M9), gray = medium-pCO2 (M3, M4, and M7), red = high-pCO2 (M2, M6, and M8). DoE, day of experiment. Solid lines = GLMM predictions (p-value > 0.05). Dashed area = GLMM predictions confidence interval.
The model revealed a negative effect of the pCO2 treatment on the prosome length of mature and immature Oncaea females (Table 4 and Figure 7), although this result must be taken with caution due to the relatively weak fit of our models (pseudo-R2 ∼0.1, Table 4). Pooling together mature and immature individuals, females’ prosome length was slightly shorter under high-pCO2 conditions (0.45 ± 0.058 mm) when compared to medium-pCO2 (0.56 ± 0.085 mm) and low-pCO2 (0.52 ± 0.082 mm).
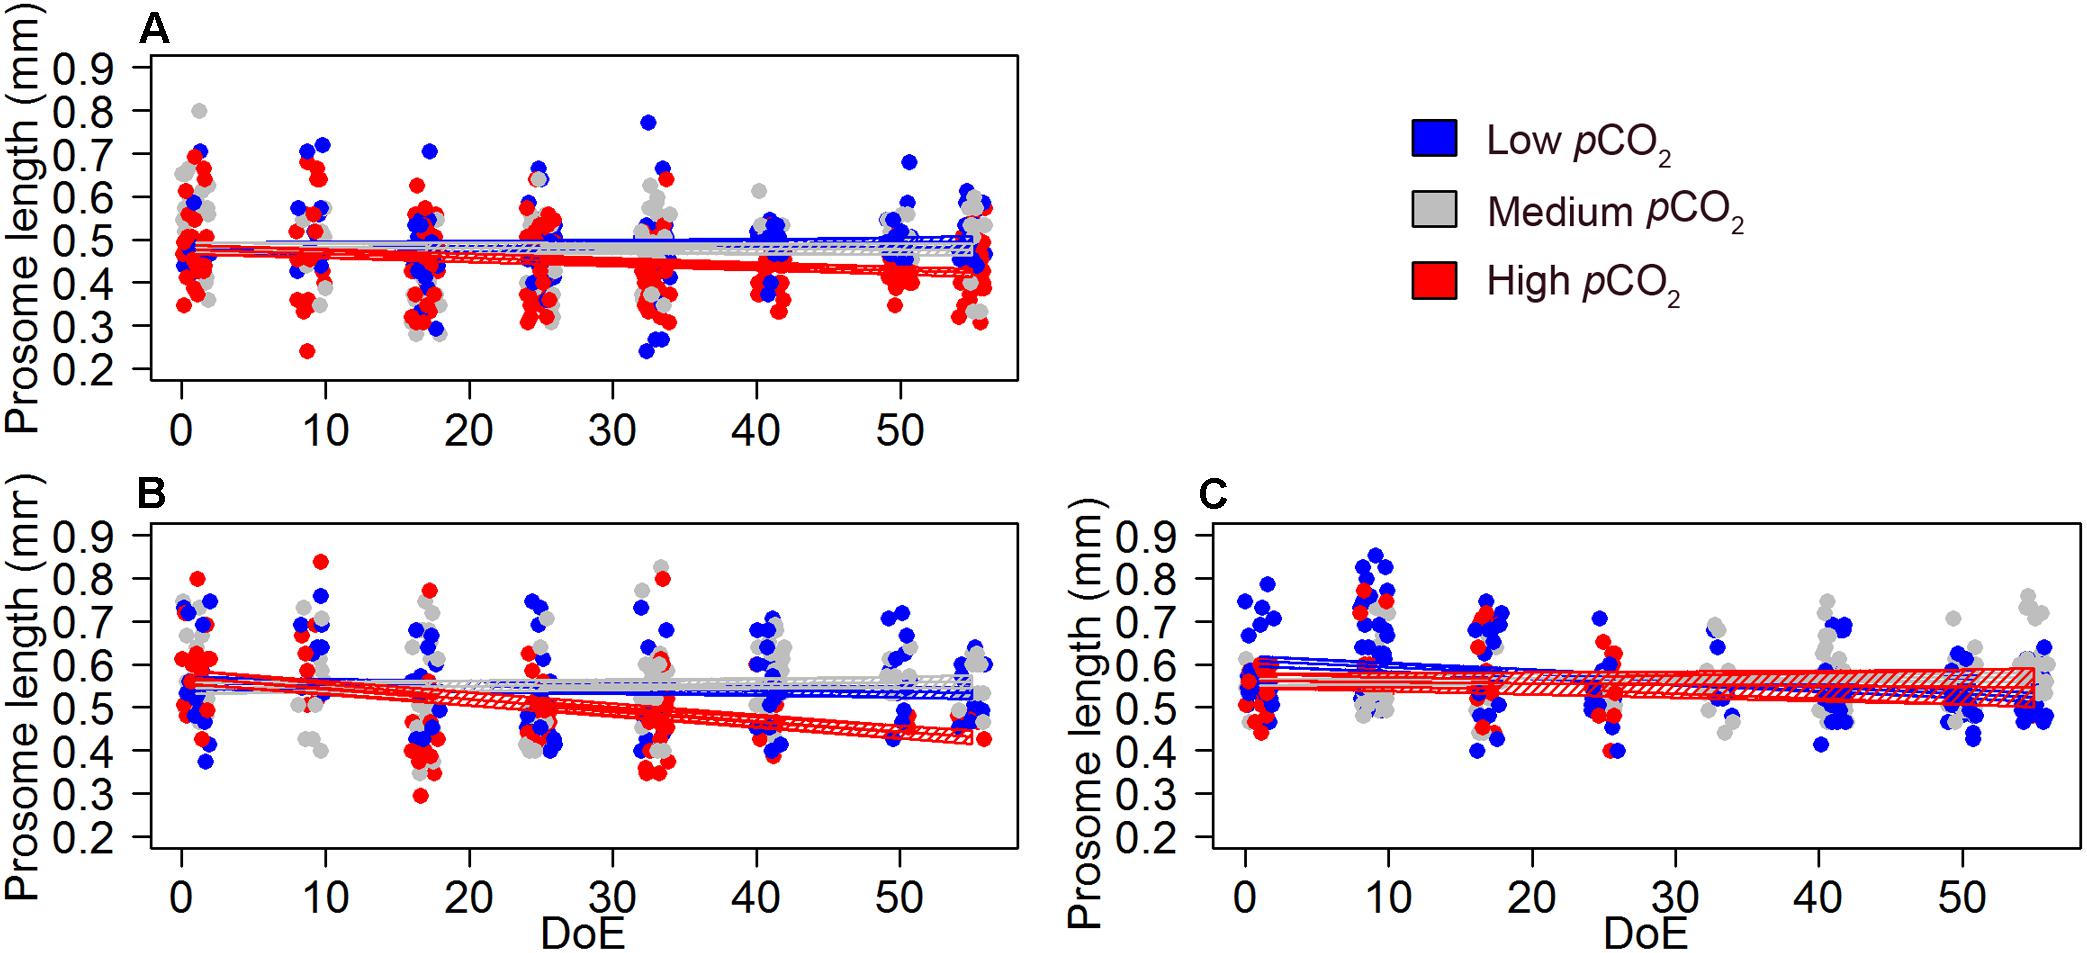
Figure 7. pCO2 effect on Oncaea females’ development and offspring (length). (A) length of immature females, (B) length of mature females (no egg-sack), (C) length of egg-carrying females. Color code: blue = low-pCO2 (M1, M5, and M9), gray = medium-pCO2 (M3, M4, and M7), red = high- pCO2 (M2, M6, and M8). DoE, day of experiment. Solid lines = GLMM predictions (p-value > 0.05). Dashed area = GLMM predictions confidence interval.
Trophic Transfer Efficiency (TTE)
The simulated upwelling induced a phytoplankton bloom (t25–t35) and amplified differences in succession patterns and food-web structure under high-pCO2 conditions (Figure 8). In the high-pCO2 mesocosms the phytoplankton bloom lasted for longer than in the other two treatments, and zooplankton responses were not detected until the bloom decayed (∼t48). MicroZP abundance built up only in high-pCO2 treatment, while we observed an increase in mesoZP abundances in both medium- and high-pCO2 conditions toward the end of \the experiment.
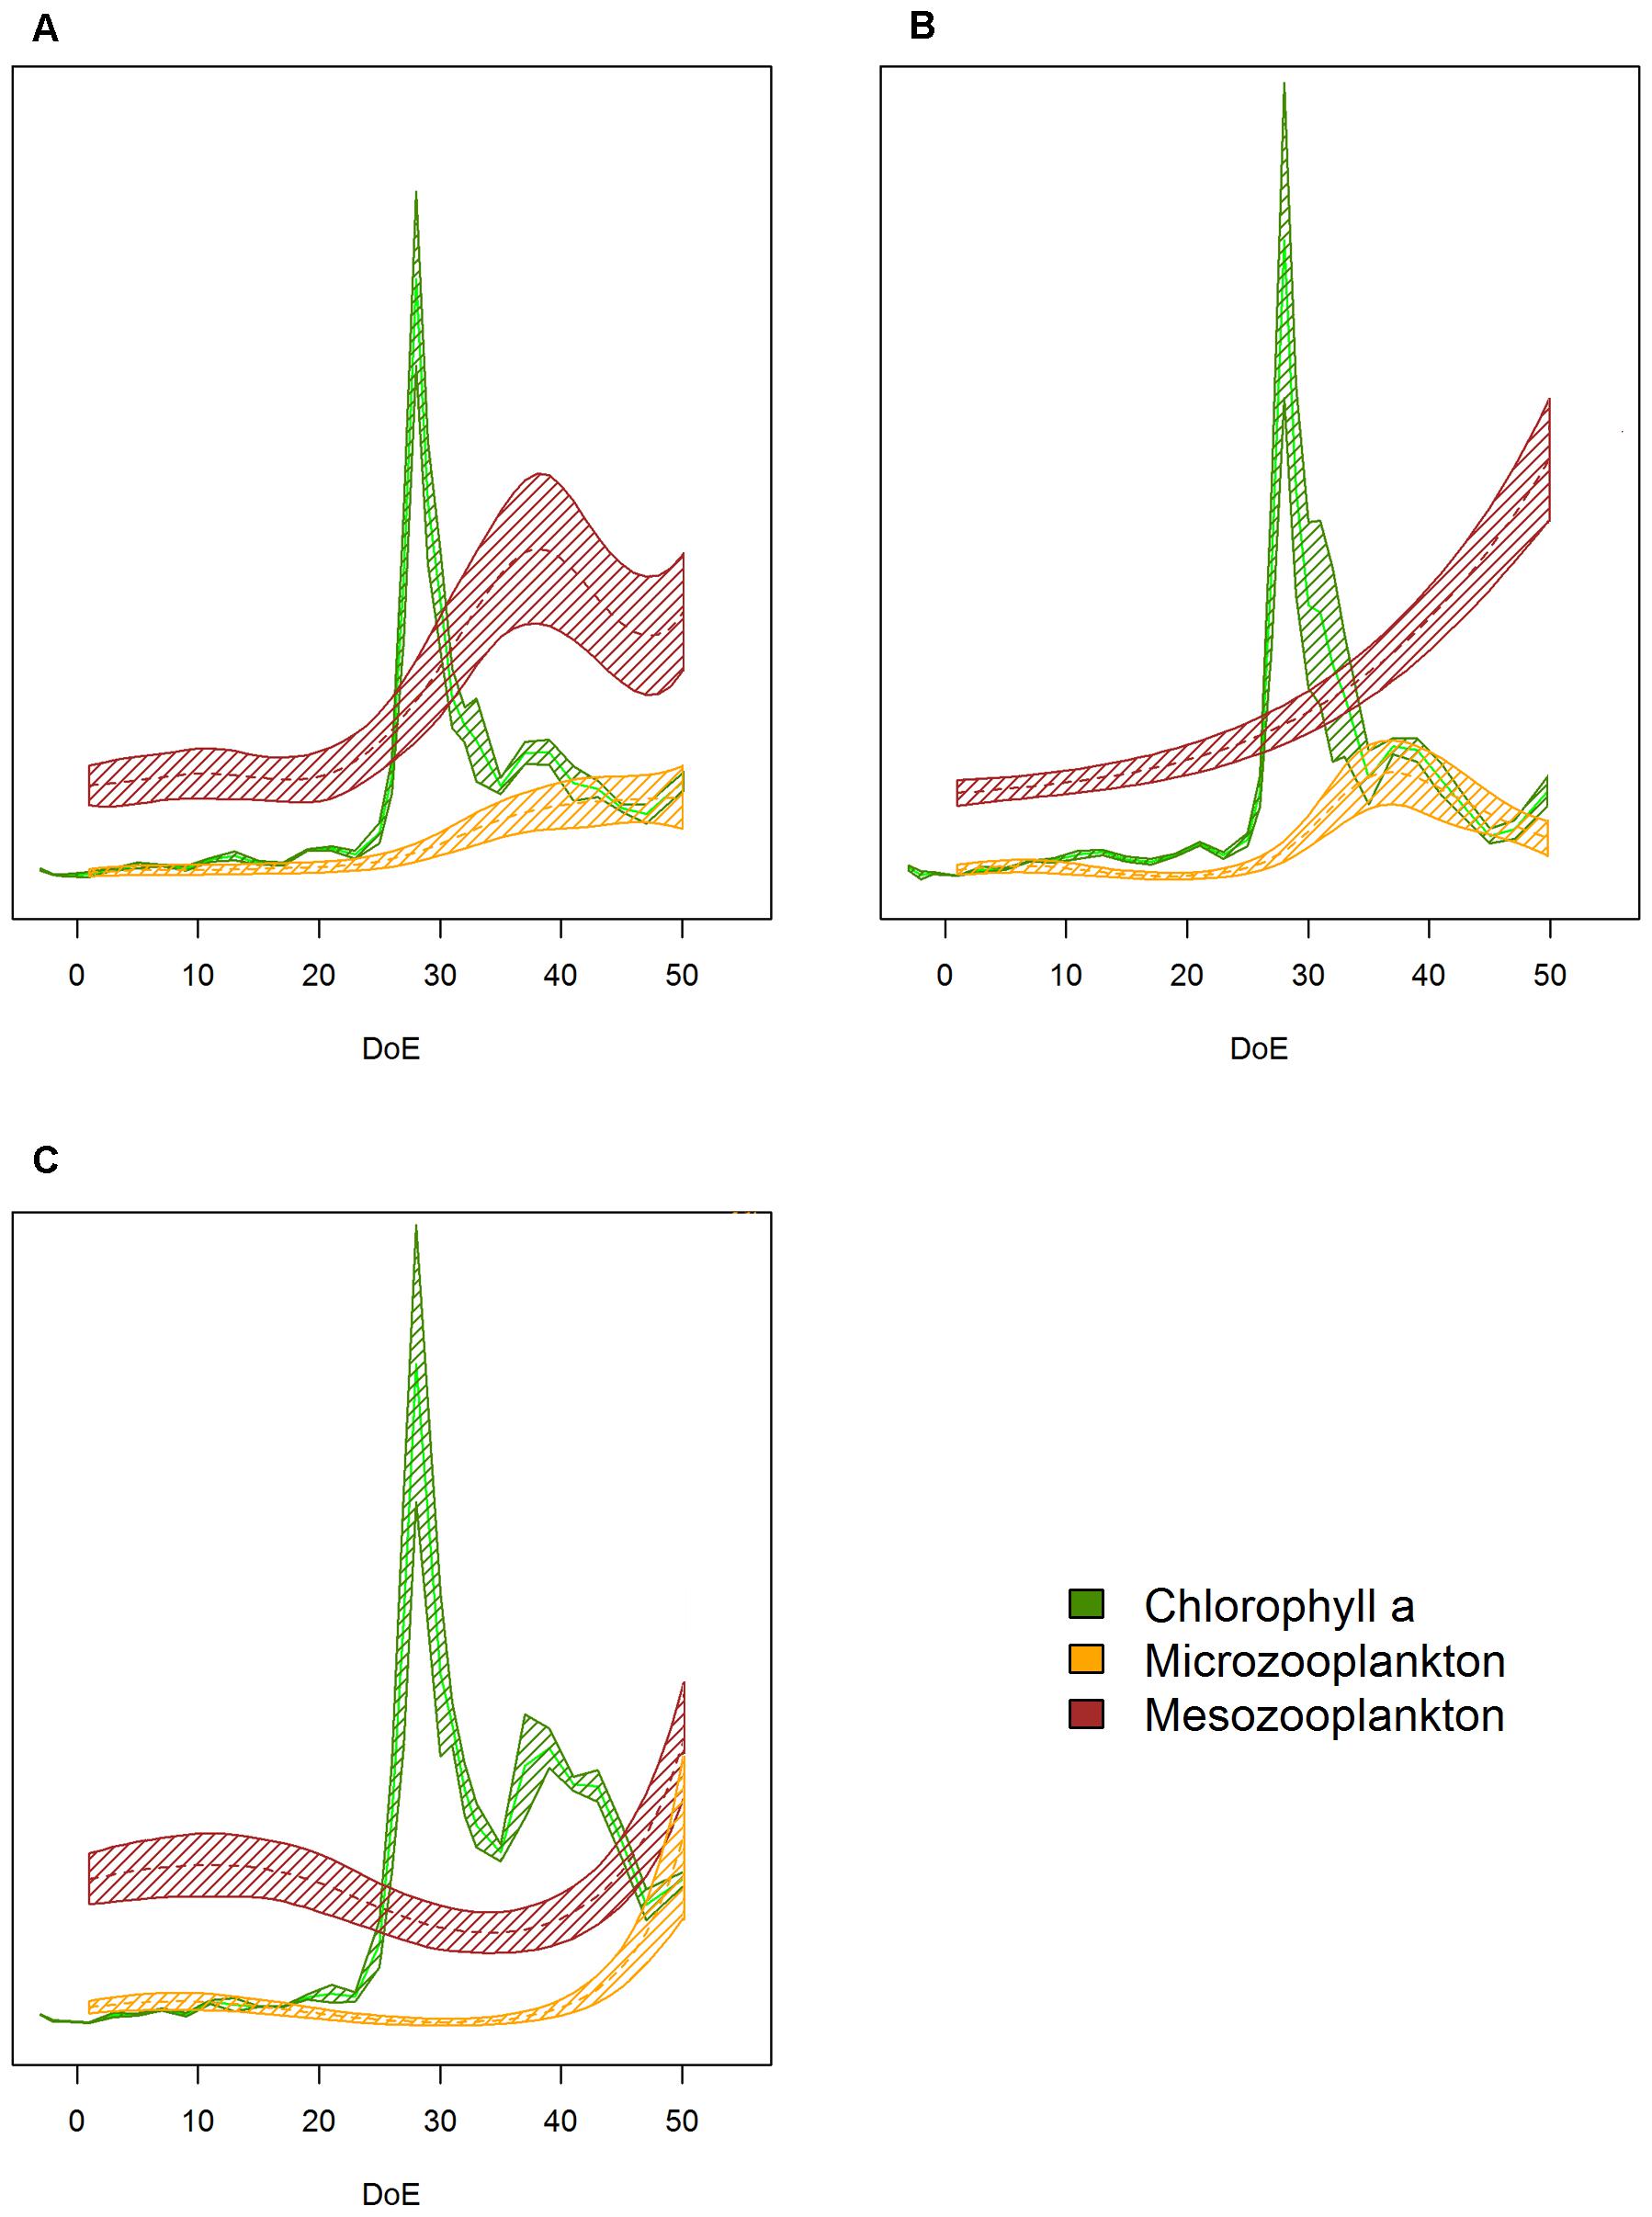
Figure 8. Plankton succession trends. (A) Low-pCO2 treatment, (B) medium- pCO2 treatment, (C) high- pCO2 treatment. Note that trends have been transformed to be in a 0 to 1 scale to enhance plankton succession visibility. Color code: green = Chla, yellow = microZP abundance, burgundy = mesoZP abundance. DoE, day of experiment. Solid lines = prediction from Generalized Additive Mixed Models (GAMMs) (smoother trends p-value < 0.05); shaded area = confidence interval.
Generalized additive mixed models revealed a significant pCO2 effect on the temporal trend of the A:H ratio [s(DoE):Treat, p-value < 0.05, Figure 9]. The model detected highest A:H ratio at the end of the phytoplankton bloom (∼t35) in the high-pCO2 treatment. During the post-bloom phase (i.e., after t35), the A:H ratio responded to the differential increase in microZP and mesoZP abundances (see Figures 3G, 4G). Hence, A:H in high-pCO2 decreased faster than in the other two treatments, overlapping low-pCO2 A:H on t50, when highest values corresponded to medium-pCO2 treatment.
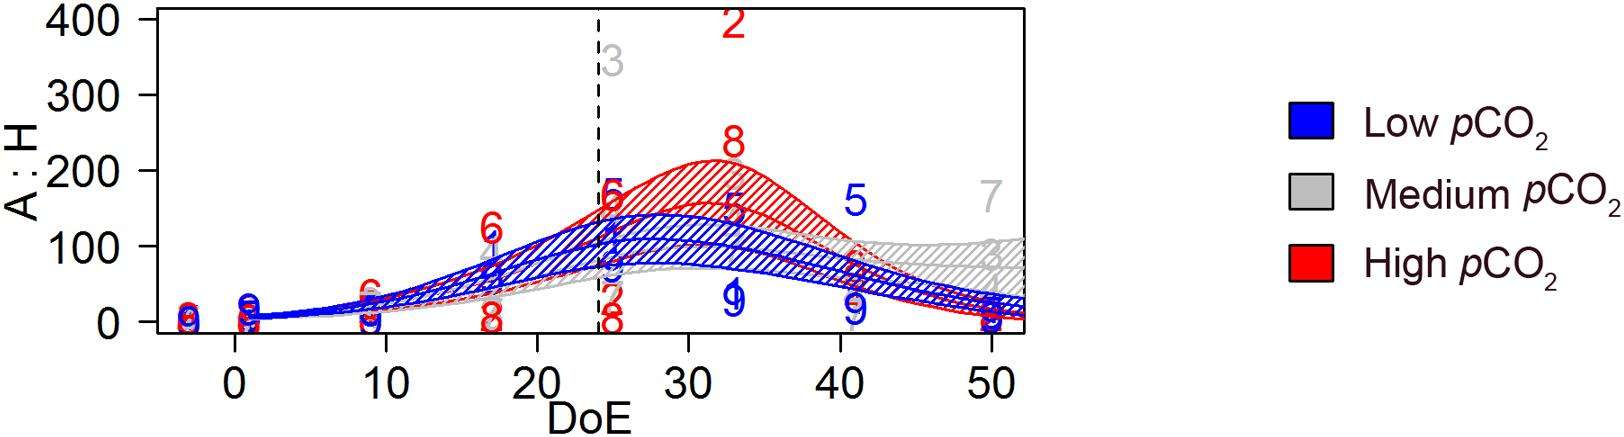
Figure 9. Trophic transfer efficiency; autotrophy versus heterotrophy (A:H). Autotroph: heterotroph biomass ratio based on biomass estimations (μg C L−1). Color code: blue = low-pCO2 (M1, M5, and M9), gray = medium-pCO2 (M3, M4, and M7), red = high-pCO2 (M2, M6, and M8). DoE, day of experiment. Solid lines = prediction from Generalized Additive Mixed Models (GAMMs) (smoother trends p-value < 0.05); shaded area = confidence interval. Dashed line: t24, deep water addition.
Discussion
The main objective of this study was to analyze the effect of OA on the zooplankton community from subtropical waters during pre-bloom, bloom and post-bloom conditions. During the oligotrophic phase of this experiment we could not detect important differences in total zooplankton abundances between the treatments (Figures 3G, 4G). However, after the simulated upwelling, the zooplankton community under high-pCO2 conditions evolved significantly differently compared to the low- and medium-pCO2 conditions (Figure 2). Overall, higher zooplankton abundances were observed at elevated pCO2 conditions (medium- and high-) in the post-bloom phase. This result matches with a previous KOSMOS study in coastal mesotrophic conditions (Bach et al., 2016b) where certain groups of consumers capitalized on CO2-enhanced phytoplankton biomass, resulting in higher zooplankton abundances under moderate IPCC end-of-century pCO2 scenarios (RCP6.0) (Horn et al., 2016; Algueró-Muñiz et al., 2017). However, unexpectedly, both microZP and mesoZP abundances (Figures 3G, 4G) increased much later in the experiment under high-pCO2 than under medium- and low-pCO2. In the following, we will discuss the differences in zooplankton densities as well as the timing of bloom development.
pCO2 Effects on Zooplankton Densities
As reported by other authors (e.g., Isari et al., 2015), responses to OA are not only dependent on species-specific sensitivities, but, much more importantly, depend on CO2 effects on the community and the trophic interactions taking place in a species’ natural habitat. In fact, most of the reported effects of OA on planktonic communities need to be attributed to these community effects, as many indicate a positive effect of OA (or rather carbon availability) on the plankton (Algueró-Muñiz et al., 2017; Taucher et al., 2017b). The temporal trends in major microZP groups (aloricate ciliates, small dinoflagellates) and Calanoida (Figures 3, 4, respectively) were most likely triggered by the food supply for microZP combined with the preference of most copepods for heterotrophic protists (Suzuki et al., 1999; Turner, 2004). As expected, picoplanktonic phytoplankton were a dominant component during the oligotrophic phase and large chain-forming diatoms dominated during the nutrient induced bloom (Taucher et al., 2017a). Diatoms are an ideal food source for larger mesoZP and this direct consumption of mesoZP on phytoplankton might have caused a release of microZP from grazing pressure after the deep-water addition.
The initial microZP abundance, as well as their taxonomic composition, was in agreement with those reported previously for the same area (Ojeda, 1998; Schmoker et al., 2014). During the post-bloom phase, microZP was dominated by dinoflagellates <25 μm and aloricate ciliates. Ciliates and dinoflagellates are the main grazers on phytoplankton in marine systems, especially oligotrophic ones and also contribute to a large part to the copepod diets (Calbet, 2008). This is attributed to their appropriate size and high nutritional quality of microZP relative to phytoplankton (Stoecker and Capuzzo, 1990) and the dominance of small-sized phytoplankton in oligotrophic systems which is outside the food spectrum of many mesozooplankters (Kleppel, 1993). Previous OA studies reported a tolerance of microZP communities toward high CO2 concentrations, or only very subtle changes in the community (Suffrian et al., 2008; Aberle et al., 2013; Horn et al., 2016; Lischka et al., 2017) while other studies showed detrimental (Calbet et al., 2014) or even positive effects (Rose et al., 2009). In this study, an increase in aloricate ciliate abundances was observed in all treatments in response to the deep water-induced phytoplankton bloom, although the increase showed a considerable time-lag relative to the phytoplankton bloom, especially at high CO2 conditions. In contrast to aloricate ciliates, loricate ciliates played a minor role in this experiment and showed only a very small peak during the oligotrophic phase. Loricate ciliates started to decline after t10 and were virtually absent after deep water \addition (see Figure 3).
For dinoflagellates, especially small-sized athecates, we expected a positive effect of high-pCO2 levels due to findings from previous OA studies conducted in oligotrophic (Sala et al., 2015) and eutrophic regions (Horn et al., 2016). During the oligotrophic phase of the experiment, this expectation was confirmed since higher abundances of small athecate dinoflagellates at high-pCO2 were also found in our study. However, after deep water addition overall dinoflagellate abundances were higher at low- and medium-pCO2 conditions. Unlike ciliates, heterotrophic dinoflagellates are known to feed on phytoplankton of various sizes up to several times larger than their body size and have been shown to prey on bloom-forming diatoms including taxa as, e.g., Thalassiosira (Sherr and Sherr, 2007). The abundance of diatoms, however, was higher at high-pCO2 compared to the low- and medium-pCO2 conditions (Taucher et al., 2017a). Thus, the effect of high pCO2 on dinoflagellates was most likely an indirect one based on changes in the phytoplankton community and more precisely, on prey edibility (see section “pCO2 Effects on Zooplankton Bloom Timing”).
Calanoida were positively affected by medium- and high-pCO2, although the trend was only visible during the last two sampling days. These results match with previous outcomes described for copepodites and adult Pseudocalanus acuspes in eutrophic waters and pCO2 levels of ∼760 μatm (Algueró-Muñiz et al., 2017; Taucher et al., 2017b), suggesting a benefit of realistic end-of-century pCO2 levels on calanoid copepods through higher food availability. Small planktonic copepods are dominant in the plankton communities in many parts of the world’s oceans and therefore important members of pelagic food webs (Turner, 2004). Thus, a positive pCO2 effect on these major zooplankton components could have a crucial impact on the transfer of energy to higher trophic levels thus affecting, e.g., future fisheries (Moyano et al., 2009; Sswat et al., 2018).
Copepod species that do not exhibit vertical migration behavior are considered as evolutionarily less exposed to high-pCO2 levels compared to other copepods, and typically more sensitive to OA (Fitzer et al., 2012; Lewis et al., 2013). Accordingly, we expected cyclopoid (dominated by Oithona) and harpacticoid copepods (dominated by Microsetella) to show lower abundances under elevated pCO2 conditions as neither species shows diel migration (Maar et al., 2006). However, during this experiment, elevated pCO2 did not cause a significant effect on Cyclopoida and Harpacticoida abundances, according to the GAMM analyses (Figures 4B,C). The reason for the decay in Cyclopoida and Harpacticoida abundances is not entirely clear but could be due to the distribution of the copepods in the water column, closer to the mesocosm sediment traps. Such a loss through sedimentation was previously observed in other mesocosm experiments during periods of low food availability (Bach et al., 2016a; Algueró-Muñiz et al., 2017). Oithona and Microsetella have been reported to concentrate on marine snow (Ohtsuka et al., 1993; Koski et al., 2005) and during the present experiment, the cumulative flux of particulate organic matter to the sediment traps increased after deep water addition (Stange et al., 2018). This might have promoted a downward migration of Microsetella —already from the beginning of the experiment on — to enhance their feeding on sinking material, preventing us to sample them in the net hauls.
pCO2 Effects on Zooplankton Bloom Timing
Where the observed response of the zooplankton densities is in line with previously published results, the differences in timing of the blooms were rather unexpected. In fact, zooplankton density increases after the simulated upwelling under high-pCO2 treatment were much slower than under the low and medium treatments. The most probable explanation for this observation lies in the differences in taxonomy of the phytoplankton responding to the nutrient addition of the upwelling. The phytoplankton bloom in the high-pCO2 mesocosms (M2 and M8) was dominated by Vicicitus globosus (Dictyochophyceae) which bloomed only in the high-pCO2 mesocosms from t25 until t47 (Riebesell et al., 2018). Harmful or non-edible for zooplankton, it seems likely that V. globosus caused adverse effects on the plankton community. MicroZP as potential grazers were most likely affected by the inadequacy of the available phytoplankton food (Chang, 2015), thus preventing the subsequent increase in mesoZP abundances. This is even more likely considering that once the phytoplankton bloom ceased in the high-pCO2 treatments, microZP started to increase in numbers at a time point when they were already decreasing at low and medium-pCO2. The tolerance to harmful algae has previously been described for copepod species closely related to those recorded in the mesocosms such as Paracalanus parvus (tolerant to Chattonella antiqua) and Oncaea venusta (tolerant to Karenia brevis) (Turner and Tester, 1989). Although Paracalanus sp. nauplii may exhibit adverse effects from feeding upon Alexandrium tamiyavanichii (Silva et al., 2013), we did not detect negative effects on nauplii abundances when relating them to the harmful algae abundance, but a delay in the reaction time likewise in aloricate ciliates, dinoflagellates and calanoid copepods. Accordingly, we based our conclusions for copepods on temporal trends and pCO2 treatments rather than on possible effects of inedible/harmful food items. Our results suggest that copepods reacted to the different pCO2 levels only after their preferred prey [i.e., heterotrophic protists (Turner, 2004)] reacted to the stimulated bloom, thus highlighting the importance of microZP in bloom situations within oligotrophic ecosystems (Calbet and Alcaraz, 2007; Calbet, 2008).
pCO2 Effects on Oncaea and O. dioica Interactions in Pre- and Post-bloom Conditions
Oncaea’s feeding strategies are associated with surface materials, such as fine particles, bacteria, or the tegument fluid of gelatinous zooplankton (Sagitta spp., Oikopleura spp. and Salpa spp.) (Go et al., 1998). During this study, abundances of Oncaea spp. and O. dioica were inversely correlated, as previously observed at other study sites (Itoh et al., 2014). Oncaea was positively affected by pCO2, recording higher abundances under medium- and high-pCO2 treatments from (approximately) the beginning of the experiment until the end of the phytoplankton bloom, on t35 (Figure 4D). The O. dioica trends showed some similarities with other studies at elevated nutrient concentrations (Troedsson et al., 2013). We did not detect a significant pCO2 effect on O. dioica when considering the whole experimental period (Figure 4F), what agrees with previous results from Troedsson et al. (2013) and Winder et al. (2017) on the tolerance of appendicularians to OA. After deep water addition, we observed that O. dioica completely disappeared under high-pCO2 while Oncaea abundances were higher than in the other two treatments, suggesting a top-down control of Oncaea on O. dioica abundances. Hence, the fact that during the last sampling days Oncaea spp. abundances decayed in the high-pCO2 treatment might reflect the scarcity of O. dioica as food resource (Go et al., 1998).
Concerning the condition of Oncaea females (Figures 6, 7), we observed smaller individuals, as well as a higher number of immature females and a lower number of egg-carrying mature females in the high-pCO2 treatment. These results are in line with previous studies in calanoid copepods which also observed a decrease in copepod size (Garzke et al., 2015) and fecundity loss (Thor and Dupont, 2015) caused by increased CO2 levels. However, unlike the major sensitivities to OA previously described for early life stages of calanoid copepods (Pedersen et al., 2013; Algueró-Muñiz et al., 2017), we did not observe a stronger pCO2 effect on Oncaea copepodites than on adults (Figure 5), suggesting differences between poecilostomatoids and calanoids in their offspring responses to expected future OA levels. We conclude that the negative pCO2 effect detected on Oncaea females’ reproductive output might affect food web interactions in the long term in those tropical and subtropical communities dominated by this species (e.g., Böttger-Schnack, 1994), especially in those where oncaeid copepods are the main prey for larvae and juvenile fish (Itoh et al., 2014). The lack of published OA research on Oncaea spp. (Poecilostomatoida) makes the analysis presented here of special relevance and calls for multigenerational OA studies on this species.
Influence of OA on the Transfer of Energy Within the Plankton Community
As discussed above, community effects and trophic interactions can alter sensitivities to OA (Rossoll et al., 2013), which in turn may have an effect on the efficiency of the food web (Calbet et al., 2014; Cripps et al., 2016; Algueró-Muñiz et al., 2017). The autotrophic community was expected to experience an increase in biomass (Gismervik et al., 2002) responding to the nutrient input created by the deep water addition. Thus, a significant effect of CO2 on plankton succession was observed after deep water addition (Taucher et al., 2017a), suggesting that phytoplankton blooms are boosted at elevated pCO2. This situation could in turn cause a CO2-dependant reduction in trophic efficiency after deep water addition, due to the limited capacity of micro- and mesoZP grazers to exploit the elevated phytoplankton productivity (Calbet et al., 2014). Accordingly, the A:H ratio (autotrophy/heterotrophy) proposed as a proxy for the trophic efficiency of the system was highest during the phytoplankton built-up at high-pCO2. TTE decreased in all three pCO2 treatments during the phytoplankton bloom (t25–t35), and lowest TTE was detected under high-pCO2 conditions, likely because under these conditions microZP was limited by inadequate food items thus leading to a delayed response of microZP after phytoplankton bloom initiation, consequently affecting mesoZP production. These results are in line with previous studies (Calbet et al., 2014; Cripps et al., 2016) which point at a more-autotrophic and less efficient food web under higher pCO2 conditions when the consumers mismatch the phytoplankton bloom (Edwards and Richardson, 2004; Calbet et al., 2014), as observed during this experiment until ∼t40. Similarly than Calbet et al. (2014) and Cripps et al. (2016), we did not account for nanoplankton to estimate TTE in our study, what might have incurred in an underestimation of the system efficiency when considering phytoplankton as the only carbon source for zooplankton. The increase in calanoid copepod abundance observed in both high- and medium-pCO2 treatments toward the end of the experiment points at pCO2-induced effects under nutrient-replete conditions, which could travel up the food web reaching secondary consumers, as previously observed in eutrophic systems (Algueró-Muniz, 2017; Sswat et al., 2018). In case of the medium-pCO2 treatment, an increased grazing pressure of copepods (Calanoida) on dinoflagellates could explain that TTE in medium-pCO2 was lower than in the other two treatments after the phytoplankton bloom. Our results thus suggest that pCO2 effects on plankton succession depend on the coupling of the phytoplankton bloom with microZP and mesoZP grazers, ultimately affecting the development of the plankton community and the energy transfer efficiency of the system.
Based on this study, end-of-century pCO2 levels are not expected to cause major effects on subtropical zooplankton communities during oligotrophic phases. However, during bloom and post-bloom conditions, elevated pCO2 might promote higher zooplankton abundances by bottom-up effects of CO2-enhanced primary production. Hence, pCO2-fertilized phytoplankton productivity would reach grazers through trophic cascades, which might in turn be disrupted when CO2 benefits harmful algae. These pCO2 effects on plankton communities could be specially relevant in oligotrophic environments with short bloom periods such as the Canary Islands, where zooplankton biomass has been shown to have direct implications on larval abundance in different fish species during late winter bloom (Moyano et al., 2009). Therefore, a positive effect of pCO2 on zooplankton abundance after a bloom event might eventually benefit larval recruitment, and consequently have an effect on future fisheries.
Data Availability
All zooplankton abundance data are archived at the PANGEA data library, https://doi.pangaea.de/10.1594/PANGAEA.887283.
Ethics Statement
No specific permission was required for activities related to field sampling. The field location was not privately owned or protected, and neither regulated animals, endangered nor protected species were involved.
Author Contributions
UR, MA-M, HH, NA, LB, WG, EA, and MB conceived and designed the experiments. MA-M, HH, CS, LB, WG, and UR performed the experiments. MA-M, HH, SA-F, LB, WG, and EA analyzed the data. MA-M and HH contributed equally to this work. MA-M wrote this paper with input from all co-authors.
Funding
Financial support for this study was provided by the German Ministry of Education and Research through phase II (BMBF, FKZ 03F0655A and 03F0655B) and III (BMBF, FKZ 03F0728B) of the BIOACID (Biological Impacts of Ocean ACIDification) project.
Conflict of Interest Statement
The authors declare that the research was conducted in the absence of any commercial or financial relationships that could be construed as a potential conflict of interest.
Acknowledgments
We want to acknowledge the Plataforma Oceánica de Canarias (PLOCAN) for hosting and supporting us during this experiments. We also want to thank the Captain and crew of RV Hespérides for deploying and recovering the mesocosms (cruise 29HE20140924), as well as RV Poseidon for transporting the mesocosms and supporting in testing the deep-water collector (cruise POS463). We are grateful to “The Gran Canaria KOSMOS Consortium” (Taucher et al., 2017a) for all the help and support received during on-site work. We also thank Saskia Ohse for technical support with carbon content analyses, Barbara Niehoff for her advice on Oncaea condition analyses and Silke Lischka for calcifiers abundances data.
Supplementary Material
The Supplementary Material for this article can be found online at: https://www.frontiersin.org/articles/10.3389/fmars.2019.00061/full#supplementary-material
References
Aberle, N., Schulz, K. G., Stuhr, A., Malzahn, A. M., Ludwig, A., and Riebesell, U. (2013). High tolerance of microzooplankton to ocean acidification in an Arctic coastal plankton community. Biogeosciences 10, 1471–1481. doi: 10.5194/bg-10-1471-2013
Algueró-Muniz, M. (2017). Zooplankton Community Responses to Ocean Acidification. Ph.D. thesis, Universiy of Bremen, Bremen Available at: https://elib.suub.uni-bremen.de/peid/D00106079.html
Algueró-Muñiz, M., Alvarez Fernandez, S., Thor, P., Bach, L. T., Esposito, M., Horn, H. G., et al. (2017). Ocean acidification effects on mesozooplankton community development: results from a long-term mesocosm experiment. PLoS One 12:e0175851. doi: 10.1371/journal.pone.0175851
Alvarez-Fernandez, S., Bach, L. T., Taucher, J., Riebesell, U., Sommer, U., Aberle, N., et al. (2018). Plankton responses to ocean acidification: the role of nutrient limitation. Progr. Oceanogr. 165, 11–18. doi: 10.1016/j.pocean.2018.04.006
Arístegui, J., Hernández-León, S., Montero, M. F., and Gómez, M. (2001). The seasonal planktonic cycle in coastal waters of the Canary Islands. Sci. Mar. 65, 51–58. doi: 10.3989/scimar.2001.65s151
Bach, L. T., Boxhammer, T., Larsen, A., Hildebrandt, N., Schulz, K. G., and Riebesell, U. (2016a). Influence of plankton community structure on the sinking velocity of marine aggregates. Glob. Biogeochem. Cycles 30, 1145–1165. doi: 10.1002/2016GB005372
Bach, L. T., Taucher, J., Boxhammer, T., Ludwig, A., Consortium, T. K. K., Achterberg, E. P., et al. (2016b). Influence of ocean acidification on a natural winter-to-summer plankton succession: First insights from a long-term mesocosm study draw attention to periods of low nutrient concentrations. PLoS One 11:e0159068. doi: 10.1371/journal.pone.0159068
Boersma, M., Aberle, N., Hantzsche, F. M., Schoo, K. L., Wiltshire, K. H., and Malzahn, A. M. (2008). Nutritional limitation travels up the food chain. Int. Rev. Hydrobiol. 93, 479–488. doi: 10.1002/iroh.200811066
Böttger-Schnack, R. (1994). The microcopepod fauna in the Eastern Mediterranean and Arabian Seas: a comparison with the Red Sea fauna. Hydrobiologia 292, 271–282. doi: 10.1007/bf00229951
Boxhammer, T., Bach, L. T., Czerny, J., and Riebesell, U. (2016). Technical note: sampling and processing of mesocosm sediment trap material for quantitative biogeochemical analysis. Biogeosciences 13, 2849–2858. doi: 10.5194/bg-13-2849-2016
Buttigieg, P. L., and Ramette, A. (2014). A guide to statistical analysis in microbial ecology: a community-focused, living review of multivariate data analyses. FEMS Microbiol. Ecol. 90, 543–550. doi: 10.1111/1574-6941.12437
Calbet, A. (2008). The trophic roles of microzooplankton in marine systems. ICES J. Mar. Sci. 65, 325–331. doi: 10.1093/icesjms/fsn013
Calbet, A., and Alcaraz, M. (2007). “Microzooplankton, key organisms in the pelagic food web,” in Fisheries and Aquaculture: Towards Sustainable Aquatic Living Resources Management, ed. P. Safran (Oxford: Enciclopedia of Life Support Systems (EOLSS) UNESCO Eolss Publishers).
Calbet, A., Alcaraz, M., Saiz, E., Estrada, M., and Trepat, I. (1996). Planktonic herbivorous food webs in the Catalan Sea (NW Mediterranean): temporal variability and comparison of indices of phyto-zooplankton coupling based on state variables and rate processes. J. Plankton Res. 18, 2329–2347. doi: 10.1093/plankt/18.12.2329
Calbet, A., Sazhin, A. F., Nejstgaard, J. C., Berger, S. A., Tait, Z. S., Olmos, L., et al. (2014). Future climate scenarios for a coastal productive planktonic food web resulting in microplankton phenology changes and decreased trophic transfer efficiency. PLoS One 9:e94388. doi: 10.1371/journal.pone.0094388
Chang, F. (2015). Cytotoxic Effects of Vicicitus globosus (Class Dictyochophyceae) and Chattonella marina (Class Raphidophyceae) on rotifers and other microalgae. J. Mar. Sci. Eng. 3:401. doi: 10.3390/jmse3020401
Cianca, A., Helmke, P., Mouriño, B., Rueda, M. J., Llinás, O., and Neuer, S. (2007). Decadal analysis of hydrography and in situ nutrient budgets in the western and eastern North Atlantic subtropical gyre. J. Geophys. Res. 112:C07025. doi: 10.1029/2006JC003788
Clarke, K. R. (1993). Non-parametric multivariate analyses of changes in community structure. Aust. J. Ecol. 18, 117–143. doi: 10.1111/j.1442-9993.1993.tb00438.x
Cripps, G., Flynn, K. J., and Lindeque, P. K. (2016). Ocean acidification affects the phyto-zoo plankton trophic transfer efficiency. PLoS One 11:e0151739. doi: 10.1371/journal.pone.0151739
de León, A. R., and Braun, J. G. (1973). Annual cycle of primary production and its relation to nutrients in the Canary Islands waters. Boln. Inst. Esp. Oceanogr. 167, 1–24.
Edwards, M., and Richardson, A. J. (2004). Impact of climate change on marine pelagic phenology and trophic mismatch. Nature 430, 881–884. doi: 10.1038/nature02808
Fitzer, S. C., Caldwell, G. S., Close, A. J., Clare, A. S., Upstill-Goddard, R. C., and Bentley, M. G. (2012). Ocean acidification induces multi-generational decline in copepod naupliar production with possible conflict for reproductive resource allocation. J. Exp. Mar. Biol. Ecol. 41, 30–36. doi: 10.1016/j.jembe.2012.03.009
Garzke, J., Ismar, S. M. H., and Sommer, U. (2015). Climate change affects low trophic level marine consumers: warming decreases copepod size and abundance. Oecologia 177, 849–860. doi: 10.1007/s00442-014-3130-4
Gazeau, F., Sallon, A., Maugendre, L., Louis, J., Dellisanti, W., Gaubert, M., et al. (2017). First mesocosm experiments to study the impacts of ocean acidification on plankton communities in the NW Mediterranean Sea (MedSeA project). Estuar. Coast. Shelf Sci. 186(Part A), 11–29. doi: 10.1016/j.ecss.2016.05.014
Gismervik, I., Olsen, Y., and Vadstein, O. (2002). Micro- and mesozooplankton response to enhanced nutrient input – a mesocosm study. Hydrobiologia 484, 75–87. doi: 10.1023/a:1021300920641
Go, Y.-B., Oh, B.-C., and Terazaki, M. (1998). Feeding behavior of the poecilostomatoid copepods Oncaea spp. on chaetognaths. J. Mar. Syst. 15, 475–482. doi: 10.1016/S0924-7963(97)00038-9
Guan, W. (2018). KOSMOS 2014 Mesocosm Study: Phytoplankton Abundance, Pangaea. Available at: https://doi.pangaea.de/10.1594/PANGAEA.879600.
Guinotte, J. M., and Fabry, V. J. (2008). “Ocean acidification and its potential effects on marine ecosystems,” in Year in Ecology and Conservation Biology 2008, eds R. S. Ostfeld and W. H. Schlesinger (New York, NY: Annals of the New York Academy of Sciences), 320–342. doi: 10.1196/annals.1439.013
Harley, C. D. G. (2011). Climate change, keystone predation, and biodiversity loss. Science 334, 1124–1127. doi: 10.1126/science.1210199
Hernández-León, S. (1998). Annual cycle of epiplanktonic copepods in Canary Island waters. Fish. Oceanogr. 7, 252–257. doi: 10.1046/j.1365-2419.1998.00071.x
Hernández-León, S. (2009). Top-down effects and carbon flux in the ocean: a hypothesis. J. Mar. Syst. 78, 576–581. doi: 10.1016/j.jmarsys.2009.01.001
Hernández-León, S., Almeida, C., Bécognée, P., Yebra, L., and Arístegui, J. (2004). Zooplankton biomass and indices of grazing and metabolism during a late winter bloom in subtropical waters. Mar. Biol. 145, 1191–1200. doi: 10.1007/s00227-004-1396-5
Hernández-León, S., Almeida, C., Gómez, M., Torres, S., Montero, I., and Portillo-Hahnefeld, A. (2001). Zooplankton biomass and indices of feeding and metabolism in island-generated eddies around Gran Canaria. J. Mar. Syst. 30, 51–66. doi: 10.1016/S0924-7963(01)00037-9
Hernández-León, S., Gómez, M., and Arístegui, J. (2007). Mesozooplankton in the Canary Current System: the coastal–ocean transition zone. Progr. Oceanogr. 74, 397–421. doi: 10.1016/j.pocean.2007.04.010
Hillebrand, H., Dürselen, C.-D., Kirschtel, D., Pollingher, U., and Zohary, T. (1999). Biovolume calculation for pelagic and benthic microalgae. J. Phycol. 35, 403–424. doi: 10.1046/j.1529-8817.1999.3520403.x
Horn, H. G., Sander, N., Stuhr, A., Algueró-Muñiz, M., Bach, L. T., Löder, M. G. J., et al. (2016). Low CO2 sensitivity of microzooplankton communities in the Gullmar Fjord, Skagerrak: evidence from a long-term mesocosm study. PLoS One 11:e0165800. doi: 10.1371/journal.pone.0165800
Huskin, I., Anadón, R., Medina, G., Head, R. N., and Harris, R. P. (2001). Mesozooplankton distribution and copepod grazing in the subtropical Atlantic near the Azores: influence of mesoscale structures. J. Plankton Res. 23, 671–691. doi: 10.1093/plankt/23.7.671
IPCC (2013). “Climate change 2013: the physical science basis,” in Contribution of Working Group I to the Fifth Assessment Report of the Intergovernmental Panel on Climate Change, eds T.F. Stocker, D. Qin, G.-K. Plattner, M. Tignor, S.K. Allen, J. Boschung et al. (Cambridge: Cambridge University Press).
Isari, S., Zervoudaki, S., Peters, J., Papantoniou, G., Pelejero, C., and Saiz, E. (2015). Lack of evidence for elevated CO2-induced bottom-up effects on marine copepods: a dinoflagellate–calanoid prey–predator pair. ICES. J. Mar. Sci. 73, 650–658. doi: 10.1093/icesjms/fsv078
Itoh, H., Nakata, K., Sasaki, K., Ichikawa, T., and Hidaka, K. (2014). Seasonal and diel changes in the vertical distribution of oncaeid copepods in the epipelagic zone of the Kuroshio Extension region. Plankton Benthos Res. 9, 1–14. doi: 10.3800/pbr.9.1
Jain, A. K. (2010). Data clustering: 50 years beyond K-means. Pattern Recognit. Lett. 31, 651–666. doi: 10.1016/j.patrec.2009.09.011
Kemp, W. M., Brooks, M. T., and Hood, R. R. (2001). Nutrient enrichment, habitat variability and trophic transfer efficiency in simple models of pelagic ecosystems. Mar. Ecol. Progr. Ser. 223, 73–87. doi: 10.3354/meps223073
Kleppel, G. S. (1993). On the diets of calanoid copepods. Mari. Ecol. Progr. Ser. 99, 183–195. doi: 10.3354/meps099183
Koski, M., Kiørboe, T., and Takahashi, K. (2005). Benthic life in the pelagic: aggregate encounter and degradation rates by pelagic harpacticoid copepods. Limnol. Oceanogr. 50, 1254–1263. doi: 10.4319/lo.2005.50.4.1254
Kroeker, K. J., Kordas, R. L., Crim, R., Hendriks, I. E., Ramajo, L., Singh, G. S., et al. (2013). Impacts of ocean acidification on marine organisms: quantifying sensitivities and interaction with warming. Glob. Change Biol. 19, 1884–1896. doi: 10.1111/gcb.12179
Leblanc, K., Arístegui, J., Armand, L., Assmy, P., Beker, B., Bode, A., et al. (2012). A global diatom database: abundance, biovolume and biomass in the world ocean. Earth Syst. Sci. Data 4, 149–165. doi: 10.5194/essd-4-149-2012
Legendre, P., and Anderson, M. J. (1999). Distance-based redundancy analysis: testing multispecies responses in multifactorial ecological experiments. Ecol. Monogr. 69, 1–24. doi: 10.1890/0012-9615(1999)069[0001:DBRATM]2.0.CO;2
Lesniowski, T. J., Gambill, M., Holst, S., Peck, M. A., Algueró-Muñiz, M., Haunost, M., et al. (2015). Effects of food and CO2 on growth dynamics of polyps of two scyphozoan species (Cyanea capillata and Chrysaora hysoscella). Mar. Biol. 162, 1371–1382. doi: 10.1007/s00227-015-2660-6
Lewis, C. N., Brown, K. A., Edwards, L. A., Cooper, G., and Findlay, H. S. (2013). Sensitivity to ocean acidification parallels natural pCO2 gradients experienced by Arctic copepods under winter sea ice. Proc. Natl. Acad. Sci. U.S.A. 110, E4960–E4967. doi: 10.1073/pnas.1315162110
Lischka, S., Bach, L. T., Schulz, K. G., and Riebesell, U. (2017). Ciliate and mesozooplankton community response to increasing CO2 levels in the Baltic Sea: insights from a large-scale mesocosm experiment. Biogeosciences 14, 447–466. doi: 10.5194/bg-14-447-2017
Lischka, S., Büdenbender, J., Boxhammer, T., and Riebesell, U. (2011). Impact of ocean acidification and elevated temperatures on early juveniles of the polar shelled pteropod Limacina helicina: mortality, shell degradation, and shell growth. Biogeosciences 8, 919–932. doi: 10.5194/bg-8-919-2011
Lischka, S., Stange, P., and Riebesell, U. (2018). Response of pelagic calcifiers (Foraminifera, Thecosomata) to ocean acidification during oligotrophic and simulated up-welling conditions in the Subtropical North Atlantic off Gran Canaria. Front. Mar. Sci. 5:379. doi: 10.3389/fmars.2018.00379
Maar, M., Visser, A. W., Nielsen, T. G., Stips, A., and Saito, H. (2006). Turbulence and feeding behaviour affect the vertical distributions of Oithona similis and Microsetella norwegica. Mar. Ecol. Progr. Ser. 313, 157–172. doi: 10.3354/meps313157
Menden-Deuer, S., and Lessard, E. J. (2000). Carbon to volume relationships for dinoflagellates, diatoms, and other protist plankton. Limnol. Oceanogr. 45, 569–579. doi: 10.4319/lo.2000.45.3.0569
Menzel, D. W., and Ryther, J. H. (1961). Zooplankton in the Sargasso Sea off Bermuda and its relation to organic production. J. Conseil 26, 250–258. doi: 10.1093/icesjms/26.3.250
Meunier, C. L., Algueró-Muñiz, M., Horn, H. G., Lange, J. A. F., and Boersma, M. (2016). Direct and indirect effects of near-future pCO2 levels on zooplankton dynamics. Mar. Freshw. Res. 68, 373–380. doi: 10.1071/MF15296
Montagnes, D. J. S., Strüder-Kype, M. C., Kype, M. R., Agatha, S., and Warwick, J. (2001). The Planktonic Ciliate Project: The User-Friendly Guide to Coastal Planktonic Ciliates. Available at: http://www.zooplankton.cn/ciliate
Moyano, M., Rodríguez, J. M., and Hernández-León, S. (2009). Larval fish abundance and distribution during the late winter bloom off Gran Canaria Island, Canary Islands. Fish. Oceanogr. 18, 51–61. doi: 10.1111/j.1365-2419.2008.00496.x
Niehoff, B., Schmithusen, T., Knuppel, N., Daase, M., Czerny, J., and Boxhammer, T. (2013). Mesozooplankton community development at elevated CO2 concentrations: results from a mesocosm experiment in an Arctic fjord. Biogeosciences 10, 1391–1406. doi: 10.5194/bg-10-1391-2013
Ohtsuka, S., Kubo, N., Okada, M., and Gushima, K. (1993). Attachment and feeding of pelagic copepods on larvacean houses. J. Oceanogr. 49, 115–120. doi: 10.1007/bf02234012
Ojeda, A. (1998). Dinoflagelados de Canarias. Estudio taxonómico y ecológico. Ph.D. thesis, University of Las Palmas de Gran Canaria, Las Palmas.
Paul, A. J., Bach, L. T., Schulz, K. G., Boxhammer, T., Czerny, J., Achterberg, E. P., et al. (2015). Effect of elevated CO2 on organic matter pools and fluxes in a summer Baltic Sea plankton community. Biogeosciences 12, 6181–6203. doi: 10.5194/bg-12-6181-2015
Pedersen, S. A., Hansen, B. H., Altin, D., and Olsen, A. J. (2013). Medium-term exposure of the North Atlantic copepod Calanus finmarchicus (Gunnerus, 1770) to CO2-acidified seawater: effects on survival and development. Biogeosciences 10, 7481–7491. doi: 10.5194/bg-10-7481-2013
Putt, M., and Stoecker, D. K. (1989). An experimentally determined carbon: volume ratio for marine “oligotrichous” ciliates from estuarine and coastal waters. Limnol. Oceanogr. 34, 1097–1103. doi: 10.4319/lo.1989.34.6.1097
Queirós, A. M., Fernandes, J. A., Faulwetter, S., Nunes, J., Rastrick, S. P. S., Mieszkowska, N., et al. (2015). Scaling up experimental ocean acidification and warming research: from individuals to the ecosystem. Glob. Change Biol. 21, 130–143. doi: 10.1111/gcb.12675
Quevedo, M., and Anadón, R. (2001). Protist control of phytoplankton growth in the subtropical north-east Atlantic. Mar. Ecol. Progr. Ser. 221, 29–38. doi: 10.3354/meps221029
Riebesell, U., Aberle-Malzahn, N., Achterberg, E. P., Algueró-Muñiz, M., Alvarez-Fernandez, S., Arístegui, J., et al. (2018). Toxic algal bloom induced by ocean acidification disrupts the pelagic food web. Nat. Clim. Change 8, 1082–1086. doi: 10.1038/s41558-018-0344-1
Riebesell, U., Czerny, J., von Bröckel, K., Boxhammer, T., Büdenbender, J., Deckelnick, M., et al. (2013). Technical Note: a mobile sea-going mesocosm system – new opportunities for ocean change research. Biogeosciences 10, 1835–1847. doi: 10.5194/bg-10-1835-2013
Riebesell, U., and Gattuso, J.-P. (2015). Lessons learned from ocean acidification research. Nat. Clim. Change 5, 12–14. doi: 10.1038/nclimate2456
Rose, J. M., Feng, Y., Gobler, C. J., Gutierrez, R., Hare, C. E., Leblanc, K., et al. (2009). Effects of increased pCO2 and temperature on the North Atlantic spring bloom. II. Microzooplankton abundance and grazing. Mar. Ecol. Progr. Ser. 388, 27–40. doi: 10.3354/meps08134
Rossoll, D., Bermudez, R., Hauss, H., Schulz, K. G., Riebesell, U., Sommer, U., et al. (2012). Ocean acidification-induced food quality deterioration constrains trophic transfer. PLoS One 7:e34737. doi: 10.1371/journal.pone.0034737
Rossoll, D., Sommer, U., and Winder, M. (2013). Community interactions dampen acidification effects in a coastal plankton system. Mar. Ecol. Progr. Ser. 486, 37–46. doi: 10.3354/meps10352
Sabine, C. L., Feely, R. A., Gruber, N., Key, R. M., Lee, K., Bullister, J. L., et al. (2004). The oceanic sink for anthropogenic CO2. Science 305, 367–371. doi: 10.1126/science.1097403
Sala, M. M., Aparicio, F. L., Balagué, V., Boras, J. A., Borrull, E., Cardelús, C., et al. (2015). Contrasting effects of ocean acidification on the microbial food web under different trophic conditions. ICES J. Mar. Sci. 73, 670–679. doi: 10.1093/icesjms/fsv130
Sangrà, P., Pascual, A., Rodríguez-Santana, Á, Machín, F., Mason, E., McWilliams, J. C., et al. (2009). The canary eddy corridor: a major pathway for long-lived eddies in the subtropical North Atlantic. Deep Sea Res. Part I 56, 2100–2114. doi: 10.1016/j.dsr.2009.08.008
Schmoker, C., Arístegui, J., and Hernández-León, S. (2012). Planktonic biomass variability during a late winter bloom in the subtropical waters off the Canary Islands. J. Mar. Syst. 95, 24–31. doi: 10.1016/j.jmarsys.2012.01.008
Schmoker, C., Ojeda, A., and Hernández-León, S. (2014). Patterns of plankton communities in subtropical waters off the Canary Islands during the late winter bloom. J. Sea Res. 85, 155–161. doi: 10.1016/j.seares.2013.05.002
Schoo, K. L., Malzahn, A. M., Krause, E., and Boersma, M. (2013). Increased carbon dioxide availability alters phytoplankton stoichiometry and affects carbon cycling and growth of a marine planktonic herbivore. Mar. Biol. 160, 2145–2155. doi: 10.1007/s00227-012-2121-4
Sherr, E. B., and Sherr, B. F. (2007). Heterotrophic dinoflagellates: a significant component of microzooplankton biomass and major grazers of diatoms in the sea. Mar. Ecol. Progr. Ser. 352, 187–197. doi: 10.3354/meps07161
Sieburth, J. M., Smetacek, V., and Lenz, J. (1978). Pelagic ecosystem structure: heterotrophic compartments of the plankton and their relationship to plankton size fractions. Limnol. Oceanogr. 23, 1256–1263. doi: 10.4319/lo.1978.23.6.1256
Silva, N. J., Tang, K. W., and Lopes, R. M. (2013). Effects of microalgal exudates and intact cells on subtropical marine zooplankton. J. Plankton Res. 35, 855–865. doi: 10.1093/plankt/fbt026
Sswat, M., Stiasny, M. H., Taucher, J., Algueró-Muñiz, M., Bach, L. T., Jutfelt, F., et al. (2018). Food web changes under ocean acidification promote herring larvae survival. Nat. Ecol. Evol. 2, 836–840. doi: 10.1038/s41559-018-0514-6
Stange, P., Bach, L. T., Taucher, J., Boxhammer, T., Krebs, L., Algueró-Muñiz, M., et al. (2018). Ocean acidification-induced food web changes slow down degradation of sinking particles in an upwelling-stimulated oligotrophic plankton community. Front. Mar. Sci. 5:140. doi: 10.3389/fmars.2018.00140
Stoecker, D. K., and Capuzzo, J. M. (1990). Predation on Protozoa: its importance to zooplankton. J. Plankton Res. 12, 891–908. doi: 10.1093/plankt/12.5.891
Suffrian, K., Simonelli, P., Nejstgaard, J. C., Putzeys, S., Carotenuto, Y., and Antia, A. N. (2008). Microzooplankton grazing and phytoplankton growth in marine mesocosms with increased CO2 levels. Biogeosciences 5, 1145–1156. doi: 10.5194/bg-5-1145-2008
Suzuki, K., Nakamura, Y., and Hiromi, J. (1999). Feeding by the small calanoid copepod Paracalanus sp. on heterotrophic dinoflagellates and ciliates. Aquat. Microb. Ecol. 17, 99–103. doi: 10.3354/ame017099
Taucher, J., Bach, L. T., Boxhammer, T., Nauendorf, A., Montero, M. F., Achterberg, E. P., et al. (2017a). Impacts of ocean acidification on oligotrophic plankton communities in the subtropical North Atlantic: an in situ mesocosm study reveals community-wide responses to elevated CO2 during a simulated deep-water upwelling event. Front. Mar. Sci. 4:85. doi: 10.3389/fmars.2017.00085
Taucher, J., Haunost, M., Boxhammer, T., Bach, L. T., Algueró-Muñiz, M., and Riebesell, U. (2017b). Influence of ocean acidification on plankton community structure during a winter-to-summer succession: an imaging approach indicates that copepods can benefit from elevated CO2 via indirect food web effects. PLoS One 12:e0169737. doi: 10.1371/journal.pone.0169737
R Core Team (2012). R: A Language and Environment for Statistical Computing. Vienna: R.F.f.S. Computing.
Thor, P., and Dupont, S. (2015). Transgenerational effects alleviate severe fecundity loss during ocean acidification in a ubiquitous planktonic copepod. Glob. Change Biol. 21, 2261–2271. doi: 10.1111/gcb.12815
Tomas, C. R., and Hasle, G. R. (1997). Identifying Marine Phytoplankton. San Diego, CA: Academic Press.
Troedsson, C., Bouquet, J. M., Lobon, C. M., Novac, A., Nejstgaard, J. C., Dupont, S., et al. (2013). Effects of ocean acidification, temperature and nutrient regimes on the appendicularian Oikopleura dioica: a mesocosm study. Mar. Biol. 160, 2175–2187. doi: 10.1007/s00227-012-2137-9
Turner, J. T. (2004). The importance of small planktonic copepods and their roles in pelagic marine food webs. Zool. Stud. 43, 255–266.
Turner, J. T., and Tester, P. A. (1989). “Zooplankton feeding ecology: copepod grazing during an expatriate red tide,” in Novel Phytoplankton Blooms: Causes and Impacts of Recurrent Brown Tides and Other Unusual Blooms, eds E. M. Cosper, V. M. Bricelj, and E. J. Carpenter (Berlin: Springer), 359–374. doi: 10.1029/CE035p0359
Utermöhl, V. H. (1958). Zur Vervollkommnung der quantitativen Phytoplankton-Methodik. Mitt Int Ver Theor Angew Limnol 9, 1–38. doi: 10.1080/05384680.1958.11904091
Wells, M. L., Trainer, V. L., Smayda, T. J., Karlson, B. S. O., Trick, C. G., Kudela, R. M., et al. (2015). Harmful algal blooms and climate change: learning from the past and present to forecast the future. Harmful Algae 49, 68–93. doi: 10.1016/j.hal.2015.07.009
Winder, M., Bouquet, J.-M., Rafael Bermúdez, J., Berger, S. A., Hansen, T., Brandes, J., et al. (2017). Increased appendicularian zooplankton alter carbon cycling under warmer more acidified ocean conditions. Limnol. Oceanogr. 62, 1541–1551. doi: 10.1002/lno.10516
Wood, S. N. (2006). Generalized Additive Models: an Introduction With R. Boca Raton, FL: CRC Press. doi: 10.1201/9781420010404
Keywords: microzooplankton, mesozooplankton, mesocosms, ocean acidification, nutrients, Oncaea, trophic transfer efficiency
Citation: Algueró-Muñiz M, Horn HG, Alvarez-Fernandez S, Spisla C, Aberle N, Bach LT, Guan W, Achterberg EP, Riebesell U and Boersma M (2019) Analyzing the Impacts of Elevated-CO2 Levels on the Development of a Subtropical Zooplankton Community During Oligotrophic Conditions and Simulated Upwelling. Front. Mar. Sci. 6:61. doi: 10.3389/fmars.2019.00061
Received: 28 March 2018; Accepted: 05 February 2019;
Published: 25 February 2019.
Edited by:
Marius Nils Müller, Federal University of Pernambuco, BrazilReviewed by:
Soultana Zervoudaki, Hellenic Centre for Marine Research (HCMR), GreeceJun Sun, Tianjin University of Science and Technology, China
Copyright © 2019 Algueró-Muñiz, Horn, Alvarez-Fernandez, Spisla, Aberle, Bach, Guan, Achterberg, Riebesell and Boersma. This is an open-access article distributed under the terms of the Creative Commons Attribution License (CC BY). The use, distribution or reproduction in other forums is permitted, provided the original author(s) and the copyright owner(s) are credited and that the original publication in this journal is cited, in accordance with accepted academic practice. No use, distribution or reproduction is permitted which does not comply with these terms.
*Correspondence: María Algueró-Muñiz, bWFyaWEuYWxndWVyb0Bhd2kuZGU=
†These authors have contributed equally to this work