 Francesco Paparella
 Chenhao Xu1
 John A. Burt
- 1Division of Sciences and Mathematics, New York University Abu Dhabi, Abu Dhabi, United Arab Emirates
- 2Center for Genomics and Systems Biology, New York University Abu Dhabi, Abu Dhabi, United Arab Emirates
Corals in the Persian/Arabian Gulf are the most thermally tolerant in the world, but live very near the thresholds of their thermal tolerance. Warming sea temperatures associated with climate change have resulted in numerous coral bleaching events regionally since the mid-1990s, but it has been unclear why unusually warm sea temperatures occur some years but not others. Using a combination of 5 years of observed sea-bottom temperatures at three reef sites and a meteorologically linked hydrodynamic model that extends through the past decade, we show that summer sea-bottom temperatures are tightly linked to regional wind regimes, and that strong ‘shamal’ wind events control the occurrence and severity of bleaching. Sea bottom temperatures were primarily controlled by latent heat flux from wind-driven surface evaporation which exceeded 300 W m-2 during shamal winds, double that of typical breeze conditions. Daily temperature change was highly correlated with wind speed, with breeze winds (<4 m s-1) resulting in increased warming, while faster winds caused cooling, with the magnitude of temperature decline increasing with wind speed. Using observed and simulated data from 2012 to 2017, we show that years with reported bleaching events (2012, 2017) were characterized by low winds speeds that resulted in temperatures persisting above coral bleaching threshold temperatures for >5 weeks, while the cooler intervening years (2013–2016) had summers with more frequent and/or strong shamal events which repeatedly cooled temperatures below bleaching thresholds for days to weeks, providing corals temporary respite from thermal stress. Using observed data from 2012 onward and simulated data from 2008 to 2011, we show that the severity of bleaching events over the past decade was linked to both the number of cumulative days above bleaching thresholds (rather than total days, which obfuscates the cooling effects of occasional brief shamal events), as well as to maxima. We show that winds of 4 m s-1 represents a critical threshold for whether or not corals cross bleaching threshold temperatures, and provide simulations to forecast sea-bottom temperature change and recovery times under a range of wind conditions. The role that wind-driven cooling may play on coral reefs globally is discussed.
Introduction
Coral reefs are among the world’s most diverse ecosystems, occupying an area of less than a percent of the world’s seas but containing over a quarter of marine species. Reefs also provide over US$ 35 million km-2 yr-1 in goods and services to humanity, and are particularly important in supporting coastal populations in developing nations throughout the tropics (Costanza et al., 2014; Wolff et al., 2015). In recent decades coral reefs have come under increasing pressure as a result of local population-related pressures and global climate change, and it is estimated that over a fifth of coral reefs have been lost since the1990s and a third of coral species are currently at risk of extinction (Carpenter et al., 2008; Wilkinson, 2008). Such stressors have caused loss of coral cover and persistent shifts in community structure in many parts of the world (Graham et al., 2015; Hughes et al., 2018), with knock-on effects on the diversity and functioning of ecologically and economically important fish species as well as a suite of other reef associated fauna (Pratchett et al., 2009, 2011; Chaves-Fonnegra et al., 2018). Climate change is one of the most pressing threats to the future of coral reefs globally, as bleaching events associated with elevated sea surface temperatures (SSTs) – where corals lose their energy-producing symbiotic algae and turn white – are increasing in frequency, magnitude, and geographic occurrence round the world (Frieler et al., 2012; Hughes et al., 2017). To better understand how corals may respond to future climate change across the tropics, there has been rapid growth in research on corals currently existing in high-temperature environments (Camp et al., 2018), with much of this interest focused on the Arabian region (Burt, 2013; Coles and Riegl, 2013; Osman et al., 2018).
Each summer the Persian/Arabian Gulf (hereafter called ‘the Gulf’) is the world’s hottest sea (Riegl et al., 2011). Due to its shallow depth (mean < 30 m), restricted water exchange with the Indian Ocean, and the hyper-arid nature of its surrounding environment, summer SSTs in the Gulf may exceed 35°C (Sheppard et al., 1992; Coles, 2003), with temperatures >33°C occurring for several months (Riegl et al., 2012). Although these are temperatures that would normally be lethal to corals in most of the world (Riegl et al., 2011), coral communities occur in all eight nations bordering the Gulf (Vaughan and Burt, 2016; Vaughan et al., 2019). As a result, in recent years there has been rapid growth of research on Gulf corals in attempts to understand the physiological and genetic mechanisms being used by corals and their symbiotic algal partners to survive at temperatures not predicted for other regions for at least the next century (Hume et al., 2015, 2018; Howells et al., 2016; Vaughan and Burt, 2016; Smith et al., 2017).
While Gulf corals have the highest thermal limits known globally (Riegl et al., 2012), they are not immune to extreme temperature anomalies. Corals in the Gulf are known to be genetically adapted to the unusually extreme conditions that characterize the region (Howells et al., 2016; Smith et al., 2017; Kirk et al., 2018), but it is not absolute temperatures that induce bleaching; rather it is a departure from the typical mean summer temperature in which these coral populations have evolved. Mean SSTs in the Gulf have been increasing over the past three decades as a result of climate change (Riegl et al., 2011), and as a result there has been an increase in the frequency and magnitude of mass bleaching events where corals have been being pushed beyond their thermal limits (Riegl et al., 2018). Severe bleaching leading to widespread mass coral die-off’s (>80% loss) was first reported in the late 1970s, then again in 1996, 1998, and 2017, with slight to moderate bleaching events that resulted in more limited coral mortality (0∼20% loss) also occurring in 2002, 2010, 2011, and 2012 (Sheppard and Loughland, 2002; Riegl and Purkis, 2015; Shuail et al., 2016; Riegl et al., 2018; Burt et al., 2019). Recent work has shown that it is not the maximum temperature so much as the length of exposure that affects the severity of bleaching and whether or not mass mortality occurs. For example, the coral community at Bu Tinah reef in the southern Gulf was unaffected in 2007 when a mean daily maximum of 36.6°C was observed, but suffered severe bleaching in 2010 when maximum temperatures were lower but extended for a longer period of time (Riegl et al., 2012). Observations from several bleaching events across numerous reefs in the southern Gulf have now shown that mild bleaching will typically begin after a week of exposure to daily mean temperatures >35°C, and that severe bleaching will occur after 3 weeks of exposure to ≥35°C or 8 weeks at ≥34°C (Riegl et al., 2012), with significant bleaching-induced mortality typically only occurring when temperatures exceed 35.5°C for extended periods (Riegl et al., 2011).
It has been unclear why unusually long, warm summers occur some years but not others. Some authors have suggested that teleconnections related to the El-Nino Southern Oscillation (ENSO) in the Pacific interact with the Indian Ocean Zonal Mode (IOZM) to cause elevated thermal anomalies on approximately 5-year cycles in the Gulf (Riegl, 2003; Purkis and Riegl, 2005). However, while bleaching events are occurring with increasing frequency as a result of long-term increases in mean SSTs (Riegl et al., 2011), they have not tracked this cycle. In addition, a 5-year cycle is difficult to justify as the preferred variability time scale of the Pacific–Indian interactions, which have a quasi–biennial scale modulated by exceptionally strong events occurring every 8–10 years (Bracco et al., 2005). The only severe bleaching event associated with an El-Nino year was 1998, while the 1996, 2010, and 2017 events occurred during La-Nina years when the presumed ENSO effect would have abated, suggesting that other factors are likely involved in inducing thermal anomalies (Purkis and Riegl, 2005).
This study explores the role that local wind dynamics may play in establishing the physical conditions necessary for inducing bleaching in corals in the environmentally extreme southern Gulf. Winds in the Gulf predominantly flow from the NNW, and are characterized by strong seasonality when winds can increase dramatically over the course of several days during so-called shamal events (an Arabic reference to the north winds), often with sustained winds of 40–50 km hr-1 and gusts of up to 100 km hr-1 (Riegl and Purkis, 2012). While the strongest and most persistent shamal events occur during the winter (Thoppil and Hogan, 2010b), shamal wind events also occur during the summer and these can have a strong effect on SSTs (Reynolds, 1993; Yu et al., 2016). Using MODIS-derived SSTs Thoppil and Hogan (2010a), showed that two moderate strength (8–10 m s-1) shamal events in summer 2005 caused a net heat loss of 200–300 W m-2, resulting in a 1–2°C drop of the SST in the northeastern Gulf. Given that regional corals are living so close to their upper thermal limits and that the severity of bleaching and mass mortality is linked to both the maxima and the length of elevated temperatures (Riegl et al., 2011), such wind-driven cooling could play an important role in ameliorating the risk of bleaching events on coral reefs in the Gulf, but its influence has not yet been explored. Using a combination of reef-based temperature loggers deployed over 6 years at three reefs, local meteorological data, and modeling, we show the strong influence of winds on SSTs and reef-bottom temperatures in the southern Gulf, and discuss the role shamal wind events may play in modulating the extent and duration of exposure of corals to bleaching-inducing temperatures during summer. Given that climate change is pushing coral communities throughout the tropics toward their upper thermal limits with increasing regularity (Hughes et al., 2017), the occurrence – or absence – of strong localized wind events are likely to play an increasingly important role in structuring bleaching dynamics across the globe in coming decades.
Materials and Methods
Study Sites
This study was performed at three major coral habitats located in Abu Dhabi waters of the southern Gulf: Saadiyat, Ras Ghanada, and Dhabiya reefs (Figure 1). Sites were of similar depth (5–8 m) and distance from shore (3.6–4.8 km), occurring on a flat bottom mainly comprised of unconsolidated sand with limited topographic relief. In 2010 these sites contained between 54.8 and 65.6% coral cover, making them among the most abundant coral communities in the southern Gulf, with assemblages mainly dominated by Porites, Platygyra, and Cyphastrea (Burt et al., 2011; Grizzle et al., 2016). In situ temperatures on the reef bottom were recorded hourly from May 2012 through October 2017, and these data were used to validate modeled bottom temperatures (see below). Temperatures were recorded using Onset TidbiT v2 loggers (Model UTBI-0011), each of which were mounted on a metal stake installed in the sea bottom with the logger placed ca. 2–5 cm above coral framework to avoid sedimentation and shading.
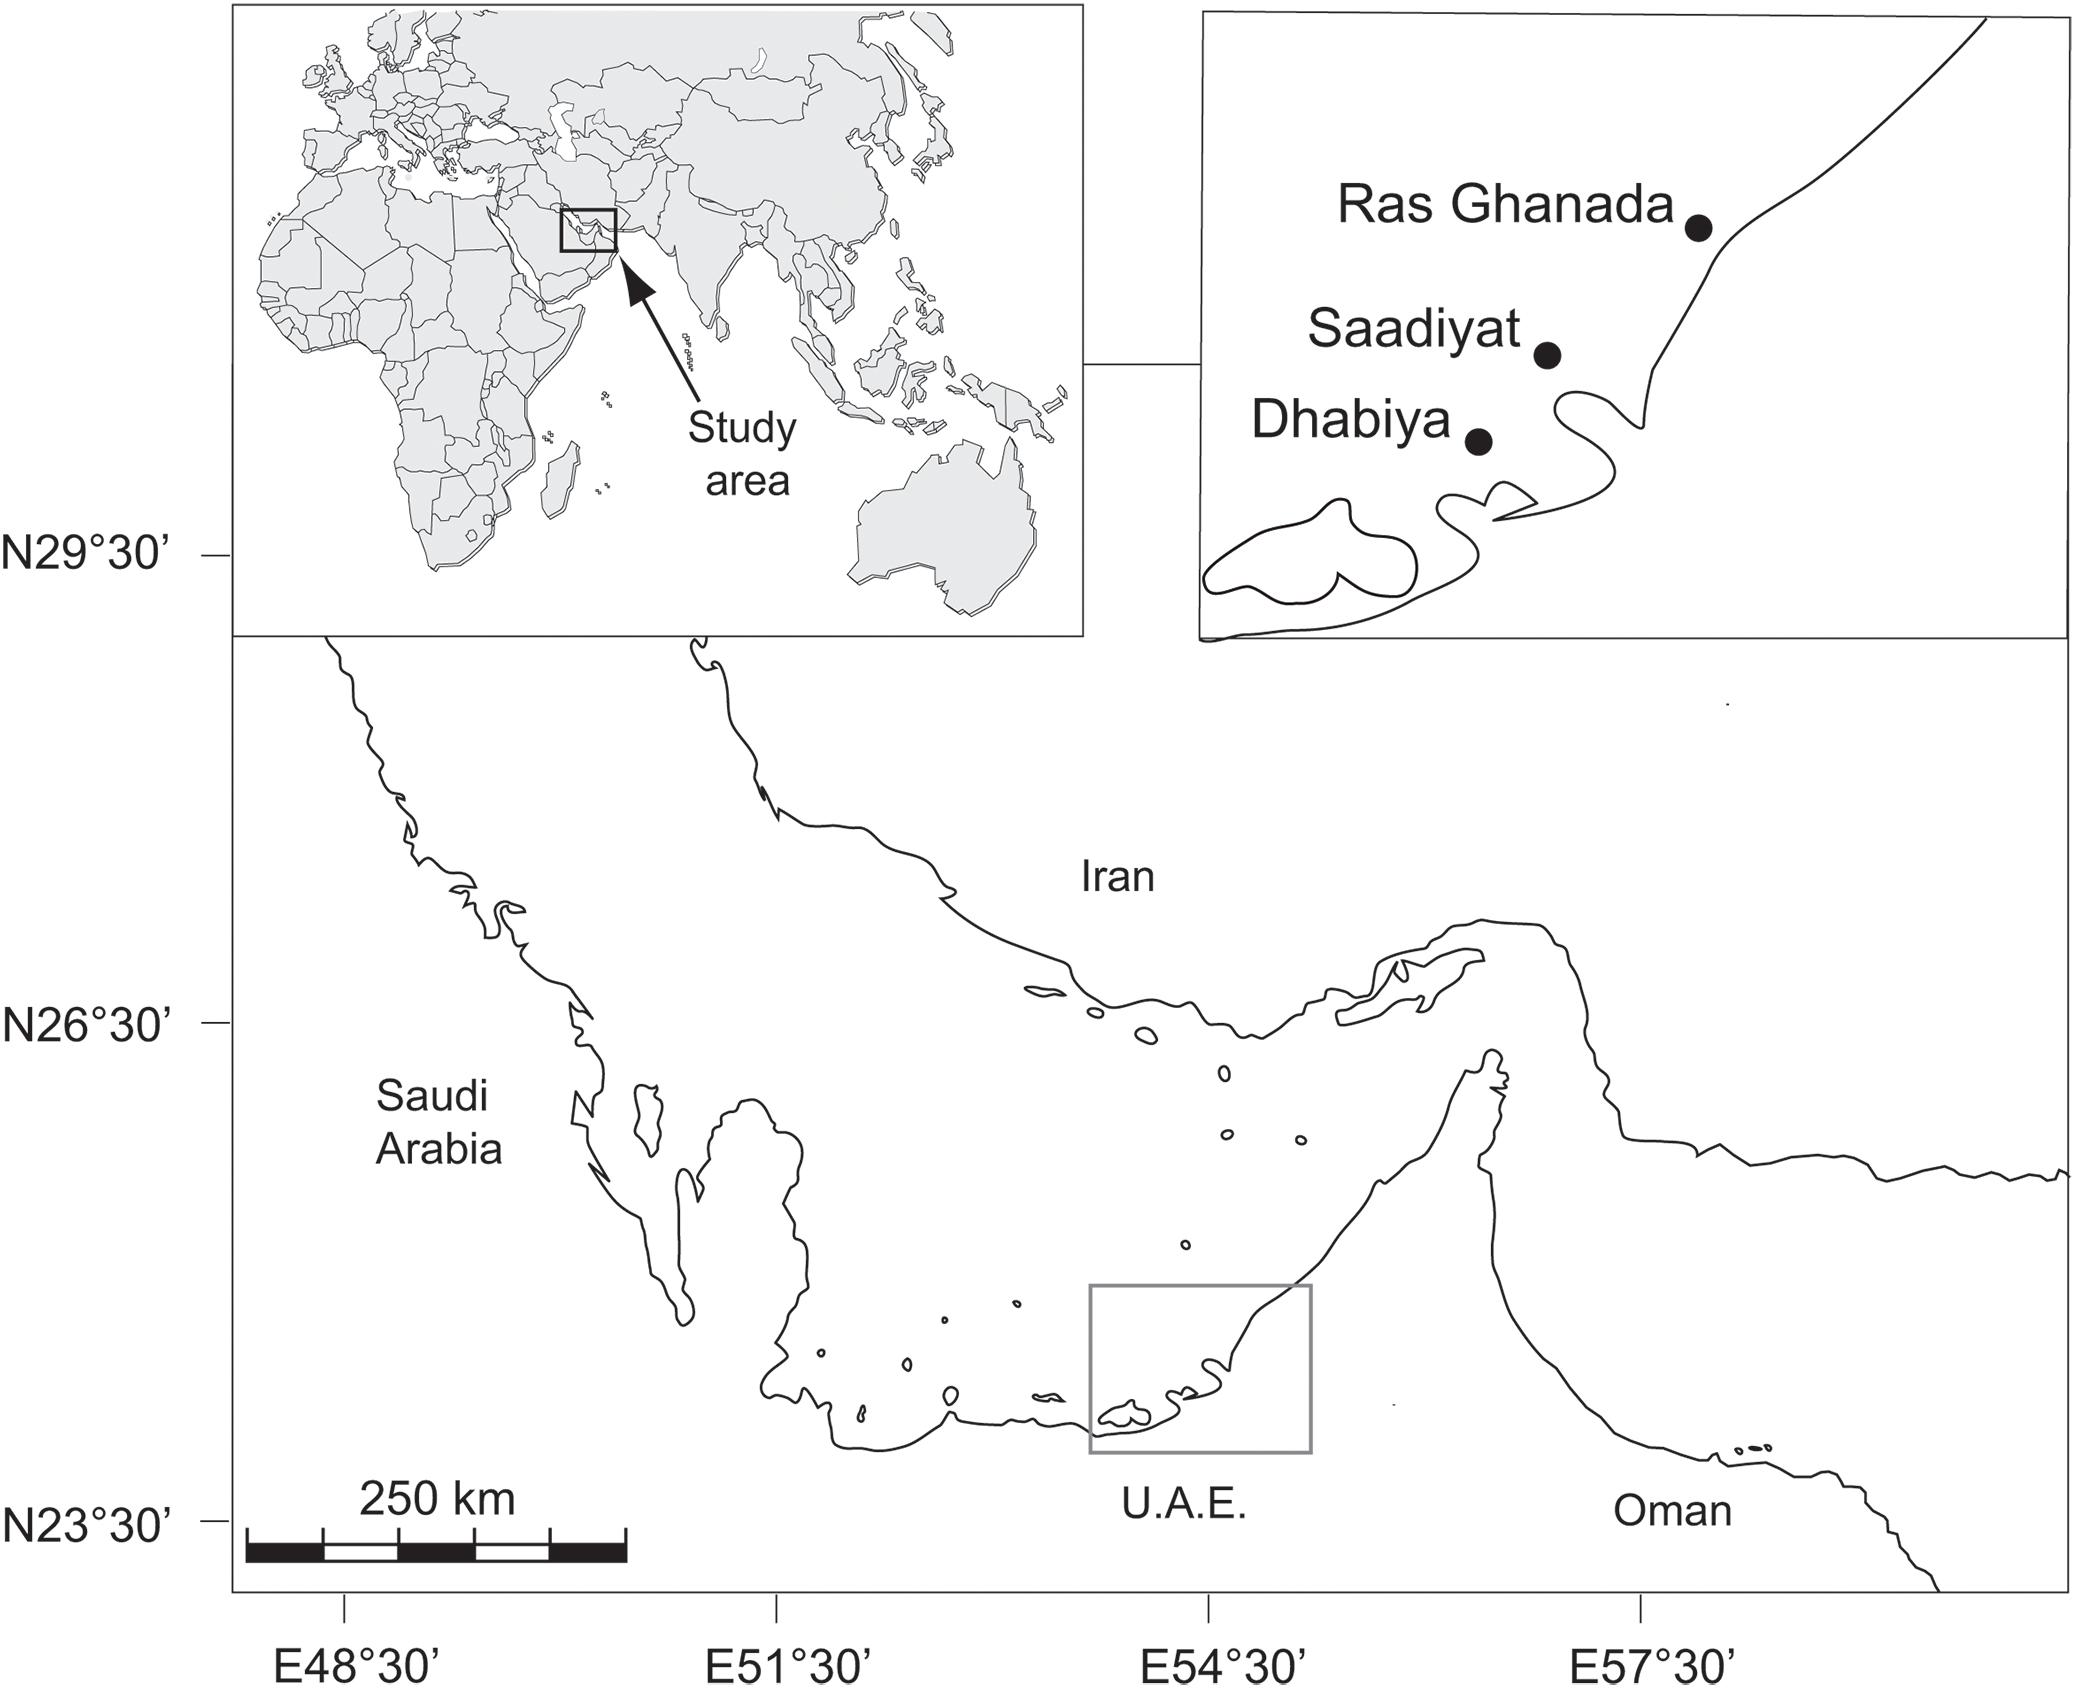
Figure 1. Map of the location of the three coral reef sites investigated in this study.
Water Column Model
The observed bottom temperature data were matched with numerical computations obtained with a simple ocean model (GOTM v. 5.3-1-gd7cce63, Burchard et al., 1999). The model simulates the physical processes of turbulent heat transport through the water column as a function of a limited number of parameters describing the atmospheric conditions at the sea surface, tides, and water transparency. The model was configured to use 60 vertical levels and a time-step of 30 s, with the output saved hourly.
The surface atmospheric parameters (10 m horizontal wind speed and direction, 2 m air temperature and pressure, dew point temperature, and surface net shortwave energy flux) were taken from the European Centre for Medium–Range Weather Forecasts (ECMWF) high-resolution re-analysis data (ERA5, Hersbach and Dee, 2016), which currently span the years 2008–2017. The native dataset was interpolated for study site locations following the prescriptions of Kara et al. (2007) to avoid biases due to the nearby land mass. Tidal currents were modeled as a superposition of the O1 and M2 tidal constituents with phases of 150° and 330°, and amplitudes of 0.2 m s-1 and 0.1 m s-1, respectively (Elshorbagy et al., 2006; Cavalcante et al., 2011). The water transparency was classified as type Jerlov 3 as given in Stips (2010), which is in the middle of the range suggested by Al Azhar et al. (2016) for the Gulf region.
The simulations were run to span the entire period for which the ERA5 data are available, starting on January 1, 2008, with the results validated against the sea-bottom temperature logger data available from May 2012 through October 2017 (see above). The model was initialized with a constant temperature throughout the water column of 22°C, and we have verified that after an initial brief transient period the long-term results were uninfluenced by the initial temperature. Salinity was maintained at a value of 44 PSU, reflecting the naturally high in situ salinity observed in the southern Gulf (Al Azhar et al., 2016; Howells et al., 2018).
Data Analyses
For most of the analyses we used daily averaged data, defined as the arithmetic average of all data values collected or computed for a given day.
An important diagnostics of coral bleaching is the degree heating week (Liu et al., 2003). The DHW relative to day n is defined as:
where w is the number of weeks spanned by the index (we use, as is typical, w = 12) and Ei is the daily average excess temperature above the threshold ^ T relative to the day i, that is:
Here, Ti is the average temperature of the i-th day, and the threshold ^ T is defined as “the climatological mean temperature of the climatologically hottest month” (Liu et al., 2003). Based on remotely sensed SST data, it had been earlier established that at Saadiyat reef the threshold temperature is ^ T = 34.55°C (Shuail et al., 2016). However, our simulations showed that summer temperatures are on average 0.2°C cooler on the sea bottom than at the surface. Thus we lowered the threshold to ^ T = 34.35°C to account for this effect.
We also define the daily temperature change ΔTn as:
where Tn-1 and Tn+1 are, respectively, the daily averaged bottom temperatures of the day before and after the n-th day in the data set.
Results
The simulations generated comparable patterns for all three reef sites. To ease interpretation, the results initially focus on Saadiyat reef, and those of Dhabiya and Ras Ghanada will be summarized below.
Validation of Model
The average daily bottom temperatures generated from simulation versus observation were compared for Saadiyat reef from 2012 to 2017, showing that the numerical model closely matched observed temperatures (Figure 2). During hot summer months, when coral bleaching conditions are most likely to occur, the difference between the two data sets never exceeded 0.5°C. In winter the simulations had a modest cold bias, and in spring a slight warm bias; however, these are generally contained within <1°C and are outside the main summer season of interest for this study.
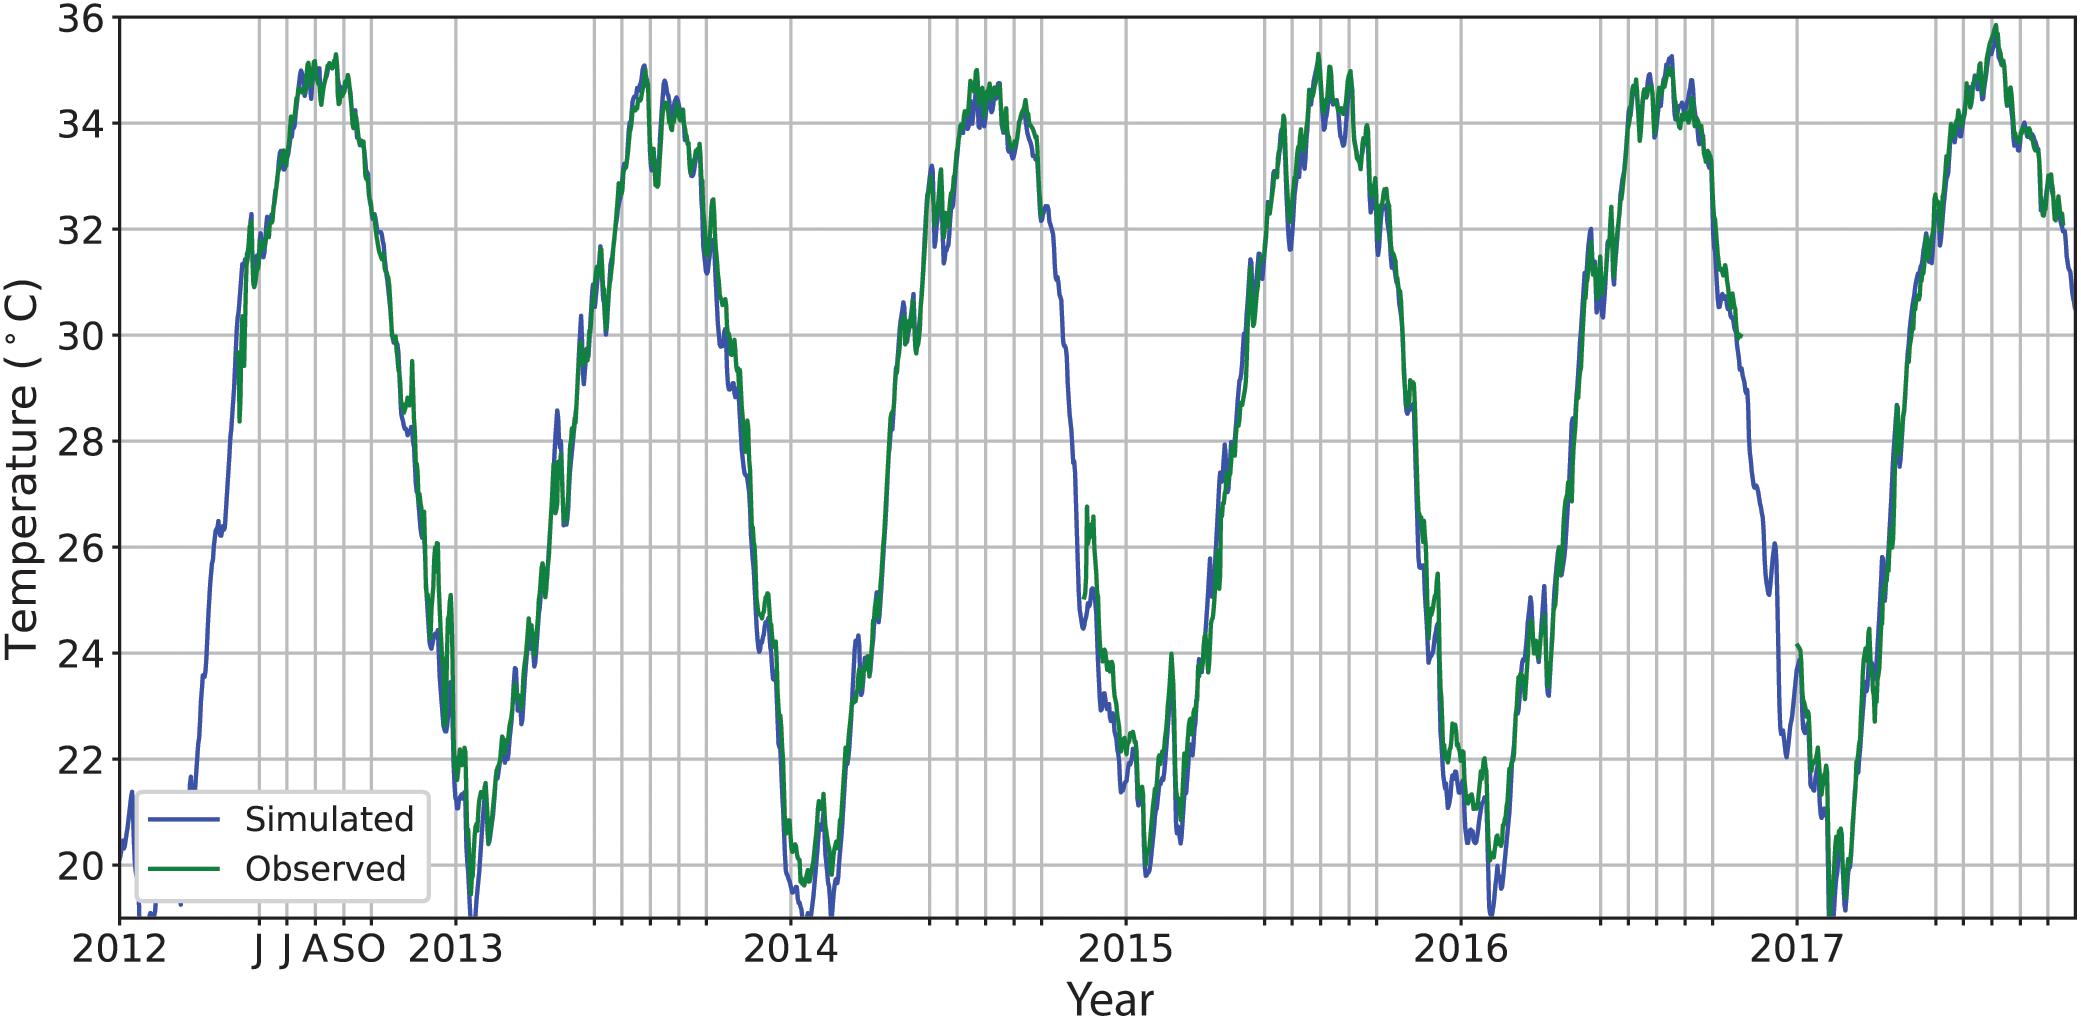
Figure 2. Simulated (blue) vs. observed (green) daily averaged bottom temperature at Saadiyat reef. Vertical lines mark the first day of each year and of each summer month.
To further assess model accuracy, the simulated non-averaged (i.e., hourly) bottom temperatures were compared against observed temperatures. As an example, Figure 3 shows the portion of summer 2013 corresponding to a strong cooling event. The observed data show a clear diurnal cycle, with an amplitude of about 0.5°C. The main determinant affecting such diurnal cycles in the simulated data was the intensity of tidal cycles. Without tides, simulated temperatures suffered from a cold bias and diurnal excursions became unrealistically small, while the opposite occurred if tidal currents were too strong. Other tidal parameters such as phase or current direction had little influence on the simulated results. This suggests that tidally generated turbulence close to the seafloor is an important complement to wind-generated turbulence, and is an essential factor for the heat transport through the water column, even in such a shallow environment.
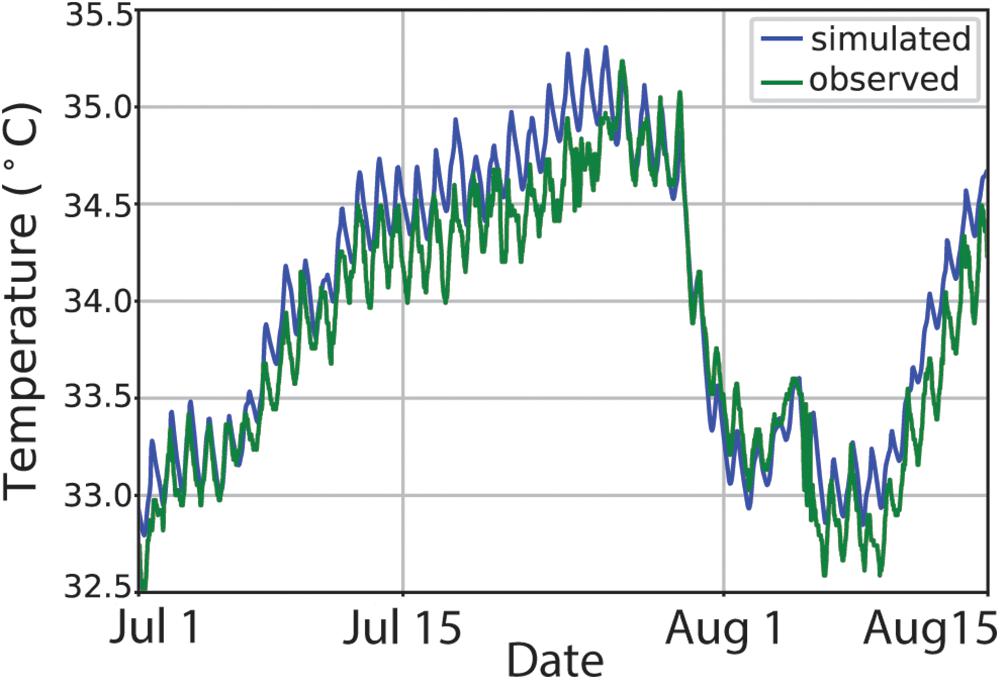
Figure 3. Simulated (blue) and observed (green) bottom temperature at Saadiyat reef during summer 2013 showing a clear diurnal cycle.
Influence of ‘Shamal’ Winds
To investigate the role that winds play in controlling the bottom temperature on reefs, observed reef temperatures were plotted against simulated bottom temperatures, the wind speed and direction from the ERA5 reanalysis, and the sea surface heat flux that was calculated by the model for the summers of 2012–2017 (Figure 4). As an initial observation, it is evident that sudden decreases in sea-bottom temperatures occur following strong wind events (shamal), mainly as a result of evaporative cooling through latent heat losses; details are described below.
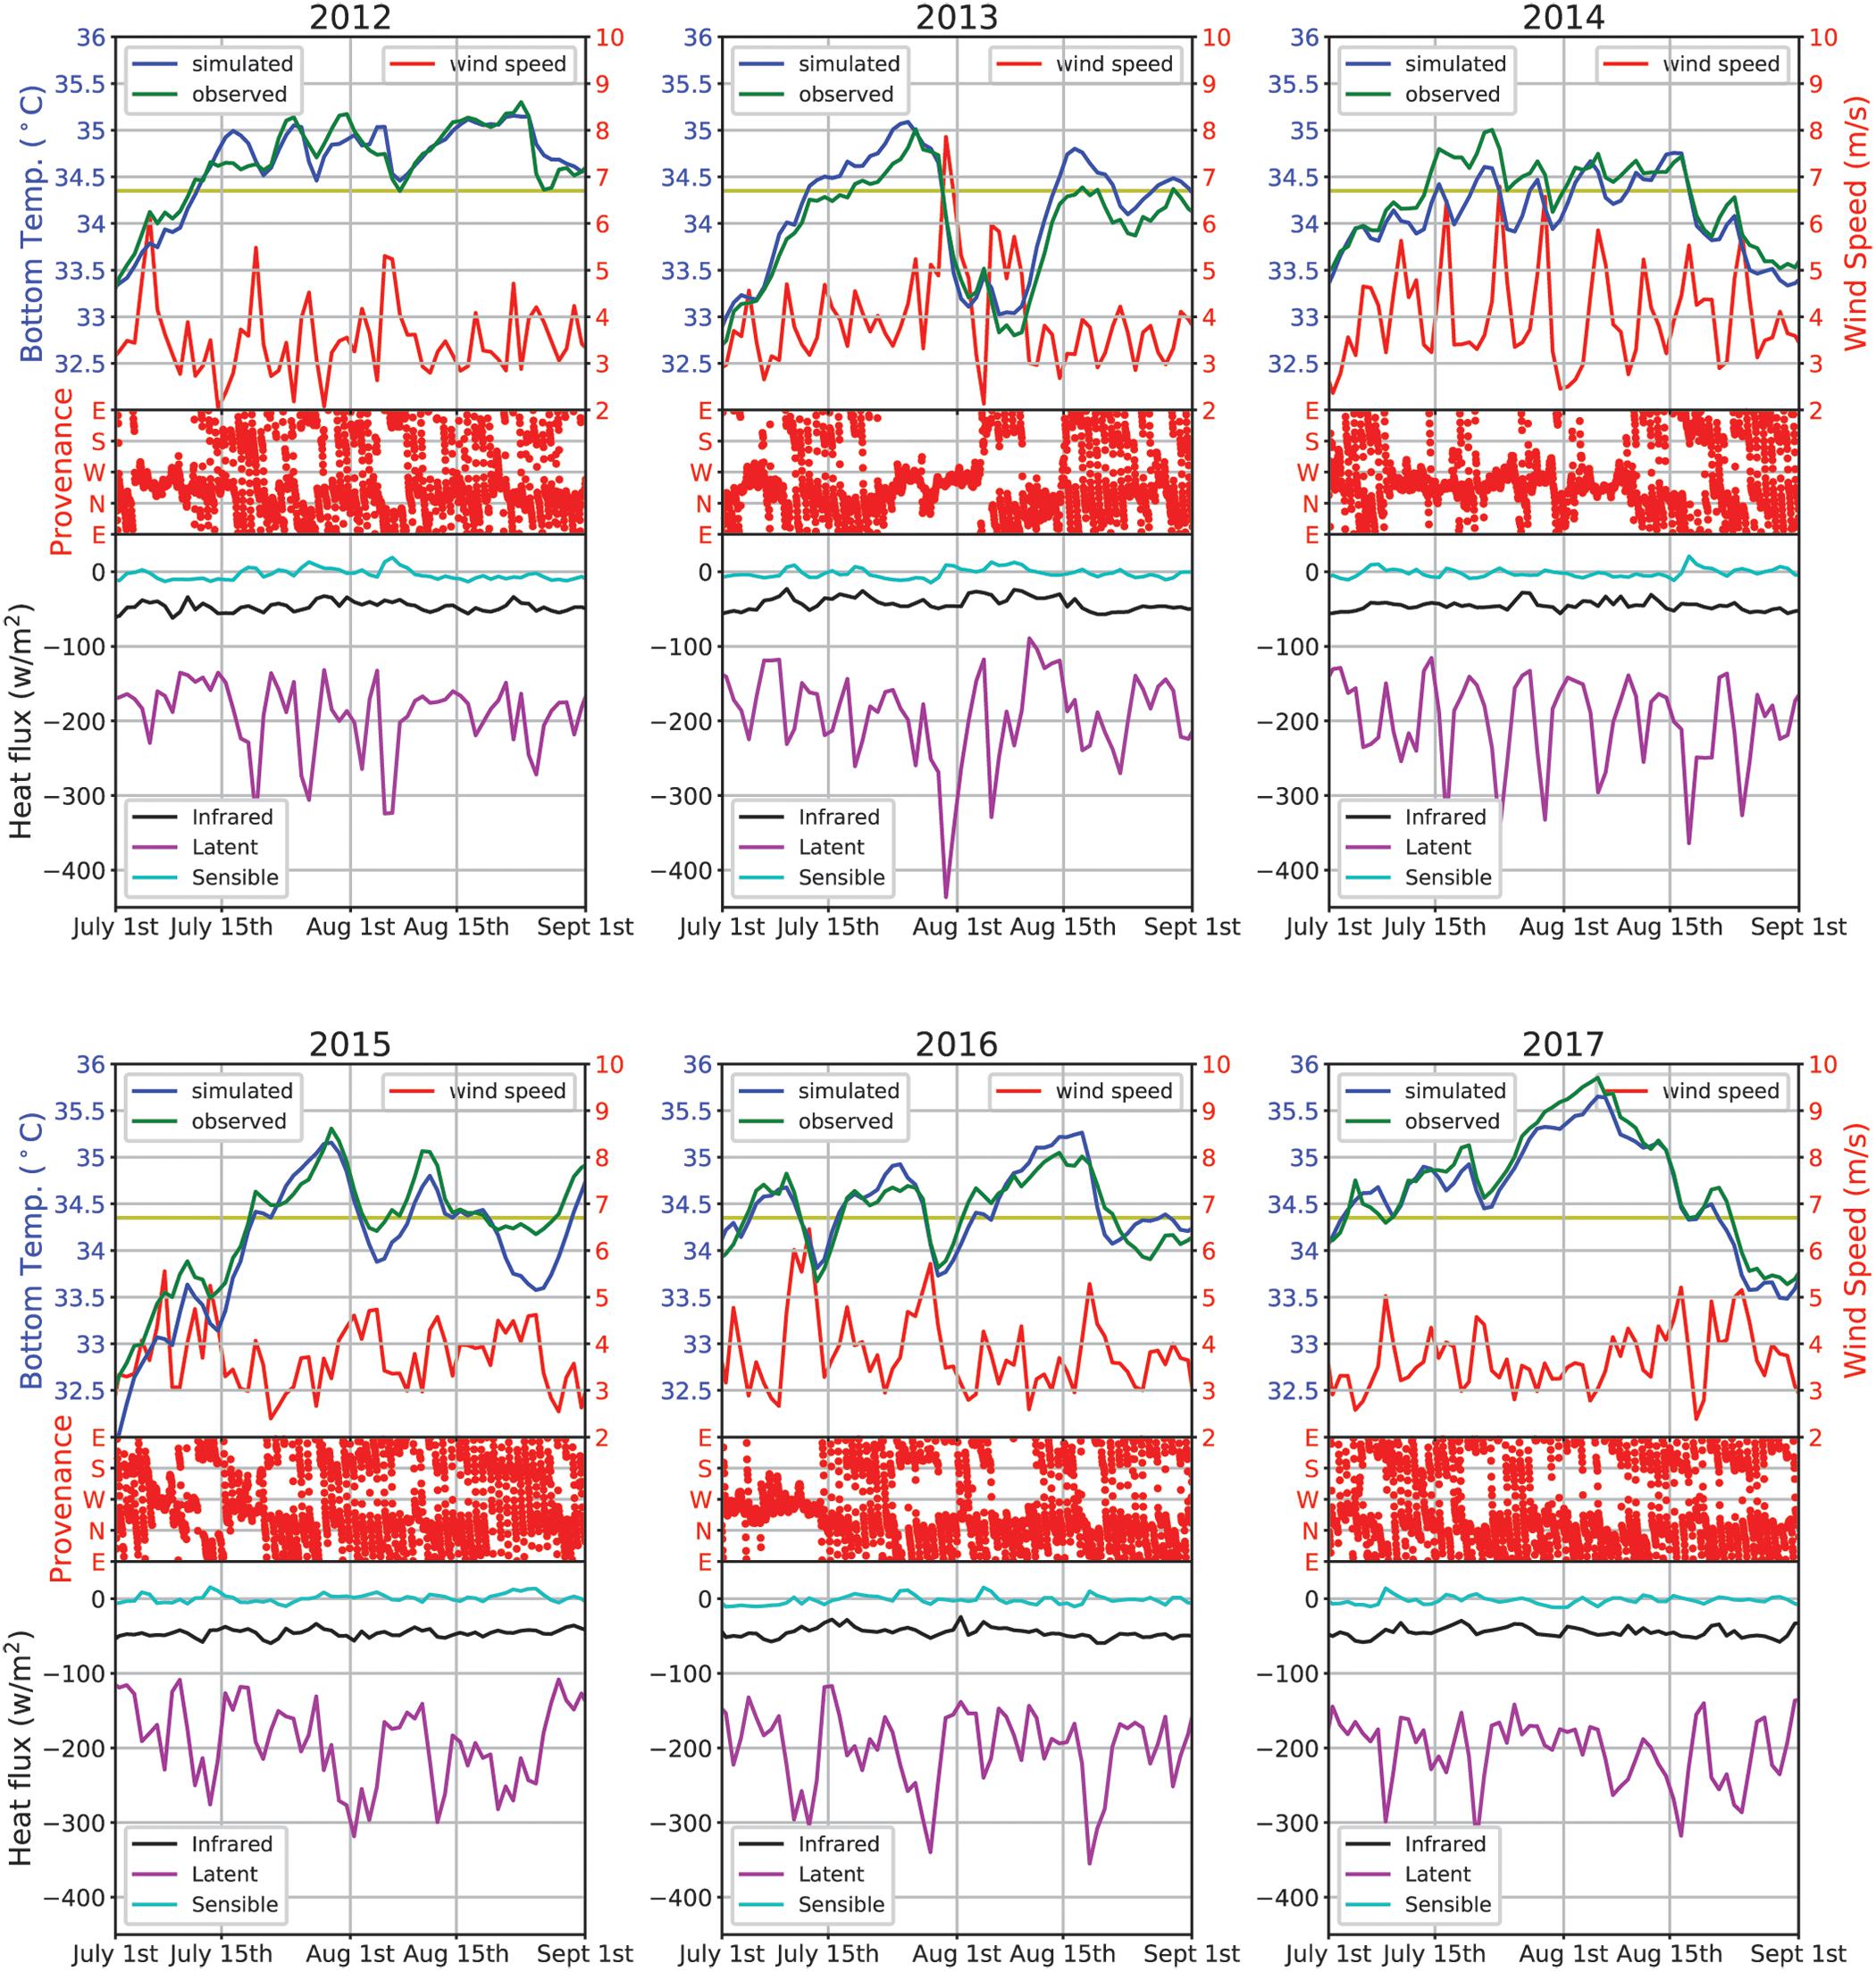
Figure 4. Sea-bottom temperature, wind speed and direction and sea-surface heat fluxes in July and August 2012 to 2017 at Saadiyat reef. Top panels: simulated (blue) and observed (green) daily averaged bottom temperature (left scale) and daily averaged wind speed (right scale); the level corresponding to the 34.35°C coral bleaching threshold has been highlighted for visual reference. Mid panels: hourly direction from which the wind blows. Bottom panels: daily averaged sensible (cyan), infrared (black), and latent (purple) heat fluxes at the sea surface.
In terms of the winds, the ERA5 data show that summer winds fall into two distinct regimes: breezes versus shamal events. During typical summer breeze days, the winds show large swings in direction, often rotating clockwise gradually from land-breeze to sea-breeze and back over the course of 24 h (see Provenance in Figure 4), a phenomenon attributed to a resonance with the Coriolis period which is close to 1 day at the Gulf latitude (Zhu and Atkinson, 2004). Breezes also have low wind speed, generally below 4 m s-1 (Figure 4), although higher speed breeze-like winds have occasionally occurred (e.g., last week of July 2016). In contrast, so-called ‘shamal’ wind events are characterized by strong directionality and speed. At the study sites, shamals may be recognized as a sequence of days (generally 3–5) during which the winds stop swinging and persistently flow from the NW, with a daily averaged speed that always peaks well in excess of 5 m s-1 in the windiest day of the sequence.
Shamal events strongly influence the heat flux at the sea surface, nearly all of which is due to latent heat loss as evaporative cooling (Figure 4, bottom panels). Latent heat loss generally oscillates between 100 W m-2 and 200 W m-2 during typical summer breeze days when winds are weak (<4 m s-1), but can easily exceed 300 W m-2 during strong shamal events when heat losses functionally double as a result of evaporative cooling. Sensible heat fluxes are due to conduction of heat between water and air (warming or cooling), with a typical magnitude of 10 W m-2. Heat losses from infrared radiation average to about 50 W m-2. Both are of limited importance to the overall heat flux, and are relatively unaffected by winds (Figure 4).
The wind-driven evaporative heat loss from the sea surface during shamal events has a strong influence on the bottom temperature on reefs (Figure 4, top panels). While evaporation-driven latent heat fluxes result from complex, micro-scale turbulent processes at the surface, they can be effectively parameterized by bulk formulae which prescribe the fluxes as linearly dependent on the wind speed (e.g., Bentamy et al., 2003). Thus, when latent heat fluxes dominate, the existence of a causal relationship between wind speed and change in water temperature is expected. This hypothesis is tested in Supplementary Figure S1, which shows that daily averaged wind speed is clearly correlated with daily temperature change on the sea bottom in both observed and simulated conditions (r2 = 0.44 for the simulations and r2 = 0.30 for the observations). In particular, winds weaker than the average wind (which is about 4 m s-1) are associated with warmer bottom temperatures compared with the previous day, while faster wind speeds are associated with cooler sea-bottom water temperature, and the magnitude of the temperature decline increases with wind speed. The attribution of temperature changes to evaporative fluxes is further strengthened by taking relative humidity into account: when this variable is used together with wind speed in a bivariate regression vs. daily temperature changes, the coefficient of determination of the regression increases to r2 = 0.56 (vs. simulations) and r2 = 0.39 (vs. observations). We note that summer shamal winds in the Gulf are not appreciably drier than breeze winds (Al Senafi and Anis, 2015), and therefore high wind speed alone is what enables shamal winds to produce large evaporative fluxes.
Sea-Bottom Temperatures and Coral Bleaching Risk
Degree heating weeks (DHWs) provide a measure of how long temperatures have persisted above coral bleaching thresholds, an indication of thermal stress for corals above simple maxima. Figure 5A shows the accumulation of DHWs at Saadiyat reef from 2012 to 2017 using both observed and simulated data based on the sea-bottom bleaching threshold determined for this site by Shuail et al. (2016). The results indicate that 2012 and 2017 were anomalously warm years, with approximately 4°C-weeks spent at temperatures above coral bleaching thresholds, two to three times what was observed for the intervening years, coinciding with the reported occurrence of moderate (2012) and severe (2017) bleaching events in this area (Shuail et al., 2016; Riegl et al., 2018). In keeping with the above observations, the unusually warm 2012 and 2017 summers were characterized by low wind speeds, while the cooler intervening years had summers with faster winds (Figure 5B).
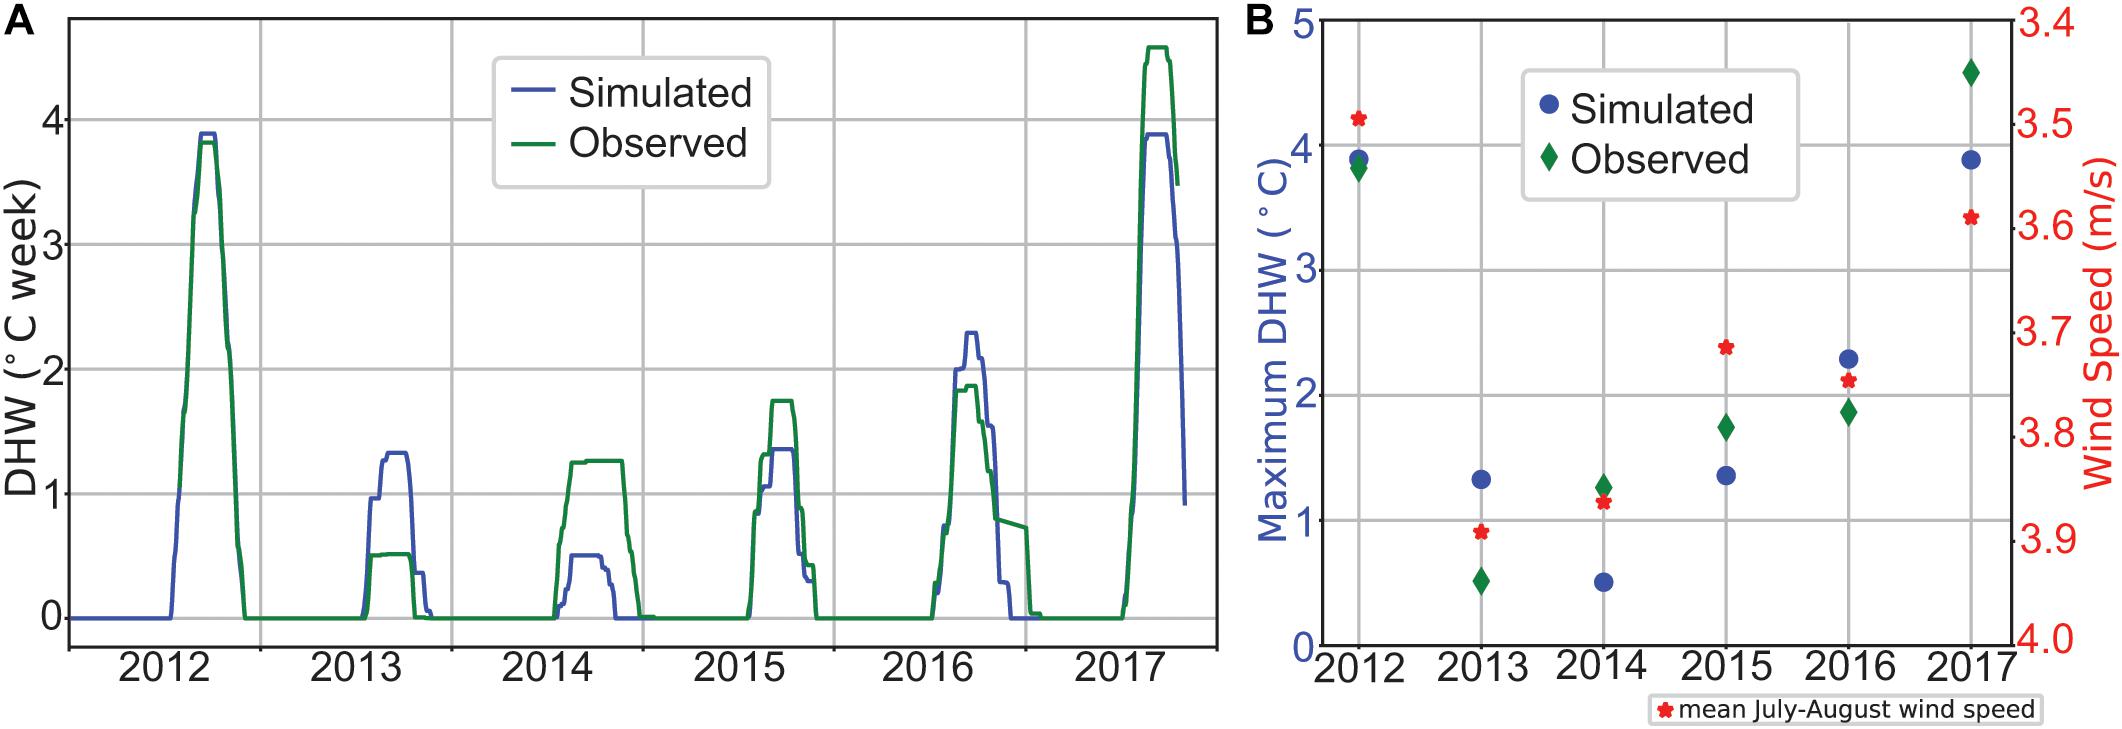
Figure 5. (A) Degree heating weeks computed from the observed (green) and simulated (blue) sea-bottom temperatures at Saadiyat reef from 2012 to 2017. (B) Maximum DHW for each year (left axis) contrasted against average wind speed (July and August) (right axis; red star). Note that the right axis is inverted for ease of interpretation.
Figure 6 shows both the total number of summer days, and the number of consecutive summer days, spent at various temperatures (in 0.25°C intervals) on Saadiyat reef based on observed sea-bottom records (2012–2017), as well as simulated sea-bottom data modeled from the beginning of ERA5 dataset for earlier years (2008–2011). The results indicate that across the decade, 2011 and, particularly, 2017 stand out as unusually warm years where reef-level temperatures remained elevated for considerably longer than most other years, and that 2012 also had prolonged periods at more moderate temperatures. The sea-bottom temperature necessary to induce coral bleaching at Saadiyat reef had earlier been established as 34.35°C (Shuail et al., 2016). In terms of total days (Figure 6A), corals at Saadiyat reef spent nearly 2 months (53 days) above this bleaching threshold in 2012, but temperatures never exceeded 35.25°C, while in 2011 and 2017 corals spent less time above this temperature (40 and 42 days, respectively), but reached considerably higher maxima. In 2011, according to our model, corals spent 11 days above 35.25 and reached a maximum of 35.59°C, while in 2017 Saadiyat reef was exposed to 35.25°C for over 2 weeks and 35.5°C for 9 days, with maximum daily mean temperatures reaching 35.85°C. While the total number of days above threshold temperatures each summer is important, how many of these elevated-temperature days are consecutive is more biologically relevant, as this reflects the length of time between large temperature drops associated with shamal events (e.g., Figure 4), providing respite to thermally stressed corals when temperatures drop below bleaching thresholds even briefly. While 2011, 2012, and 2017 remain among the most thermally stressful years, a more nuanced pattern emerges when consecutive days above temperature thresholds are plotted (Figure 6B). Although there were nearly 2 months of total days above the bleaching threshold in 2012 (above), corals spent a maximum of just 3 weeks (24 days) of consecutive days at these temperatures, reflecting the frequent occurrence of winds above 5 m s-1 in the summer of 2012 which caused sharp declines in temperature (see Figure 3), providing corals brief periods in which to recover. In contrast, 2011 and 2017 had much more protracted periods at temperatures above coral bleaching thresholds, spending over five consecutive weeks above 34.5°C with no respite (Figure 6B). The summer of 2017 caused among the worst mass bleaching and coral mortality events in recorded history in the southern Gulf, when sea-bottom temperatures reached 35.85°C and corals spent over a week (nine consecutive days) at temperatures above the lethal threshold for corals in the southern Gulf where significant mortality is expected to occur (35.5°C, Riegl et al., 2011). This was a summer that was unusually warm from the beginning compared with most other years and was unique in having an extended period of protracted calm wind conditions from mid-July through mid-August (see Figure 4), allowing summer 2017 temperatures to not only exceed the maxima experienced in other years, but also to extend for a much greater length of time above both bleaching and lethal thresholds.
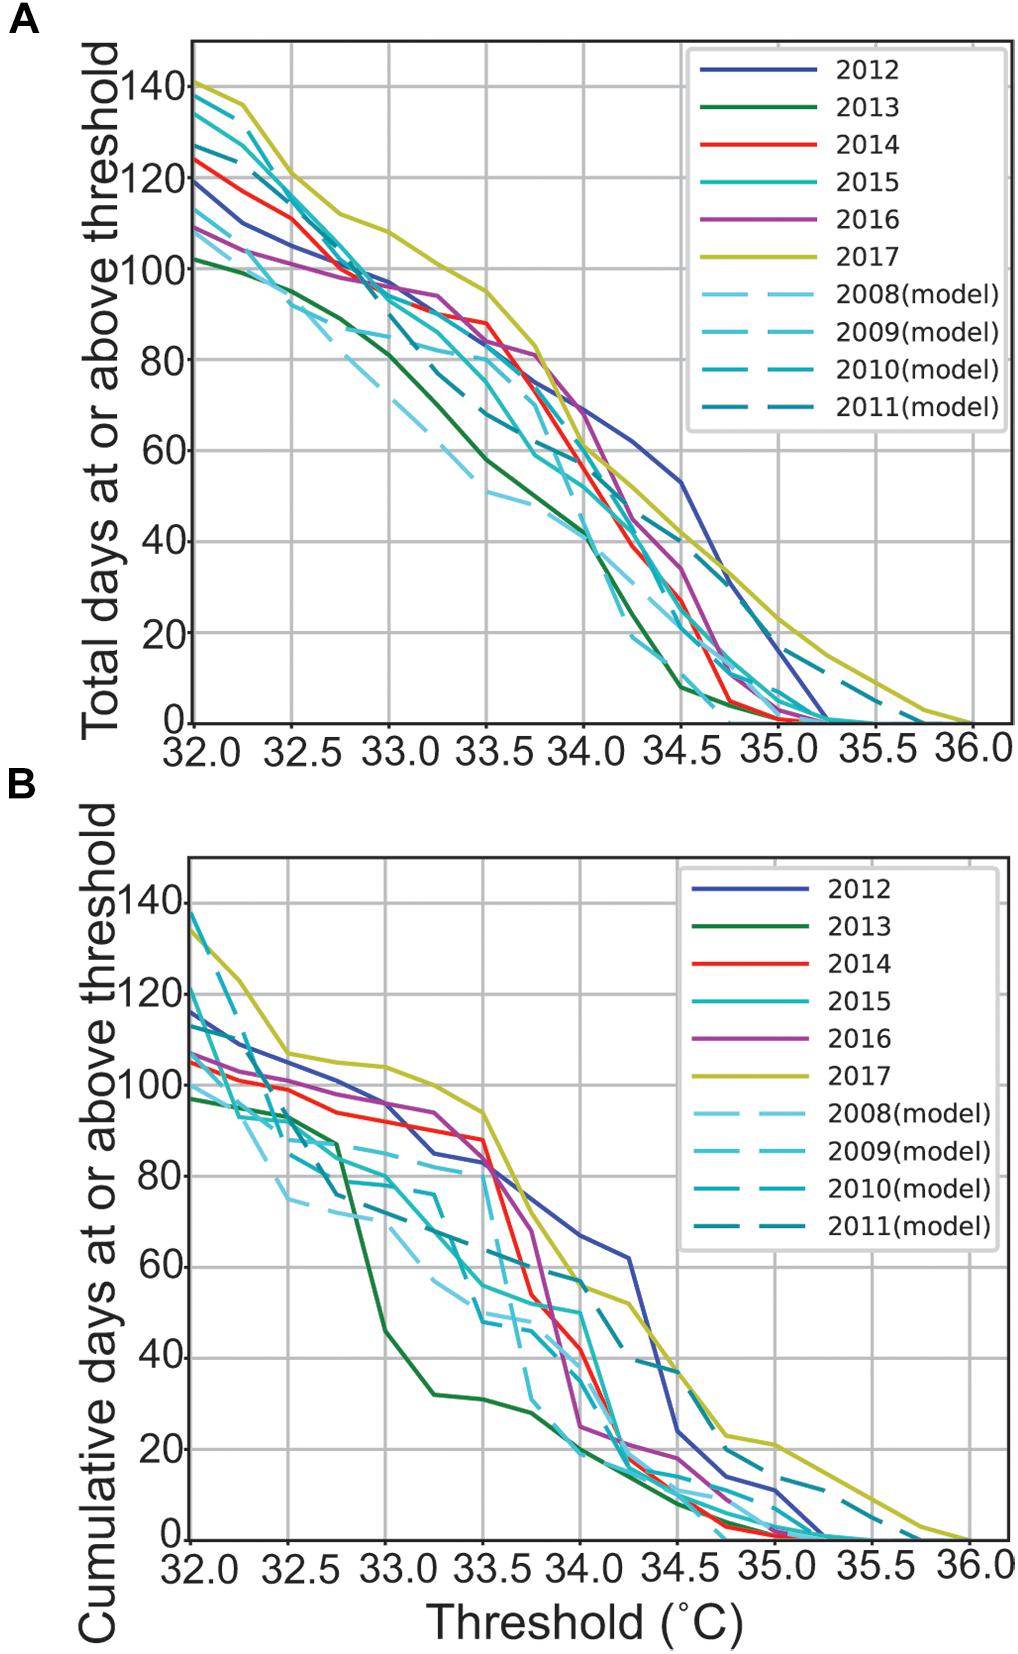
Figure 6. Number of days that corals were exposed to a range of sea-bottom temperatures during summer (July 1 to August 31) for the decade from 2008 to 2017 at Saadiyat reef. (A) Total days over the entire summer, (B) maximum number of cumulative days at or above a given temperature. Both are based on 0.25°C temperature intervals. The 2008–2011 data are based on bottom temperature simulations from the ERA5 dataset, while 2012–2017 are based on observed bottom temperatures.
Simulated Wind Scenarios
Simulations were used to explore the influence of winds on sea-bottom temperatures under varying wind conditions, while keeping all other factors constant. To this end, the model was forced by indefinitely repeating all the meteorological and tidal parameters of a typical mid-summer day (namely, July 15th 2017), except for the wind speed, which was set to be a predetermined constant. In these conditions, after a transient, the model settles on a constant daily average temperature, shown in Figure 7A as a function of wind. In flat calm conditions (0 m s-1), sea bottom temperatures have the potential to reach 39°C on a typical summer day. Consistently with the observations reported above, breezes of 2–4 m s-1 correspond to an equilibrium temperature of 34.4–36.4°C, approximating the temperatures observed on reefs during low-wind years. A wind speed of 4 m s-1 corresponds to an equilibrium temperature that closely matches the bleaching threshold, and winds >4 m s-1 reduce temperatures to below coral bleaching thresholds, where winds >8 m s-1 result in a >2°C drop below the bleaching threshold value, although the rate of decrease slows with increasing wind speed.
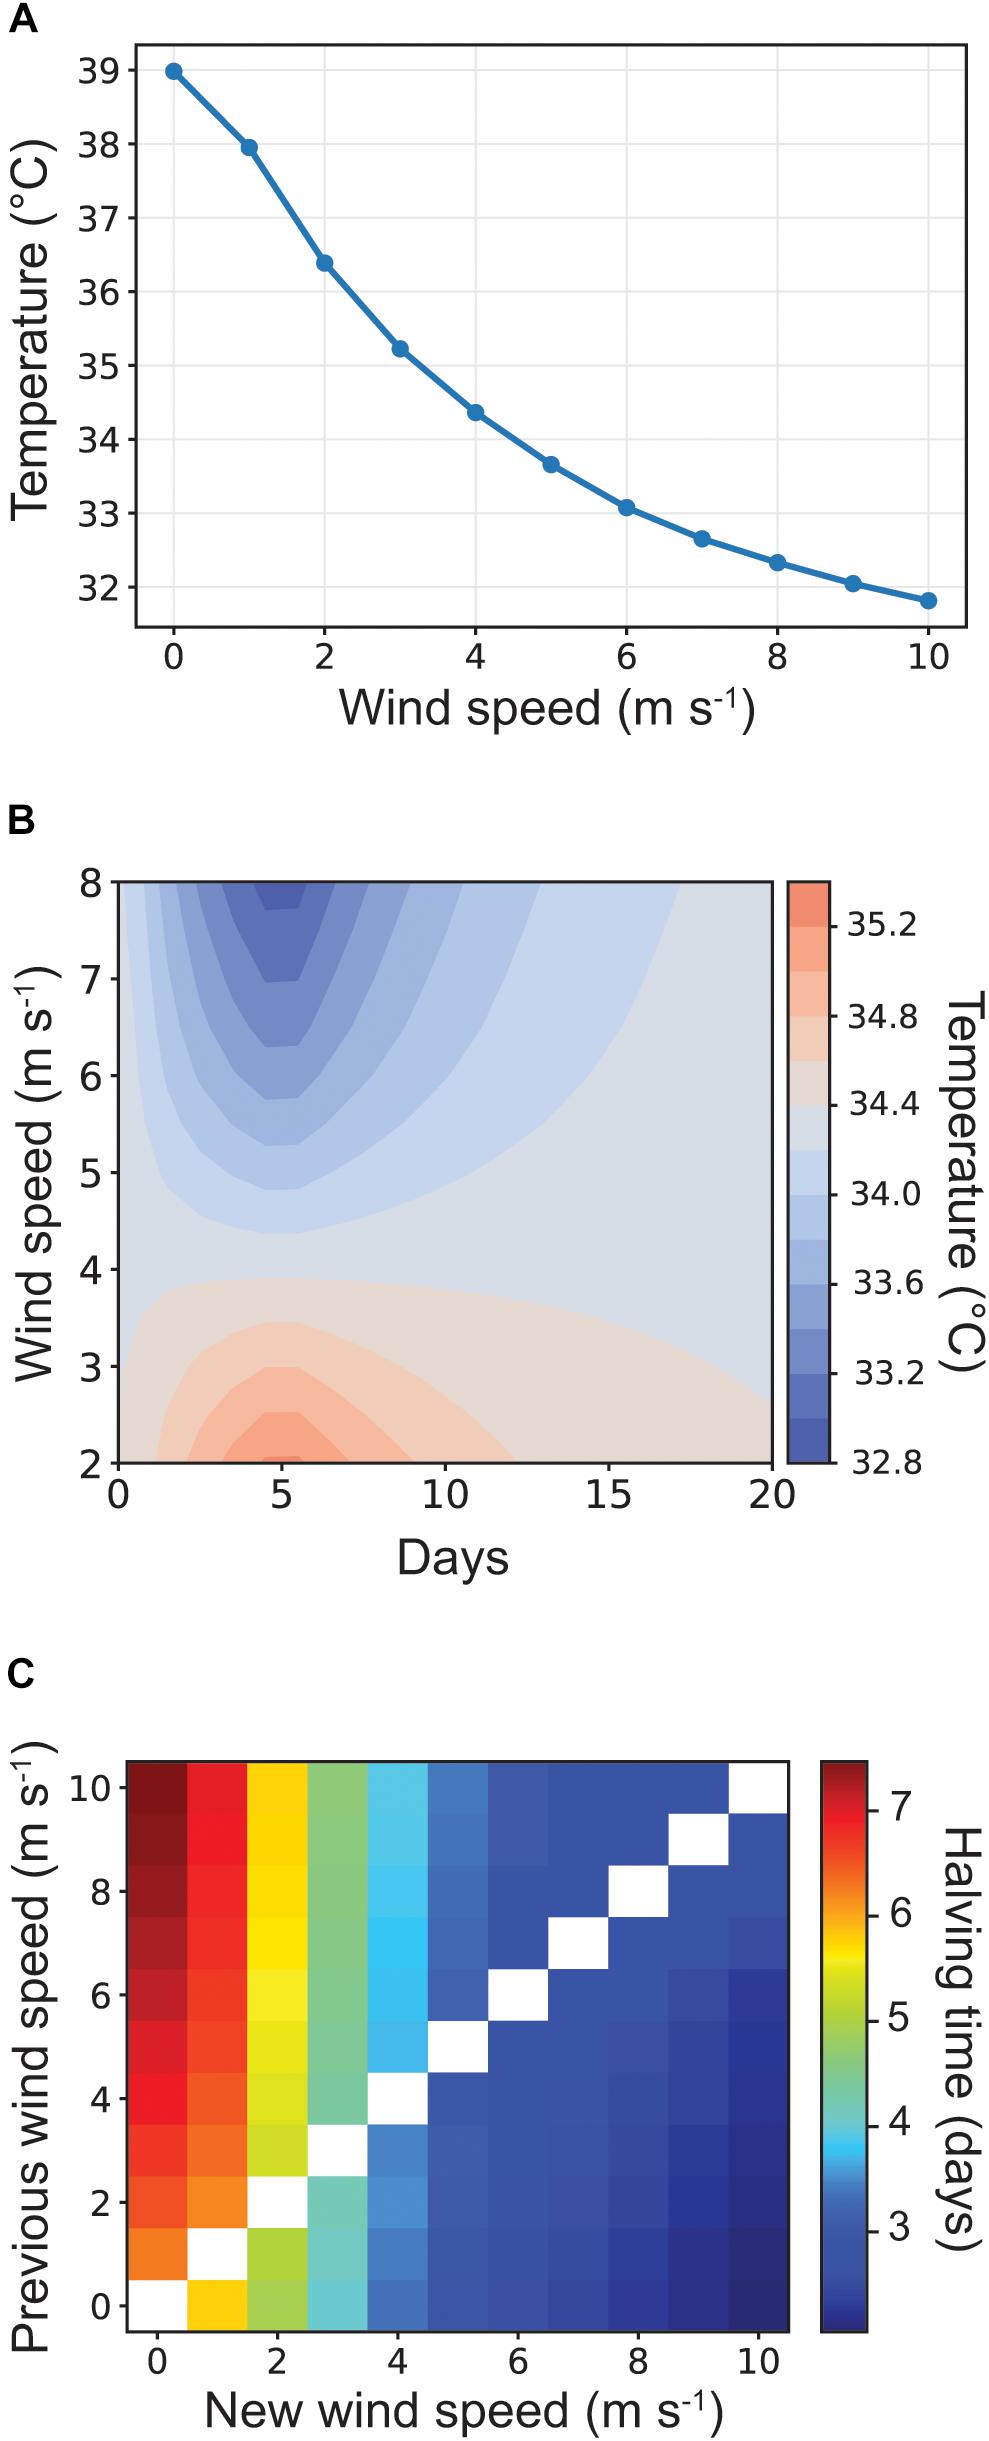
Figure 7. Simulated influence of wind on sea-bottom temperatures under a constant meteorological and tidal forcing scenario. (A) Equilibrium bottom temperatures that will occur if winds persisted at a given speed. (B) Changes in bottom temperature as a result of a 5-day wind event at various speeds. Initial conditions set at 4 m s-1 (which relates to bleaching threshold temperatures) with winds returning to initial conditions after the 5-day period. (C) The half time number of days it will take temperatures to reach a new equilibrium based on a given starting and ending wind speed.
In a second set of simulations, after reaching the equilibrium temperature corresponding to a 4 m s-1 wind, the wind speed jumps to a new speed chosen in the range 2–8 m s-1, where it is held constant for 5 days (a typical shamal length), then it is brought back to 4 m s-1. Figure 7B shows the simulated bottom temperature as a function of time and of the 5 days at set wind speeds. The simulation showed that shamal–like wind conditions (>6 m s-1) reduced bottom temperatures by 1–1.5°C within several days and temperatures did not return to their initial conditions until more than 2 weeks after the beginning of the event. In contrast, weak breeze–like winds (<3 m s-1) caused temperatures to rise above bleaching thresholds immediately and approach lethal thresholds (35.5°C) after 5 days if winds were held at 2 m s-1 and temperatures remained above bleaching thresholds for ≥20 days even after the cessation of the weak winds after the 5-day simulated period.
Finally, we quantified the temperature response time by imposing a sudden jump of wind between any two wind speed values in the range 0–10 m s-1, in steps of 1 m s-1. The transient between the equilibrium temperatures before and after the jump is well represented by the solution of the differential equation:
Where T0, Te are the equilibrium temperatures before and after the jump, respectively, and the parameter τ is least-square fitted to the simulation data. The value τ/log 2e is the half-time to the new equilibrium in this exponential relaxation process, and it is shown in Figure 7C. We observe that if the wind jumps from slower to faster the adjustment process is more rapid than for a wind jump from faster to slower. For example, the half-time to reach a new equilibrium is just 2.5 days if a 10 m s-1 shamal wind follows 2 m s-1 breeze wind conditions, but the half time is double (5 days) for conditions to reach equilibrium if winds are initially fast (10 m s-1) but slow to breeze conditions (2 m s-1). These results show not only the important cooling effects of summer shamal winds, but underscore their importance in controlling the persistence of elevated temperatures.
Consistency of Shamal-Induced Cooling at Ras Ghanada and Dhabiya
Data for Ras Ghanada and Dhabiya reefs are provided in Supplementary Figures S2–S7 which are analogous to Figures 2–5, 7 shown above for Saadiyat reef (note that observed data are only available for 2012–2015 for these sites, and the model is applied for other years). Similar to data provided above, the model effectively reproduces the bottom-temperature observations at both sites (Supplementary Figures S2, S3). Dhabiya, being a slightly shallower site, had the largest daily temperature excursion, and the smallest difference between bottom and surface temperature (Supplementary Figure S3).
Supplementary Figures S4, S5 show that the overall patterns observed at these sites reflect the observations described above for Saadiyat: 2017 had the largest number of days above bleaching threshold temperatures and was the year in which the highest temperatures were observed; in 2012 there are also a large number of days above threshold, but extreme temperatures were avoided due to occasional bursts of wind; in 2013 a strong shamal event during the middle of the summer caused a temperature drop of ca. 2°C. Although there are broad similarities between all sites, there are also important differences. Warming during the summer of 2012 began earlier in Ras Ghanada and Saadiyat, but at Dhabiya was delayed until the second half of July due to a localized wind event that occurred during the first week of July (Supplementary Figure S5), which may explain the lower incidence of bleaching in western Abu Dhabi than eastern Abu Dhabi in 2012 (Shuail et al., 2016). Other differences include that the cooling event of 2013 shows a clear double-dip at Ras Ghanada (Supplementary Figure S4), and a broad, persistent minimum at Dhabiya (Supplementary Figure S5), and that the recurrent bursts of wind that occurred in 2014 were so strong at Dhabiya that temperatures were almost entirely maintained under bleaching thresholds, but were weaker at Ras Ghanada, where bottom temperatures briefly achieved 35°C.
In all cases, Saadiyat, which lies approximately halfway between Dhabiya and Ras Ghanada, shows wind strengths and temperature drops intermediate between the other two sites. These non-negligible differences in wind strength, and in water temperature, on spatial scales smaller than 100 km suggest that bleaching needs not be uniform and widespread, but that local variation should be expected as a result of localized wind dynamics.
Discussion
Coral reefs provide invaluable goods and services to coastal nations around the tropics, but in recent decades have come under increasing pressure from bleaching events caused by increasing temperatures associated with global climate change (Hughes et al., 2017). In the Arabian region, coral reefs are incredibly biologically valuable as they are the most biodiverse ecosystem in the arid nations that occupy this area, and they also represent an important economic resource for coastal populations by serving as foraging and nursery grounds for a wide variety of commercially important fish species (Van Lavieren et al., 2011; Burt, 2014; Vaughan et al., 2019). Despite the well-recognized thermal tolerance of corals in the Persian/Arabian Gulf, each summer these corals live near their upper thermal limits and they can be pushed across temperature thresholds that can induce widespread coral bleaching that in extreme conditions can lead to mass mortality (Riegl et al., 2011; Burt et al., 2019). The results of our observations and simulations show that summer shamal winds are the primary determinant of whether or not Gulf reefs cross these important threshold temperatures. Summers that are characterized by high shamal activity have sufficient latent heat loss through evaporation to maintain and/or reset reef temperatures below coral bleaching thresholds, while calm summers provide conditions in which heat can build beyond these critical thresholds, and in extreme cases induce mass mortality in these important ecosystem engineers.
Summer Winds and Coral Bleaching
Coral bleaching events are occurring with increasing frequency and severity both globally and in the Gulf as the world’s seas warm, pushing corals beyond the thermal thresholds to which they have evolved. In the Gulf there has been an overall warming trend since the 1970s (Sheppard, 2003), with SSTs in some areas warming at rates three times the global average (Al-Rashidi et al., 2009), and extreme heating events are happening with longer-than-usual duration and increasing frequency as a result (Riegl, 2007; Riegl et al., 2018). Bleaching events due to elevated temperatures in the southern Gulf were first reported in the late 1970s, followed by a period of relative calm for two decades before severe back-to-back bleaching events in 1996 and 1998 resulted in the loss of >80% of corals across the southern Gulf when SSTs reached 37.7°C, and persisted for several months at 2–2.5°C above normal summer maxima (George and John, 2000; Riegl, 2002; Sheppard and Loughland, 2002). Over the next several years reefs began to recover through growth of survivors and colonization by planktonic larvae produced elsewhere in the Gulf (Sheppard and Loughland, 2002). This recovery was punctuated 5 years later by a moderate bleaching event in 2002 when SSTs reached 37°C and caused widespread bleaching across most corals, but did not induce mass mortality (Riegl, 2003). A very mild bleaching event occurred another 5 years later in 2007, but corals quickly recovered and no mortality was recorded (Foster et al., 2012), and by this point coral communities had recovered to pre-1996 levels in several locations (Burt et al., 2008). After several more years of respite, corals went through several back-to-back bleaching years in quick succession starting in 2010. In 2010 a moderate bleaching event affected a fifth of corals and resulted in loss of 20% of coral cover when hourly maxima reached 36.4°C and temperatures were >33°C twice as long as in non-bleaching years (Riegl and Purkis, 2015). A stronger bleaching event occurred in 2011, when over two-thirds of corals were bleached or partially bleached and a further 20% of coral cover was lost to mortality (Riegl and Purkis, 2015). This was followed by another strong bleaching event in 2012 in which >40% of corals showed signs of bleaching, although only limited mortality occurred (<15% loss of coral cover) (Riegl and Purkis, 2015; Shuail et al., 2016). These recurrent events were followed by a period of recovery in the summers of 2013 through 2016 when bleaching levels were negligible, but were followed by one of the most severe bleaching events on record in the summer of 2017, when virtually all coral across the entire southern Gulf fully bleached, and coral mortality exceeded 85% by the end of summer (Riegl et al., 2018; Burt et al., 2019).
Our observations and simulations from Saadiyat reef (as well as the other study sites) provide strong evidence that inter-annual variability in the occurrence and magnitude of bleaching events in the southern Gulf in recent years is directly tied to the summer shamal wind regime. The severe 2017 bleaching event aligns with an unusually calm summer, when winds exceeding breeze conditions did not occur for more than 5 weeks in the middle of summer, allowing observed daily mean sea-bottom temperatures to reach 35.85°C, a 0.72°C increase over the mean daily maxima of all other years for which observations were available, and to persist above bleaching thresholds for five consecutive weeks and above lethal thresholds for more than a week. These extreme conditions in summer 2017 led to the direct loss of nearly two-thirds of corals within a month of the onset of bleaching, and an overall loss of 73% of coral cover by April 2018 (Burt et al., 2019). Similarly, our model explains the variability in severity of bleaching for the recurrent 2010–2012 bleaching events. Observed data showed that while 2012 had an unusually high number of days above the bleaching threshold (nearly 8 weeks in total), bottom temperatures only marginally crossed this bleaching threshold, never exceeding 35.3°C, and recurrent bursts of moderately strong winds throughout the summer repeatedly dropped temperatures back below threshold levels such that no more than three consecutive weeks were spent in potential bleaching conditions. This aligns with the observation of the occurrence of widespread bleaching but minimal mortality in the southern Gulf in 2012 (Riegl and Purkis, 2015; Shuail et al., 2016). Our simulations also explain why 2010 and 2011 were also bleaching years. In the past decade the summer of 2011 was second in severity only to the summer of 2017, with corals spending five consecutive weeks above bleaching thresholds (37 days), and while maximum temperatures were lower than in 2017, corals still spent nearly a week (5 days) above lethal thresholds, explaining the observations of widespread bleaching in two-thirds of corals and mortality of a fifth or corals this year (Riegl and Purkis, 2015). Likewise, while corals did not spend an unusually long period above bleaching thresholds in 2010 (two consecutive weeks), temperatures did get remarkably warm during this brief period, with temperatures exceeding 35°C for a week, with this short but sharp temperature spike explaining the paradoxical occurrence of only moderate bleaching but high (20%) loss of corals to mortality in summer 2010 (Riegl and Purkis, 2015). Studies elsewhere have shown that under high irradiance and low flow conditions such as would occur during low wind summers, hemispherical corals like those that dominate reefs in the southern Gulf can experience temperatures 0.6°C warmer than the surrounding water due to the presence of a thermal boundary later that limits heat transfer to the surrounding water, explaining the severe bleaching that can occur during low wind conditions (Jimenez et al., 2008, 2011). Observed and modeled data also supported the role of winds in maintaining cooler bottom temperatures in non-bleaching years. Temperatures never exceeded lethal thresholds in the non-bleaching summers of 2008, 2009 or 2013–2016, and on average spent only 11 cumulative days above bleaching thresholds (versus an average of 28 cumulative days during bleaching years) due to the more frequent occurrence of shamal-induced cooling events. Together these results provide strong evidence of the role that summer winds play in modulating the risk of coral bleaching in the southern Gulf.
While the focus of this study has been on the effects of shamal winds on sea-bottom temperatures, shamal winds can also affect water turbidity and this also has implications for coral bleaching risk. Coral bleaching is a response not only to elevated temperatures but also to high irradiance, and reductions in irradiance during high-temperature events can prevent corals from bleaching by limiting stress to the photosystems of the coral’s algal symbionts (Iglesias-Prieto and Trench, 1994; Warner et al., 1999; Anthony et al., 2007). Shamal events in the southern Gulf may not only reduce the thermal stress experienced by corals through evaporative cooling, but likely also concomitantly reduce irradiance through wave-driven sediment resuspension. There is over 800 km of fetch over which shamal winds travel before reaching the southern basin of the Gulf, leading to significant wave heights of 1–2.5 m during typical shamal events (and up to 4.5 m during severe storms), which re-suspend bottom sediments across the shallow (<10 m) coastal areas where reefs occur, causing high turbidity (>20 NTU) which can remain elevated for several days after a return to breeze conditions (Van Parys, 2006; Mocke and Smit, 2008; Smit et al., 2008). Such shamal-induced turbidity would limit the penetration of solar irradiance, reducing light stress on corals during periods of high summer temperatures. Irrespective of temperature, exposure to high UV irradiance can induce bleaching (Gleason and Wellington, 1993), and during high temperature events a reduced irradiance resulting from elevated turbidity has been shown to reduce bleaching on the Great Barrier Reef (Morgan et al., 2017), the Florida reef tract (Van Woesik and McCaffrey, 2017), Micronesia (Van Woesik et al., 2012), and in experimental settings (Anthony et al., 2007; Smith and Birkeland, 2007), and the Persian/Arabian Gulf has recently been identified as one of only 11 global regions that are considered potential refuges to future climate warming through the shading effects of turbidity (Cacciapaglia and Van Woesik, 2016). From a purely physical point of view, at constant albedo, shallow turbid water absorbs more solar radiation than clear water. However, the sediment brought into suspension may change dramatically the reflectance properties of the water, generally increasing the albedo (Tanaka and Nakajima, 1977; McMahon and Moore, 2017). We suspect that when wind-driven wave activity brings sand into suspension around shallow coral reefs, the resulting ‘whitening’ of the waters may have a non-negligible impact on the energetics of the water column. Further research on the role that shamal-induced turbidity plays in reducing susceptibility to coral bleaching during elevated summer temperatures is warranted.
Inter-Annual Variability and the Predictability of Bleaching
There is substantial inter-annual variability in the occurrence of shamal wind events in the Gulf and this has profound implications for the health of coral reef ecosystems. Summer shamals are caused by the steep pressure gradient that forms between a stationary high pressure zone over the eastern Mediterranean and the low pressure zone centered over northwestern India during the summer monsoon, leading to strong winds centered over the Gulf (Rao et al., 2003), such that factors influencing the strength of the Indian Ocean monsoon will affect summer shamal conditions over the Gulf. Al Senafi and Anis (2015) examined inter-annual shamal variability in the northern Gulf over a 40-year period and showed that variation in summer shamals were affected by El Niño Southern Oscillation (ENSO) and Indian Ocean Dipole (IOD) teleconnections (while the North Atlantic Oscillation is more involved in winter shamals). However, the interaction of these events in affecting the atmospheric circulation over southern Asia is complex both in inter-annual and intra-seasonal time scales (Bracco et al., 2005; Kucharski et al., 2008), which does not lead to an easy predictability of shamal activity solely on the basis of these teleconnection patterns, consistent with the erratic occurrence of coral bleaching events in the southern Gulf (Purkis and Riegl, 2005).
Despite the inability to accurately forecast the potential risk of bleaching from year-to-year based on global climate patterns, the results of this study do suggest the potential for use of high-resolution meteorological forecasts to develop predictive models of bleaching risk on shorter time scales. While the model developed for this study employs reanalysis data that is only available up to a few months in the past, sources such as the European Centre for Medium-Range Weather Forecast (ECMWF) or the National Centers for Environmental Prediction (NCEP) provide a variety of forecast products spanning time ranges from 10 days up to 7 months ahead. By combining this forecast data, an automated model could be developed that tracks, in real-time, the probability of sea-bottom temperatures reaching particular bleaching or mortality thresholds based only on the depth of water at a particular reef site and its geographic coordinates. While such a model could not be applied to reefs where water temperature is also determined by open–ocean dynamics (e.g., offshore islands, or where reefs are adjacent to deep waters), it is applicable for reefs occurring in the shallow, relatively flat environments that make up large portions of the sea-bottom in the Gulf, where air-sea interactions determine the water temperature. Efforts are underway to develop such a model. While nothing could be done to prevent the occurrence of bleaching events due to reduced shamal activities, the ability to predict bleaching risk would provide regional marine managers with the opportunity to proactively reduce other cumulative stressors affecting reefs (e.g., nutrient discharge, dredging or reclamation activities) to minimize potential losses during bleaching.
Do Winds Modulate Bleaching Globally?
It has been recognized since the early mass bleaching events of the 1980s that there was an association between elevated SSTs, low winds, and coral bleaching (Goreau and Hayes, 1994), although much of the early attention focused on the association between low winds and clear skies, thus driving higher UV irradiance rather than the influence of wind on temperature (Glynn, 1996; Brown, 1997). The recurrent global bleaching events over the past three decades have provided numerous examples of the association between coral bleaching and low wind conditions (e.g., Spencer et al., 2000; Skirving and Guinotte, 2001; Jokiel and Brown, 2004), and the mechanistic effects of winds in driving temperature reduction are becoming more appreciated. In studying the hydrographic and meteorological conditions surrounding the 1990s bleaching event in the Caribbean, Smith (2001) showed that low wind conditions that reduced latent heat flux from evaporative cooling preceded coral bleaching. Later work by Manzello et al. (2007) showed that winds associated with hurricanes induced cooling that was responsible for differences in the extent and recovery time of coral bleaching across the Caribbean, and that the duration of cooling was tightly correlated to wind speed. A contrasting opinion was expressed by Berkelmans (2002), who explored the role that a variety of factors played in the extent of coral bleaching over a decade at 13 locations on the Great Barrier Reef and who concluded that calm wind conditions were not correlated with the extent of bleaching. However, his analyses of winds relied on monthly averages, a process that the results of our analyses show would obfuscate the effects of any short term, high wind cooling events. A later paper by the same author came to the same conclusion, showing that shorter-term averaging (3–6 days) provides better capacity to predict bleaching than averaging over longer periods (Berkelmans et al., 2004). Overall, the results of the above studies do complement the observations made here in suggesting that local wind regimes can play an important role in modulating the thermal environments on reefs, and therefore control the magnitude of coral bleaching.
While the results of this study show that winds can play an incredibly important role in structuring the thermal environment on reefs, the magnitude of this effect is highly dependent on local environmental conditions. The high latent heat flux that was observed in this study was a direct function of the extreme air temperatures occurring in the southern Gulf in the summer (on land >45°C daily maxima are common), because the amount of water that can be evaporated before reaching saturation – and thus the amount of heat that can be removed by the water – increases nearly exponentially with air temperature. Such extreme thermal environments tend to occur in the sub-tropical latitudes of ca. 25–30° where Hadley cell high-pressure zones result in areas with scarce cloud cover and high solar irradiance during summer, resulting in air temperatures that can exceed 40°C, except where local mountainous topography supersedes the effects of latitude on regional climate. Coral provinces that experience extreme summer air temperatures comparable to the southern Gulf sites studied here include the remainder of the Persian Gulf, the Gulf of Oman, the Red Sea and northwestern Australia (particularly during La Nina events). Such locations have prime environmental conditions for wind-driven cooling during summer, and it is likely that summer wind regimes in these areas are tightly linked with the degree of coral bleaching. Although there have been no direct investigations of these effects that we are aware of, it is known that a severe coral bleaching event affected reefs in the central Red Sea in 2010, for example, and that the onset of bleaching coincided with a period of very weak winds that persisted from mid-July until early September (Pineda et al., 2013), suggesting that similar wind-driven cooling plays an important role in modulating bleaching in that thermally extreme environment as well. The extent to which winds drive evaporative cooling events in other regions will be dependent both on local air temperatures, where warmer air will result in more rapid cooling, as well as on local hydrographic conditions, where winds will play more important roles in shallow areas with limited subtidal topographic complexity to affect coastal currents and mixing. In reef environments adjacent to deep waters, wind will also affect water temperature, but additional processes will need to be taken into account: deepening of the thermocline, and coastal upwelling or downwelling. The first always has a cooling effect, as it is produced by the turbulent entrainment of colder, sub-thermocline water; upwelling also leads to cooling, while the thermal signature of downwelling is determined by mesoscale SST patterns.
Shamal Winds and the Future of Gulf Reefs
Bleaching events in the Gulf have occurred with increasing frequency in recent decades in association with increasing SSTs (Riegl et al., 2018), and this has led to dramatic reductions in live coral cover and shifts in species composition on many reefs across the region (Burt et al., 2011, 2013, 2016, 2019; Bento et al., 2016). Climate models predict that regional temperatures are likely to continue to increase in the coming decades (Sheppard, 2003; Lelieveld et al., 2016), suggesting that summer shamal winds are likely to become increasingly important to maintaining the integrity of these already impaired ecosystems. Observations of shamal conditions over the past 40 years has shown that mean number of summer shamal events have dropped by a third since 1996 compared with the previous two decades (mean of 26 summer shamals per year from 1973 to 1995 versus 18 per year from 1996 to 2012; Al Senafi and Anis, 2015), explaining the surge in recurrent bleaching events that have occurred in the Gulf since the mid-1990s. Whether this is due to temporal variability or is part of a long-term trend toward weakening shamals is unclear. There is a great deal of uncertainty around the influence of climate change on the future of the monsoon, but some models project a trend toward increasing strength in the coming decades (Hassan et al., 2015; Niu et al., 2015), and the strengthening of the low pressure zone over India would potentially result in enhanced shamal activity over the Gulf, providing capacity for protective cooling of water columns above reefs. However, while the monsoon may strengthen on average, it is also expected to become increasingly variable from year-to-year (Turner and Annamalai, 2012; Sharmila et al., 2015), which would result in the continued recurrence of the low-wind summers that allow temperatures to build past coral bleaching and mortality thresholds. Given that corals in the southern Gulf require more than a decade to recover from mass mortality events (Burt et al., 2008; Riegl and Purkis, 2009), the occurrence of even occasional low wind summers would result in the continued impairment of these reefs. Further research on the regional scale implications of climate change for the shamal wind regime is warranted.
Author Contributions
JB and FP conceived the study design, wrote the manuscript, and conceived and developed graphical outputs from analyses. FP and CX developed the model and ran simulations. GV performed fieldwork to deploy and collect reef-bottom temperature loggers and collated the observational data. All authors edited the manuscript.
Funding
This research was supported by funds from New York University Abu Dhabi.
Conflict of Interest Statement
The authors declare that the research was conducted in the absence of any commercial or financial relationships that could be construed as a potential conflict of interest.
Acknowledgments
The authors would like to thank New York University Abu Dhabi for providing funding to support this study and the Environment Agency Abu Dhabi for permitting this research. Stimulating discussions with Marcello Vichi, Annalisa Bracco, and Olivier Pauluis are also acknowledged.
Supplementary Material
The Supplementary Material for this article can be found online at: https://www.frontiersin.org/articles/10.3389/fmars.2019.00205/full#supplementary-material
FIGURE S1 | Correlation between mean daily wind speed and daily temperature change on the sea bottom (compared with the previous day) for each day between 1 July and 1 September for the years 2012 to 2017, based on (A) observations (green) and (B) simulations (blue). The correlation coefficient, slope, and intercept of the least-square fitting straight line (in black) are reported.
FIGURE S2 | Simulated (blue) vs. observed (green) daily averaged bottom temperature at (A) Ras Ghanada and (B) Dhabiya reefs. Vertical lines mark the first day of each year and of each summer month.
FIGURE S3 | Simulated (blue) and observed (green) bottom temperature at (A) Ras Ghanada and (B) Dhabiya reefs during summer 2013 showing a clear diurnal cycle.
FIGURE S4 | Sea-bottom temperature, wind speed and direction and sea-surface heat fluxes in July and August 2012 to 2017 at Ras Ghanada. Top panels: simulated (blue) and observed (green) daily averaged bottom temperature (left scale) and daily averaged wind speed (right scale); the level corresponding to the 34.35°C coral bleaching threshold has been highlighted for visual reference. Mid panels: hourly direction from which the wind blows. Bottom panels: daily averaged sensible (cyan), infrared (black), and latent (purple) heat fluxes at the sea surface.
FIGURE S5 | Sea-bottom temperature, wind speed and direction and sea-surface heat fluxes in July and August 2012 to 2017 at Dhabiya. Top panels: simulated (blue) and observed (green) daily averaged bottom temperature (left scale) and daily averaged wind speed (right scale); the level corresponding to an estimated 34.5°C coral bleaching threshold has been highlighted for visual reference. Mid panels: hourly direction from which the wind blows. Bottom panels: daily averaged sensible (cyan), infrared (black), and latent (purple) heat fluxes at the sea surface.
FIGURE S6 | Number of days that corals were exposed to a range of sea-bottom temperatures during summer (July 1 to August 31) for the decade from 2008 to 2017 at Ras Ghanada reef. (A) Total days over the entire summer, (B) maximum number of cumulative days at or above a given temperature. Both are based on 0.25°C temperature intervals. The 2012–2015 data are based on observed bottom temperatures on the reef, while the other years are simulated based on the ERA 5 dataset.
FIGURE S7 | Number of days that corals were exposed to a range of sea-bottom temperatures during summer (July 1 to August 31) for the decade from 2008 to 2017 at Dhabiya reef. (A) Total days over the entire summer, (B) maximum number of cumulative days at or above a given temperature. Both are based on 0.25°C temperature intervals. The 2012–2015 data are based on observed bottom temperatures on the reef, while the other years are simulated based on the ERA 5 dataset.
Footnotes
References
Al Azhar, M., Temimi, M., Zhao, J., and Ghedira, H. (2016). Modeling of circulation in the Arabian Gulf and the Sea of Oman: skill assessment and seasonal thermohaline structure. J. Geophys. Res. Oceans 121, 1700–1720. doi: 10.1002/2015JC011038
Al Senafi, F., and Anis, A. (2015). Shamals and climate variability in the Northern Arabian/Persian Gulf from 1973 to 2012. Int. J. Climatol. 35, 4509–4528. doi: 10.1002/joc.4302
Al-Rashidi, T., El-Gamily, H., Amos, C., and Rakha, K. (2009). Sea surface temperature trends in Kuwait Bay, Arabian Gulf. Nat. Hazards 50, 73–82. doi: 10.1007/s11069-008-9320-9
Anthony, K. R. N., Connolly, S. R., and Hoegh-Guldberg, O. (2007). Bleaching, energetics, and coral mortality risk: effects of temperature, light, and sediment regime. Limnol. Oceanogr. 52, 716–726. doi: 10.4319/lo.2007.52.2.0716
Bentamy, A., Katsaros, K. B., Mestas-Nuñez, A. M., Drennan, W. M., Forde, E. B., and Roquet, H. (2003). Satellite estimates of wind speed and latent heat flux over the global oceans. J. Clim. 16, 637–656. doi: 10.1175/1520-0442 (2003)016<0637:SEOWSA>2.0.CO;2
Bento, R., Hoey, A. S., Bauman, A. G., Feary, D. A., and Burt, J. A. (2016). The implications of recurrent disturbances within the world’s hottest coral reef. Mar. Pollut. Bull. 105, 466–472. doi: 10.1016/j.marpolbul.2015.10.006
Berkelmans, R. (2002). Time-integrated thermal bleaching thresholds of reefs and their variation on the Great Barrier Reef. Mar. Ecol. Prog. Ser. 229, 73–82. doi: 10.3354/meps229073
Berkelmans, R., De’ath, G., Kininmonth, S., and Skirving, W. J. (2004). A comparison of the 1998 and 2002 coral bleaching events on the Great Barrier Reef: spatial correlation, patterns, and predictions. Coral Reefs 23, 74–83. doi: 10.1007/s00338-003-0353-y
Bracco, A., Kucharski, F., Molteni, F., Hazeleger, W., and Severijns, C. (2005). Internal and forced modes of variability in the Indian Ocean. Geophys. Res. Lett. 32:L12707. doi: 10.1029/2005GL023154
Brown, B. E. (1997). Coral bleaching: causes and consequences. Coral Reefs 16, S129–S138. doi: 10.1007/s003380050249
Burchard, H., Bolding, K., and Villarreal, M. R. (1999). GOTM, a General Ocean Turbulence Model: Theory, Implementation and Test Cases. Brussels: European Commission.
Burt, J. (2013). The growth of coral reef science in the Gulf: a historical perspective. Mar. Pollut. Bull. 72, 289–301. doi: 10.1016/j.marpolbul.2013.05.016
Burt, J. (2014). The environmental costs of coastal urbanization in the Arabian Gulf. City 18, 760–770. doi: 10.1080/13604813.2014.962889
Burt, J., Al-Harthi, S., and Al-Cibahy, A. (2011). Long-term impacts of bleaching events on the world’s warmest reefs. Mar. Environ. Res. 72, 225–229. doi: 10.1016/j.marenvres.2011.08.005
Burt, J., Al-Khalifa, K., Khalaf, E., Alshuwaik, B., and Abdulwahab, A. (2013). The continuing decline of coral reefs in Bahrain. Mar. Pollut. Bull. 72, 357–363. doi: 10.1016/j.marpolbul.2012.08.022
Burt, J., Bartholomew, A., and Usseglio, P. (2008). Recovery of corals a decade after bleaching in Dubai, United Arab Emirates. Mar. Biol. 154, 27–36. doi: 10.1007/s00227-007-0892-9
Burt, J. A., Paparella, F., Al-Mansoori, N., Al-Mansoori, A., and Al-Jailani, H. (2019). Causes and consequences of the 2017 coral bleaching event in the southern Persian/Arabian Gulf. Coral Reefs 1–23. doi: 10.1007/s00338-00019-01767-y
Burt, J. A., Smith, E. G., Warren, C., and Dupont, J. (2016). An assessment of Qatar’s coral communities in a regional context. Mar. Pollut. Bull. 105, 473–479. doi: 10.1016/j.marpolbul.2015.09.025
Cacciapaglia, C., and Van Woesik, R. (2016). Climate-change refugia: shading reef corals by turbidity. Glob. Chang. Biol. 22, 1145–1154. doi: 10.1111/gcb.13166
Camp, E. F., Schoepf, V., Mumby, P. J., Hardtke, L. A., Rodolfo-Metalpa, R., Smith, D. J., et al. (2018). The future of coral reefs subject to rapid climate change: lessons from natural extreme environments. Front. Mar. Sci. 5:4. doi: 10.3389/fmars.2018.00004
Carpenter, K. E., Abrar, M., Aeby, G., Aronson, R. B., Banks, S., Bruckner, A., et al. (2008). One-third of reef-building corals face elevated extinction risk from climate change and local impacts. Science 321, 560–563. doi: 10.1126/science.1159196
Cavalcante, G., Kjerfve, B., Feary, D., Bauman, A., and Usseglio, P. (2011). Water currents and water budget in a coastal mega-structure, Palm Jumeirah lagoon, Dubai, UAE. J. Coast. Res. 27, 384–393. doi: 10.2112/JCOASTRES-D-09-00177.1
Chaves-Fonnegra, A., Riegl, B., Zea, S., Lopez, J. V., Smith, T., Brandt, M., et al. (2018). Bleaching events regulate shifts from corals to excavating sponges in algae-dominated reefs. Glob. Chang. Biol. 24, 773–785. doi: 10.1111/gcb.13962
Coles, S. (2003). Coral species diversity and environmental factors in the Arabian Gulf and the Gulf of Oman: a comparison to the Indo-Pacific region. Atoll Res. Bull. 507, 1–19. doi: 10.5479/si.00775630.507.1
Coles, S. L., and Riegl, B. M. (2013). Thermal tolerances of reef corals in the Gulf: a review of the potential for increasing coral survival and adaptation to climate change through assisted translocation. Mar. Pollut. Bull. 72, 232–332. doi: 10.1016/j.marpolbul.2012.09.006
Costanza, R., De Groot, R., Sutton, P., Van Der Ploeg, S., Anderson, S. J., Kubiszewski, I., et al. (2014). Changes in the global value of ecosystem services. Glob. Environ. Change 26, 152–158. doi: 10.1016/j.gloenvcha.2014.04.002
Elshorbagy, W., Azam Mir, H., and Taguchi, K. (2006). Hydrodynamic Characterization and Modeling of the Arabian Gulf. J. Waterway Port Coast. Ocean Eng. 132, 47–56. doi: 10.1061/(ASCE)0733-950X (2006)132:1(47)
Foster, K., Foster, G., Al-Cibahy, A., Al-Harthi, S., Purkis, S. J., and Riegl, B. (2012). “Environmental setting and temporal trends in southeastern Gulf coral communities,” in Coral Reefs of the Gulf: Adaptation to Climatic Extremes, eds B. Riegl and S. Purkis (Dordrecht: Springer), 51–70.
Frieler, K., Meinshausen, M., Golly, A., Mengel, M., Lebek, K., Donner, S. D., et al. (2012). Limiting global warming to 2 °C is unlikely to save most coral reefs. Nat. Clim. Change 3, 165–170. doi: 10.1038/nclimate1674
George, D., and John, D. (2000). “The status of coral reefs and associated macroalgae in Abu Dhabi (UAE) after recent coral bleaching events,” in Proceedings of the International Symposium on the Extent and Impact of Coral Bleaching in the Arabian Region, National Commission for Wildlife Conservation and Development, (Riyadh: National Commission for Wildlife Conservation and Development).
Gleason, D. F., and Wellington, G. M. (1993). Ultraviolet radiation and coral bleaching. Nature 365, 836–838. doi: 10.1038/365836a0
Glynn, P. W. (1996). Coral reef bleaching: facts, hypotheses and implications. Glob. Chang. Biol. 2, 495–509. doi: 10.1111/j.1365-2486.1996.tb00063.x
Graham, N. A. J., Jennings, S., Macneil, M. A., Mouillot, D., and Wilson, S. K. (2015). Predicting climate-driven regime shifts versus rebound potential in coral reefs. Nature 518, 94–97. doi: 10.1038/nature14140
Grizzle, R. E., Ward, K. M., Alshihi, R. M. S., and Burt, J. A. (2016). Current status of coral reefs in the United Arab Emirates: Distribution, extent, and community structure with implications for management. Mar. Pollut. Bull. 105, 515–523. doi: 10.1016/j.marpolbul.2015.10.005
Hassan, M., Du, P., Jia, S., Iqbal, W., Mahmood, R., and Ba, W. (2015). An assessment of the south Asian summer monsoon variability for present and future climatologies using a high resolution regional climate model (RegCM4.3) under the AR5 scenarios. Atmosphere 6:1833. doi: 10.3390/atmos6111833
Hersbach, H., and Dee, D. (2016). ERA5 Reanalysis is in Production. ECMWF Newsletter, No. 147, ECMWF, Reading, United Kingdom. Available at: https://www.ecmwf.int/sites/default/files/elibrary/2016/16299-newsletter-no147-spring-2016.pdf
Howells, E. J., Abrego, D., Meyer, E., Kirk, N. L., and Burt, J. A. (2016). Host adaptation and unexpected symbiont partners enable reef-building corals to tolerate extreme temperatures. Glob. Chang. Biol. 22, 2702–2714. doi: 10.1111/gcb.13250
Howells, E. J., Dunshea, G., Mcparland, D., Vaughan, G. O., Heron, S. F., Pratchett, M. S., et al. (2018). Species-specific coral calcification responses to the extreme environment of the southern Persian Gulf. Front. Mar. Sci. 5:56 doi: 10.3389/fmars.2018.00056
Hughes, T. P., Barnes, M. L., Bellwood, D. R., Cinner, J. E., Cumming, G. S., Jackson, J. B. C., et al. (2017). Coral reefs in the Anthropocene. Nature 546, 82–90. doi: 10.1038/nature22901
Hughes, T. P., Kerry, J. T., Baird, A. H., Connolly, S. R., Dietzel, A., Eakin, C. M., et al. (2018). Global warming transforms coral reef assemblages. Nature 556, 492–496. doi: 10.1038/s41586-018-0041-2
Hume, B. C. C., D’angelo, C., Burt, J. A., and Wiedenmann, J. (2018). Fine-scale biogeographical boundary delineation and sub-population resolution in the Symbiodinium thermophilum coral symbiont group from the persian/arabian gulf and gulf of oman. Front. Mar. Sci. 5:138. doi: 10.3389/fmars.2018.00138
Hume, B., D’angelo, C., Smith, E., Stevens, J., Burt, J., and Wiedenmann, J. (2015). Symbiodinium thermophilus sp. nov., a thermotolerant symbiotic alga prevalent in corals of the world’s hottest sea, the Persian / Arabian Gulf. Nat. Sci. Rep. 5:8562. doi: 10.1038/srep08562
Iglesias-Prieto, R., and Trench, R. K. (1994). Acclimation and adaptation to irradiance in symbiotic dinoflagellates. I. Responses of the photosynthetic unit to changes in photon flux density. Mar. Ecol. Prog. Ser. 113, 163–175. doi: 10.3354/meps113163
Jimenez, I. M., Kühl, M., Larkum, A. W. D., and Ralph, P. J. (2008). Heat budget and thermal microenvironment of shallow-water corals: Do massive corals get warmer than branching corals? Limnol. Oceanogr. 53, 1548–1561. doi: 10.4319/lo.2008.53.4.1548
Jimenez, I. M., Kühl, M., Larkum, A. W. D., and Ralph, P. J. (2011). Effects of flow and colony morphology on the thermal boundary layer of corals. J. R. Soc. Interface 8, 1785–1795. doi: 10.1098/rsif.2011.0144
Jokiel, P. L., and Brown, E. K. (2004). Global warming, regional trends and inshore environmental conditions influence coral bleaching in Hawaii. Glob. Chang. Biol. 10, 1627–1641. doi: 10.1111/j.1365-2486.2004.00836.x
Kara, A. B., Wallcraft, A. J., and Hurlburt, H. E. (2007). A correction for land contamination of atmospheric variables near land–sea boundaries. J. Phys. Oceanogr. 37, 803–818. doi: 10.1175/JPO2984.1
Kirk, N. L., Howells, E. J., Abrego, D., Burt, J. A., and Meyer, E. (2018). Genomic and transcriptomic signals of thermal tolerance in heat-tolerant corals (Platygyra daedalea) of the Arabian/Persian Gulf. Mol. Ecol. 27, 5180–5194. doi: 10.1111/mec.14934
Kucharski, F., Bracco, A., Yoo, J. H., and Molteni, F. (2008). Atlantic forced component of the Indian monsoon interannual variability. Geophys. Res. Lett. 35:L04706. doi: 10.1029/2007GL033037
Lelieveld, J., Proestos, Y., Hadjinicolaou, P., Tanarhte, M., Tyrlis, E., and Zittis, G. (2016). Strongly increasing heat extremes in the Middle East and North Africa (MENA) in the 21st century. Clim. Change 137, 245–260. doi: 10.1007/s10584-016-1665-6
Liu, G., Strong, A. E., and Skirving, W. (2003). Remote sensing of sea surface temperatures during 2002 Barrier Reef coral bleaching. Eos Trans. Am. Geophys. Union 84, 137–141. doi: 10.1029/2003EO150001
Manzello, D. P., Brandt, M., Smith, T. B., Lirman, D., Hendee, J. C., and Nemeth, R. S. (2007). Hurricanes benefit bleached corals. Proc. Natl. Acad. Sci. U.S.A. 104, 12035–12039. doi: 10.1073/pnas.0701194104
McMahon, A., and Moore, R. D. (2017). Influence of turbidity and aeration on the albedo of mountain streams. Hydrol. Process. 31, 4477–4491. doi: 10.1002/hyp.11370
Mocke, G., and Smit, F. (2008). “Coastal processes understanding for safeguarding the dynamic Dubai coastal zone,” in Proceedings of the Solutions to Coastal Disasters 2008, (Reston, VA: American Society of Civil Engineers), 643–654. doi: 10.1061/40968(312)58
Morgan, K. M., Perry, C. T., Johnson, J. A., and Smithers, S. G. (2017). Nearshore turbid-zone corals exhibit high bleaching tolerance on the great barrier reef following the 2016 ocean warming event. Front. Mar. Sci. 4:224. doi: 10.3389/fmars.2017.00224
Niu, X., Wang, S., Tang, J., Lee, D.-K., Gutowski, W., Dairaku, K., et al. (2015). Projection of Indian summer monsoon climate in 2041–2060 by multiregional and global climate models. J. Geophys. Res. Atmos. 120, 1776–1793. doi: 10.1002/2014JD022620
Osman, E. O., Smith, D. J., Ziegler, M., Kürten, B., Conrad, C., El-Haddad, K. M., et al. (2018). Thermal refugia against coral bleaching throughout the northern Red Sea. Glob. Chang. Biol. 24, e474–e484. doi: 10.1111/gcb.13895
Pineda, J., Starczak, V., Tarrant, A., Blythe, J., Davis, K., Farrar, T., et al. (2013). Two spatial scales in a bleaching event: corals from the mildest and the most extreme thermal environments escape mortality. Limnol. Oceanogr. 58, 1531–1545. doi: 10.4319/lo.2013.58.5.1531
Pratchett, M., Wilson, S., Graham, N., Munday, P., Jones, G., and Polunin, N. (2009). “Coral bleaching and consequences for motile reef organisms: past, present and uncertain future effects,” in Coral Bleaching: Patterns, Processes, Causes and Consequences. Ecological Studies, eds M. J. H. van Oppen, and J. M. Lough (Berlin: Springer), 139–158.
Pratchett, M. S., Hoey, A. S., Wilson, S. K., Messmer, V., and Graham, N. A. (2011). Changes in biodiversity and functioning of reef fish assemblages following coral bleaching and coral loss. Diversity 3, 424–452. doi: 10.1111/gcb.14119
Purkis, S., and Riegl, B. (2005). Spatial and temporal dynamics of Arabian Gulf coral assemblages quantified from remote-sensing and in situ monitoring data. Mar. Ecol. Prog. Ser. 287, 99–113. doi: 10.3354/meps287099
Rao, P. G., Hatwar, H. R., Al-Sulaiti, M. H., and Al-Mulla, A. H. (2003). Summer shamals over the Arabian Gulf. Weather 58, 471–478. doi: 10.1002/wea.6080581207
Reynolds, M. (1993). Physical oceanography of the Gulf, Strait of Hormuz, and the Gulf of Oman: results from the Mt Mitchell expedition. Mar. Pollut. Bull. 27, 35–39. doi: 10.1016/0025-326X(93)90007-7
Riegl, B. (2002). Effects of the 1996 and 1998 positive sea-surface temperature anomalies on corals, coral diseases and fish in the Arabian Gulf (Dubai, UAE). Mar. Biol. 140, 29–40. doi: 10.1007/s002270100676
Riegl, B. (2003). Climate change and coral reefs: different effects in two high-latitude areas (Arabian Gulf, South Africa). Coral Reefs 22, 433–446. doi: 10.1007/s00338-003-0335-0
Riegl, B. (2007). “Extreme climatic events and coral reefs: how much short-term threat from global change?” in Geological Approaches to Coral Reef Ecology, ed. R. Aronson (New York, NY: Springer), 315–341.
Riegl, B., Johnston, M., Purkis, S., Howells, E., Burt, J., Steiner, S., et al. (2018). Population collapse dynamics in Acropora downingi, an Arabian/Persian Gulf ecosystem-engineering coral, linked to rising temperature. Glob. Chang. Biol. 24, 2447–2462. doi: 10.1111/gcb.14114
Riegl, B., and Purkis, S. (2009). Model of coral population response to accelerated bleaching and mass mortality in a changing climate. Ecol. Model. 220, 192–208. doi: 10.1016/j.ecolmodel.2008.09.022
Riegl, B., and Purkis, S. (2012). “Environmental constraints for reef building in the Gulf,” in Coral Reefs of the Gulf: Adaptation to Climatic Extremes, eds B. M. Riegl and S. J. Purkis (Berlin: Springer), 5–32.
Riegl, B., and Purkis, S. (2015). Coral population dynamics across consecutive mass mortality events. Glob. Chang. Biol. 21, 3995–4005. doi: 10.1111/gcb.13014
Riegl, B. M., Purkis, S. J., Al-Cibahy, A. S., Abdel-Moati, M. A., and Hoegh-Guldberg, O. (2011). Present limits to heat-adaptability in corals and population-level responses to climate extremes. PLoS One 6:e24802. doi: 10.1371/journal.pone.0024802
Riegl, B. M., Purkis, S. J., Al-Cibahy, A. S., Al-Harthi, S., Grandcourt, E., Al-Sulaiti, K., et al. (2012). “Coral bleaching and mortality thresholds in the SE Gulf: highest in the world,” in Coral Reefs of the Gulf: Adaptation to Climatic Extremes, eds B. M. Riegl and S. J. Purkis (Berlin: Springer), 95–105.
Sharmila, S., Joseph, S., Sahai, A. K., Abhilash, S., and Chattopadhyay, R. (2015). Future projection of Indian summer monsoon variability under climate change scenario: an assessment from CMIP5 climate models. Glob. Planet. Change 124, 62–78. doi: 10.1016/j.gloplacha.2014.11.004
Sheppard, C. (2003). Predicted recurrences of mass coral mortality in the Indian Ocean. Nature 425, 294–297. doi: 10.1038/nature01987
Sheppard, C., and Loughland, R. (2002). Coral mortality and recovery in response to increasing temperature in the southern Arabian Gulf. Aquat. Ecosyst. Health Manage. 5, 395–402. doi: 10.1080/14634980290002020
Sheppard, C., Price, A., and Roberts, C. (1992). Marine Ecology of the Arabian Region: Patterns and Processes in Extreme Tropical Environments. Toronto: Academic Press.
Shuail, D., Wiedenmann, J., D’angelo, C., Baird, A. H., Pratchett, M. S., Riegl, B., et al. (2016). Local bleaching thresholds established by remote sensing techniques vary among reefs with deviating bleaching patterns during the 2012 event in the Arabian/Persian Gulf. Mar. Pollut. Bull. 105, 654–659. doi: 10.1016/j.marpolbul.2016.03.001
Skirving, W., and Guinotte, J. (2001). “The sea surface temperature story on the Great Barrier Reef during the coral bleaching event of 1998,” in Oceanographic Processes of Coral Reefs. Physical and Biological Links in the Great Barrier Reef, ed. E. Wolanski (Townsville: Australian Institute of Marine Science), 301–313.
Smit, F., Mocke, G., Giarusso, C., and Baranasuriya, P. (2008). “Coastal modelling of the Dubai coastline with emphasis on morphological model validation,” in Proceedings of the Conference on Coastal and Port Engineering in Developing Countries VII, (Dubai: PIANC-COPEDEC).
Smith, E., Hume, B., Delaney, P., Wiedenmann, J., and Burt, J. (2017). Genetic structure of coral-Symbiodinium symbioses on the world’s warmest reefs. PLoS One 12:e0180169. doi: 10.1371/journal.pone.0180169
Smith, L., and Birkeland, C. (2007). Effects of intermittent flow and irradiance level on back reef Porites corals at elevated seawater temperatures. J. Exp. Mar. Biol. Ecol. 341, 282–294. doi: 10.1016/j.jembe.2006.10.053
Smith, N. P. (2001). Weather and hydrographic conditions associated with coral bleaching: lee Stocking Island, Bahamas. Coral Reefs 20, 415–422. doi: 10.1007/s00338-001-0189-2
Spencer, T., Teleki, K. A., Bradshaw, C., and Spalding, M. D. (2000). Coral bleaching in the southern seychelles during the 1997–1998 Indian ocean warm event. Mar. Pollut. Bull. 40, 569–586. doi: 10.1016/S0025-326X(00)00026-6
Stips, A. (2010). Fitting Measured Irradiance of Jerlov Water Types to Double Exponential Functions Using R. Brussels: European Commission Joint Research Centre Institute for Environment and Sustainability EUR 24658EN.
Tanaka, M., and Nakajima, T. (1977). Effects of oceanic turbidity and index of refraction of hydrosols on the flux of solar radiation in the atmosphere-ocean system. J. Quant. Spectros. Radiat. Transfer 18, 93–111. doi: 10.1016/0022-4073(77)90130-3
Thoppil, P., and Hogan, P. (2010a). A modeling study of circulation and eddies in the Persian Gulf. J. Phys. Oceanogr. 40, 2122–2134. doi: 10.1175/2010JPO4227.1
Thoppil, P. G., and Hogan, P. J. (2010b). Persian Gulf response to a wintertime shamal wind event. Deep Sea Res. Part I Oceanogr. Res. Pap. 57, 946–955. doi: 10.1016/j.dsr.2010.03.002
Turner, A. G., and Annamalai, H. (2012). Climate change and the South Asian summer monsoon. Nat. Clim. Change 2, 587–595. doi: 10.1038/nclimate1495
Van Lavieren, H., Burt, J., Feary, D., Cavalcante, G., Marquis, E., Benedetti, L., et al. (2011). Managing the Growing Impacts of Development on Fragile Coastal and Marine Systems: Lessons from the Gulf A Policy Report. Hamilton, ON: United Nations University.
Van Parys, M. (2006). “Environmental monitoring during the construction of the Jebel Ali new container terminal,” in Proceedings of the 15th International Congress of the International Federation of Hydrographic Societies, London, 18–22.
Van Woesik, R., Houk, P., Isechal, A. L., Idechong, J. W., Victor, S., and Golbuu, Y. (2012). Climate-change refugia in the sheltered bays of Palau: analogs of future reefs. Ecol. Evol. 2, 2474–2484. doi: 10.1002/ece3.363
Van Woesik, R., and McCaffrey, K. R. (2017). Repeated thermal stress, shading, and directional selection in the Florida reef tract. Front. Mar. Sci. 4:182. doi: 10.3389/fmars.2017.00182
Vaughan, G. O., Al-Mansoori, N., and Burt, J. (2019). “The Arabian Gulf,” in World Seas: An Environmental Evaluation, 2nd Edn, ed. C. Sheppard (Amsterdam, NL: Elsevier Science), 1–23. doi: 10.1016/B978-0-08-100853-9.00001-4
Vaughan, G. O., and Burt, J. A. (2016). The changing dynamics of coral reef science in Arabia. Mar. Pollut. Bull. 105, 441–458. doi: 10.1016/j.marpolbul.2015.10.052
Warner, M. E., Fitt, W. K., and Schmidt, G. W. (1999). Damage to photosystem II in symbiotic dinoflagellates: a determinant of coral bleaching. Proc. Natl. Acad. Sci. U.S.A. 96, 8007–8012. doi: 10.1073/pnas.96.14.8007
Wilkinson, C. (2008). Status of Coral Reefs of the World: 2008. Townsville: Australian Institute of Marine Science.
Wolff, N. H., Donner, S. D., Cao, L., Iglesias-Prieto, R., Sale, P. F., and Mumby, P. J. (2015). Global inequities between polluters and the polluted: climate change impacts on coral reefs. Glob. Chang. Biol. 21, 3982–3994. doi: 10.1111/gcb.13015
Yu, Y., Notaro, M., Kalashnikova, O. V., and Garay, M. J. (2016). Climatology of summer Shamal wind in the Middle East. J. Geophys. Res. Atmos. 121, 289–305. doi: 10.1007/s10661-017-6196-8
Keywords: coral, bleaching, wind, shamal, latent heat flux, oceanography, Arabian Gulf, Persian Gulf
Citation: Paparella F, Xu C, Vaughan GO and Burt JA (2019) Coral Bleaching in the Persian/Arabian Gulf Is Modulated by Summer Winds. Front. Mar. Sci. 6:205. doi: 10.3389/fmars.2019.00205
Received: 24 July 2018; Accepted: 02 April 2019;
Published: 24 April 2019.
Edited by:
Peter Lynton Harrison, Southern Cross University, AustraliaReviewed by:
Anthony William Larkum, University of Technology Sydney, AustraliaAldo Cróquer, Simón Bolívar University, Venezuela
Copyright © 2019 Paparella, Xu, Vaughan and Burt. This is an open-access article distributed under the terms of the Creative Commons Attribution License (CC BY). The use, distribution or reproduction in other forums is permitted, provided the original author(s) and the copyright owner(s) are credited and that the original publication in this journal is cited, in accordance with accepted academic practice. No use, distribution or reproduction is permitted which does not comply with these terms.
*Correspondence: Francesco Paparella, RnJhbmNlc2NvLlBhcGFyZWxsYUBueXUuZWR1 John A. Burt, Sm9obi5CdXJ0QG55dS5lZHU=