 Federica Guerrini
 Lorenzo Mari
 Renato Casagrandi
- DEIB Dipartimento di Elettronica, Informazione e Bioingegneria, Politecnico di Milano, Milan, Italy
Several anthropogenic stressors threaten the Mediterranean basin, which is currently regarded as one of the most impacted marine ecoregions globally. Among those stressors, marine plastic litter is causing increasing concern about its environmental and biological consequences, the latter being largely unknown. To improve the understanding of these aspects, here we provide a mapped indicator of the risk of plastic ingestion by the fin whale Balaenoptera physalus, an endangered cetacean whose feeding grounds are located within the Pelagos Sanctuary for Mediterranean Marine Mammals, in the north-western Mediterranean Sea. We analyse a decade (2000–2010) of advection patterns of marine plastic litter, modeled as Lagrangian particles and released from the three major sources: untreated waste along coasts, plastic discharged from rivers and along maritime shipping routes. Risk of exposure to microplastics via food ingestion for fin whales is then evaluated by interlacing the plastic litter distribution obtained via particle tracking with maps of habitat suitability based on bathymetry and satellite-derived estimates of chlorophyll-a. Our modeling results locate the highest risk values in the Central Ligurian Sea, and show that all the three main sources of plastic litter taken into account clearly contribute to impacting cetaceans in the Sanctuary, yet with spatial and interannual variability of patterns. The procedure formalized with our approach can be extended to assess the risk caused by ingestion of plastics by other taxa and/or in other MPAs, as we suggest by providing an application on the whole ecosystem of Pelagos, thus informing targeted actions to tackle the complex issue of marine litter.
1. Introduction
Plastic materials have undisputably revolutionized our daily life, however their countless purposes are reflected by their ubiquitous presence as litter in the environment. The problem of plastic pollution and its impacts, in particular on marine ecosystems, have been known for decades (Carpenter and Smith, 1972; Carpenter et al., 1972), and interactions with marine biota have been observed since the 1950's (Cornelius, 1975; Balazs, 1985), <10 years after the discovery of the most used polymers. In recent years, several accumulation and retention areas for plastic debris have been detected at the locations of the five main subtropical oceanic gyres at the global scale (Law et al., 2010; Eriksen et al., 2014; Cózar et al., 2015; Van Sebille et al., 2015). These areas, frequently referred to as garbage patches, are showing increasing litter concentrations (Lebreton et al., 2018) due to the coupling between rising plastic production (PlasticsEurope, 2018) and the input of plastic waste in the world's oceans (Jambeck et al., 2015).
The European Marine Strategy Framework Directive (2008/56/EC, Descriptor 10), launched in 2008 with the main goal of achieving Good Environmental Status of European marine waters by 2020, recognized marine litter as one of the main causes of marine pollution. The Mediterranean Sea is no stranger to the issue of marine litter: some samplings and modeling experiments revealed concentrations similar to those found in the North Atlantic Gyre (Cózar et al., 2015; Suaria et al., 2016). The Mediterranean basin is, in fact, among the most impacted ecoregions globally due to increasing anthropogenic pressure (Halpern et al., 2008), caused by rising coastal populations (Benoit and Comeau, 2012) and the intensification of maritime traffic (Campana et al., 2018). Human activities are causing habitat loss and degradation, overexploitation and harm during fishing activities, disturbance (from underwater noise to collisions between animals and ships) and several kinds of marine pollution: chemical pollution, noise, heat, electromagnetic radiation (Pace et al., 2015). These threats are worsened and amplified by the introduction of alien, invasive species (Zenetos et al., 2012; Micheli et al., 2013; Galil et al., 2018) and by the impacts of climate change (Lejeusne et al., 2010). At the same time, the Mediterranean Sea hosts about 7% of the world's marine biodiversity, with about 17,000 marine species (Coll et al., 2010) despite its relatively small size, as low as 0.32% of the whole ocean water content (Bianchi and Morri, 2000). At least 134 species living in the Mediterranean Sea have already been found to be affected by floating or seafloor litter, including some species of commercial value (Deudero and Alomar, 2015) and other endangered ones, like some cetaceans (IUCN, 2012).
The effects and long-term consequences of plastic pollution on marine ecosystems, ranging from harm on wildlife due to entanglement or ingestion (Deudero and Alomar, 2015), biomagnification (Mattsson et al., 2017) and the release of chemicals, both accumulated from contaminated environmental media and additives used for plastics manufacturing (Teuten et al., 2009; Koelmans et al., 2014), are causing concern at the global scale. Modeling experiments have been regarded as a useful tool to address the knowledge gaps about sources, pathways and accumulation areas of plastic, complementary to on-field sampling data (Hardesty et al., 2017). The use of models may be particularly effective in the Mediterranean Sea, where marine litter does not accumulate in garbage patches due to seasonal variations in surface ocean circulation patterns (Pinardi and Masetti, 2000; Mansui et al., 2014), thus possibly resulting in more complex spatio-temporal patterns. As pointed out by Suaria et al. (2016), litter dynamics in the Mediterranean basin resemble more a plastic soup. For this reason, sampling campaigns are key to provide a temporal snapshot of the concentrations of plastic items, but might not be representative of their long-term distribution. Ocean circulation models and oceanographic reanalyses are commonly applied when studying the spreading of particles of different nature (van Sebille et al., 2018), and have also been applied on marine litter distribution, both for the global oceans (e.g., Lebreton et al., 2012; Maximenko et al., 2012; Eriksen et al., 2014) and for the Mediterranean Sea (Mansui et al., 2014; Zambianchi et al., 2017; Liubartseva et al., 2018, 2019). These tools allow us to account not only for the transport of particles within ecologically relevant seasons, but also for its inter-annual variability. Moreover, oceanographic modeling can provide some insight into the exposure of marine biota to plastic litter, by coupling simulation outputs with ecological information (such as maps of species distribution) which can be prodromal to more in-depth ecotoxicological studies investigating species-specific dose-response impacts of plastic pollution (Everaert et al., 2018). At present there are only few examples along this line of research. Wilcox et al. (2012) evaluated the risk of entanglement in derelict fishing gear for sea turtles in the nearshore waters of Northern Australia. To do so, they elaborated the spatial distribution of drifting nets, obtained from both Lagrangian numerical models and beach cleanup data on the oceanographic side, and turtle bycatch records on the ecological side, as gathered from fishing activities in the area. A similar approach was followed to assess the risk at global scale of plastic ingestion by seabirds (Wilcox et al., 2015) and sea turtles (Schuyler et al., 2015). In these two later studies, the risk was defined as the probability of plastic ingestion, predicted by applying a logistic regression model on some biologically relevant characteristics of stranded individuals (such as life-history traits and body size). Some recent items of research targeted specifically the Mediterranean Sea. Darmon et al. (2017) evaluated the exposure of sea turtles to marine litter with aerial surveys covering the French Mediterranean and Atlantic waters, identifying copresence, encounter probability and density of debris surrounding individuals. Fossi et al. (2017) were first in proposing a qualitative comparison method for visually identifying regions endowed with high risk of exposure to plastics. They contrasted 15 days of litter distribution from oceanographic modeling and areas with high potential habitat value for a target species, the feeding grounds of the fin whale Balaenoptera physalus in Pelagos Sanctuary, the largest Marine Protected Area (MPA) of the Mediterranean Sea, located in its North-Western side.
In this work, we combined a decadal Lagrangian particle tracking with species-specific habitat suitability maps to obtain a quantitative, georeferenced indicator of the risk of plastic ingestion by marine wildlife in Pelagos Sanctuary. To this aim, we exploited a simplified version of the habitat suitability model calibrated by Druon et al. (2012) targeted on the fin whale B. physalus, an endangered cetacean species which aggregates in Pelagos during the summer season for feeding (Notarbartolo di Sciara et al., 2003; Panigada et al., 2005) and for which there is increasing evidence of microplastic ingestion in its foraging area (Fossi et al., 2016). Improving over Fossi et al. (2017), we formalize a procedure to obtain multi-annual risk maps for fin whales in the Pelagos Sanctuary, an approach that can potentially be extended to other marine areas and/or biota.
2. Methods
As typically done in risk assessment studies (Rausand, 2011), we obtained our indicator of the risk of microplastics ingestion by the marine biota as the product of a hazard factor and an exposure factor. This definition required us to follow three sequential steps during this work, one for the evaluation of each factor: (1) the hazard, determined by plastic densities as simulated using oceanographic modeling over the Pelagos Sanctuary domain; (2) the exposure, obtained by mapping habitat suitability for the fin whale; and (3) the risk, computed by cell-by-cell multiplication of the outcomes of the hazard and exposure steps. Following this definition, the indicator we provide is the risk of ingestion of microplastic debris.
2.1. The Hazard—Maps of Plastic Density
Plastic density has been modeled by simulating the advection of Lagrangian particles. To the best of our knowledge, in the context of plastic pollution, only Fredj et al. (2016) and Jalón-Rojas et al. (2019) characterized Lagrangian particles by their size, shape and density, while few other studies indirectly accounted for fragment size by the parametrization of wind drift (Kako et al., 2010; Ebbesmeyer et al., 2012; Critchell and Lambrechts, 2016; Murray et al., 2018). Thus, as in the majority of plastic pollution studies based on Lagrangian simulations (e.g., Lebreton et al., 2012; Maximenko et al., 2012; Eriksen et al., 2014; Mansui et al., 2014; Liubartseva et al., 2016; Zambianchi et al., 2017), our plastic fragments are modeled as point-like particles whose movement is completely consistent with that of water masses. Particles are transported by the surface currents data (zonal and meridional components, Figure 1A) provided by oceanographic reanalyses produced by the Copernicus Marine Environment Monitoring Service (Simoncelli et al., 2014). We neglected vertical velocities. The spatial extent of our simulation domain (3.5°E to 12.5°E, 38.5°N to 45°N on a 1/16° × 1/16° oceanographic grid) is wider than the Pelagos MPA for a more realistic simulation of particle transport on a larger scale. In fact, litter may enter the focal area from sources that are located outside the Sanctuary, or temporarily leave the Sanctuary waters before eventually re-entering. We located several release points along the coastlines, at the mouths of the major rivers and along the main maritime routes to mimic real-life sources of plastic litter, as it will be detailed below. Simulations have been run, with a daily step, in order to cover the summer seasons of the years 2000–2010. This choice is based on the ecology of the fin whale, as mentioned above, and it is coherent with the sightings dataset used by Druon et al. (2012) to calibrate their suitability model. To allow model warm-up before collecting simulation outputs in the summer seasons, we begun each year of simulation in March and terminated it in September. Removal of plastic fragments from the surface layer has been included in the model by characterizing Lagrangian particles with a certain source-independent permanence period in the surface layer, corresponding in fact to the duration of their transport. Assuming that particle removal is a Poissonian process, the permanence period of each particle can be extracted from an exponential distribution with an average decay rate of 50 d−1 (see Liubartseva et al., 2018). The distribution of the permanence times was then approximately discretized into three classes with relative frequency of 1/3 each. We thus divided the particles released every day from each site into three groups, with short (10 days), medium (36 days), and long (105 days) duration of transport before removal from the simulation. The calculated advection times are consistent with the existing literature (Poulain et al., 2012; Fazey and Ryan, 2016; Liubartseva et al., 2016). However, since the model is effectively memoryless after 105 days, the effects of those (rare) particles with longer residence times in the surface layer might be underestimated.
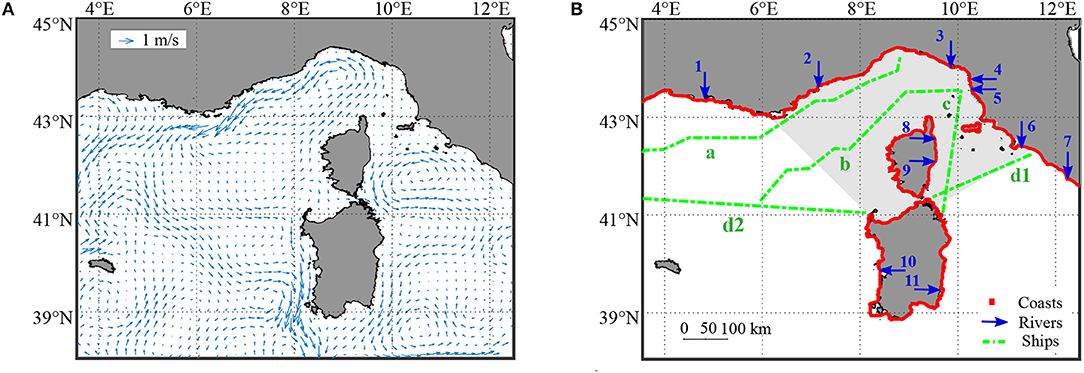
Figure 1. Input data used to assess the hazard component of the risk maps via numerical simulations. (A) Surface circulation fields in the simulated summer seasons (averaged over the time horizon 2000–2010), as obtained from reanalysis data. (B) Geographic displacement of particle sources used in the simulations. The Pelagos Sanctuary is shaded in gray. Coastline release sites are colored in red. Blue arrows indicate the mouths of the major rivers flowing directly into the simulation domain and have been numbered from West to East: 1. Rhone, 2. Var, 3. Magra, 4. Serchio, 5. Arno, 6. Ombrone, 7. Tevere, 8. Tavignano, 9. Golo, 10. Tirso, 11. Flumendosa. Green dash-dotted lines indicate the main shipping lanes: a. Genova-Barcelona, b. Livorno-Barcelona, c. Livorno-Olbia, Civitavecchia-Barcelona eastern (d1.) and western (d2.) sections.
Particle release locations within the focal study area are shown in Figure 1B. Plastic release from coasts was uniformely distributed along 2,500 km of coastlines, with a spacing of 650 m between each source point, finally resulting in 3,843 release locations. Coastal areas acting as particle sources encompassed the Italian regions of Liguria, Tuscany (including the major island of its Archipelago, Elba island), Sardinia and part of Lazio, and the French Cote d'Azur, part of the Languedoc-Roussillon coast and Corsica. Plastic discharged from rivers was assumed to come from the outflows in the relevant area of the eleven major rivers, i.e., those characterized by the highest yearly average discharges. The rationale behind our discharge-driven choice criterion lies in the positive correlation between riverine discharge and the amount of plastic released by a river, as pointed out by several studies (see e.g., Lebreton et al., 2012; Crosti et al., 2018). Plastic litter produced by maritime activities was accounted for by modeling plastic sources along the main naval routes (commercial and transport/touristic) with a 2 km spacing between source points. We extrapolated the most trafficked routes from the SafeMED GIS (REMPEC, 2009) and Campana et al. (2018).
From a technical perspective, there is a trade-off between the number of particles per source point to be used for simulation (number that should be maximized so as to have a homogeneous coverage of the domain while computing the hazard) and the computational load. After a testing phase, we chose to differentiate the number of released particles for each source type. For example, we carried out three simulations to test the release of 30, 300, and 3,000 particles at each of the 3,843 coastal release points, and then we visually compared the obtained distribution patterns. Despite having a longer computational time as a drawback, we could observe more smaller-scale details and a wider coverage of the simulation domain when we released 300 particles per source instead of just 30. However, releasing 3,000 particles per coastal source (11,529,000 particles every day) did not lead to remarkable improvements that could justify the longer duration of the simulation. With the same procedure, we set the daily release of 300 particles from each source point along the naval routes. We had to increase the daily amount of particles released by riverine sources to 30,000 per day to ensure the same quality of the simulation outputs, to account for the point-like geometry of river mouths in our model. The initial position of each particle was randomly extracted within a certain radius from its actual source point, to increase spatial variability and somehow mimic occasional release. Since particle velocity is assigned by interpolating the velocity field at particle location at each time step, the choice of this radius influences particle trajectory. We tested the radius simulating riverine release only, setting it to 10, 100, and 1,000 m. We could observe little variety in particle trajectories when releasing particles within 10 m from the river mouths, meaning that this distance is too small compared to the resolution of the velocity fields we used. On the other hand, we found that the plume of particles at the river mouth was not well defined when using a 1,000 m radius, as several particles were not released from the river but from the adjacent coast. Moreover, there was a higher occurrence of particles whose local velocity could not be obtained via interpolation because their starting point was too upstream, meaning that <30,000 particles were actually released. Again, in medio stat virtus: better performances were observed when using a 100 m radius for riverine release, and then we applied it also to the coastal and maritime release settings. Moreover, the vertical position of the particles was randomly assigned within the surface layer of the oceanographic circulation reanalyses (0–1.47 m) and kept fixed thereafter. Overall, considering all source types, a total of 1,739,100 particles was released every day, amounting to about 3 billion particles tracked over an 11-year-long time window.
The contribution to accumulation of plastics from each of the three source types has been simulated considering them independently. Then, to obtain an aggregated picture of plastic within the study area, daily outputs of the single-source simulations have been normalized by dividing the number of particles in each cell of the oceanographic grid by the maximum number of particles registered in all cells. To account for the different magnitude of the plastic input from coastlines, rivers and shipping routes, the aggregated mapping was obtained by attributing different weights to the particles according to their source, with the coast-to-rivers-to-shipping lanes ratio of 50%:30%:20% proposed by Liubartseva et al. (2018).
In terms of the temporal dimension of particles concentration, at first the simulation outputs from the three source types were averaged over the eleven summer seasons simulated. Then, inter-annual variability was estimated for each source type by considering, summer by summer, the fraction of particles that entered the Pelagos Sanctuary on the total amount released in a year of single-source simulation. Annual fluctuations of plastic distribution within the Sanctuary was quantified through the CV, computed on the aggregated particle density maps as a cell-by-cell ratio between standard deviation and mean.
2.2. The Exposure—Maps of Habitat Suitability
To specifically target the exposure of the fin whale in our analyses, we determined habitat suitability for the species by applying a simplified version of the model proposed by Druon et al. (2012). In their niche model, Druon and collaborators used a multi-criteria evaluation to define the main features of the whales' habitat, providing a specific chlorophyll-a (chl-a) range, a minimum threshold for the norm of the horizontal gradient of sea surface temperature and chl-a, and a minimum water depth. With this parametrization, they found that 80% of sightings occurred within <9.7 km from the predicted potential habitat. Among their predictors, we selected the range of chl-a concentration (0.11 to 0.39 mg/m3) and water depth (from 200 to 2800 m) to identify potential habitats. Our simplification is supported by two considerations: in the mentioned study, chl-a fronts were found to be the main predictor of whale presence (the chl-a range they defined corresponds to the 7th and the 98th percentile values found at sightings' location), and most (82%) of the recurrent potential habitat identified by Druon et al. (2012) has been identified in correspondence of those water depths. To determine sea surface chl-a concentration, we used monthly satellite data from MODIS-Aqua, the Moderate Resolution Imaging Spectroradiometer aboard the NASA-Aqua satellite, obtaining georeferenced data such as those shown in Figure 2A. Data were available from 2002 to 2010, since chl-a measurements started in late June 2002. Water depth was taken into account by using the General Bathymetric Chart of the Oceans (The British Oceanographic Data Centre, 2014; Figure 2B). We thus obtained the fin whale suitable habitat by assigning value 1 to the cells of the oceanographic grid which matched our criteria and 0 to the others, thus obtaining the exposure factor as Boolean masks for the summer months of the years 2002–2010.
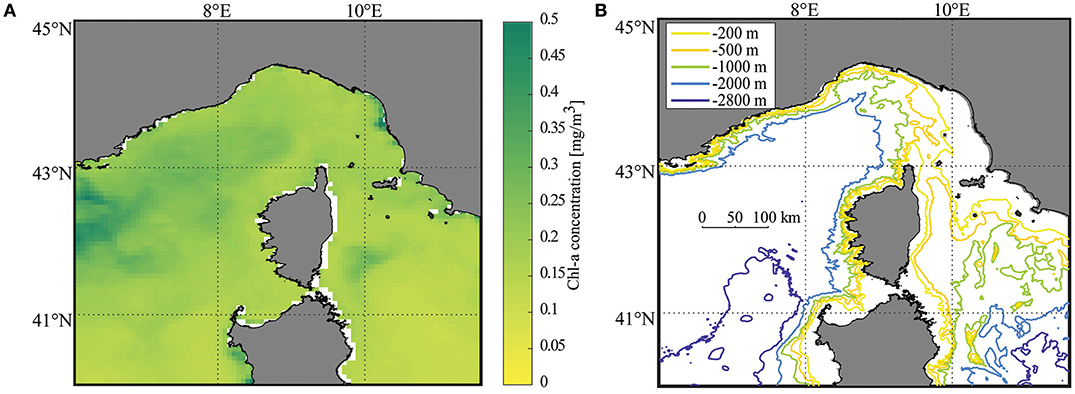
Figure 2. Input data used to assess the exposure component of the risk maps using habitat suitability modeling. (A) An exemplification of a temporal snapshot (June 2006) of surface chlorophyll-a (chl-a) concentration satellite data, see text for data sources. (B) Bathymetry of the Pelagos Sanctuary area as provided by The British Oceanographic Data Centre (2014).
Besides fin whales, other species can be studied by selecting a relevant indicator of their habitat. As a notable example, the presence of higher trophic marine biota can be predicted using the Net Primary Production (NPP). Typically, areas with high NPP are in fact positively associated with abundance of phytoplancton, which is at the basis of the food chain, making reasonable to assume NPP as a proxy of ecosystem size (Sherman and Van Sebille, 2016).
2.3. The Risk—Interlacing Hazard and Exposure
The risk associated with ingestion of microplastics by the marine taxa under study was finally calculated at a monthly temporal step, as the product between the two gridded fields described above: the monthly-averaged plastic density data (hazard factor, as resulting from our Lagrangian simulations) and the monthly masks of fin whale potential suitable habitat (exposure factor), that is:
In other words, our risk indicator expresses how likely is an encounter between microplastic particles and fin whales, resulting in ingestion during feeding. Thus, high risk values have not to be intended as directly linked with adverse effects, since such an evaluation would require more detailed data about the effects of microplastics in whales, as it has been done with the estimation of mortality risk in seabirds (Schuyler et al., 2015; Wilcox et al., 2015). As a consequence of MODIS-Aqua data availability as mentioned above, we could calculate risk maps for the fin whale from July 2002 and not before.
3. Results
Figure 3 summarizes the contribution to plastic density in the area of the Pelagos MPA from each of the three sources—coastlines (Figure 3A), main shipping routes (Figure 3B), and major rivers (Figure 3C). At a glance, release of particles from coastlines and maritime traffic (Figures 3A,B) present comparable particle distributions, in terms of both the coverage of the simulation domain and of geographical patterns that can be identified. For example, the high-density areas located in the Central Ligurian Sea, in the Gulf of Lion and a lesser one in the Tyrrhenian Sea emerge from both single-source simulation settings. Particle dispersion from these two linear sources appears to be more homogeneous than the one generated by rivers (Figure 3C). At the geographical scale of interest, rivers behave in fact like punctual sources, releasing at their mouth a plume of particles whose dispersion depends on the dynamicity of the waters they flow into. In the riverine setting, the Northern Tyrrhenian Sea presents higher particle concentration than the Ligurian Sea.
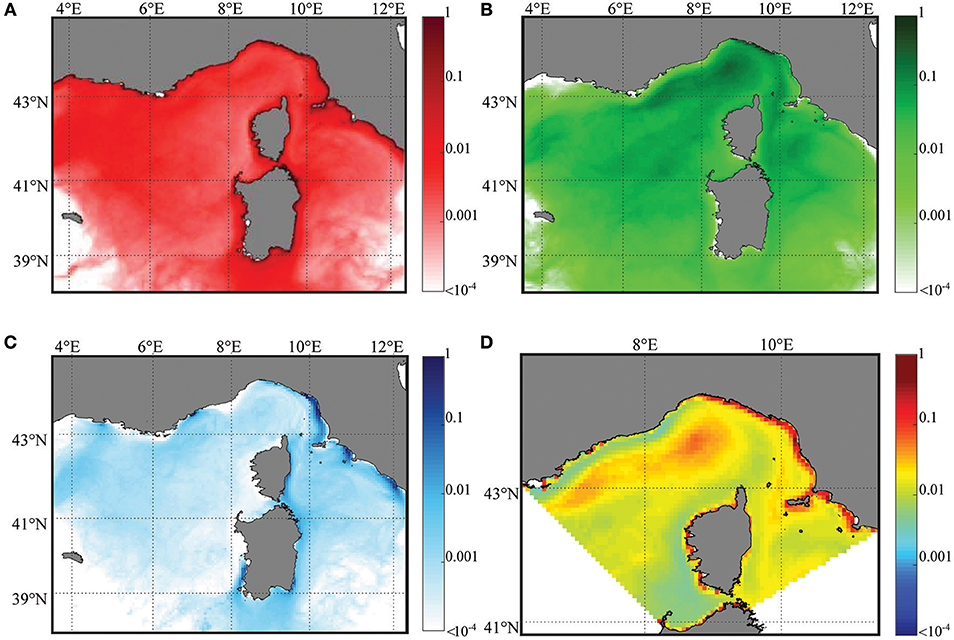
Figure 3. Maps of summer plastic density (hazard component) averaged over the period 2000–2010 from each source of release: (A) coasts, (B) ships and (C) rivers. (D) Overall decennial hazard map in the Pelagos Sanctuary, obtained with a weighted aggregation.
Particle concentration hotspots emerge more clearly when considering how the three pollution sources act all together (Figure 3D). Again, particle density is high in the Central Ligurian Sea, forming a plume-like structure that extends westwards, starting from offshore the Ligurian coasts and reaching the French part of the domain. Interestingly, other hotspots that did not emerge in the single-source panels can now be clearly identified thanks to the weighting and aggregation procedure. One of those hotspots is located along the coastal marine areas of Tuscany and Lazio, on the eastern part of the domain, while another is a small offshore region between Tuscany and Corsica, on the western side of Elba island. It is worth noting that this last hotspot, despite being less pronounced than the other two, is already known to be a potential accumulation area for marine litter (Suaria et al., 2016; Fossi et al., 2017), possibly because of its proximity to a seasonal anticyclonic eddy structure named Capraia gyre (Schroeder et al., 2011) after the Capraia island, located north of Elba in the Tuscan Archipelago.
Mapping the average distribution of plastic provides information about the location and the extension of high concentration areas, however possible yearly fluctuations might not be visible. For this reason, in Figure 4 we show our two indicators of inter-annual variability. In Figure 4A, fluctuations in the amount of particles entering Pelagos are sharper for the release from rivers than from coastlines and shipping routes. This is probably due to the number and the geographic location of release sites included in each source type. In fact, coastlines and shipping routes are modeled as hundreds of evenly spaced point sources spread on a wide area, thus they are less affected by the variability of surface circulation in delivering particles to Pelagos. Conversely, dispersion of particles from rivers, which are fewer in number and described as point sources, can be more easily influenced by the actual circulation regime. In some years, surface currents appear to be particularly favorable in reducing the accumulation of riverine particles in Pelagos (e.g., 2002 and 2007, see again Figure 4A). Moreover, the two minima and the overall shape of the riverine time series in Figure 4A suggest a non-erratic, multiannual pattern. It can also be observed that the time series of plastic contributions to Pelagos from rivers and coastlines appear to be in phase, while the one associated with shipping routes is out of sync, even in counterphase in some years.
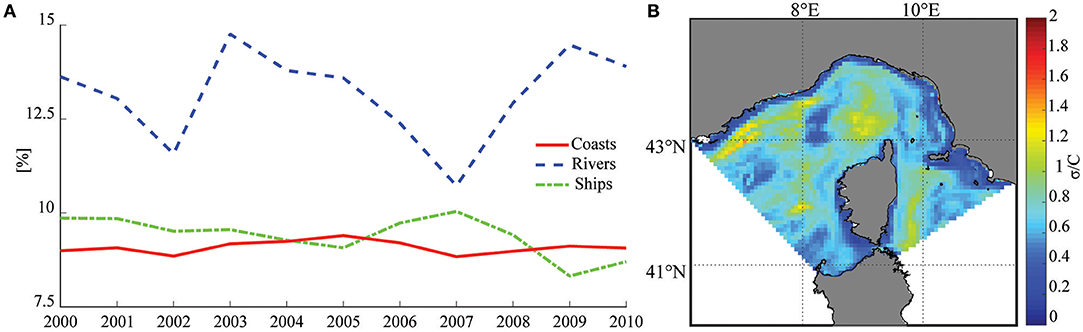
Figure 4. Indicators of inter-annual variability in plastic distribution (hazard component). (A) Partitioning by source type of particles retained in the Pelagos Sanctuary each year during the simulated period. Percentages refer to the total number of particles released in a year from the relevant type of source. (B) Inter-annual CV of plastic density over the Sanctuary area in 2000–2010.
The map of the coefficient of variation (CV), shown in Figure 4B, suggests that particle density is subject to sharper inter-annual variability in open seas rather than in coastal waters, as somehow expected since the latter are less exposed to strong currents. Furthermore, the hotspot linked to the Capraia gyre (described above) presents rather low variability, perhaps strengthening the evidence that this high-concentration area tends to build up frequently.
The time-averaged exposure factor of fin whales in the Pelagos MPA (2002–2010) is shown in Figure 5A. Overall, the potential suitable habitat appears to cover the whole region, excluding the areas whose water depth did not match our suitability criteria. This result is not surprising at all, since Pelagos is well known for its highly productive waters and frequent whale sightings, being in fact a Sanctuary for cetaceans. Figure 5B finally integrates the hazard and the exposure monthly maps, and show the average risk of plastic ingestion for the period 2002–2010. On average, the risk for the target species appears to be maximum along the Ligurian and Western Corsica coasts. The widest hotspots match, comprehensibly, the high particle concentration areas previously identified. Again, the Ligurian sea presents an extended area with high risk, whose severity decreases toward the French coasts. In the easternmost part of the domain, the risk appears to be lower than in the Ligurian hotspot. However, noticeable values can still be observed in correspondence of the Northern Tyrrhenian area and close to the Capraia gyre, the latter being less defined.
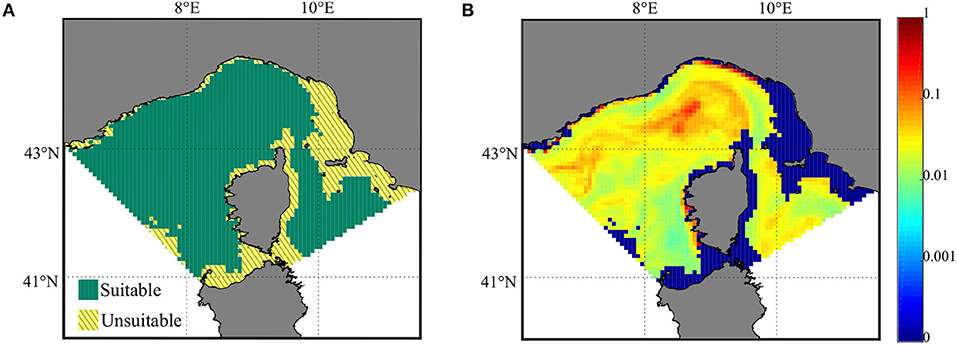
Figure 5. Maps of exposure to plastic and of the related risk for the fin whale. (A) Boolean mask representing the average suitable habitat in 2002–2010 , calibrated using a simplification of the model by Druon et al. (2012). (B) Average risk of plastic ingestion by B. physalus in 2002–2010, as resulting from multiplying the hazard and the exposure monthly maps.
4. Discussion
In the present work, extensive Lagrangian simulations were run to model the surface advection patterns of plastic litter on a wide geographical domain embracing the Pelagos International Sanctuary for the Protection of Mediterranean Marine Mammals. Aim of our modeling study was to assess the potential distribution of plastic waste within the feeding grounds of the fin whale, an endangered cetacean inhabiting the Mediterranean Sea. Nearly three billion particles were released from coastlines, major rivers and most congested shipping lanes during the study period 2000–2010, and followed daily during their transport driven by surface ocean currents from the most up-to-date oceanographic reanalyses. In accordance with existing literature, we assumed that particle transport duration could be taken from an exponential distribution with average decay rate of 50 days. We modeled the fin whale suitable habitat on satellite-derived and bathymetry data, using a selected subset of the criteria identified by Druon et al. (2012) based on whale sightings occurred during the decade 2000–2010. The suitable areas detected as exposure component were used to finally compute the risk of plastics ingestion by fin whales, that is proportional to the hazard of finding particles in the region.
Over the ecologically relevant summer months of the decade 2000–2010, our simulations show that the highest average particle densities were localized in the Ligurian Sea, in the Northern Tyrrhenian Sea and between the Tuscan Archipelago and Corsica, as well as along the eastern coastlines of the simulation domain. What stands out in every examined plot is that no area within the Pelagos Sanctuary appears to be unaffected by the potential pollution sources that have been selected in this work. Our modeling results are in a rather good agreement with the observational data of plastic pollution based on sampling procedures by Suaria et al. (2016), Fossi et al. (2017), and Arcangeli et al. (2017), except for a high-density area that the latter found in the Bonifacio strait, not reproduced by the present elaborations. We note that this region is relatively poorly resolved in the oceanographic circulation reanalyses we exploited. Our results are also comparable with the simulation results by Cózar et al. (2015), Fossi et al. (2017) and Liubartseva et al. (2018), while there are some dissimilarities with the work by Mansui et al. (2014), probably because of the use of different oceanographic grids. In addition, our analyses confirm a known feature of the summer oceanography of the Pelagos area: the Capraia gyre. Simulations show that this region is also endowed with a low CV, underlying its recurrent and persistent appearance in the summer seasons of the years considered.
The potential whale habitat we modeled here, visible in Figure 5A, is similar to both the one obtained by Druon et al. (2012) and the fin whale presence probability observed by Azzellino et al. (2012). Risk for B. physalus of ingesting floating microplastic debris was obtained by properly interesecting the elaboration of the particle density patterns (the hazard) and indicators of potential habitat suitability for this species (the exposure). Our method highlighted a potential risk hotspot for the fin whale in the Liguro-Provenal basin, which is coherent with the overlay of plastic distribution and potential habitat qualitatively identified and discussed by Fossi et al. (2017). This area notoriously plays a crucial role for the species, especially during its summer feeding season (Panigada et al., 2005; Druon et al., 2012), thus the high risk of ingesting plastics we found there may be of great concern.
Our study was focused on a particular species on a key MPA, the largest of the Mediterranean Sea. However, the proposed approach can be potentially extended to other marine species to assess whether they are threatened by plastic pollution and to which extent, as well as to other areas of interest. A practical example of such extension of our approach is shown in Figure 6, where we applied the procedure hereby explained by using as exposure factor the monthly NPP maps for the Pelagos Sanctuary area (from the Mediterranean Sea Biogeochemistry Reanalyses available from the Copernicus Marine Environment Monitoring Service; Teruzzi et al., 2016). Although the effects of microplastics on pelagic productivity are still uncertain at current environmental concentration levels (Troost et al., 2018), NPP can be used to assess the exposure of the marine ecosystem (Sherman and Van Sebille, 2016), as it is linked to phytoplancton growth, a main source of nutrition for higher trophic levels.
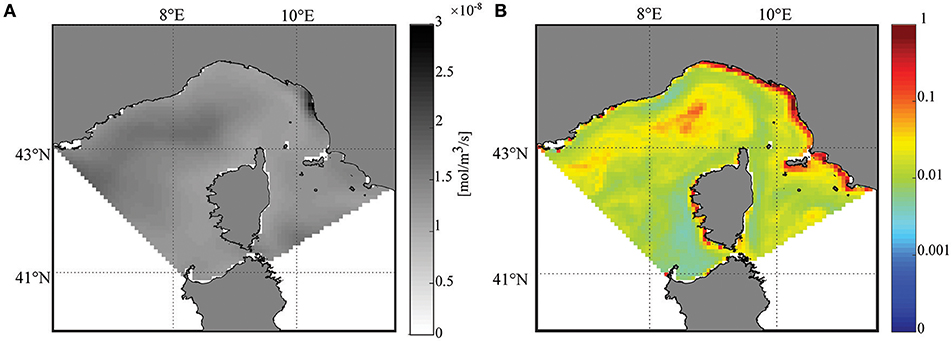
Figure 6. An application of our methodology to a different ecological target: maps of exposure to plastic pollution and of the related risk for the whole marine ecosystem of the Pelagos Sanctuary during summer months. (A) Average NPP in 2000–2010, as derived from Teruzzi et al. (2016), used to assess the exposure component for the marine ecosystem. (B) Average risk caused by plastic pollution.
To conclude, we performed a first decadal assessment of the risk of plastic ingestion by fin whales in the Pelagos MPA supported by both numerical simulations and ecological modeling, providing a simple methodology to obtain a quantitative, species-specific risk indicator. Improving over other existing risk assessments along the same line of research, modeled particles were released from the major sources, aiming to simulate real-life plastic input. Although being promising, the method we propose here would significantly benefit from a more precise characterization of plastic inputs from the relevant sources, both in terms of masses and sizes of the items. Further research needs to be carried out in this direction, also to better define seasonal variability of the sources, e.g., due to tourism or river runoff. Additionally, little is known to date about the residence time of floating plastics on the sea surface and about the dynamics of the additives and other chemicals it might carry. A better knowledge of the behavior of plastic waste in the marine environment would improve not only the modeling of its dispersion patterns but also the quantification of the standing stocks in the different compartments (ocean surface, seafloor and beaches; Sherrington, 2016) and assess how plastic-bound chemicals contribute to water pollution. Combining these sources of information can be helpful to address both effective waste management policies and volunteering actions (like clean-ups), aimed to reduce inputs. Tackling plastic pollution is a worldwide challenge with important socio-economic and environmental implications at all scales (from local to national and beyond), involving a variety of stakeholders. As the primary solution to the problem appears to be preventing contamination in the first place (Koelmans et al., 2014), scientifically-informed, targeted actions are nowadays needed more than ever.
Author Contributions
Numerical simulations were performed by FG. All the authors substantially contributed to design and perform the research, other than to writing the paper and approved the final version of the paper for submission.
Funding
This study received funding from the H2020 project ECOPOTENTIAL: Improving future ecosystem benefits through Earth observations (grant agreement No. 641762, http://www.ecopotential-project.eu).
Conflict of Interest Statement
The authors declare that the research was conducted in the absence of any commercial or financial relationships that could be construed as a potential conflict of interest.
Acknowledgments
We are thankful to Arianna Azzellino for feedbacks on our study and to Gaetano Leoni for stimuating discussions. This manuscript has been released as a Pre-Print at https://doi.org/10.1101/538058.
References
Arcangeli, A., Campana, I., Angeletti, D., Atzori, F., Azzolin, M., Carosso, L., et al. (2017). Amount, composition, and spatial distribution of floating macro litter along fixed trans-border transects in the Mediterranean basin. Mar. Pollut. Bull. 129, 545–554. doi: 10.1016/j.marpolbul.2017.10.028
Azzellino, A., Panigada, S., Lanfredi, C., Zanardelli, M., Airoldi, S., and di Sciara, G. N. (2012). Predictive habitat models for managing marine areas: spatial and temporal distribution of marine mammals within the Pelagos sanctuary (Northwestern Mediterranean sea). Ocean Coast. Manage. 67, 63–74. doi: 10.1016/j.ocecoaman.2012.05.024
Balazs, G. (1985). “Impact of ocean debris on marine turtles: entanglement and ingestion,” in Proceedings of the Workshop on the Fate and Impact of Marine Debris (Washington, DC: Natl. Ocean. Atmos. Adm. NOAA Technical Memorandum, NMFS, SWFC 54), 384–429.
Benoit, G., and Comeau, A. (2012). A Sustainable Future for the Mediterranean: The Blue Plan's Environment and Development Outlook. London: Earthscan.
Bianchi, C. N., and Morri, C. (2000). Marine biodiversity of the Mediterranean Sea: Situation, problems and prospects for future research. Mar. Poll. Bull. 40, 367–376. doi: 10.1016/S0025-326X(00)00027-8
Campana, I., Angeletti, D., Crosti, R., Di Miccoli, V., and Arcangeli, A. (2018). Seasonal patterns of floating macro-litter across the Western Mediterranean Sea: a potential threat for cetacean species. Rendicon. Lincei. Sci. Fisiche e Naturali. 29, 453–467. doi: 10.1007/s12210-018-0680-0
Carpenter, E. J., Anderson, S. J., Harvey, G. R., Miklas, H. P., and Peck, B. B. (1972). Polystyrene spherules in coastal waters. Science 178, 749–750.
Carpenter, E. J., and Smith, K. L. (1972). Plastics on the Sargasso Sea surface. Science 175, 1240–41.
Coll, M., Piroddi, C., Steenbeek, J., Kaschner, K., Ben Rais Lasram, F., Aguzzi, J., et al. (2010). The biodiversity of the Mediterranean Sea: estimates, patterns, and threats. PLoS ONE 5:e11842. doi: 10.1371/journal.pone.0011842
Cornelius, S. H. (1975). Marine turtle mortalities along the pacific coast of Costa Rica. Copeia, 1975, 186–187.
Cózar, A., Sanz-Martín, M., Martí, E., González-Gordillo, J. I., Ubeda, B., Gálvez, J. A., et al. (2015). Plastic Accumulation in the Mediterranean Sea. PLoS ONE 10:e121762. doi: 10.1371/journal.pone.0121762
Critchell, K., and Lambrechts, J. (2016). Modelling accumulation of marine plastics in the coastal zone; what are the dominant physical processes? Estuar. Coast. Shelf Sci. 171, 111–122. doi: 10.1016/j.ecss.2016.01.036
Crosti, R., Arcangeli, A., Campana, I., Paraboschi, M., and González Fernández, D. (2018). ‘Down to the river': amount, composition, and economic sector of litter entering the marine compartment, through the Tiber river in the Western Mediterranean Sea. Rendiconti Lincei. 29, 859–866. doi: 10.1007/s12210-018-0747-y
Darmon, G., Miaud, C., Claro, F., Doremus, G., and Galgani, F. (2017). Risk assessment reveals high exposure of sea turtles to marine debris in French Mediterranean and metropolitan Atlantic waters. Deep Sea Res. Part II Top. Stud. Oceanography, 141, 319–328. doi: 10.1016/j.dsr2.2016.07.005
Deudero, S., and Alomar, C. (2015). Mediterranean marine biodiversity under threat: reviewing influence of marine litter on species. Mar. Pollut. Bull. 98, 58–68. doi: 10.1016/j.marpolbul.2015.07.012
Druon, J., Panigada, S., David, L., Gannier, A., Mayol, P., Arcangeli, A., et al. (2012). Potential feeding habitat of fin whales in the Western Mediterranean Sea: an environmental niche model. Mar. Ecol. Prog. Ser. 464, 289–306. doi: 10.3354/meps09810
Ebbesmeyer, C. C., Ingraham, W. J., Jones, J. A., and Donohue, M. J. (2012). Marine debris from the Oregon Dungeness crab fishery recovered in the Northwestern Hawaiian Islands: identification and oceanic drift paths. Mar. Pollut. Bull. 65, 69–75. doi: 10.1016/j.marpolbul.2011.09.037
Eriksen, M., Lebreton, L. C., Carson, H. S., Thiel, M., Moore, C. J., Borerro, J. C., et al. (2014). Plastic pollution in the world's oceans: more than 5 trillion plastic pieces weighing over 250,000 tons afloat at sea. PLoS ONE 9:e111913. doi: 10.1371/journal.pone.0111913
Everaert, G., Van Cauwenberghe, L., De Rijcke, M., Koelmans, A. A., Mees, J., Vandegehuchte, M., et al. (2018). Risk assessment of microplastics in the ocean: modelling approach and first conclusions. Environ. Pollut. 242, 1930–1938. doi: 10.1016/j.envpol.2018.07.069
Fazey, F. M., and Ryan, P. G. (2016). Biofouling on buoyant marine plastics: an experimental study into the effect of size on surface longevity. Environ. Pollut. 210, 354–360. doi: 10.1016/j.envpol.2016.01.026
Fossi, M. C., Marsili, L., Baini, M., Giannetti, M., Coppola, D., Guerranti, C., et al. (2016). Fin whales and microplastics: the mediterranean sea and the sea of Cortez scenarios. Environ. Pollut. 209, 68–78. doi: 10.1016/j.envpol.2015.11.022
Fossi, M. C., Romeo, T., Baini, M., Panti, C., Marsili, L., Campani, T., et al. (2017). Plastic debris occurrence, convergence areas and fin whales feeding ground in the mediterranean marine protected area pelagos sanctuary: a modeling approach. Front. Mar. Sci. 4:167. doi: 10.3389/fmars.2017.00167
Fredj, E., Carlson, D. F., Amitai, Y., Gozolchiani, A., and Gildor, H. (2016). The particle tracking and analysis toolbox (PaTATO) for Matlab. Limnol. Oceanogr. Methods 14, 586–599. doi: 10.1002/lom3.10114
Galil, B., Marchini, A., and Occhipinti, A. (2018). “Chapter 8: Mare nostrum, mare quod invaditur-the history of bioinvasions in the mediterranean sea,” in Histories of Bioinvasions in the Mediterranean, eds A. Queiroz, and S. Pooley (Cham:Springer), 21–49.
Halpern, B. S., Walbridge, S., Selkoe, K. A., Kappel, C. V., Micheli, F., D'Agrosa, C., et al. (2008). A global map of human impact on marine ecosystems. Science 319, 948–952. doi: 10.1126/science.1149345
Hardesty, B. D., Harari, J., Isobe, A., Lebreton, L., Maximenko, N., Potemra, J., et al. (2017). Using numerical model simulations to improve the understanding of micro-plastic distribution and pathways in the marine environment. Front. Mar. Sci. 4:30. doi: 10.3389/fmars.2017.00030
IUCN (2012). Marine Mammals and Sea Turtles of the Mediterranean and Black Seas. Available online at https://portals.iucn.org/library/sites/library/files/documents/2012-022.pdf.
Jalón-Rojas, I., Wang, X. H., and Fredj, E. (2019). A 3D numerical model to track marine plastic debris (TrackMPD): sensitivity of microplastic trajectories and fates to particle dynamical properties and physical processes. Mar. Pollut. Bull. 141, 256–272. doi: 10.1016/j.marpolbul.2019.02.052.
Jambeck, J. R., Geyer, R., Wilcox, C., Siegler, T. R., Perryman, M., Andrady, A., et al. (2015). Plastic waste inputs from land into the ocean. Science 347, 768–771. doi: 10.1126/science.1260352
Kako, S., Isobe, A., Seino, S., and Kojima, A. (2010). Inverse estimation of drifting-object outflows using actual observation data. J. Oceanogr. 66, 291–297. doi: 10.1007/s10872-010-0025-9
Koelmans, A. A., Gouin, T., Thompson, R., Wallace, N., and Arthur, C. (2014). Plastics in the marine environment. Environ. Toxicol. Chem. 33, 5–10. doi: 10.1002/etc.2426
Law, K. L., Morét-Ferguson, S., Maximenko, N. A., Proskurowski, G., Peacock, E. E., Hafner, J., et al. (2010). Plastic accumulation in the North Atlantic Subtropical Gyre. Science 329, 1185–1188. doi: 10.1126/science.1192321
Lebreton, L., Slat, B., Ferrari, F., Sainte-Rose, B., Aitken, J., Marthouse, R., et al. (2018). Evidence that the Great Pacific Garbage Patch is rapidly accumulating plastic. Sci. Rep. 8:4666. doi: 10.1038/s41598-018-22939-w
Lebreton, L. C., Greer, S. D., and Borrero, J. C. (2012). Numerical modelling of floating debris in the world's oceans. Mar. Pollut. Bull. 64, 653–61. doi: 10.1016/j.marpolbul.2011.10.027
Lejeusne, C., Chevaldonné, P., Pergent-Martini, C., Boudouresque, C. F., and Pérez, T. (2010). Climate change effects on a miniature ocean: the highly diverse, highly impacted Mediterranean Sea. Trends Ecol. Evolut. 25, 250–260. doi: 10.1016/j.tree.2009.10.009
Liubartseva, S., Coppini, G., and Lecci, R. (2019). Are mediterranean marine protected areas sheltered from plastic pollution? Mar. Pollut. Bull. 140, 579–587. doi: 10.1016/j.marpolbul.2019.01.022
Liubartseva, S., Coppini, G., Lecci, R., and Clementi, E. (2018). Tracking plastics in the mediterranean: 2D lagrangian model. Mar. Pollut. Bull. 129, 151–162. doi: 10.1016/j.marpolbul.2018.02.019
Liubartseva, S., Coppini, G., Lecci, R., and Creti, S. (2016). Regional approach to modeling the transport of floating plastic debris in the Adriatic Sea. Mar. Pollut. Bull. 103, 115–127. doi: 10.1016/j.marpolbul.2015.12.031
Mansui, J., Molcard, A., and Ourmières, Y. (2014). Modeling the transport and accumulation of floating marine debris in the Mediterranean basin. Mar. Pollut. Bull. 91, 249–57. doi: 10.1016/j.marpolbul.2014.11.037
Mattsson, K., Johnson, E. V., Malmendal, A., Linse, S., Hansson, L.-A., and Cedervall, T. (2017). Brain damage and behavioural disorders in fish induced by plastic nanoparticles delivered through the food chain. Sci. Rep. 7:11452. doi: 10.1038/s41598-017-10813-0
Maximenko, N., Hafner, J., and Niiler, P. (2012). Pathways of marine debris derived from trajectories of lagrangian drifters. Mar. Pollut. Bull. 65, 51–62. doi: 10.1016/j.marpolbul.2011.04.016
Micheli, F., Halpern, B. S., Walbridge, S., Ciriaco, S., Ferretti, F., Fraschetti, S., et al. (2013). Cumulative human impacts on mediterranean and black sea marine ecosystems: assessing current pressures and opportunities. PLoS ONE 8:e79889. doi: 10.1371/journal.pone.0079889
Murray, C. C., Maximenko, N., and Lippiatt, S. (2018). The influx of marine debris from the Great Japan Tsunami of 2011 to North American shorelines. Mar. Pollut. Bull. 132, 26–32. doi: 10.1016/j.marpolbul.2018.01.004
NASA Goddard Space Flight Center Ocean Ecology Laboratory, Ocean Biology Processing Group. (2014). Moderate resolution Imaging Spectroradiometer (MODIS) Aqua Chlorophyll Data; 2014 Reprocessing (accessed August 09, 2018).
Notarbartolo di Sciara, G., Zanardelli, M., Jahoda, M., Panigada, S., and Airoldi, S. (2003). The fin whale Balaenoptera physalus (l. 1758) in the Mediterranean Sea. Mamm. Rev. 33, 105–150. doi: 10.1046/j.1365-2907.2003.00005.x
Pace, D., Tizzi, R., and Mussi, B. (2015). Cetaceans value and conservation in the Mediterranean Sea. J. Biodivers. Endanger. Species S1:004. doi: 10.4172/2332-2543.S1-004
Panigada, S., Notarbartolo di Sciara, G., Zanardelli Panigada, M., Airoldi, S., Borsani, J., and Jahoda, M. (2005). Fin whales (Balaenoptera physalus) summering in the Ligurian Sea: distribution, encounter rate, mean group size and relation to physiographic variables. J. Cetacean Res. Manage. 7, 137–145.
Pinardi, N., and Masetti, E. (2000). Variability of the large scale general circulation of the Mediterranean Sea from observations and modelling: a review. Palaeogeogr. Palaeoclimatol. Palaeoecol. 158, 153–173. doi: 10.1016/S0031-0182(00)00048-1
PlasticsEurope (2018). Plastics - the facts 2017. Available online at: https://www.plasticseurope.org/download_file/force/1055/181
Poulain, P.-M., Menna, M., and Mauri, E. (2012). Surface geostrophic circulation of the mediterranean sea derived from drifter and satellite altimeter data. J. Phys. Oceanogr. 42, 973–990. doi: 10.1175/JPO-D-11-0159.1
Rausand, M. (2011). Risk Assessment : Theory, Methods, and Applications. Hoboken, NJ: J. Wiley & Sons.
REMPEC (2009). SAFEMED GIS - Maritime Traffic Flows and Risk Analysis in the Mediterranean Sea. Project Funded by the European Union. Available online at: http://safemedgis.rempec.org/ (accessed June 15, 2018).
Schroeder, K., Haza, A., Griffa, A., Özgökmen, T., Poulain, P., Gerin, R., et al. (2011). Relative dispersion in the Liguro-Provençal basin: from sub-mesoscale to mesoscale. Deep Sea Res. Part I Oceanogra. Res. Papers 58, 209–228. doi: 10.1016/j.dsr.2010.11.004
Schuyler, Q. A., Wilcox, C., Townsend, K. A., Wedemeyer-Strombel, K. R., Balazs, G., van Sebille, E., et al. (2015). Risk analysis reveals global hotspots for marine debris ingestion by sea turtles. Glob. Change Biol. 22, 567–576. doi: 10.1111/gcb.13078
Sherman, P., and Van Sebille, E. (2016). Modeling marine surface microplastic transport to assess optimal removal locations. Environ. Res. Lett. 11:014006. doi: 10.1088/1748-9326/11/1/014006
Simoncelli, S., Fratianni, C., Pinardi, N., Grandi, A., Drudi, M., Oddo, P., et al. (2014). Mediterranean Sea Physical Reanalysis (MEDREA 1987-2015) (Version 1). E.U. Copernicus Marine Service Information. doi: 10.25423/medsea_reanalysis_phys_006_004
Suaria, G., Avio, C. G., Mineo, A., Lattin, G., Magaldi, M., Belmonte, G., et al. (2016). The mediterranean plastic soup: synthetic polymers in mediterranean surface waters. Sci. Rep. 6:37551. doi: 10.1038/srep37551
Teruzzi, A., Cossarini, G., Lazzari, P., Salon, S., Bolzon, G., Crise, A., et al. (2016). Mediterranean Sea Biogeochemical Reanalysis (CMEMS MED REA-Biogeochemistry 1999-2015). Copernicus Monitoring Environment Marine Service. Available online at: http://marine.copernicus.eu/newsflash/cmems6454-doi-citation-med-mfc-bio-products/
Teuten, E., Saquing, J., Knappe, D., Barlaz, M., Jonsson, S., Björn, A., et al. (2009). Transport and release of chemicals from plastic to the environment and to wildlife. Philos. Trans. R. Soc. Lond. Ser. B Biol. Sci. 364, 2027–2045. doi: 10.1098/rstb.2008.0284
The British Oceanographic Data Centre (2014). The GEBCO 2014 Grid. Available online at: http://www.gebco.net. Version 20141103.
Troost, T. A., Desclaux, T., Leslie, H. A., van Der Meulen, M. D., and Vethaak, A. D. (2018). Do microplastics affect marine ecosystem productivity? Mar. Pollut. Bull. 135, 17–29. doi: 10.1016/j.marpolbul.2018.05.067
van Sebille, E., Griffies, S. M., Abernathey, R., Adams, T. P., Berloff, P., Biastoch, A., et al. (2018). Lagrangian ocean analysis: Fundamentals and practices. Ocean Model. 121, 49–75. doi: 10.1016/j.ocemod.2017.11.008
Van Sebille, E., Wilcox, C., Lebreton, L., Maximenko, N., Hardesty, B., Van Franeker, J., et al. (2015). A global inventory of small floating plastic debris. Environ. Res. Lett. 10:124006. doi: 10.1088/1748-9326/10/12/124006
Wilcox, C., Hardesty, B., Sharples, R., Griffin, D., Lawson, T., and Gunn, R. (2012). Ghostnet impacts on globally threatened turtles, a spatial risk analysis for northern australia. Conserv. Lett. 4, 247–254. doi: 10.1111/conl.12001
Wilcox, C., van Sebille, E., and Hardesty, B. D. (2015). Threat of plastic pollution to seabirds is global, pervasive, and increasing. Proc. Natl. Acad. Sci. U.S.A. 112, 11899–11904. doi: 10.1073/pnas.1502108112
Zambianchi, E., Trani, M., and Falco, P. (2017). Lagrangian transport of marine litter in the mediterranean sea. Front. Environ. Sci. 5:5. doi: 10.3389/fenvs.2017.00005
Zenetos, A., Gofas, S., Morri, C., Rosso, A., Violanti, D., García Raso, J., et al. (2012). Alien species in the Mediterranean Sea by 2012. A contribution to the application of European Union's Marine Strategy Framework Directive (MSFD). Part 2. Introduction trends and pathways. Mediter. Mar. Sci. 13, 328–352. doi: 10.12681/mms.327
Keywords: plastic pollution, oceanographic modeling, Mediterranean Sea, risk assessment, marine biota, microplastics
Citation: Guerrini F, Mari L and Casagrandi R (2019) Modeling Plastics Exposure for the Marine Biota: Risk Maps for Fin Whales in the Pelagos Sanctuary (North-Western Mediterranean). Front. Mar. Sci. 6:299. doi: 10.3389/fmars.2019.00299
Received: 01 February 2019; Accepted: 21 May 2019;
Published: 06 June 2019.
Edited by:
Juan Jose Alava, University of British Columbia, CanadaReviewed by:
Gert Everaert, Flanders Marine Institute, BelgiumLetizia Marsili, University of Siena, Italy
Copyright © 2019 Guerrini, Mari and Casagrandi. This is an open-access article distributed under the terms of the Creative Commons Attribution License (CC BY). The use, distribution or reproduction in other forums is permitted, provided the original author(s) and the copyright owner(s) are credited and that the original publication in this journal is cited, in accordance with accepted academic practice. No use, distribution or reproduction is permitted which does not comply with these terms.
*Correspondence: Federica Guerrini, ZmVkZXJpY2EuZ3VlcnJpbmlAcG9saW1pLml0; Renato Casagrandi, cmVuYXRvLmNhc2FncmFuZGlAcG9saW1pLml0