 Lara Marcus1*
 Patti Virtue1,2,3
 Peter D. Nichols1,2
 Luciana C. Ferreira4
 Heidi Pethybridge2
 Mark G. Meekan4
- 1Institute for Marine and Antarctic Studies, University of Tasmania, Hobart, TAS, Australia
- 2CSIRO Oceans & Atmosphere, Hobart, TAS, Australia
- 3Antarctic Climate & Ecosystems Cooperative Research Centre, Hobart, TAS, Australia
- 4Australian Institute of Marine Science, Indian Ocean Marine Research Centre (M096), Crawley, WA, Australia
Stable isotope analysis of dermis was used to examine foraging behavior of whale sharks at Ningaloo Reef in Western Australia. Values of δ13C and δ15N in dermis were compared to those obtained from likely species of local prey. The δ13C values of zooplankton and nektonic taxa at Ningaloo ranged from −18.9‰ to −16.5‰ reflecting the different carbon sources (from pelagic to more inshore and benthic) entering the food web. Isotopic values also varied depending on the diet-to-tissue discrimination factor applied in the analysis. When data was corrected using factors derived from slow turnover, structural cartilage in fins, whale sharks showed a greater reliance on pelagic food webs, whereas analyses using raw data suggested a greater dietary component from benthic and inshore habitats. Variability in δ15N values (6.9‰ to 10.8‰) implied different patterns of foraging among whale sharks, likely indicating movement among foraging localities that occur at Ningaloo Reef and along the Western Australian coast. There was evidence of enrichment in 15N occurring with increasing size in males and females, a pattern that could have been due to changes in growth rate and trophic level with age and/or an ontogenetic shift in feeding grounds. Given the variability potentially induced in stable isotope values by differences in rates of turnover of tissues and the use of diet-to-tissue discrimination factors, future studies would benefit from a multi-technique approach using different tissues to identify the diet of whale sharks.
Introduction
Of the ∼500 extant species of shark, the whale shark (Rhincodon typus) is the largest and one of only three to evolve that are filter feeders. Similar to baleen whales (Werth, 2000; Potvin et al., 2012), whale sharks can attain giant body sizes because this mode of feeding allows them to target and efficiently gather abundant planktonic prey that are many orders of magnitude smaller than their own body size, while maintaining body temperatures (gigantothermy; Meekan et al., 2015). This food is, however, patchy both in space and time, and as a result whale sharks are highly mobile, occupying both coastal and open-ocean habitats (Wilson et al., 2006; Hueter et al., 2013; Hearn et al., 2016). Similar to many other sharks (Wetherbee and Cortés, 2004; Wearmouth and Sims, 2008), populations are segregated by size and sex. Juvenile males are often encountered in aggregations at near-shore locations in tropical and warm-temperate locations worldwide, whereas females, pups (<3 m) and adults (≥8 m) are thought to occupy deeper, oceanic waters (Rowat et al., 2008; Norman et al., 2017; Ramírez-Macías et al., 2017). These patterns suggest that the foraging behavior of whale sharks, and thus their role in oceanic and coastal ecosystems, is likely to vary both in space and time.
In Australian waters, aggregations of whale sharks [mostly juvenile males <8 m total length (TL)] occur at Ningaloo Reef, Western Australia (Meekan et al., 2006; Norman et al., 2017), where the continental shelf reaches its narrowest point (∼10 km). Although some animals are present only during the austral autumn, others may remain resident along the coast for much of the year (Norman et al., 2016). The seasonal occurrence of these large zooplanktivores along the reef slope has been associated with an increase in planktonic productivity close to the reef that is driven by a combination of deepening of the mixed-layer of the Leeuwin Current (Wyatt et al., 2010; Rousseaux et al., 2012) and re-export of phytoplankton nutrients re-mineralized by the reef along the Ningaloo coast (Wyatt et al., 2012a). At Ningaloo Reef, whale sharks have been observed feeding on euphausiid swarms (Pseudeuphausia latifrons), crab megalopae, chaetognaths, copepods, stomatopod larvae and schools of small fish in surface waters (Wilson et al., 2001; Jarman and Wilson, 2004; Taylor, 2007). Recent fatty acid analysis of whale sharks at both Ningaloo and off the coast of Mozambique have suggested that demersal zooplankton close to the coast or other meso-pelagic prey in the deep-scattering layer off the continental shelf are also key components of their diet (Couturier et al., 2013; Rohner et al., 2013; Marcus et al., 2016). However, the relatively limited number and dispersed origin of dietary studies of whale sharks mean that at present, it is difficult to determine general patterns in the trophic ecology of these animals in coastal ecosystems and the degree to which they act as links between oceanic and reef environments.
Stable isotope analysis (SIA) is often used to investigate the trophic ecology of sharks (e.g., Abrantes and Barnett, 2011; Albo-Puigserver et al., 2015; Ferreira et al., 2017), including whale sharks (Borrell et al., 2011; Prebble et al., 2018; Wyatt et al., 2019). This is possible because the isotopic composition of the tissues of an animal reflects assimilated diet over time (e.g., quality and composition of food), plus some variation related to the metabolism and the physiology of the species and the types of tissue analyzed (DeNiro and Epstein, 1976; Wolf et al., 2009). The increase in δ13C values from prey to consumer indicates the food web source of the diet, whereas the fractionation in δ15N values is particularly useful in estimating trophic position. The isotopic composition of food webs varies temporally (inter-annual or seasonal) and spatially (offshore/inshore or pelagic/benthic) depending on localized biogeochemical processes (François et al., 1993; Montoya, 2007) and global changes in climate. The isotopic composition of the tissues of a consumer will then reflect those particular habitats and environments where the animal has foraged (Graham et al., 2010; McMahon et al., 2013).
Determination of the length of time over which isotopes are integrated into different tissues is critical to the correct interpretation of SIA (Wolf et al., 2009). Typically, highly active metabolic tissues (e.g., whole blood, plasma and liver) incorporate stable isotopes from food relatively quickly and as a result provide dietary records for periods of days or weeks, whereas tissues with slower turnover rates (e.g., muscle, fin and cartilage) reflect patterns of diet integrated over months even years (MacNeil et al., 2006; Kim et al., 2012). Similarly, knowledge of diet-to-tissue discrimination factors for carbon and nitrogen (Δ13C and Δ15N), which can vary among species, tissues and diets (Wolf et al., 2009; McMahon and McCarthy, 2016) is also central to these analyses. Estimates of discrimination factors usually require laboratory studies, which for large elasmobranchs are logistically difficult to undertake. At present, only one study has achieved this goal, with feeding of captive whale sharks in an aquarium at Okinawa providing estimates of turn over and discrimination factors for plasma and fin cartilage (Wyatt et al., 2019). Values of Δ13C for fin cartilage from this study are among the largest calculated for elasmobranchs (e.g., MacNeil et al., 2006; Hussey et al., 2010; Kim et al., 2011, 2012), highlighting the complexity in interpreting stable isotope data in these large ectotherms. Where whale sharks are sampled in the wild, the collection of tissues for biochemical analyses from living animals generally involves skin biopsies that remove the outermost layer of dermal denticles and a portion of the collagenous connective tissue that lies beneath (hereafter “dermis”) (e.g., Couturier et al., 2013; Rohner et al., 2013; Marcus et al., 2016; Prebble et al., 2018). Turnover rates and discrimination factors for this tissue type are still unknown.
The aim of this study was to better understand the foraging behavior of whale sharks aggregating at Ningaloo Reef using analysis of δ13C and δ15N values in the dermis. We sought to corroborate the results of recent biochemical studies (fatty acid analyses; Marcus et al., 2016), that have shown that the diet of these animals is broader than one based only on foraging on pelagic food webs at Ningaloo Reef. To achieve this goal, we compared the results of SIA of the zooplankton and nektonic communities as a reference of food webs at Ningaloo Reef with those of whale sharks. We also hypothesized that the isotopic composition of whale sharks would be influenced by the size and the sex of individuals. To test these hypotheses, we sampled the dermis of whale sharks of different sexes and sizes at the same time of year over two consecutive seasons (2013 and 2014) to infer their trophic niche width.
Materials and Methods
Collection of Samples
Biopsies were sampled from 50 whale sharks at Ningaloo Reef (Western Australia; 22° 33′ 45″ S, 113° 48′ 37″ E) during May 2013 and May 2014, coinciding with the annual aggregation at this location. Two centimeters of dermis was collected from the left side of the animals using a hand spear fitted with a biopsy probe tip and applied by a snorkeler. The middle part of the dermis (a third of the biopsy) which was very poorly vascularized and thus likely to be less metabolically active was immediately frozen in liquid nitrogen for SIA. Whale sharks were sexed according to the absence or presence of claspers in their pelvic fins. Biopsies were collected from 19 males and 5 females in 2013 and from 20 males and 6 females in 2014. TL of whale sharks ranged from 3 to 8.5 m for males and from 3 to 7 m for females (Supplementary Table S1 online).
Potential prey of whale sharks at Ningaloo Reef included zooplankton (100–1000 μm) and a wide range of other nektonic taxa (>1000 μm) such as decapod and stomatopod larvae, euphausiids, mysids, amphipods, isopods, decapods (adult), polychaetes, fish larvae and pelagic fish. Zooplankton samples, stomatopod and decapod larvae were collected in both 2013 and 2014, whereas other nekton were sampled only in 2014 (for species details see Marcus et al., 2016). Samples were collected at different stations within 10 km offshore of the reef front of the fringing reef at Ningaloo (see Marcus et al., 2016 for map and details of collection). Zooplankton samples were collected by horizontal or oblique tows using 200 and 300 μm mesh nets for 10 min at a speed of ∼2 knots from a boat. Other nekton taxa were sampled using two light traps (Meekan et al., 2001) deployed at the surface during the night. All samples were transported in insulated containers with ambient sea water to shore. Once in the laboratory, a Folsom’s Sample Divider was used to divide zooplankton samples. A quarter of the sample was kept frozen for SIA and another quarter was fixed with 70% ethanol for further taxonomic identification. Samples from light trap collections were sorted to the highest taxonomic resolution and a few representatives of each taxa were frozen.
Lipid and Urea Effects on Whale Shark Isotopic Composition
Prior to analysis, lipid and urea were extracted from whale shark samples to standardize δ13C and δ15N values. Since lipids are depleted in 13C relative to protein and carbohydrates (DeNiro and Epstein, 1977), their presence potentially affects δ13C values of dermis of whale sharks. Similarly, sharks retain 15N-depleted nitrogenous compounds (e.g., urea and trimethylamine oxide), which may result in artificially lower δ15N values (Marcus et al., 2017). A combination of a standard chloroform:methanol:water extraction followed by deionized water rinsing was used to remove both lipids and urea following protocols of Marcus et al. (2017).
Stable Isotope Analysis
All samples (dermis of whale sharks, zooplankton and nekton taxa) were freeze-dried and ground to a fine powder. Approximately 0.4 to 0.7 mg of samples were weighed in tin capsules and stable isotopes analyzed using a flash combustion isotope ratio mass spectrometry (varioPYRO cube coupled to Isoprime100 mass spectrometer) at the Central Science Laboratory, University of Tasmania (Australia). The results are expressed in delta (δ) values as the deviations from conventional standards in parts per thousand (‰) from the following equation:
where X = 13C or 15N and R = the ratio 13C/12C or 15N/14N. Reference standards for quantifying 13C and 15N materials were Pee Dee Belemnite (PDB) and atmospheric nitrogen, respectively. Stability of the instrumentation, analytical precision, drift correction and linearity performance were calculated from the repetitive analysis of these standards. The method precision was ± 0.1‰ for both isotopes.
Lipid Effects on Zooplankton and Nektonic Taxa Isotopic Composition
Lipids can also affect δ13C values of zooplankton and nekton taxa in this study (Marcus et al., 2017). The following lipid normalization equations were applied to adjust δ13C values:
Zooplankton, euphausiids, mysids, amphipods, isopods and polychaetes:
where δ13CLE was the value of δ13C after lipid normalization and δ13Cbulk was the direct measurement of δ13C of the target animal. This equation was developed from analyses of the whole body of zooplankton samples collected at the same time and location as the present study (see Marcus et al., 2017).
Pelagic fish, fish larvae and Spratelloides spp.:
where L was lipid content, D was 7.018‰, the difference in isotopic composition between protein and lipid, and I was a constant value of 0.048. Equation by McConnaughey and McRoy (1979) and revised by Kiljunen et al. (2006).
Decapod larvae, stomatopod larvae and decapods:
where β0 and β1 were estimated parameters for different animal taxa from Logan et al. (2008).
Stable Isotopes of Potential Prey and Whale Sharks
Differences in isotopic values of zooplankton samples, stomatopod, decapod larvae and whale sharks between years of collection were compared using a Student’s T-test or a Wilcoxon-Mann-Whitney Test when assumptions of normality and homogeneity of the variance were not met. The assumption of normality was verified using a Shapiro-Wilk Test and the homogeneity of the variances was analyzed with a Bartlett Test. The isotopic composition of whale sharks and the zooplankton and nektonic communities at Ningaloo Reef were compared by plotting the average values of δ13C and δ15N of each group.
The isotopic values of whale sharks were calculated without and with correction for diet-to-tissue discrimination factors. No discrimination estimates are yet available for the dermis. As it is a cartilaginous tissue, we used mean Δ13C and Δ15N values of 5.3‰ and 2.6‰, respectively, from fin cartilage of captive whale sharks estimated by Wyatt et al. (2019).
The minimum, maximum and mean trophic level of whale sharks were estimated using the equation of Post (2002):
where λ was the trophic level of the selected baseline organism, δ15Nconsumer was the δ15N value of whale sharks, δ15Nbase was the δ15N value of the baseline organism in the food web and Δ15N was the trophic discrimination factor between trophic levels. Zooplankton samples collected using 100 μm mesh filter size (phytoplankton feeders, TP = 2) were used as baseline organisms with δ15N values (δ15Nbase) of 5.9‰ (mean of seven samples). We used the Δ15N of 2.6‰ for fin cartilage by Wyatt et al. (2019).
Isotopic Variance and Niche Width of Whale Sharks
Generalized linear models (GLM) with a Gaussian distribution were used to assess how much variation in δ13C and δ15N values of whale shark dermis could be explained by year, sex and TL. Full subsets of all combinations of the set of predictors were fitted with the package MUMIn (Barton, 2013). Model selection was performed by ranking the models by the Akaike’s Information Criterion with a second-order correction for small sample size (AICc) (Burnham and Anderson, 2002). The model containing the lowest number of explanatory variables, the most parsimonious, was selected when multiple models were ranked equally (models within 2AICc units). AICc values were also presented as AICc differences (ΔAICc) and the AICc weights (wAICc). Goodness of fit was assessed by the percentage deviance explained (%DE). The R-package visreg (Breheny and Burchett, 2016) was used to plot the top-ranked models.
The isotopic niche widths of male and female whale sharks and size classes were estimated using a Bayesian approach based on multivariate ellipse-based metrics, which identifies differences in niche widths of members of a population (Jackson et al., 2011). The Bayesian method generated standard ellipse areas (SEA) that contained the mean core niche area of the population. SEA was expressed graphically using a version corrected for small sample sizes (SEAc). This metric represents a measure of the total amount of the isotopic niche exploited by a species and is thus a proxy for the extent of trophic diversity. This method also generated a Bayesian estimate (SEAb) and the SEAb 95% credible intervals. All metrics were calculated following (Jackson et al., 2011) and using the R packages siar and SIBER (Parnell and Jackson, 2015; Jackson and Parnell, 2019).
Results
Stable Isotopes of Potential Prey Species
Isotopic values of potential prey groups collected at Ningaloo were separated by year. This included annual differences in δ13C values of zooplankton (W = 22, p = 0.013) and δ15N values in decapod larvae (t = −4.764, df = 5.303, p < 0.01) and stomatopod larvae (t = −4.079, df = 6, p < 0.01). Overall, zooplankton samples for both years, polychaetes, euphausiids, isopods, amphipods and mysids all were depleted in 13C, with values <−18‰ (Table 1 and Figure 1). Intermediate δ13C values of −17.8‰ ± 0.4 and −17.9‰ ± 0.1 were recorded for stomatopod larvae and decapods collected in 2014, respectively. Higher δ13C values were characteristic of decapod larvae for both years, stomatopod larvae for 2013, fish larvae and pelagic fishes. Values of δ13C for these groups ranged from −17.5‰ to −17.0‰. Spratelloides spp. showed an isotopic composition that was more enriched in 13C than any other prey taxa at −16.5‰ ± 0.4 (Table 1 and Figure 1).
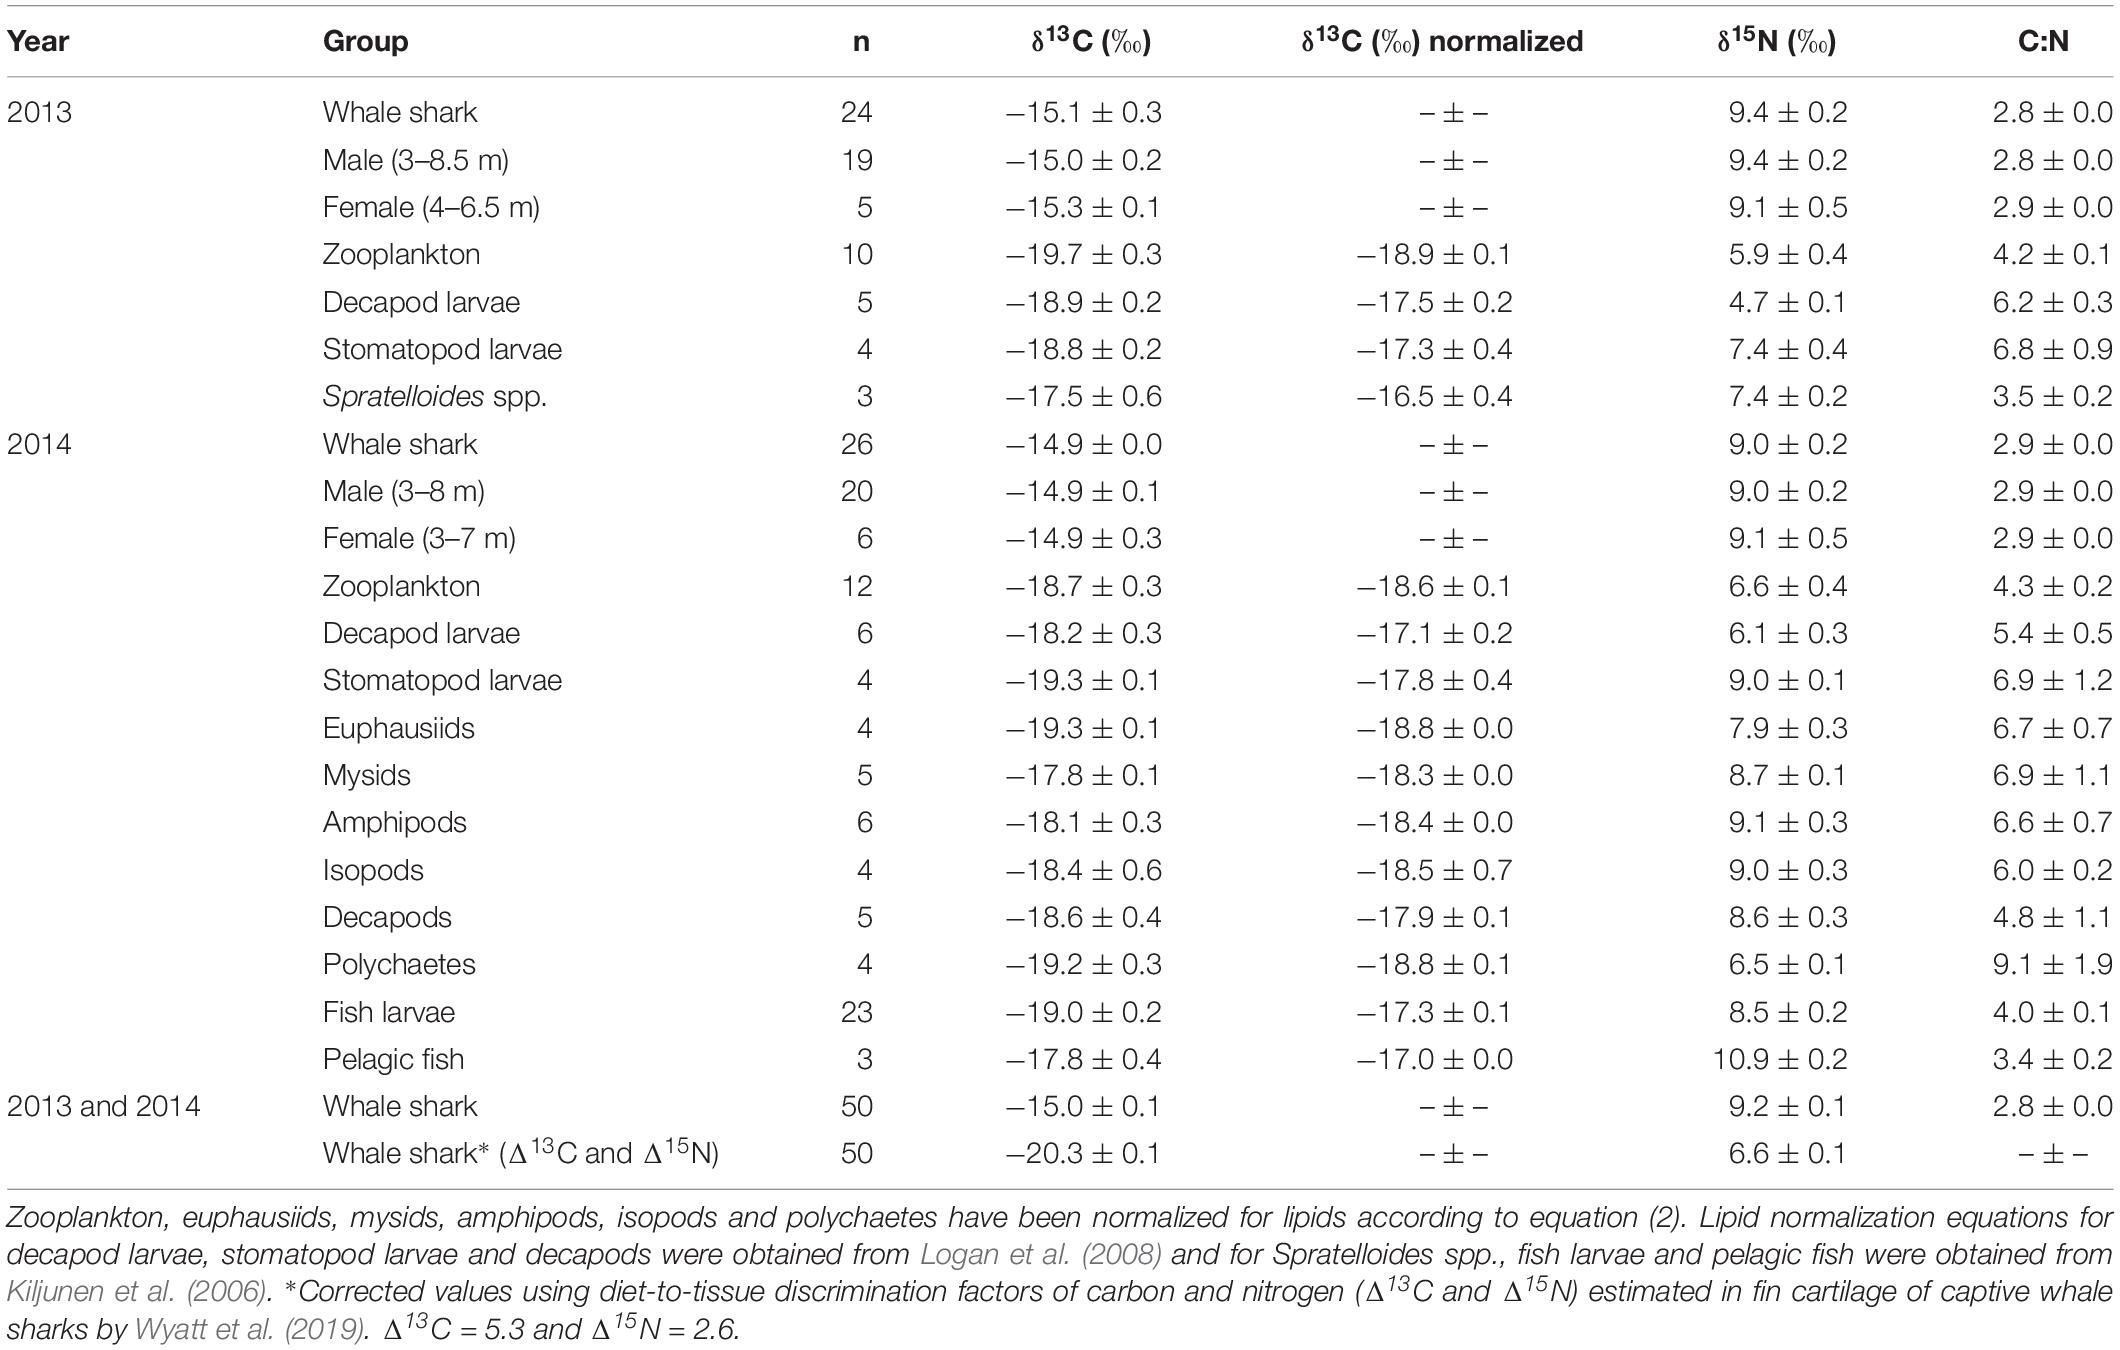
Table 1. The mean isotopic values (‰ ± standard error) of whale shark dermis (lipids extracted) and potential prey collected at Ningaloo Reef in May 2013 and 2014.
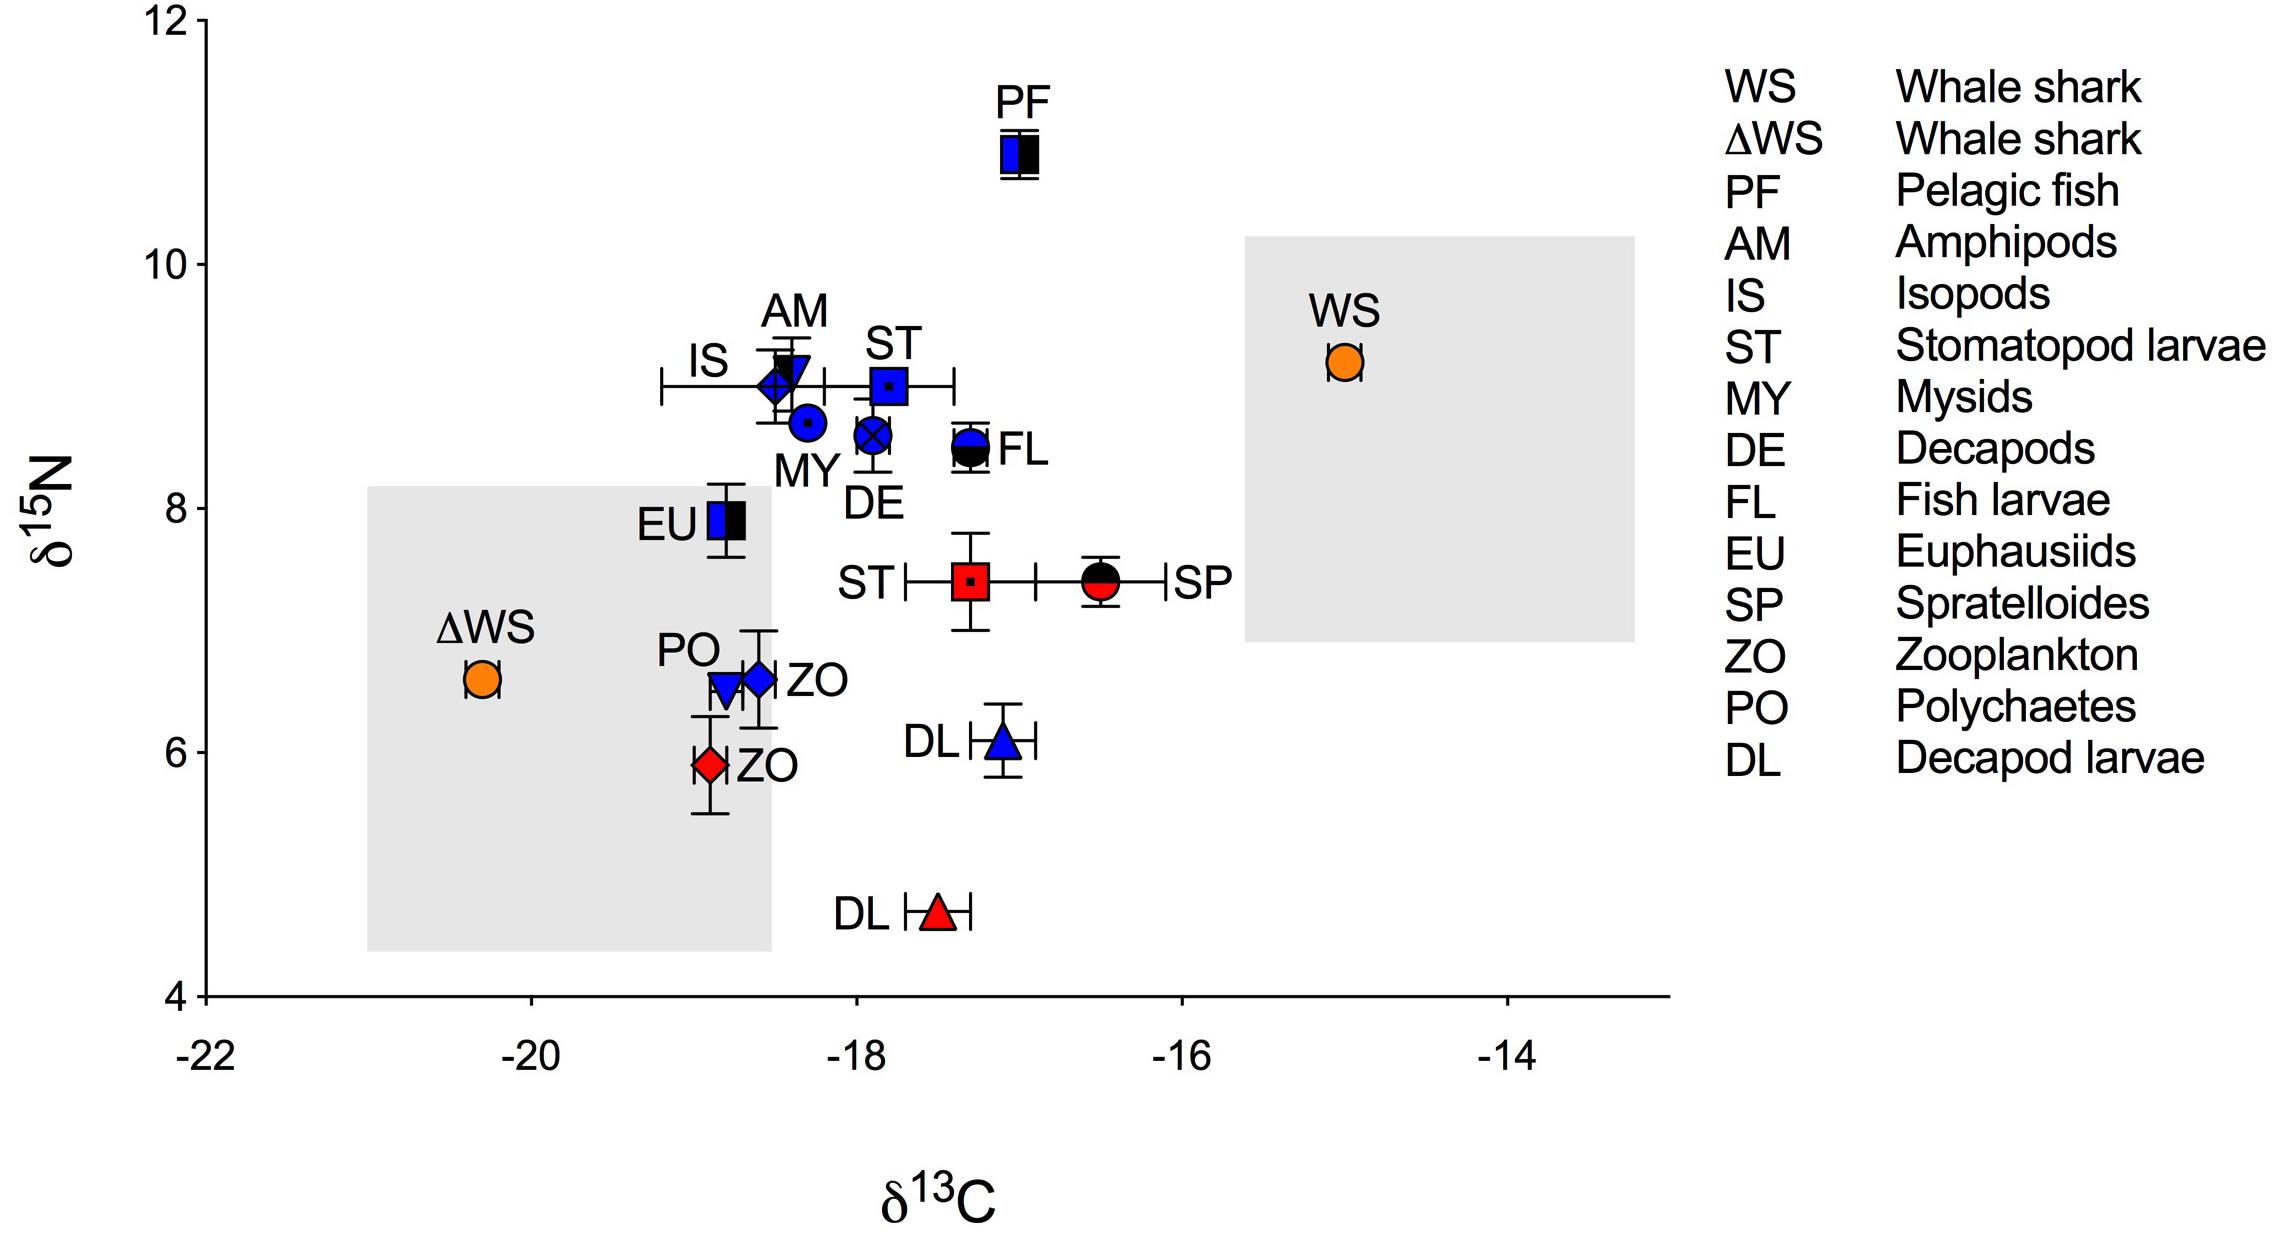
Figure 1. Biplot of mean isotopic values (‰ ± standard error) of whale shark dermis (lipids extracted) and potential prey (lipid normalized) collected at Ningaloo Reef in May 2013 and 2014. Mean isotopic composition of whale shark dermis is displayed for non-corrected values (WS) and for corrected values for isotopic discrimination (ΔWS) using diet-to-tissue discrimination factors of carbon and nitrogen (Δ13C and Δ15N) estimated in fin cartilage of captive whale sharks by Wyatt et al. (2019), (Δ13C = 5.3 and Δ15N = 2.6). Potential prey is divided by years of sampling due to significant differences in the isotopic composition of some taxa between 2013 (red) and 2014 (blue). Shade areas indicate whale shark isospace for non-corrected and for corrected values for isotopic discrimination.
Values of δ15N for isopods, amphipods, stomatopod larvae in 2014, mysids, decapods and fish larvae ranged from 8.5‰ to 9.1‰ (Table 1 and Figure 1). Euphausiids, stomatopod larvae in 2013, Spratelloides spp., zooplankton for both years, polychaetes and decapod larvae in 2014 were more depleted in 15N with δ15N values ranging from 5.9‰ to 7.9‰. Decapod larvae collected in 2013 were the most depleted in 15N (4.7 ± 0.1‰), whereas pelagic fish were the most enriched (10.9 ± 0.2‰, Table 1 and Figure 1). The C:N ratios ranged from 3.4 in pelagic fish to 9.1 in polychaetes (Table 1).
Stable Isotopes of Whale Sharks
The raw and corrected isotopic values for diet-to-tissue discrimination factors of whale sharks in 2013 and 2014 are summarized in Table 1. For raw values, ratios of C:N ranged from 2.6 to 3.1. Among individuals, δ13C and δ15N values ranged from −15.7‰ to −13.3‰ and from 6.9‰ to 10.8‰, respectively (Supplementary Table S1 online). Analysis of raw values showed that whale sharks were more enriched in 13C than zooplankton and other nekton taxa by at least 1‰ (Table 1 and Figure 1). However, when mean Δ13C and Δ15N for fin cartilage of captive whale sharks (Wyatt et al., 2019) were used to correct for tissue discrimination, these values shifted, suggesting that whale sharks fed on prey with δ13C values from −21‰ to −18.6‰ and with δ15N values from 4.3‰ to 8.2‰. The isospace of whale sharks, corrected for diet-tissue discrimination, matched some of the collected prey including zooplankton for both years, polychaetes and euphausiids (Figure 1). The trophic level of whale sharks using minimum (6.9‰), maximum (10.8‰) and mean (9.2‰) δ15N values were 1.1, 2.6 and 2, respectively.
Isotopic Variance and Niche Width of Whale Sharks
The model selected to explain variance in δ13C values in dermis of whale sharks included TL. Although this variable only explained 6% of the deviance in the response (Table 2), the model indicated an increase in δ13C values with size (Figure 2A). For values of δ15N, the selected model included TL and sex, and the interaction between these two terms, and explained 33% of the deviance (Table 2). Model predictions showed an increase in δ15N values with size, which was more pronounced in females than in males (Figure 2B).
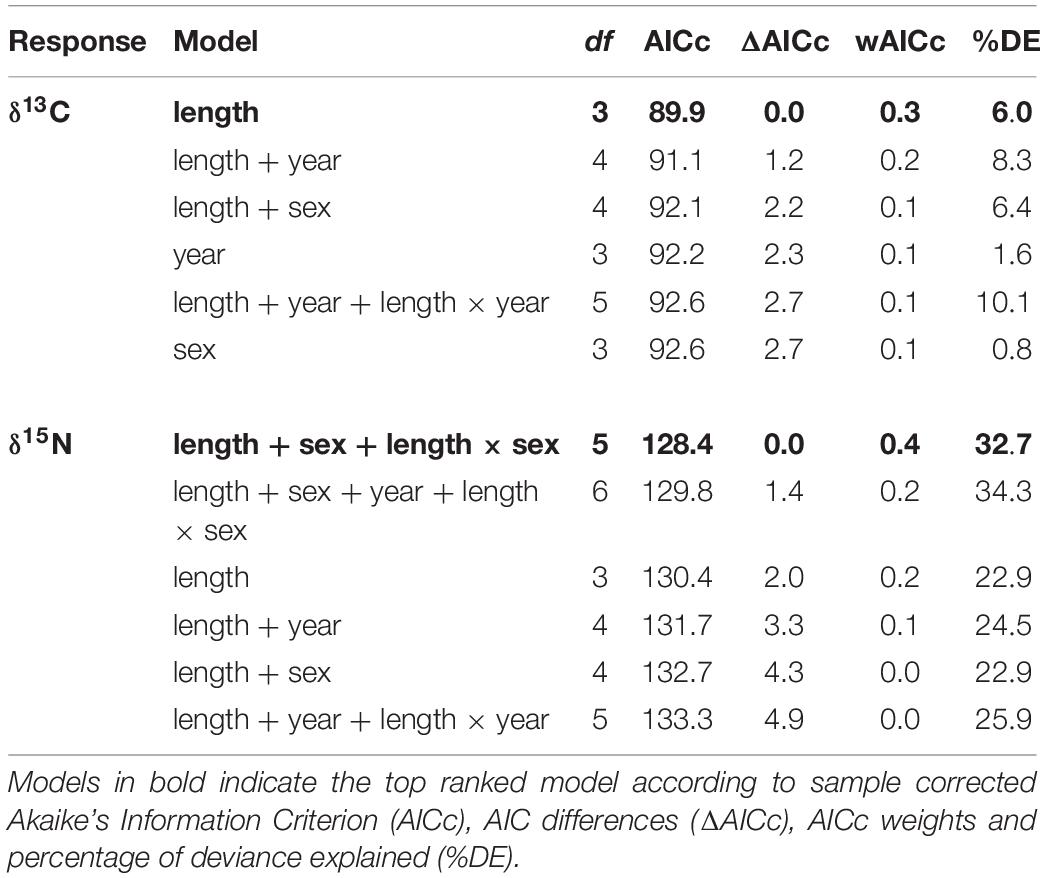
Table 2. Ranked Generalized Linear Models for δ13C and δ15N values for whale shark dermis.
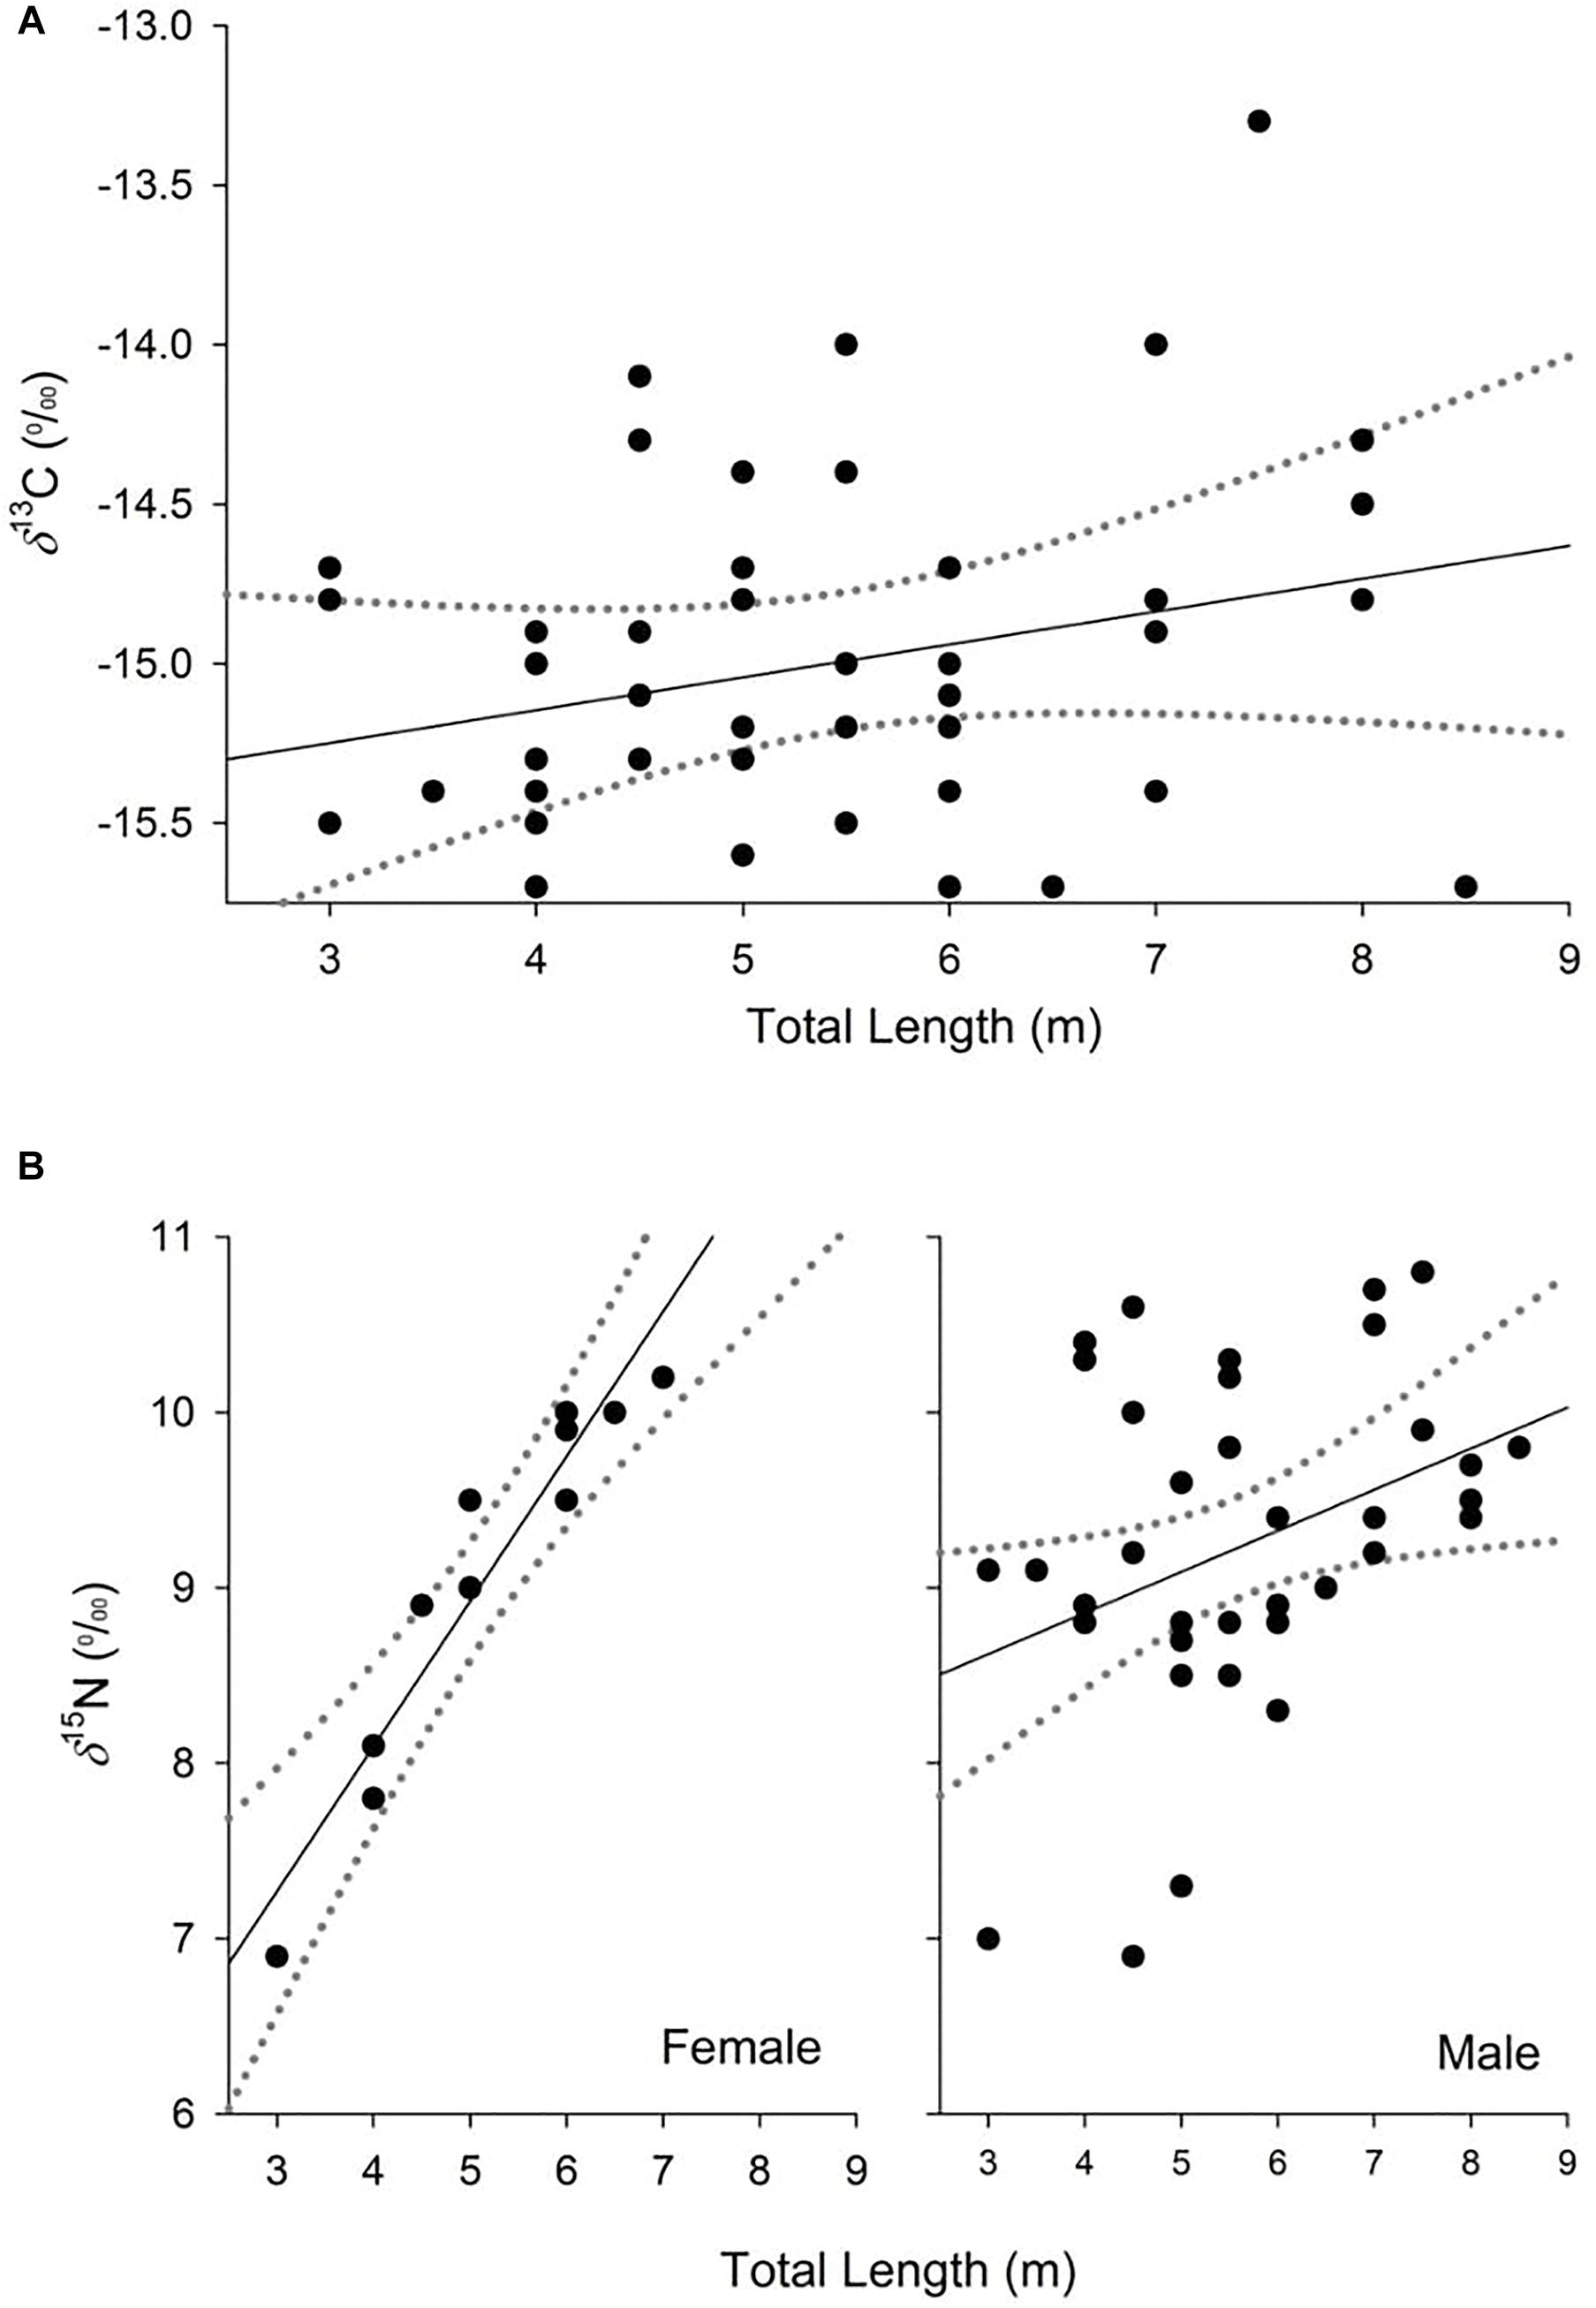
Figure 2. Partial dependence plots of the relationship between δ13C (A) and δ15N (B) values and the explanatory variables for the top-ranked models from analysis of whale shark dermis. Dashed lines represent 95% confidence interval.
The niche width metrics for male and female whale sharks showed that the isotopic core niche of both groups showed significant overlap (Table 3, Figure 3A, and Supplementary Figure S1 online), although males presented a slightly larger niche area than females (Table 3 and Figure 3B). The area of overlap comprised 89% and 75% of total male and female isotopic niche area, respectively. The isotopic core niches of small (≤4 m), intermediate (4–8 m) and large sized (≥8 m) whale sharks also overlapped (Figure 3C). Whale sharks of 4–8 m had the biggest niche area, followed by the smallest and the largest size-class (Table 3 and Figure 3D). Small individuals showed an ellipse shaped niche area that stretched with increasing δ15N. However, the niche area of the ≥8 m whale sharks was skewed toward the δ13C axis (Figure 3C).
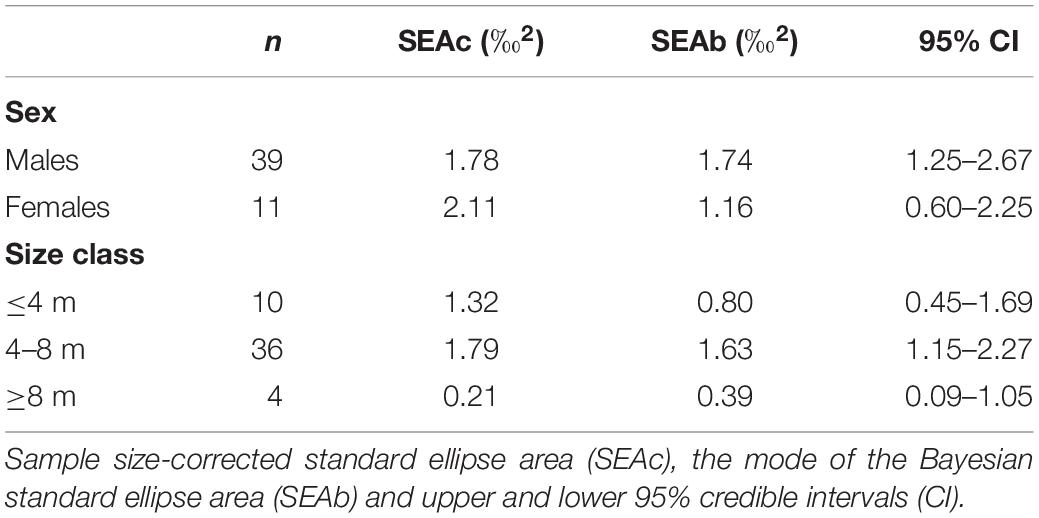
Table 3. Isotopic niche area estimates and parameters of whale shark dermis separated by sex and size class.
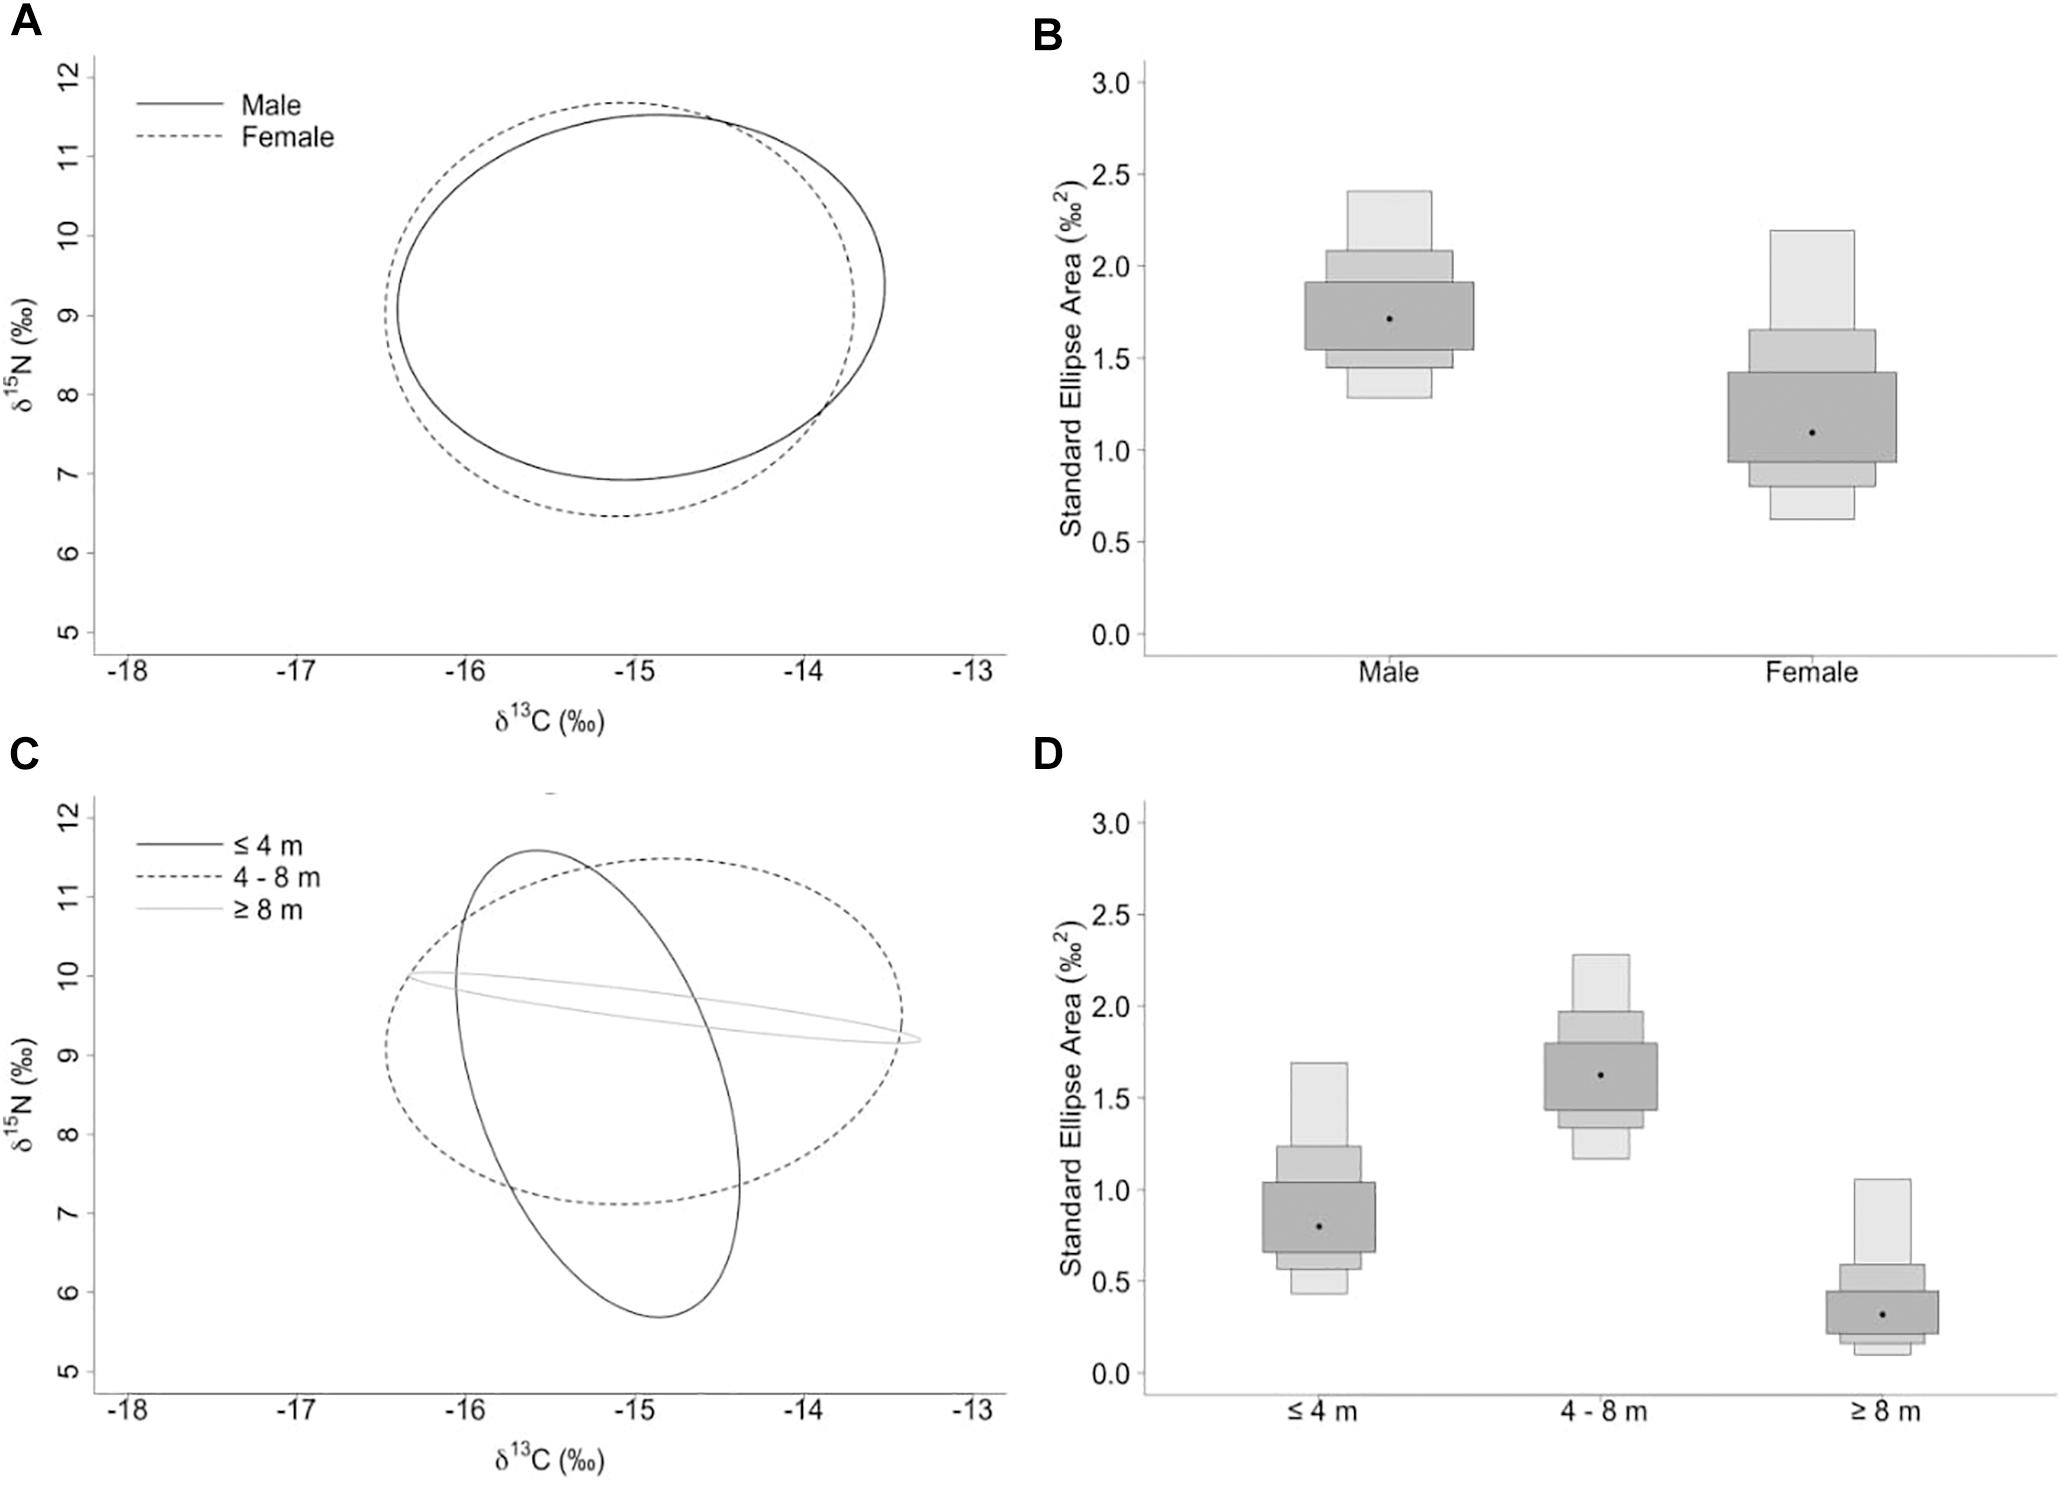
Figure 3. (A,C) Sample size-corrected standard ellipse area (SEAc) calculated from δ13C and δ15N values of whale sharks separated by sex and size-class. (B,D) Bayesian estimates of the standard ellipse area (SEAb). Shaded ellipse area plots represent 50, 75, and 95% credible intervals with SEAb mode indicated by a black circle.
Discussion
The extent to which stable isotope analyses suggested that whale sharks fed on food chains based on pelagic or inshore and benthic sources of carbon depended on the tissue discrimination factor applied to the analysis. The use of corrected values suggested that whale sharks at Ningaloo, which were mostly juvenile (length range 3–8.5 m TL) males (male: female sex ratio, 4: 1), foraged predominantly on pelagic food chains over possible time frames of years. In contrast, use of raw values implied that inshore and benthic food chains were a primary food source.
Corrected values for tissue isotopic discrimination suggested a diet of whale sharks that was largely focused on primary producers and consumers supported by pelagic phytoplankton-based food webs. With the exception of two sharks, which were more enriched in 13C, the narrow range in δ13C values suggested that this pattern of foraging was consistent among individuals. Whale sharks at Ningaloo are known to feed on krill as well as other zooplankton and low-trophic level invertebrates (e.g., Jarman and Wilson, 2004; Taylor, 2007). However, it is also possible that whale sharks also ingest and assimilate phytoplankton and algae debris during filter feeding (Rohner et al., 2013; Wyatt et al., 2019). Wyatt et al. (2019) used compound specific isotopic analysis of amino acids to examine the diet of whale sharks in the waters off Okinawa and calculated low trophic positions for these sharks consistent with a significant role of herbivory in the diet of some individuals. Similarly, we found that whale sharks had a low trophic level of <3 at Ningaloo Reef. In the present study, the use of non-corrected isotope values shifted the carbon sources of whale sharks to a diet based on reef or benthic derived production (enriched in 13C and 15N). These results are supported by recent biochemical studies that found whale shark tissues to be enriched in n–6 polyunsaturated fatty acids, particularly arachidonic acid (20:4n–6; Couturier et al., 2013; Rohner et al., 2013; Marcus et al., 2016). Benthic algae, some protozoans and microeukaryotes, including heterotrophic thraustochytrids are rich in these acids, although they may be incorporated into whale sharks via benthic zooplankton that feed in sediment during the day and emerge at night to be consumed by whale sharks (Couturier et al., 2013).
Our contrasting results in the source of carbon supporting the food web for whale sharks at Ningaloo highlight the uncertainties in dealing with tissue discrimination for these animals. The values of Δ13C > 5‰ for fin cartilage (Wyatt et al., 2019) used in our analyses might not reflect the isotopic discrimination in the dermis, despite the fact that both tissues are cartilaginous. In comparison to the fin cartilage analyzed by Wyatt et al. (2019), the dermis we sampled was not structural tissue and was collected away from the fin on the dorsal surface of the animal. It is likely that far more processing of carbon is necessary to build structural (fin) cartilage than dermal tissue, so that turnover rates for dermis will be faster than fin tissue. In addition, the routing of amino acids might also differ between tissues. Considering estimates of turnover rates of whale sharks in the aquarium at Okinawa for plasma (faster turnover tissue) and fin cartilage (slow turnover tissue) of 9 months and 3 years, respectively (Wyatt et al., 2019), the outcomes in this study are likely to reflect dietary information integrated over long-time scales from several months to years. Determining the extent of such differences will, however, require experimental biochemical studies that include dermal tissues, a task that could be undertaken in aquaria following the work of Wyatt et al. (2019).
The isotopic composition of potential prey collected at Ningaloo Reef also reflected the sources of carbon fueling the food web. Zooplankton, polychaetes and euphausiids, which clustered at a similar trophic level, had a stronger link to pelagic food chains that were depleted in 13C, whereas the fish assemblage (Spratelloides spp., fish larvae and pelagic fish) was relatively enriched in 13C suggesting that they were largely supported by reef-derived production (e.g., coral or macroalgae), (Wyatt et al., 2012b). The scatter of δ13C values in stomatopod and decapod larvae suggested a carbon contribution either from the reef or the pelagic zooplankton or a combination of the two. Values of δ15N in zooplankton (low trophic level) and fish assemblages (middle and higher trophic levels) were consistent with those measured by earlier studies at Ningaloo and in coral reefs in Japan and Hawaii (Yamamuro et al., 1995; Wyatt et al., 2012b; Bradley et al., 2016). However, reef systems such as Ningaloo are subject to marked temporal and spatial differences in nutrient supply due to changing oceanographic conditions (Wyatt et al., 2012a). In our study, the high δ15N values in the 2014 samples of zooplankton, crab larvae and stomatopod larvae compared to those of 2013 might reflect an increase in upwelled nutrients in 2014 (Wyatt et al., 2012b).
Values of δ15N varied among sharks suggesting a diet from a wide range of nitrogen sources. Whale sharks tagged at Ningaloo Reef have shown fidelity to the seasonal aggregation, regularly returning to Ningaloo over several years (Andrzejaczek et al., 2016; Norman et al., 2016). However, most whale sharks also display a broad range of movements close to the coastline of Ningaloo and the continental shelf off Western Australia, mostly in a northward direction with forays to the open ocean (Wilson et al., 2006; Sleeman et al., 2010; Norman et al., 2016). In the eastern Indian Ocean, Raes et al. (2014) found a latitudinal increase in the values of δ15N of organic matter across the shelf break off Western Australia. This might imply that whale sharks that were more depleted in 15N in our study were feeding on prey in warmer waters off the north-west Australian coast and the Timor Sea. In contrast, individuals with higher values of 15N might depend on more enriched food webs at higher latitudes and on the continental shelf to the south.
Variability in δ15N values observed in this study could also be a consequence of growth effects in whale sharks. Generalized linear models revealed a consistent enrichment in δ15N with TL. This pattern seemed to be more pronounced for females, suggesting differences in the physiology and/or the diet of whale sharks between sexes. Despite this evidence, the isotopic core niche of males and females of similar size ranges (3–8 m) overlapped, implying that the trend with increasing size in females should be treated with caution, due to low sample sizes (n = 11). The increase in δ15N values with size in males and females could reflect differences in tissue discrimination factors due to, for example, changes in growth rates with age (Wyatt et al., 2019). Previous mass-balance models and experimental studies of sharks have shown that discrimination factors could decrease with age due to a higher ratio of nitrogen incorporation to loss in the tissues of fast-growing, young individuals compared to slow-growing adults (Martínez del Rio and Wolf, 2005; Trueman et al., 2005; Wyatt et al., 2019). Accordingly, young individuals that are growing rapidly could show isotopic compositions that are more depleted in 15N than larger adult conspecifics, despite an overlap in diet.
An enrichment in 15N with increasing size of whale sharks might also indicate changes in trophic level with age. Given that neonate whale sharks have rudimentary filtration structures
(Garrick, 1964), an ontogenetic shift in diet would be expected as their filter pads develop. This would allow dead-end sieving or cross-flow filtration to commence, enabling whale sharks to feed on mid-trophic-level prey such as small baitfish and larger zooplankton (Motta et al., 2010; Paig-Tran et al., 2011). The larger variability in δ15N values in smaller whale sharks, as shown by an isotopic niche core biased toward the δ15N axis, might indicate such changes in the mode of feeding. Alternatively, or in addition, they might also represent changes in foraging habitat with age. For example, Borrell et al. (2011) suggested that differences in isotopic composition among sizes of whale sharks sampled in the Arabian Sea off the coast of India were consistent with a transition from offshore to more inshore areas as animals grew. There is little suggestion from tagging data of such a transition within the size range of whale sharks at Ningaloo, with small (4 m) animals embarking on very similar trajectories of movement as the largest in the aggregation (Norman et al., 2016). In the future, the use of compound stable isotope analysis of amino acids could help to identify shifts in trophic level or changes at the base of the food web with size.
The number of other studies of stable isotopes of whale sharks are limited, although they have yielded results similar to our work. Values of δ13C and δ15N of whale sharks at Ningaloo Reef were within ranges recorded in dermis of juvenile males in coastal waters of the western Indian Ocean (Mozambique, Tanzania and Qatar), and off the coast of Okinawa in Japan (Prebble et al., 2018; Wyatt et al., 2019). Notably, sharks sampled off the coast of Okinawa also had a diet of prey supported by regional phytoplankton. In another study, Borrell et al. (2011) found that muscle of large females (4–18 m) in the Arabian Sea off the coast of India had isotope values similar to that of clupeid fishes (Ilisha melastoma) that feed on pelagic zooplankton. However, the isotopic composition of these large females was more depleted and enriched in 13C and 15N, respectively, than those of sharks at Ningaloo. Borrell et al. (2011) argued that high δ15N values were likely to be a result of organic pollution in the waters off Veraval in India where the sharks were captured. Depletion in 13C in muscle relative to the dermis we sampled in our study could, however, be due to differences in sample treatment before analysis. This also could be a result of physiological and metabolic factors including differences in the diet-to-tissue discrimination factors, turnover rates and/or amino acid composition between tissues, as noted for other pelagic sharks (Carlisle et al., 2012; Li et al., 2016; Prebble et al., 2018).
Conclusion
The variation in outcomes of analyses of whale shark tissue when different tissue discrimination factors were applied highlights the complexities involved in interpreting stable isotope data for these large migratory animals when the processes of dietary incorporation are not known and must be surmised. We did find evidence for changes in feeding with ontogeny that could either result from different-sized animals with different growth rates consuming the same food source, or different-sized animals feeding on the same prey that in different localities depended on a different basal source of N. A multi-tissue, multi-technique approach to biochemical analyses is now required to resolve the diet of whale sharks and their role within reef ecosystems.
Data Availability
All datasets generated for this study are included in the manuscript and/or the Supplementary Files.
Ethics Statement
This study was carried out in accordance with the recommendations of the “Australian Code of Practice for the Care and Use of Animals for Scientific Purposes, National Health and Medical Research Council”. The protocol was approved by the “University of Tasmania Animal Ethics Committee”.
Author Contributions
All authors conceived, designed, and performed the experiments and analysis. LM analyzed the data and wrote the manuscript with contributions from all authors.
Funding
This research was funded by the Save Our Seas Foundation (SOSF241), the Winifred Violet Scott Charitable Trust and the Holsworth Wildlife Research Endowment Grants (V0021438).
Conflict of Interest Statement
The authors declare that the research was conducted in the absence of any commercial or financial relationships that could be construed as a potential conflict of interest.
Acknowledgments
We thank the crew of “Osso Blu” and the people who contributed to field work at Ningaloo Reef, which special mention to Kim Brooks, Michele Thums, Dani Rob, Terry Maxwell, and the WA Department of Parks and Wildlife. We also thank Christine Cook and Christian Dietz from the Central Science Laboratory at the University of Tasmania. We also thank the helpful contributions of Alex Wyatt and the journal referees.
Supplementary Material
The Supplementary Material for this article can be found online at: https://www.frontiersin.org/articles/10.3389/fmars.2019.00546/full#supplementary-material
References
Abrantes, K. G., and Barnett, A. (2011). Intrapopulation variations in diet and habitat use in a marine apex predator, the broadnose sevengill shark Notorynchus cepedianus. Mar. Ecol. Progr. Ser. 442, 133–148. doi: 10.3354/meps09395
Albo-Puigserver, M., Navarro, J., Coll, M., Aguzzi, J., Cardona, L., and Sáez-Liante, R. (2015). Feeding ecology and trophic position of three sympatric demersal chondrichthyans in the northwestern Mediterranean. Mar. Ecol. Prog. Ser. 524, 255–268. doi: 10.3354/meps11188
Andrzejaczek, S., Meeuwig, J., Rowat, D., Pierce, S., Davies, T., Fisher, R., et al. (2016). The ecological connectivity of whale shark aggregations in the Indian Ocean: a photo-identification approach. R. Soc. Open Sci. 3:160455. doi: 10.1098/rsos.160455
Borrell, A., Aguilar, A., Gazo, M., Kumarran, R. P., and Cardona, L. (2011). Stable isotope profiles in whale shark (Rhincodon typus) suggest segregation and dissimilarities in the diet depending on sex and size. Environ. Biol. Fish 92, 559–567. doi: 10.1007/s10641-011-9879-y
Bradley, C. J., Longenecker, K., Pyle, R. L., and Popp, B. N. (2016). Compound-specific isotopic analysis of Amino acids reveals dietary changes in mesophotic coral-reef fish Mar. Ecol. Prog. Ser. 558, 65–79. doi: 10.3354/meps11872
Breheny, P., and Burchett, W. (2016). Package ‘visreg’: Visualization of Regression Models. R Package Version 2.2-2.
Burnham, K. P., and Anderson, D. R. (2002). Model Selection and Multimodel Inference: A Practical Information-Theoretic Approach. New York, NY: Springer.
Carlisle, A. B., Kim, S. L., Semmens, B. X., Madigan, D. J., Jorgensen, S. J., Perle, C. R., et al. (2012). Using stable isotope analysis to understand the migration and trophic ecology of northeastern Pacific white sharks (Carcharodon carcharias). PLoS One 7:e30492. doi: 10.1371/journal.pone.0030492
Couturier, L. I. E., Rohner, C. A., Richardson, A. J., Pierce, S. J., Marshall, A. D., Jaine, F. R. A., et al. (2013). Unusually high levels of ω6 polyunsaturated fatty acids in whale sharks and reef manta rays. Lipids 48, 1029–1034. doi: 10.1007/s11745-013-3829-8
DeNiro, M. J., and Epstein, S. (1976). You are what you eat (plus a few ‰) the carbon isotope cycle in food chains. Geol. Soc. Am. 6:834.
DeNiro, M. J., and Epstein, S. (1977). Mechanism of carbon isotope fractionation associated with lipid synthesis. Science 197, 261–263. doi: 10.1126/science.327543
Ferreira, L. C., Thums, M., Heithaus, M. R., Barnett, A., Abrantes, K. G., Holmes, B. J., et al. (2017). The trophic role of a large marine predator, the tiger shark Galeocerdo cuvier. Sci. Rep. 7:7641. doi: 10.1038/s41598-017-07751-2
François, R., Altabet, M. A., Goericke, R., McCorkle, D. C., Brunet, C., and Poisson, A. (1993). Changes in the δ13C of surface water particulate organic matter across the subtropical convergence in the SW Indian Ocean. Glob. Biogeochem. Cycl. 7, 627–644. doi: 10.1029/93gb01277
Garrick, J. A. F. (1964). Additional information on the morphology of an embryo whale shark. Proc. U.S. Nat. Mus. 115, 1–7. doi: 10.5479/si.00963801.115-3476.1
Graham, B. S., Koch, P. L., Newsome, S. D., McMahon, K. W., and Aurioles, D. (2010). “Using isoscapes to trace the movements and foraging behaviour of top predators in oceans ecosystems,” in Isoscapes: Understanding Movement, Pattern and Process on Earth Through Isotope Mapping, ed. J. B. West, (Berlin: Springer).
Hearn, A. R., Green, J., Román, M. H., Acuña-Marrero, D., and Espinoza, E. (2016). Adult female whale sharks make long-distance movements past Darwin Island (Galapagos, Ecuador) in the Eastern Tropical Pacific. Mar. Biol. 163:214.
Hueter, R. E., Tyminski, J. P., and de la Parra, R. (2013). Horizontal movements, migration patterns, and population structure of whale sharks in the Gulf of Mexico and Northwestern Caribbean Sea. PLoS One 8:e71883. doi: 10.1371/journal.pone.0071883
Hussey, N. E., Brush, J., McCarthy, I. D., and Fisk, A. T. (2010). Delta 15N and delta 13C diet-tissue discrimination factors for large sharks under semi-controlled conditions. Comp. Biochem. Phys. A 155, 445–453. doi: 10.1016/j.cbpa.2009.09.023
Jackson, A. L., Inger, R., Parnell, A. C., and Bearhop, S. (2011). Comparing isotopic niche widths among and within communities: SIBER—stable isotope Bayesian Ellipses in R. J. Anim. Ecol. 80, 595–602. doi: 10.1111/j.1365-2656.2011.01806.x
Jackson, A., and Parnell, A. (2019). Package ‘SIBER’:Stable Isotope Bayesian Ellipses in R. R Package Version 2.1.4.
Jarman, S. N., and Wilson, S. G. (2004). DNA-based species identification of krill consumed by whale sharks. J. Fish Biol. 65, 586–591. doi: 10.1111/j.0022-1112.2004.00466.x
Kiljunen, M., Grey, J., Sinisalo, T., Harrod, C., Immonen, H., and Jones, R. I. (2006). A revised model for lipid-normalizing δ13C values from aquatic organisms, with implications for isotope mixing models. J. Appl. Ecol. 43, 1213–1222. doi: 10.1111/j.1365-2664.2006.01224.x
Kim, S. L., Casper, D. R., Galván-Magaña, F., Ocho-Díaz, R., Hernández-Aguilar, S. B., and Koch, P. L. (2011). Carbon and nitrogen discrimination factors for elasmobranch soft tissue based on a long-term controlled feeding study. Environ. Biol. Fish 95, 37–52. doi: 10.1007/s10641-011-9919-7
Kim, S. L., Martínez del Rio, C., Casper, D., and Koch, P. L. (2012). Isotopic incorporation rates for shark tissues from a long-term captive feeding study. J. Exp. Biol. 215, 2495–2500. doi: 10.1242/jeb.070656
Li, Y., Zhang, Y., Hussey, N. E., and Dai, X. (2016) Urea and lipid extraction treatment effects on δ15N and δ13C values in pelagic sharks. Rapid. Commun. Mass. Spectrom. 30, 1–8. doi: 10.1002/rcm.7396
Logan, J. M., Jardine, T. D., Miller, T. J., Bunn, S. E., Cunjak, R. A., and Lutcavage, M. E. (2008). Lipid corrections in carbon and nitrogen stable isotope analyses: comparison of chemical extraction and modelling methods. J. Anim. Ecol. 77, 838–846. doi: 10.1111/j.1365-2656.2008.01394.x
MacNeil, M. A., Drouillard, K. G., and Fisk, A. T. (2006). Variable uptake and elimination of stable nitrogen isotopes between tissues in fish. Can. J. Fish Aquat. Sci. 63, 345–353. doi: 10.1139/f05-219
Marcus, L., Virtue, P., Nichols, P. D., Meekan, M. G., and Pethybridge, H. P. (2017). Effects of sample treatment on the analysis of stable isotopes of carbon and nitrogen in zooplankton, micronekton and a filter-feeding shark. Mar. Biol. 164:124.
Marcus, L., Virtue, P., Pethybridge, H. R., Meekan, M. G., Thums, M., and Nichols, P. D. (2016). Intraspecific variability in diet and implied foraging ranges of whale sharks at Ningaloo Reef, Western Australia, from signature fatty acids. Mar. Ecol. Prog. Ser. 554, 115–128. doi: 10.3354/meps11807
Martínez del Rio, C., and Wolf, B. O. (2005). “Mass-balance models for animal isotopic ecology,” in Physiological and Ecological Adaptations to Feeding in Vertebrates, eds J. M. Starck, and T. Wang, (Enfield NH: Science Publishers), 141–174.
McConnaughey, T., and McRoy, C. P. (1979). Food-web structure and the fractionation of carbon isotopes in the Bering Sea. Mar. Biol. 53, 257–262. doi: 10.1007/BF00952434
McMahon, K. W., Hamady, L. L., and Thorrold, S. R. (2013). A review of ecogeochemistry approaches to estimating movements of marine animals. Limnol. Oceanogr. 58, 697–714. doi: 10.4319/lo.2013.58.2.0697
McMahon, K. W., and McCarthy, M. D. (2016). Embracing variability in amino acid δ15N fractionation: mechanisms, implications, and applications for trophic ecology. Ecosphere 7:e01511. doi: 10.1002/ecs2.1511
Meekan, M. G., Bardshaw, C. J. A., Press, M., McLean, C., and Richards, A., et al. (2006). Population size and structure of whale sharks Rhincodon typus at Ningaloo Reef, Western Australia. Mar. Ecol. Prog. Ser. 319, 275–285. doi: 10.3354/meps319275
Meekan, M. G., Fuiman, L. A., Davis, R., Berger, Y., and Thums, M. (2015). Swimming strategy and body plan of the world’s largest fish: implications for foraging efficiency and thermoregulation. Front. Mar. Sci. 2:64. doi: 10.3389/fmars.2015.00064
Meekan, M. G., Wilson, S. G., Halford, A., and Retzel, A. (2001). A comparison of catches of fishes and invertebrates by two light trap designs, in tropical NW Australia. Mar. Biol. 139, 373–381. doi: 10.1007/s002270100577
Montoya, J. P. (2007). “Natural abundance of 15N in marine planktonic ecosystems,” in Stable Isotopes in Ecology and Environmental Science, eds R. Michener, and K. Latjha, (Oxford: Blackwell Publishing Ltd).
Motta, P. J., Maslanka, M., Heuter, R. E., Davis, R. L., de la Parra, R., Mulvany, S. L., et al. (2010). Feeding anatomy, filter-feeder rate, and diet of whale sharks Rhincodon typus during surface ram filter feeding off the Yucatan Peninsula, Mexico. Zoology 113, 199–212. doi: 10.1016/j.zool.2009.12.001
Norman, B. M., Holmberg, J. A., Arzoumanian, Z., Reynolds, S., Wilson, R. P., and Rob, D. (2017). Undersea constellations: the global biology of an endangered marine megavertebrate further informed through citizen science. Bioscience 67, 1029–1043. doi: 10.1093/biosci/bix127
Norman, B. M., Reynolds, S., and Morgan, D. L. (2016). Does the whale shark aggregate along the Western Australian coastline beyond Ningaloo Reef? Pac. Conserv. Biol. 22, 72–80.
Paig-Tran, E. M., Bizzarro, J. J., Strother, J. A., and Summers, A. P. (2011). Bottles and models: predicting the effects of varying swimming speed and morphology on size selectivity and filtering efficiencies in fishes. J. Exp. Biol. 83, 703–718. doi: 10.1242/jeb.048702
Parnell, A., and Jackson, A. (2015). Package ‘siar’: Stable Isotope Analysis in R. R Package Version 4.2.
Post, D. M. (2002). Using stable isotopes to estimate trophic position: models, methods and assumptions. Ecology 83, 703–718. doi: 10.1890/0012-9658(2002)083
Potvin, J., Goldbogen, J. A., and Shadwick, R. E. (2012). Metabolic expenditures of lunge feeding rorquals across scale: implications for the evolution of filter feeding and the limits to maximum body size. PLoS One 7:e44854. doi: 10.1371/journal.pone.0044854
Prebble, C. E. M., Rohner, C. A., Pierce, S. J., Robinson, D. P., Jaidash, M. Y., Bach, S. S., et al. (2018). Limited latitudinal ranging of juvenile whale sharks in the Western Indian Ocean suggests the existence of regional management units. Mar. Ecol. Prog. Ser. 601, 167–183. doi: 10.3354/meps12667
Raes, E. J., Waite, A. M., McInnes, A. S., Olsen, H., Nguyen, H. M., Hardman-Mountford, N., et al. (2014). Changes in latitude and dominant diazotrophic community alter N2 fixation. Mar. Ecol. Prog. Ser. 516, 85–102. doi: 10.3354/meps11009
Ramírez-Macías, D., Quieroz, N., Pierce, S. J., Humphries, N. E., Sims, D. W., and Brunnschwiler, J. M. (2017). Oceanic adults, coastal juveniles: tracking the habitat use of whale sharks off the Pacific coast of Mexico. PeerJ 5:e3271. doi: 10.7717/peerj.3271
Rohner, C. A., Couturier, L. I. E., Richardson, A. J., Pierce, S. J., Prebble, C. E. M., Gibbons, M. J., et al. (2013). Diet of whale sharks Rhincodon typus inferred from stomach content and signature fatty acid analyses. Mar. Ecol. Prog. Ser. 493, 219–235. doi: 10.3354/meps10500
Rousseaux, C. S. G., Lowe, R., Feng, M., Waite, A. M., and Thompson, P. A. (2012). The role of the Leeuwion Current and mixed layer depth on the autumn phytoplankton bloom off Ningaloo Reef, Western Australia. Cont. Shelf Res. 32, 22–35. doi: 10.1016/j.csr.2011.10.010
Rowat, D., Gore, M. A., Baloch, B. B., Islam, Z., Ahmad, E., Ali, Q. M., et al. (2008). New records of neonatal and juvenile whale sharks (Rhincodon typus) from the Indian Ocean. Environ. Biol. Fish 82, 215–219. doi: 10.1007/s10641-007-9280-z
Sleeman, J. C., Meekan, M. G., Wilson, S. G., Polovina, J. J., Stevens, J. D., Boggs, G. S., et al. (2010). To go or not to go with the flow: environmental influences on whale shark movement patterns. J. Exp. Mar. Biol. Ecol. 390, 84–98. doi: 10.1016/j.jembe.2010.05.009
Taylor, J. G. (2007). Ram filter-feeding and nocturnal feeding of whale sharks (Rhincodon typus) at Ningaloo Reef, Western Australia. Fish Res. 84, 65–70. doi: 10.1016/j.fishres.2006.11.014
Trueman, C. N., McGill, R. A. R., and Guyard, P. H. (2005). The effect of growth rate on tissue-diet isotopic spacing in rapidly growing animals. An experimental study with Atlantic salmon (Salmo salar). Rapid Commun. Mass Spectrom. 19, 3239–3247. doi: 10.1002/rcm.2199
Wearmouth, V. J., and Sims, D. (2008). Sexual segregation in marine fish, reptiles, birds and mammals: behavior patterns, mechanisms and conservation implications. Adv. Mar. Biol. 54, 107–170. doi: 10.1016/S0065-2881(08)00002-3
Werth, A. (2000). “Feeding in marine mammals,” in Feeding: Form, Function and Evolution in Tetrapods, ed. K. Swenck (San Diego, CA: Academic Press).
Wetherbee, B. M., and Cortés, E. (2004). “Food consumption and feeding habits,” in Biology of Sharks and Their Relatives, eds J. C. Carrier, J. A. Musick, and M. R. Heithaus, (Boca Raton, FL: CRC Press).
Wilson, S. G., Pauly, T., and Meekan, M. G. (2001). Daytime surface swarming by Pseudeuphausia latifrons (Crustacea, Euphausiacea) off Ningaloo Reef, Western Australia. Bull. Mar. Sci. 68, 157–162.
Wilson, S. G., Polovina, J. J., Stewart, B. S., and Meekan, M. G. (2006). Movements of whale sharks (Rhincodon typus) tagged at Ningaloo Reef, Western Australia. Mar. Biol. 148, 1157–1166. doi: 10.1007/s00227-005-0153-8
Wolf, N., Carleton, S. A., and Martínez del Rio, C. (2009). Ten years of experimental animal isotopic ecology. Func. Ecol. 23, 17–26. doi: 10.1111/j.1469-185X.2008.00064.x
Wyatt, A. S. J., Falter, J. L., Lowe, R. J., Humphries, S., and Waite, A. M. (2012a). Oceanographic forcing of nutrient uptake and release over a fringing coral reef. Limnol. Oceanogr. 57, 401–419. doi: 10.4319/lo.2012.57.2.0401
Wyatt, A. S. J., Wake, A. M., and Humphries, S. (2012b). Stable isotope analysis reveals community-level variation in fish trophodynamics across a fringing coral reef. Coral Reefs 31, 1029–1044. doi: 10.1007/s00338-012-0923-y
Wyatt, A. S. J., Lowe, R. J., Humphries, S., and Waite, A. M. (2010). Particulate nutrient fluxes over a fringing coral reef: relevant scales of phytoplankton production and mechanisms of supply. Mar. Ecol. Progr. Ser. 405, 113–130. doi: 10.3354/meps08508
Wyatt, A. S. J., Matsumoto, R., Chikaraishi, Y., Miyairi, Y., Yokoyama, Y., Sato, K., et al. (2019). Enhancing insights into foraging specialization in the world’s largest fish using a multi-tissue, multi-isotope approach. Ecol. Monogr. 89:e01339. doi: 10.1002/ecm.1339
Keywords: elasmobranch, diet, trophic ecology, eastern Indian Ocean, planktivores, biochemical analysis
Citation: Marcus L, Virtue P, Nichols PD, Ferreira LC, Pethybridge H and Meekan MG (2019) Stable Isotope Analysis of Dermis and the Foraging Behavior of Whale Sharks at Ningaloo Reef, Western Australia. Front. Mar. Sci. 6:546. doi: 10.3389/fmars.2019.00546
Received: 06 March 2019; Accepted: 20 August 2019;
Published: 06 September 2019.
Edited by:
Jeremy Kiszka, Florida International University, United StatesReviewed by:
Elizabeth McHuron, University of California, Santa Cruz, United StatesGail Schofield, Queen Mary University of London, United Kingdom
Copyright © 2019 Marcus, Virtue, Nichols, Ferreira, Pethybridge and Meekan. This is an open-access article distributed under the terms of the Creative Commons Attribution License (CC BY). The use, distribution or reproduction in other forums is permitted, provided the original author(s) and the copyright owner(s) are credited and that the original publication in this journal is cited, in accordance with accepted academic practice. No use, distribution or reproduction is permitted which does not comply with these terms.
*Correspondence: Lara Marcus, bG1hcmN1c3phbW9yYUBnbWFpbC5jb20=