 Ed C. Hathorne
 Martin Frank
 P. M. Mohan
- 1GEOMAR Helmholtz Centre for Ocean Research Kiel, Kiel, Germany
- 2Department of Ocean Studies and Marine Biology, Pondicherry University, Port Blair, India
The Asian summer monsoon affects the lives of billions of people. With the aim of identifying geochemical tracers for the monsoon-related freshwater input from the major rivers draining into the Bay of Bengal (BoB) and the Andaman Sea (AnS), we have analyzed the yttrium and rare earth element (YREE) concentration of surface seawater samples from various locations spanning the Andaman Islands in 2011 to 2013. In some locations, samples have been taken in March, July, and November 2011, thus spanning the seasonal cycle and including different monsoon phases. Generally, the YREE patterns are similar to those reported for offshore samples from the BoB and AnS in January 1997, with seawater-normalized patterns of most samples characterized by middle REE enrichments. An enhancement of these middle REE bulges accompanies large increases in dissolved REE concentrations from streams and sediment-rich areas such as mangrove environments. Conversely, some samples, in particular those taken 1–2 days after heavy rainfall in March 2011, show pronounced REE scavenging accompanied by the preferential removal of dissolved light REEs (LREEs) and by higher Y/Ho ratios. The Nd isotope signature of the remaining dissolved REE phase of these low YREE samples is more radiogenic than local rocks and sediments. The time series at a location away from local input sources show remarkably similar REE patterns and concentrations in March and July. Then in October–November, following the peak in monsoon-induced river discharge, the dissolved REE concentrations increase by almost a factor of two, whereas Nd isotopes become less radiogenic by 1.5 εNd units. These unradiogenic values are found at the same site in the winter dry season of the following year, demonstrating the decoupling of sea surface salinity (SSS) and Nd. The large sub-annual variability of YREE concentrations and Nd isotopes encountered was likely caused by the conversion of YREE from the dissolved (probably colloidal) pool to the labile particulate fraction. The comparison of unfiltered and filtered sample concentrations reveals the existence of a large labile particulate pool in the BoB and AnS that most likely originates from the massive river sediment fluxes and is instrumental in the seasonal changes observed.
Introduction
The rare earth elements (REEs) have been recognized as a means to detect trace metal input from rivers to coastal waters since the pioneering work of Elderfield and colleagues in the 1980s (Hoyle et al., 1984; Goldstein and Jacobsen, 1988b; Sholkovitz and Elderfield, 1988; Elderfield et al., 1990). Examining the relative concentrations of some or all of the 14 naturally occurring REEs and yttrium provides a wealth of information, as fractionation among this chemically coherent group of elements reflects solution speciation, particle exchange processes, source oxidation state, and the preferential incorporation into and subsequent release from different minerals (e.g., Cantrell and Byrne, 1987; Byrne et al., 1991; Moffett, 1994; Bau, 1999; Hannigan and Sholkovitz, 2001; Quinn et al., 2006; see Elderfield, 1988 for a review that still remains insightful and relevant after 30 years). Even more information can be gleaned from the radiogenic isotope composition of the light REE (LREE) neodymium as 143Nd is the alpha decay product of 147Sm and hence the 143Nd/144Nd ratio (expressed relative to the initial bulk Earth composition called CHUR in epsilon units) reflects the type and age of rocks, which impart their signature to rivers and seawater through weathering (e.g., Goldstein and Jacobsen, 1987, 1988a; Bertram and Elderfield, 1993; Frank, 2002; Lacan et al., 2012; van de Flierdt et al., 2016). Elderfield et al. (1990) suggested the relative REE concentrations or “REE pattern” of filtered river water is controlled by two pools: (1) the colloidal pool consisting of REE bound to small particles like Fe oxy-hydroxides or organic matter and (2) the truly dissolved pool in which the REEs are bound to simple inorganic ligands like carbonate. The relative proportion of these pools is a function of river chemistry including organic and inorganic ligand concentrations and pH (Tang and Johannesson, 2010). The importance of the colloidal pool is most obvious when river water first meets salty water in the estuary and salt-induced coagulation removes most, if not all, of the REEs contained in the colloidal pool (e.g., Sholkovitz and Szymczak, 2000). This results in a range of estuarine Nd removal from 97 to 40% (Rousseau et al., 2015 and the references therein; Adebayo et al., 2018) and exerts a fundamental control on the REE signal of river input and the REE budget of the oceans. Experiments with filtered river and seawater suggest that much of the variability in estuarine removal is related to the character of the colloid fraction REE. Organic matter-bound REE behaves nearly conservatively, whereas waters rich in inorganic colloids quickly lose their REE load as salinity increases (Merschel et al., 2017a).
The South Asian monsoon (SAM) affects the livelihoods of more than a billion people, providing vital water resources on the one hand and devastating floods and landslides on the other (Krishna Kumar et al., 2004; Gadgil and Gadgil, 2006; Turner and Annamalai, 2012; Duncombe, 2018). Four of Earth’s great rivers—the Ganges (Ganga) and Brahmaputra (G-B), Irrawaddy (or Ayeyarwady), and Salween (I-S)—discharge more than 1000 km3/year of freshwater (Dai et al., 2009) into the Bay of Bengal (BoB) and the Andaman Sea (AnS) (Figure 1). These monsoon-fed rivers also deliver some of the highest sediment loads globally (Milliman and Syvitski, 1992), which has built the Bengal and Nicobar fan, the largest submarine fan system on Earth (Curray et al., 2002). The discharge of these monsoonal rivers is highly seasonal following spring snow melt and most importantly summer monsoon precipitation (Shaman et al., 2005; Jian et al., 2009). Large sub-seasonal and inter-annual variability of G-B discharge is tightly linked to monsoon precipitation peaking from June to October (Jian et al., 2009), and these variations impact BoB sea surface salinity (SSS). As such, the BoB and AnS are characterized by a thin (<20 m) low-salinity mixed layer persisting all year round, which is maintained by a roughly equal mixture of river discharge and direct monsoon precipitation over the ocean and often displays two steps of increasing salinity with depth (Sengupta et al., 2006). The halocline below this fresh layer is normally shallower than the thermocline, and the layer between them is referred to as the barrier layer (e.g., Girishkumar et al., 2011). This barrier layer has been implicated in cyclone intensification (Sengupta et al., 2006), and the thickness of the fresh mixed layer and barrier layer is driven by seasonally reversing winds and ocean currents with mesoscale eddies facilitating vertical mixing (Durand et al., 2011; Girishkumar et al., 2011, 2013; Akhil et al., 2014, 2016). Recent observations of SSS variability suggest that this feature is dominated by the freshwater flux and not surface circulation (Chaitanya et al., 2015), although weakened currents resulting from Indian Ocean dipole modes may play a role in trapping freshwater in the BoB (Pant et al., 2015). Recent mooring observations in the northern BoB between the G-B and I river mouths demonstrate that SSS can drop by 4 psu units in 5 days as river discharge fronts pass (Sengupta et al., 2016). Despite recent advances in observational coverage of the region (e.g., Girishkumar et al., 2011), the hydrographic variability in areas like the AnS remains poorly understood (Chatterjee et al., 2012) and undersampled.
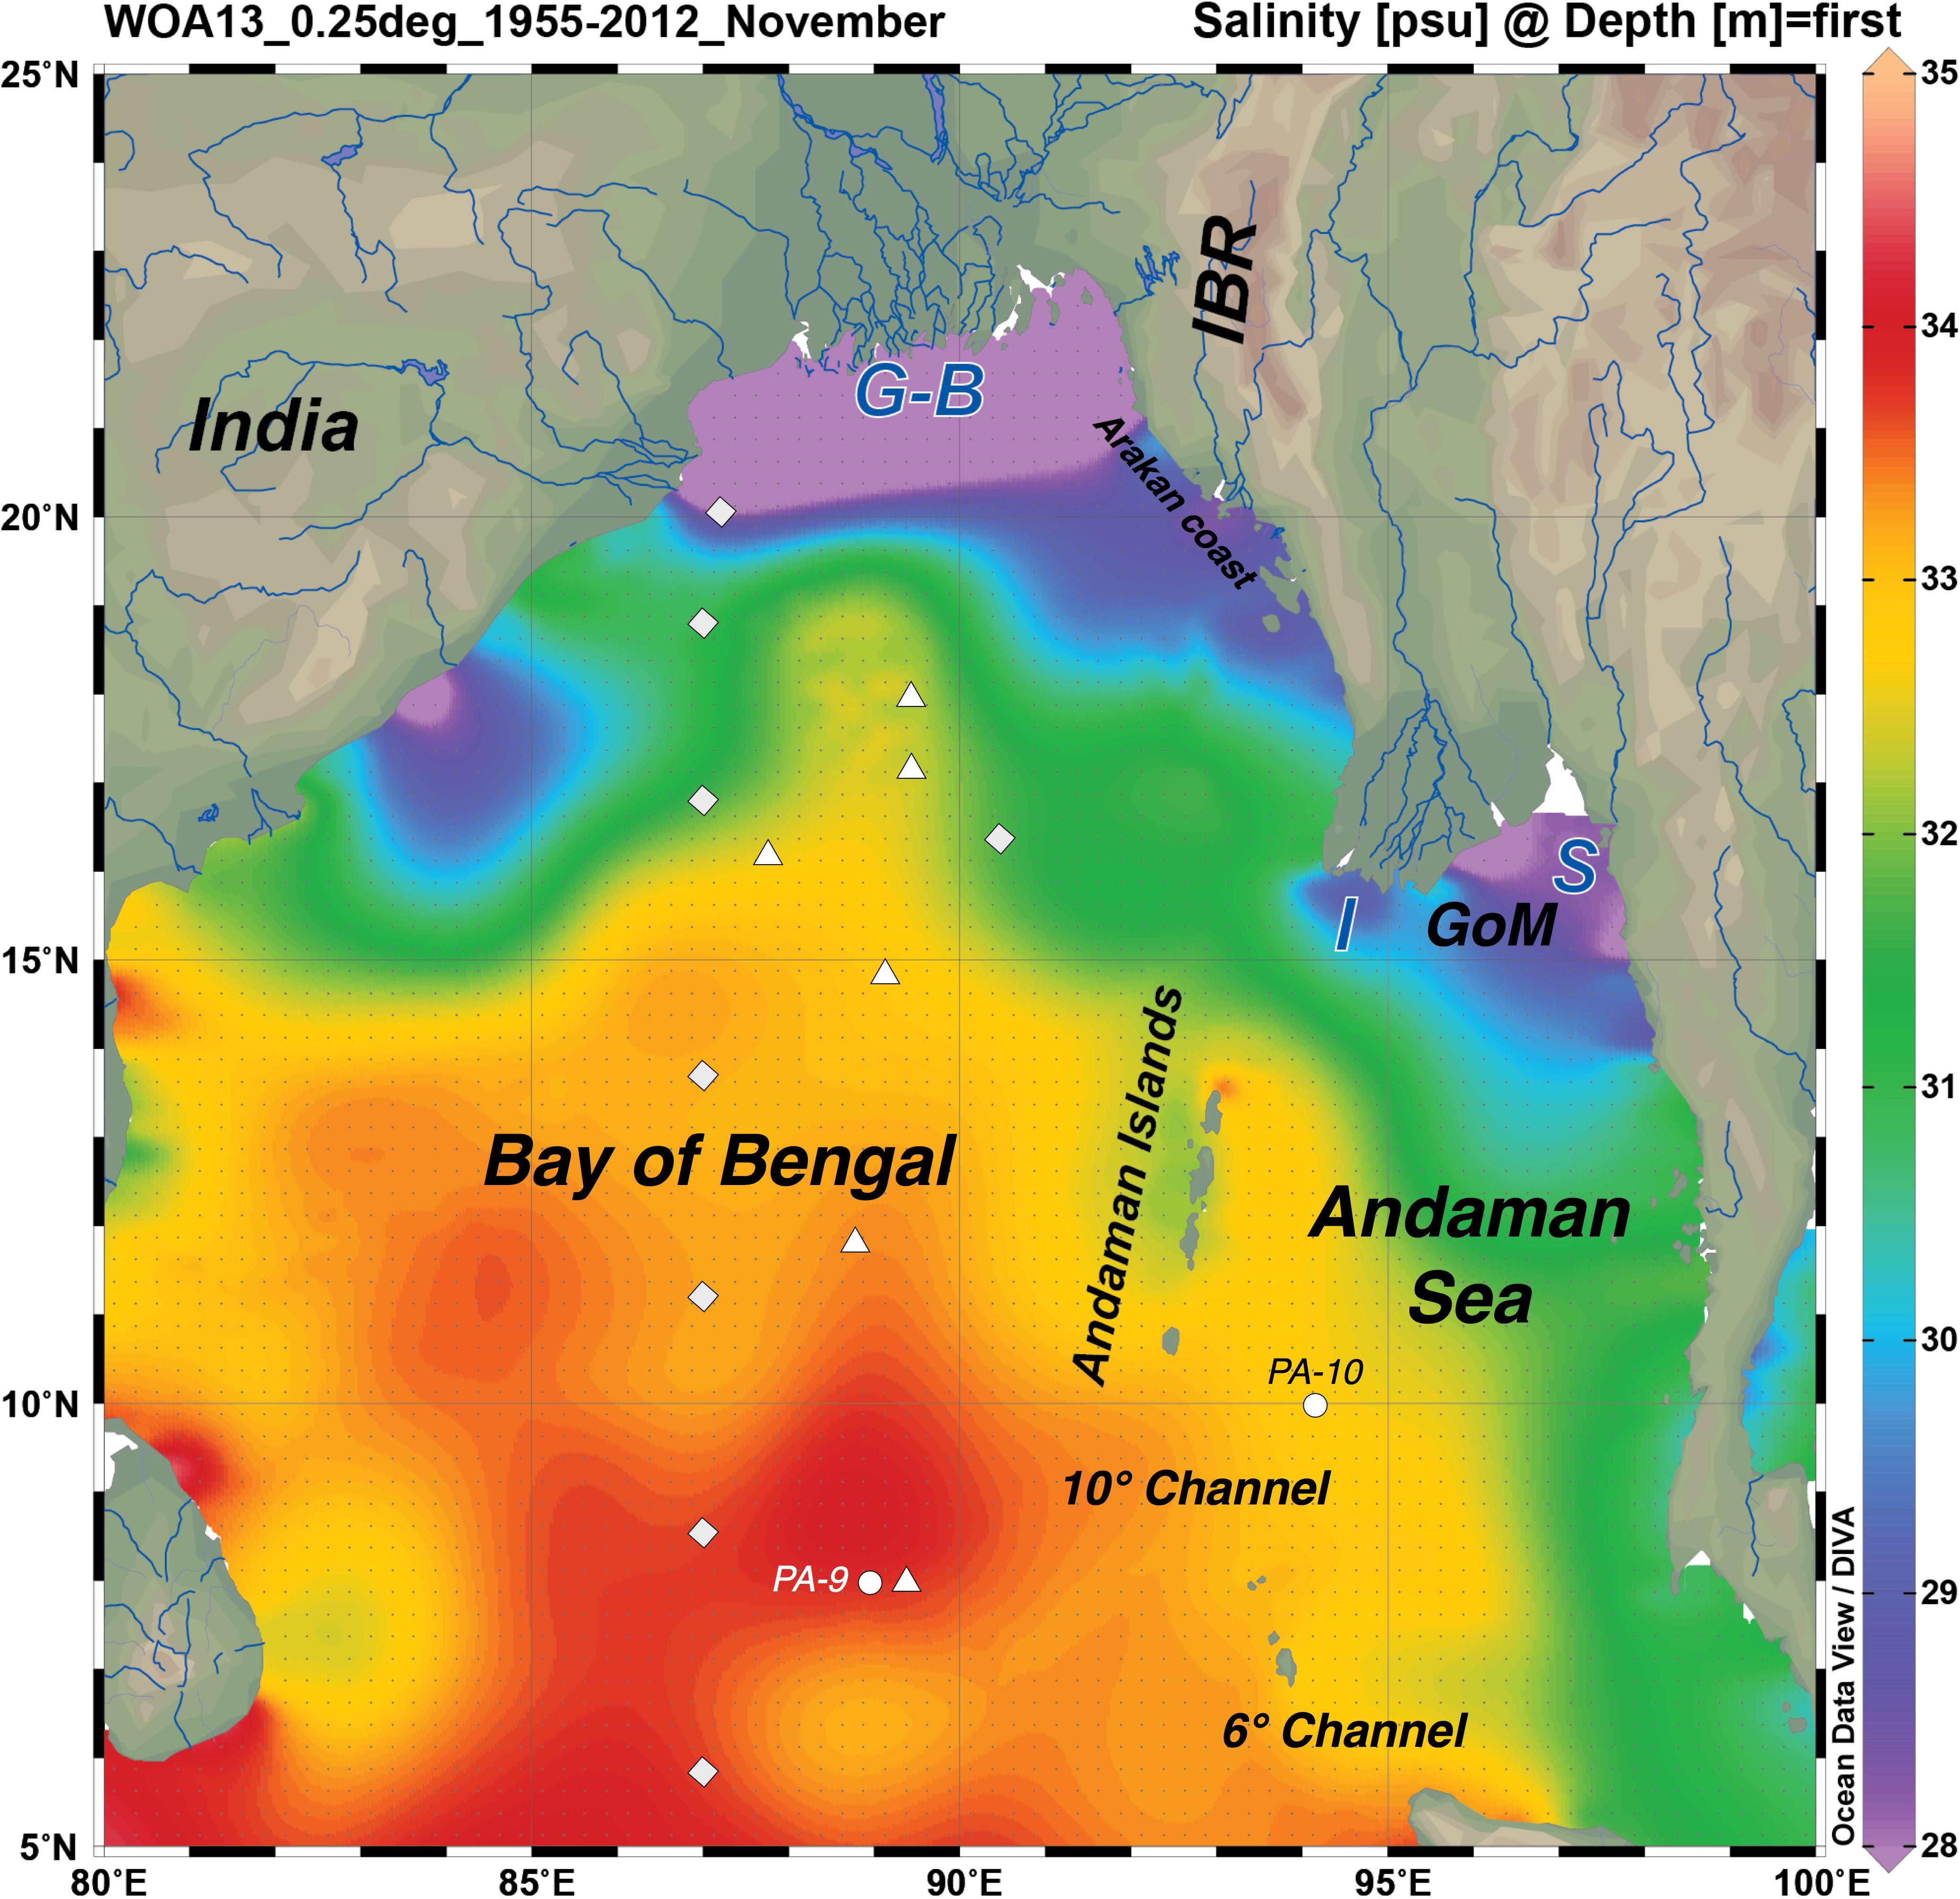
Figure 1. Regional map of the Bay of Bengal (BoB) and Andaman Sea (AnS) showing the mouths of the big four rivers: Ganga and Brahmaputra (G-B), Irrawaddy or Ayeyarwady (I) and Salween (S), the Andaman Islands, and the WOA2013 sea surface salinity climatology for November (1955–2012). This figure was made using Ocean Data View (Schlitzer, R., Ocean Data View, http://odv.awi.de, 2016). Other features of interest are marked: Indo-Burmese Ranges (IBR), Gulf of Martaban (GoM), and the two deep channels connecting the BoB and the AnS. The sampling stations from the other studies of seawater Nd isotopes and rare earth elements (REEs) in the region are shown; labeled circles for Amakawa et al. (2000) and Nozaki and Alibo (2003), square rhombuses for Singh et al. (2012), and triangles for Yu et al. (2017a;b).
Amakawa et al. (2000) first reported elevated REE concentrations of BoB and AnS surface waters compared with the rest of the Indian Ocean, with a distinctive REE pattern and unradiogenic Nd isotopes most likely reflecting the weathering input from South Asia. These elevated REE concentrations with a globally distinctive broad middle REE enrichment and similar normalized La and Lu values were found to extend to deeper BoB and AnS waters (Nozaki and Alibo, 2003). This most likely originates from the inputs of the great rivers, but the dissolved river flux (estimated as very few dissolved river REE data exist for the region) is a factor of 10 too low, leading Nozaki and Alibo (2003) to suggest that the supply of excess BoB REEs could be accounted for by the dissolution of no more than 0.3% of the sediments brought by the rivers. More recent studies focusing on Nd isotopes and concentrations have revealed a substantial excess Nd concentration throughout the BoB, which has a calculated Nd isotope composition similar to that of modern G-B river sediments and suggests release from Bengal Fan sediments (Singh et al., 2012). The resampling of similar locations a few years later found significantly lower Nd concentrations and more radiogenic Nd isotope signatures leading to the suggestion that the Nd isotope composition of BoB seawater varies seasonally and inter-annually with river sediment discharge (Yu et al., 2017a). Furthermore, these authors presented Y and REE data for their BoB samples, which suggested that the freshwater input into the BoB can be traced with YREE ratios (Yu et al., 2017b). Such variability is hard to reconcile with the Nd oceanic residence time in the order of centuries (e.g., Tachikawa et al., 1999) and the calculated YREE residence times for BoB surface water (Yu et al., 2017b). Despite these clear signals, it was not possible to conclude if the variability observed between these studies was truly seasonal/inter-annual or resulted from spatial heterogeneity (Yu et al., 2017a). If these potential proxies for river discharge into the BoB and AnS are to be used for filling the large data gaps in this region, the seasonal fluctuation of the REE concentrations and signatures needs to be verified with a stationary time series, and suitable archives for past REE variations need to be identified.
Despite a compelling consensus that the vast majority of REE associated with planktonic foraminifera shells is acquired at the sea floor from bottom waters or porewaters during early diagenesis (Roberts et al., 2010, 2012; Kraft et al., 2013; Tachikawa et al., 2013; Osborne et al., 2017; Skinner et al., 2019), some workers have used the Nd/Ca of planktonic foraminifera shells to infer past changes in monsoon-induced runoff (Liu et al., 2015; Nilsson-Kerr et al., 2019). In contrast, the annual density bands of massive coral skeletons are a promising recorder of mixed-layer seawater REE concentrations (e.g., Wyndham et al., 2004; Saha et al., 2016), but the processes controlling the YREE concentrations and Nd isotope signatures of seawater within and around the coral reef system need to be understood before such proxies can be reliably applied in the past. With this goal in mind, we have systematically sampled surface seawater from around coral reefs of the Andaman Islands, which form the geographic boundary between the BoB and AnS. These data demonstrate that seawater REE concentrations in the BoB do vary seasonally with the monsoon-induced river water discharge. However, we also identify many local processes that can modify the YREE and Nd isotope signal on short time and length scales, meaning coral REE signatures from such settings must be interpreted with caution.
Materials and Methods
Study Area
The Andaman Islands are situated some 600 km west of Thailand and 1300 km east of mainland India and extend from around 10°N to 14°N (Figure 1). Formed by the uplift of the accretionary prism of the Sunda Trench, the Andaman Islands are composed of sedimentary rocks of late Cretaceous to Miocene age sitting on top of ophiolitic volcanics and basalts (Allen et al., 2008a; Garzanti et al., 2013). Barren Island to the east of the other islands is the only active volcano representing the active arc. Arc materials are present throughout much of the turbiditic mudrocks and sandstones of the Andaman Flysch and Mithakhari Group (Allen et al., 2008a), and it is these Paleogene rocks that are most exposed on the main three islands of South, Middle, and North Andaman (Garzanti et al., 2013) (Figure 2). These sedimentary rocks represent the erosional product of the Himalayan orogeny delivered mostly by the Irrawaddy river (Garzanti et al., 2013), and sediments with similar composition and zircon ages extend from the Indo-Burman Ranges (IBR) in the north (Allen et al., 2008b) to the Nicobar fan in the south (McNeill et al., 2017). On the smaller surrounding islands, where coral reefs are abundant, are exposures of the Neogene Archipelago group, which contain sandstones, chalk, and limestones (Allen et al., 2008a) deposited on the slope (Pal et al., 2005). The summer monsoon rains usually begin in May on the Andaman Islands, earlier than in mainland India (Fasullo and Webster, 2003), and the high-precipitation season is normally at full strength by early July (Figure 3). Being sparsely populated, with most development centered around the capital Port Blair, the Andaman Islands are mostly undisturbed and covered by dense rain forest that extends to the beach and the coral reefs. In low-lying areas, mangrove forests and glades are found next to the reefs. As such, they present an increasingly rare opportunity to study the geochemistry of virtually undisturbed reef ecosystems. Unfortunately, these islands are not immune from global change and substantial coral bleaching (Sarkar and Ghosh, 2013).
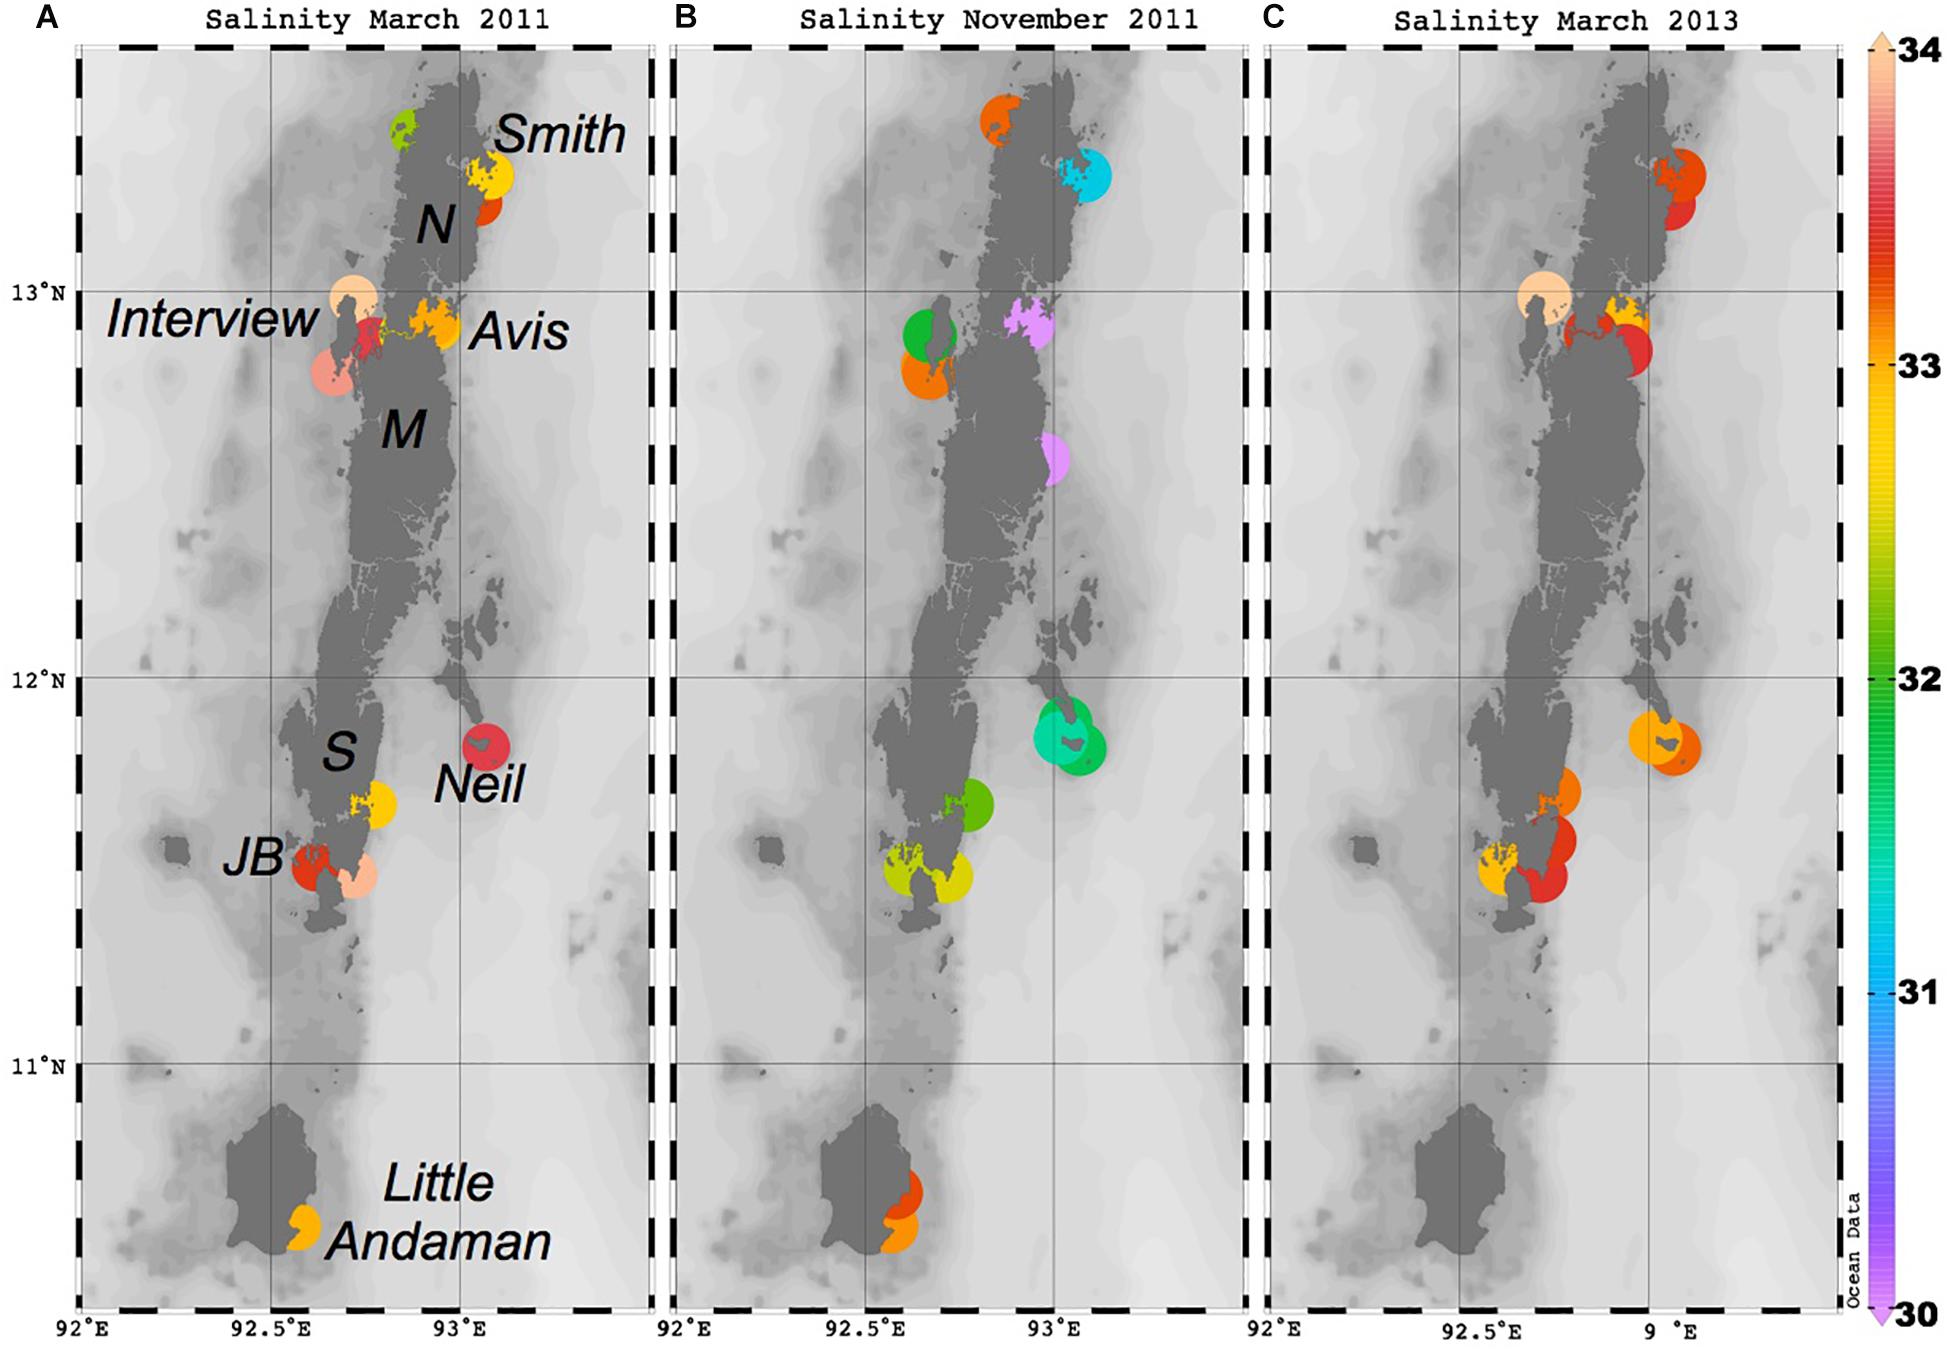
Figure 2. Maps of sample salinity during sampling in (A) March 2011, (B) November 2011, and (C) March 2013. The locations of islands mentioned throughout the text are shown. N = North Andaman, M = Middle Andaman, S = South Andaman, JB = Jolly Buoy. This figure was made using Ocean Data View (Schlitzer, R., Ocean Data View, http://odv.awi.de, 2016).
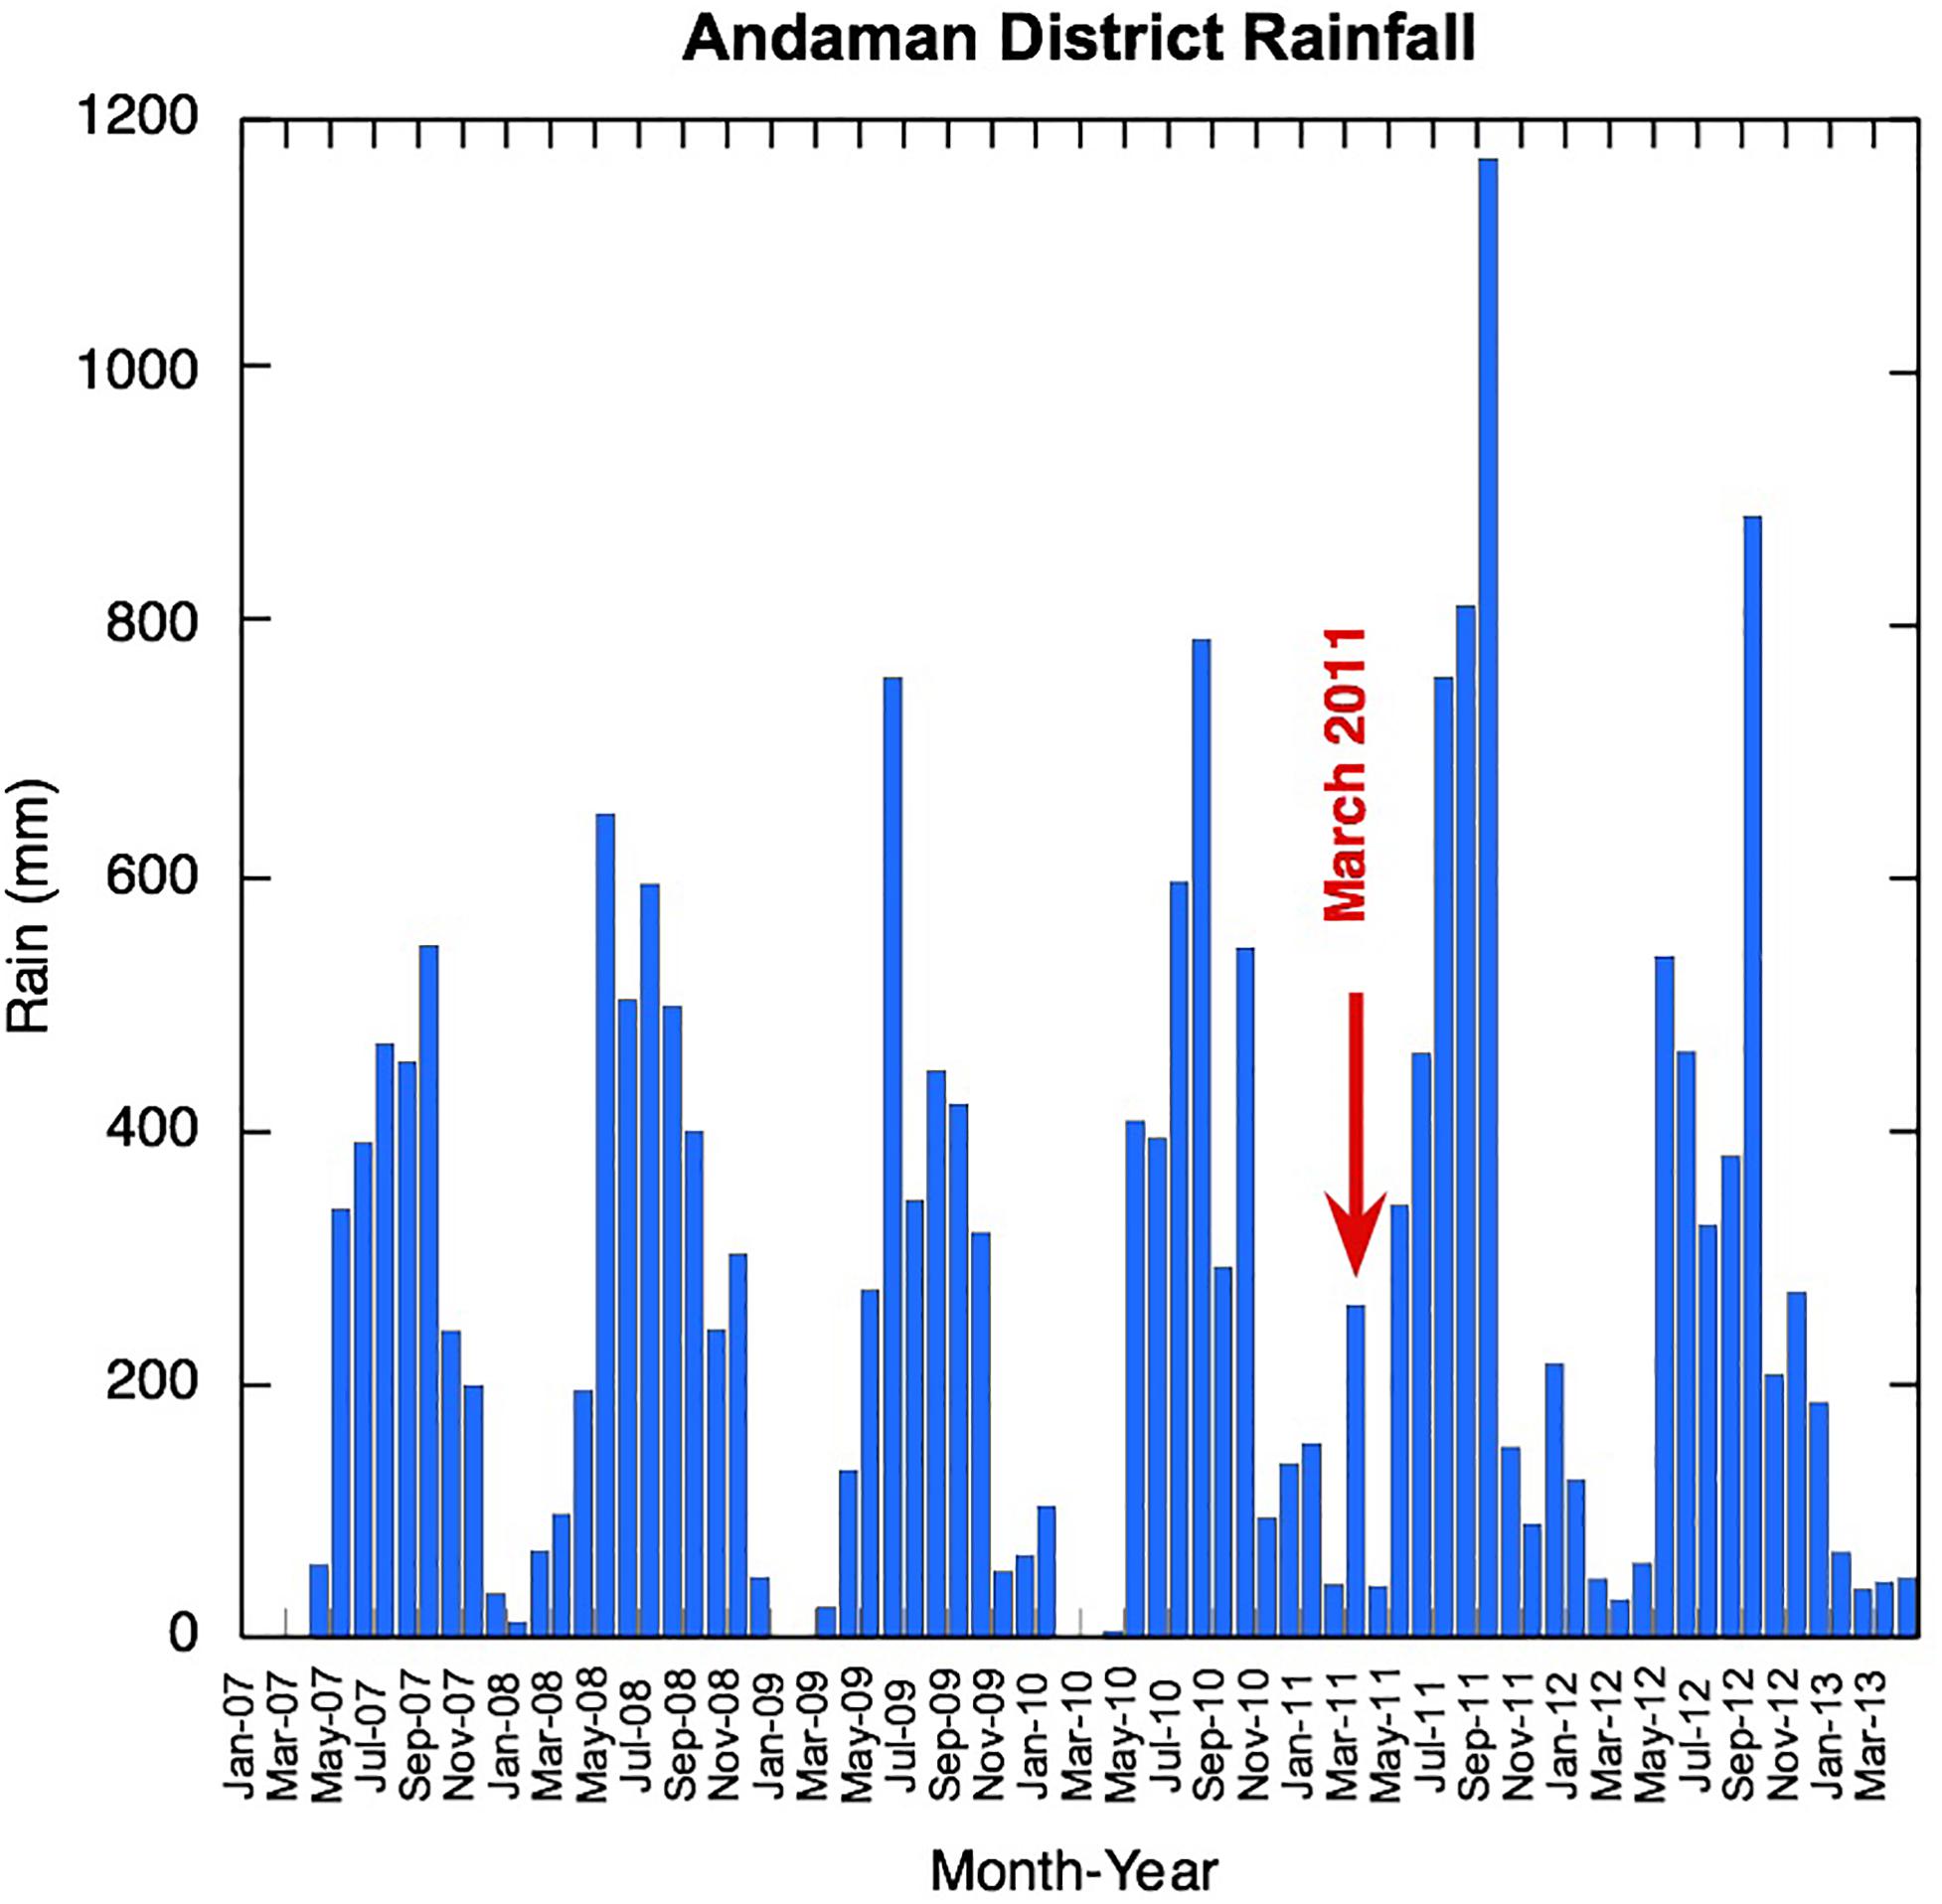
Figure 3. Andaman Island district monthly rainfall before and during sampling (data from India Meteorological Department Hydromet division reports).
Regrettably, the oceanography of the AnS is very poorly studied, and even today, relatively few Argo floats make it there to improve this dearth of knowledge (e.g., Thadathil et al., 2007). Even less is known about the oceanography around the Andaman Islands. The water chemistry around the islands is likely driven by the monsoon rains, river discharge, and seasonally reversing ocean currents (Chatterjee et al., 2017). The AnS is open to surface water exchange with the BoB at the Prepairs Channel between North Andaman Island and the Ayeyarwady (Irrawaddy) delta in Myanmar, whereas the 10 Degree Channel between Little Andaman and Great Nicobar Islands and the Great (or 6 Degree) Channel between the Nicobar Islands and Sumatra provide deeper connections. Generally, it is thought that the surface circulation in the AnS is cyclonic during the SW monsoon and the reverse during the northeast (NE) monsoon (Varkey et al., 1996), but more modern analyses suggest that the situation is more complex with a mean flow toward the southeast (SE) in summer and toward the southwest (SW) in winter (Rizal et al., 2012). Forced by both remote equatorial Wyrtki jets and local winds, strong surface currents probably form along the Islands during the monsoon transitions in spring and autumn (Chatterjee et al., 2017). Much of the large monsoonal sediment flux from the nearby Ayeyarwady (Irrawaddy) and Salween rivers is trapped in the Gulf of Martaban (Ramaswamy et al., 2004), but the surface waters of the reefs become noticeably turbid during the summer monsoon season. The study of recent sediments from the NE BoB and AnS indicates that the small Arakan coast rivers supply a disproportionally large fraction of terrigenous sediments with radiogenic Nd isotope signatures to the region (Colin et al., 1999; Damodararao et al., 2016).
Sample Collection and Processing
Surface samples were collected in PE bottles while swimming or from the side of small wooden boats (no deeper than an arm’s length) from open ocean locations with extensive coral reefs and more inshore locations (see Supplementary Figure S1 for an example). In a few instances, a small Niskin bottle on a rope was employed. Freshwater samples were collected by holding the PE bottle in the stream or waterfall. All samples were filtered within a few hours at 0.22 or 0.45 μm (cellulose acetate membranes) using the vacuum produced by a water jet and a Nalgene PC 42-mm-diameter filter holding device. This was rinsed with > 18.2 MΩ water between samples, and the first 500 ml of filtered sample was discarded. During the first sampling campaign, an unfiltered sample aliquot was also kept for some selected samples. In all subsequent sampling, an unfiltered sample aliquot was kept for all samples, with the exception of the large volume samples, which were limited in number by logistical reasons. The large volume samples for Nd isotope analyses were obtained by filling two 20-l collapsible cubic containers as much as possible while snorkeling or from the side of a wooden boat. These were then filtered directly after collection using a hand-operated peristaltic pump and a 142-mm-diameter filter holder with 0.45-μm cellulose nitrate filter membranes into an acid-cleaned 20-l collapsible cubic container. The cubic containers used for sample collection were rinsed with 10% HCl (analytical grade) and > 18.2 MΩ water (Milli-Q) before the next use. During collection, the cubic containers were first rinsed with sample before the sample was taken. Particularly, sediment-rich samples required the use of multiple membranes. Filtered and unfiltered samples (125 ml) were acidified to pH 2 in the field using distilled HCl prepared in the clean labs at GEOMAR, Germany. A small aliquot of filtered sample was filled into a 1.4-ml glass vial with no head space and sealed with a septum lid and ParafilmTM for stable isotope and chloride analyses.
Salinity was measured in the field to 0.1 psu during sample collection and after filtering using a handheld conductivity sensor made for domestic aquarium purposes. This was cross-calibrated with a WTW conductivity sensor and gravimetrically prepared NaCl solutions before going into the field.
Jolly Buoy Island was sampled in 2011, in February and March 2012, and again in March 2013. A few key locations distributed along the islands have been resampled in March 2013.
Rainwater samples were obtained in January 2015 from the deck of the JOIDES Resolution drill ship while operating near Little Andaman Island. Rain was collected in an acid-cleaned PE beaker and filtered through a 0.2-μm polysulfone disk filter with an acid-cleaned syringe directly after collection. The filtered rain samples were acidified to 1% by volume with Seastar grade HNO3.
In the laboratory at Pondicherry University in Port Blair, FeCl solution (purified in the GEOMAR laboratory) was added to the 20-l volume samples for Nd isotope analysis and allowed to equilibrate for 24–48 h. After equilibration, the pH was raised to 7.5 to 8 by the stepwise addition of Merck Suprapur grade (imported by Sigma–Aldrich, India) ammonia solution. The resulting FeOH precipitate was allowed to settle for 24–48 h before the excess seawater was siphoned off, and only the FeOH precipitate was taken to Germany. Back in the laboratory at GEOMAR, the FeOH precipitate was further concentrated and dissolved, and excess Fe was removed by an ether back-extraction before Nd was purified using routine techniques in our laboratory (Stichel et al., 2012), producing yields of approximately 70%.
Analytical Methods
Salinity and δ18O–δ2H
Samples were analyzed for δ18O and δ2H by isotope ratio infrared spectroscopy (L 1102-i WS-CRDS, Picarro Inc., Santa Clara, CA, United States) at the Friedrich-Alexander University Erlangen-Nürnberg, Germany. All values are reported in the standard δ-notation (‰) vs. Vienna Standard Mean Ocean Water (VSMOW), and external reproducibility based on repeated analyses of a control sample was better than 0.1 and 0.5‰ (± 1 sigma) for δ18O and δ2H, respectively. A detailed description of the analytical procedure used is given in van Geldern and Barth (2012). Following stable isotope analyses, the chloride concentration of the samples was determined by titration with silver nitrate using a METROHM auto-titrator. IAPSO standard seawater (Cl = 19.376 g/kg or as specified on the bottle; the sum of chloride and bromide is 559 mM) was used to calibrate the results, and the precision is estimated to be 0.3% based on repeated measurements of IAPSO.
Yttrium and REE
Analysis of the YREE concentration of most of the samples was performed using a seaFAST online preconcentration (OP) system coupled to an Agilent 7500ce inductively coupled plasma mass spectrometer (ICP-MS) as described in Hathorne et al. (2012). This method was part of the GEOTRACES intercalibration exercise (van de Flierdt et al., 2012) and has been demonstrated to produce accurate Nd concentrations, compared with isotope dilution measurements of the same samples on numerous occasions (Hathorne et al., 2012; Grasse et al., 2017; Laukert et al., 2017). The long-term average value obtained for the Bermuda Atlantic Time-Series (BATS) 15-m sample during the course of this study is presented in Supplementary Table S1.
YREE data obtained for the March 2013 samples utilized a newer syringe pump type seaFAST instrument (SV400) coupled with a Thermo Fisher Element XR sector field (SF)-ICP-MS. These measurements employed a 4-ml loop, and the instrument was run in low resolution and scan speed optimization mode to obtain time-resolved data. Such time-resolved analysis has been found to improve precision for such low-volume analyses (Osborne et al., 2015). Calibration curves for these measurements were obtained by standard additions of a mixed YREE solution with a seawater-like pattern to a large volume surface seawater sample from the South Atlantic. The average values obtained for the 15-m BATS reference seawater during these analyses, is presented in Supplementary Table S1.
Unfiltered samples were first centrifuged at 3500 r/min (Eppendorf 5810 max 2900 × g) for 30 min before the supernatant was transferred to a fresh tube for analysis. The filtered sample concentrations are operationally defined as “dissolved,” while the unfiltered samples represent both the dissolved and weak HCl soluble pool referred to here as “easily exchangeable” or labile.
Procedural blanks taken in the field (n = 5) by filtering > 18.2 MΩ water acidifying and storing with the samples were also analyzed by OP-ICP-MS with the samples. Repeated analyses of these blanks in the most recent analytical session reveal that they are < 0.5 pmol/kg for the LREE to below detection limits (e.g., <0.03 pmol/kg of Lu) for the heavy REE (HREE). For the LREE, this is 20% for the anomalously low-concentration samples, but only in the order of 1% for LREE in the vast majority of samples and is also negligible for the mid-REE (MREE) and HREE (including Y).
Neodymium isotope measurements were performed with either a Nu instrument MC-ICP-MS at GEOMAR or a Thermo Fisher Neptune Plus MC-ICP-MS at the Institute for Chemistry and Biology of the Marine Environment (ICBM), University of Oldenburg, Germany. Solutions with concentrations from 5 ppb and higher were measured, and values were normalized to the accepted 143Nd/144Nd of the JNdi-1 isotope standard of 0.512115 (Tanaka et al., 2000). Based on repeated measurements of the JNdi-1 and an in-house Nd standard “Merck” from the ICBM, the 2-s external precision of the measurements expressed as εNd is 0.4 units. Repeated measurements of one sample with a high Nd concentration (AN12) on both instruments gave a comparable precision of 0.4 epsilon units.
Results
The field measured salinities and those determined later by silver nitrate titration generally agree very well (slope of 0.98 with a zero intercept R2 = 0.94).
Freshwater samples (apart from the rain) plot on the global δ18O vs. δ2H meteoric water line, and the other samples generally form a mixing line between the seawater and freshwater (Supplementary Figure S2). One sample deviated from this relationship, suggesting that evaporation may have occurred since collection. The δ18O, δ2H, and salinity data for this sample were excluded and are not reported or discussed.
Geographical Variability
Salinity varies widely, and this patchiness is also clear in the high resolution World Ocean Atlas climatology shown here for November (Figure 1) and in recently acquired field data (Kiran Kumar et al., 2018). Away from river or stream mouths, the salinity ranged from 34 to 31 over our sampling period, with the freshest values found on the AnS side of the Islands during November 2011 (Figure 2). Some of the variability of salinity observed across the islands is also likely to be temporal, as these locations were sampled over a few weeks during each sampling campaign. March 2011 was particularly wet with anomalously high rainfall on the Andaman Islands (Figure 3). NE Interview Island showed the saltiest waters in both March 2011 and 2013 (Figure 2). This suggests that either surface circulation brought more saline waters to this northerly exposed location or there was supply from a local source of saltier water, perhaps a very shallow lagoon nearby formed by uplifted coral reefs.
The concentration of REEs in the filtered seawater samples varied greatly with Nd ranging from 1.6 to 120 pmol/kg, whereas Yb concentrations varied from 2.15 to 20.5 pmol/kg (shown as shale-normalized values in Figure 4 and Supplementary Table S1). The lowest concentrations were encountered after a rain event in March 2011 (Figure 3) and consistently at one beach location on Neil (Shaheed Dweep) Island in both 2011 and 2013 (Figure 4, samples AN48, AN54, and AN124). The highest concentrations are from locations inland up tidal creeks (Figure 4, samples AN13 and AN140) or next to small river mouths where the sediment loading was high (Figure 4, samples AN88 and AN146). Shale-normalized patterns (Figure 4) broadly resemble seawater from other locations including an HREE enrichment and relatively depleted Ce concentrations (negative Ce anomaly), but in some samples, a MREE enrichment is clearly evident. There is no simple relationship between salinity and YREE concentrations except for the few filtered samples with salinities less than 31.5, which display a clear negative relationship, especially for the HREE. However, the vast majority of samples with salinities > 31.5 have higher YREE concentrations.
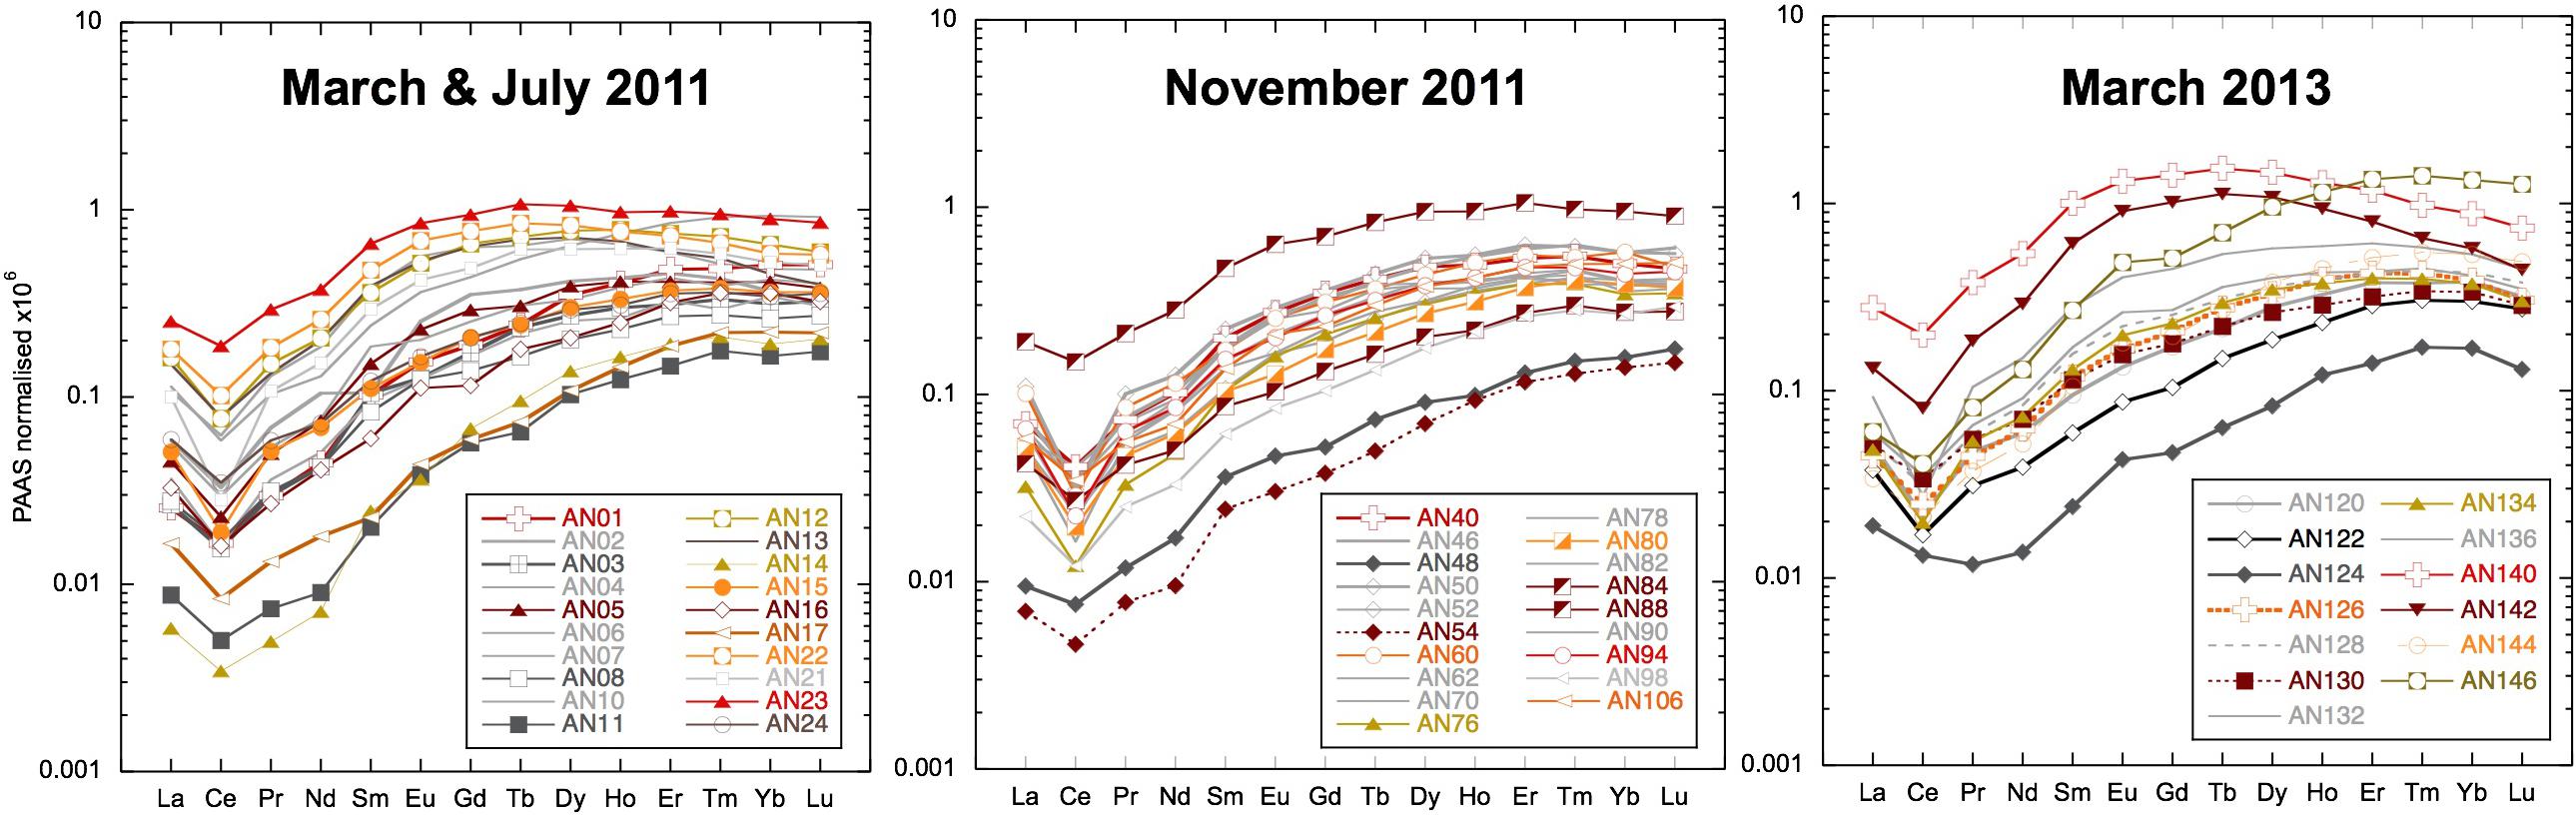
Figure 4. Filtered seawater samples shale-normalized to Post-Archean Average Australian Sedimentary rocks (PAAS) (Nance and Taylor, 1976). Samples from the main locations use the same symbols: squares for Smith Island, vertical triangles for Avis Island, square rhombuses for Niel (Shaheed Dweep) Island, and horizontal triangles for Little Andaman Island.
Filtered freshwater concentrations range from 26 to 277 pmol/kg of Nd and 3.3 to 25 pmol/kg of Yb. Concentrations in the filtered rainwaters are low but substantial, with Nd ranging from 1.4 to 4.5 pmol/kg, whereas Yb concentrations range from 0.2 to 0.7 pmol/kg. Shale-normalized patterns for the freshwaters display either strong MREE enrichments or more seawater-like patterns with enhanced HREE concentrations (Figure 5).
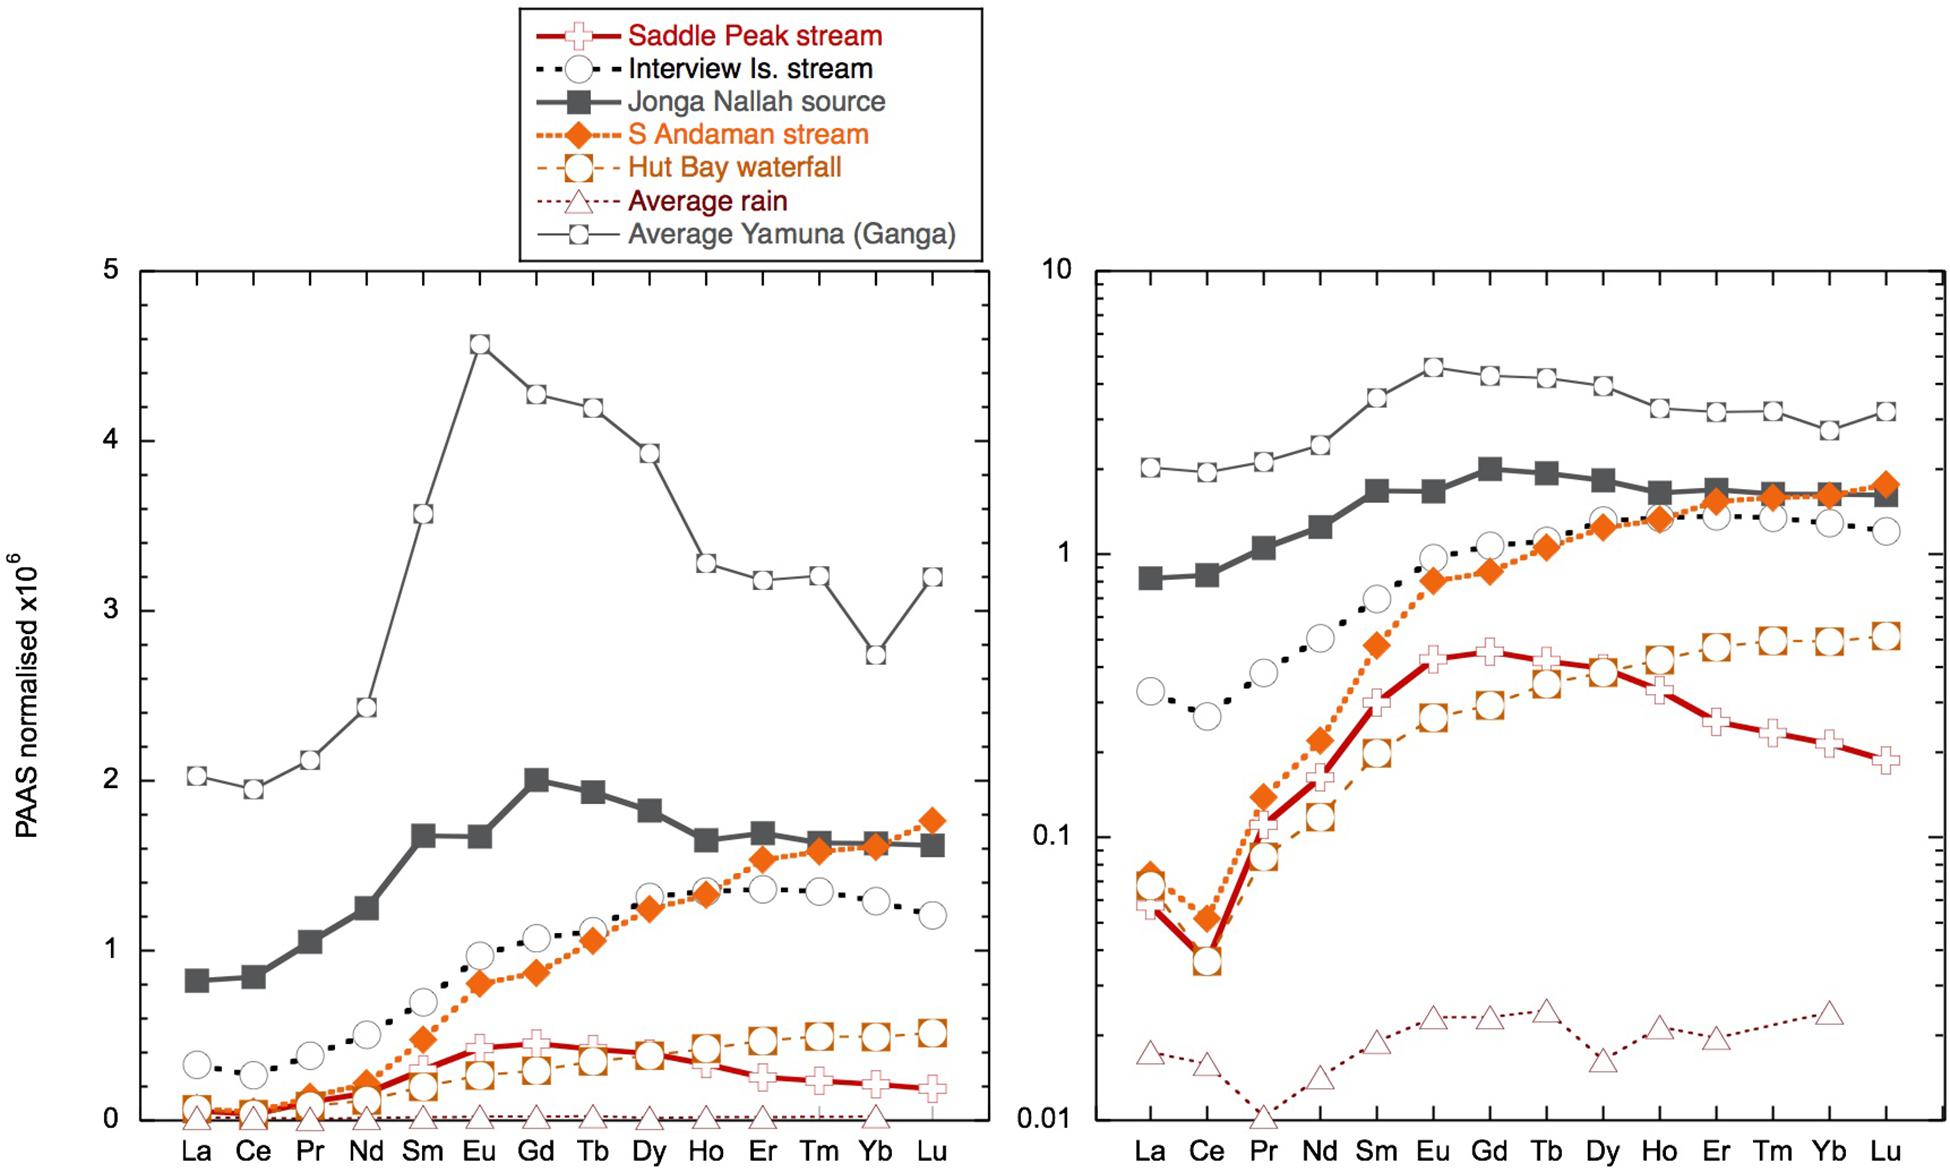
Figure 5. Shale (PAAS; Nance and Taylor, 1976) normalized rare earth element (REE) patterns for freshwater samples including the Ganges tributary Yamuna from Rengarajan and Sarin (2004) and the average of the three rain samples. The two panels are the same data but plotted on log and linear scales. For the rain samples, Tm and Lu were below detection limits.
The concentrations encountered in the unfiltered samples represent the particulate YREE that is leachable in 0.1% HCl over months to years, as well as the dissolved YREE. This ranges from values similar to filtered samples to extremes of 780 pmol/kg of Nd and 141 pmol/kg of Yb. For example, samples from Jolly Buoy Island exhibit very little difference (unfiltered/filtered near 1), whereas some of the stream and river mouth samples have the highest easily exchangeable YREE concentrations (unfiltered/filtered > 10).
Temporal Variability
At three readily accessible locations, Smith Island, Avis Island, and Jolly Buoy Island, we were able to obtain multi-season and in some cases multi-year time series. Both Smith and Avis island time series reveal anomalously low YREE concentrations 1–2 days after a sustained 2-day rain event in March 2011 (Figure 6), whereas the salinity was only significantly lower at Avis island in July and both Avis and Smith islands in November. The Avis Island time series exhibits a large range of concentrations similar those encountered in all other samples, but at one single location, where very high concentrations (83 pmol/kg of Nd) occurred during the monsoon in July 2011 (Figure 6). At Jolly Buoy Island, the range in concentrations is smaller, and the maximum concentrations occurred later in the year in November (Figure 7). Between March and November, the salinity at Jolly Buoy Island decreased by 1 psu, and the Nd (YREE) concentration peaks but decreased again whereas salinity remained low (Figure 8). A similar relationship between Nd concentrations and salinity in the inter-annual samples is not observed.
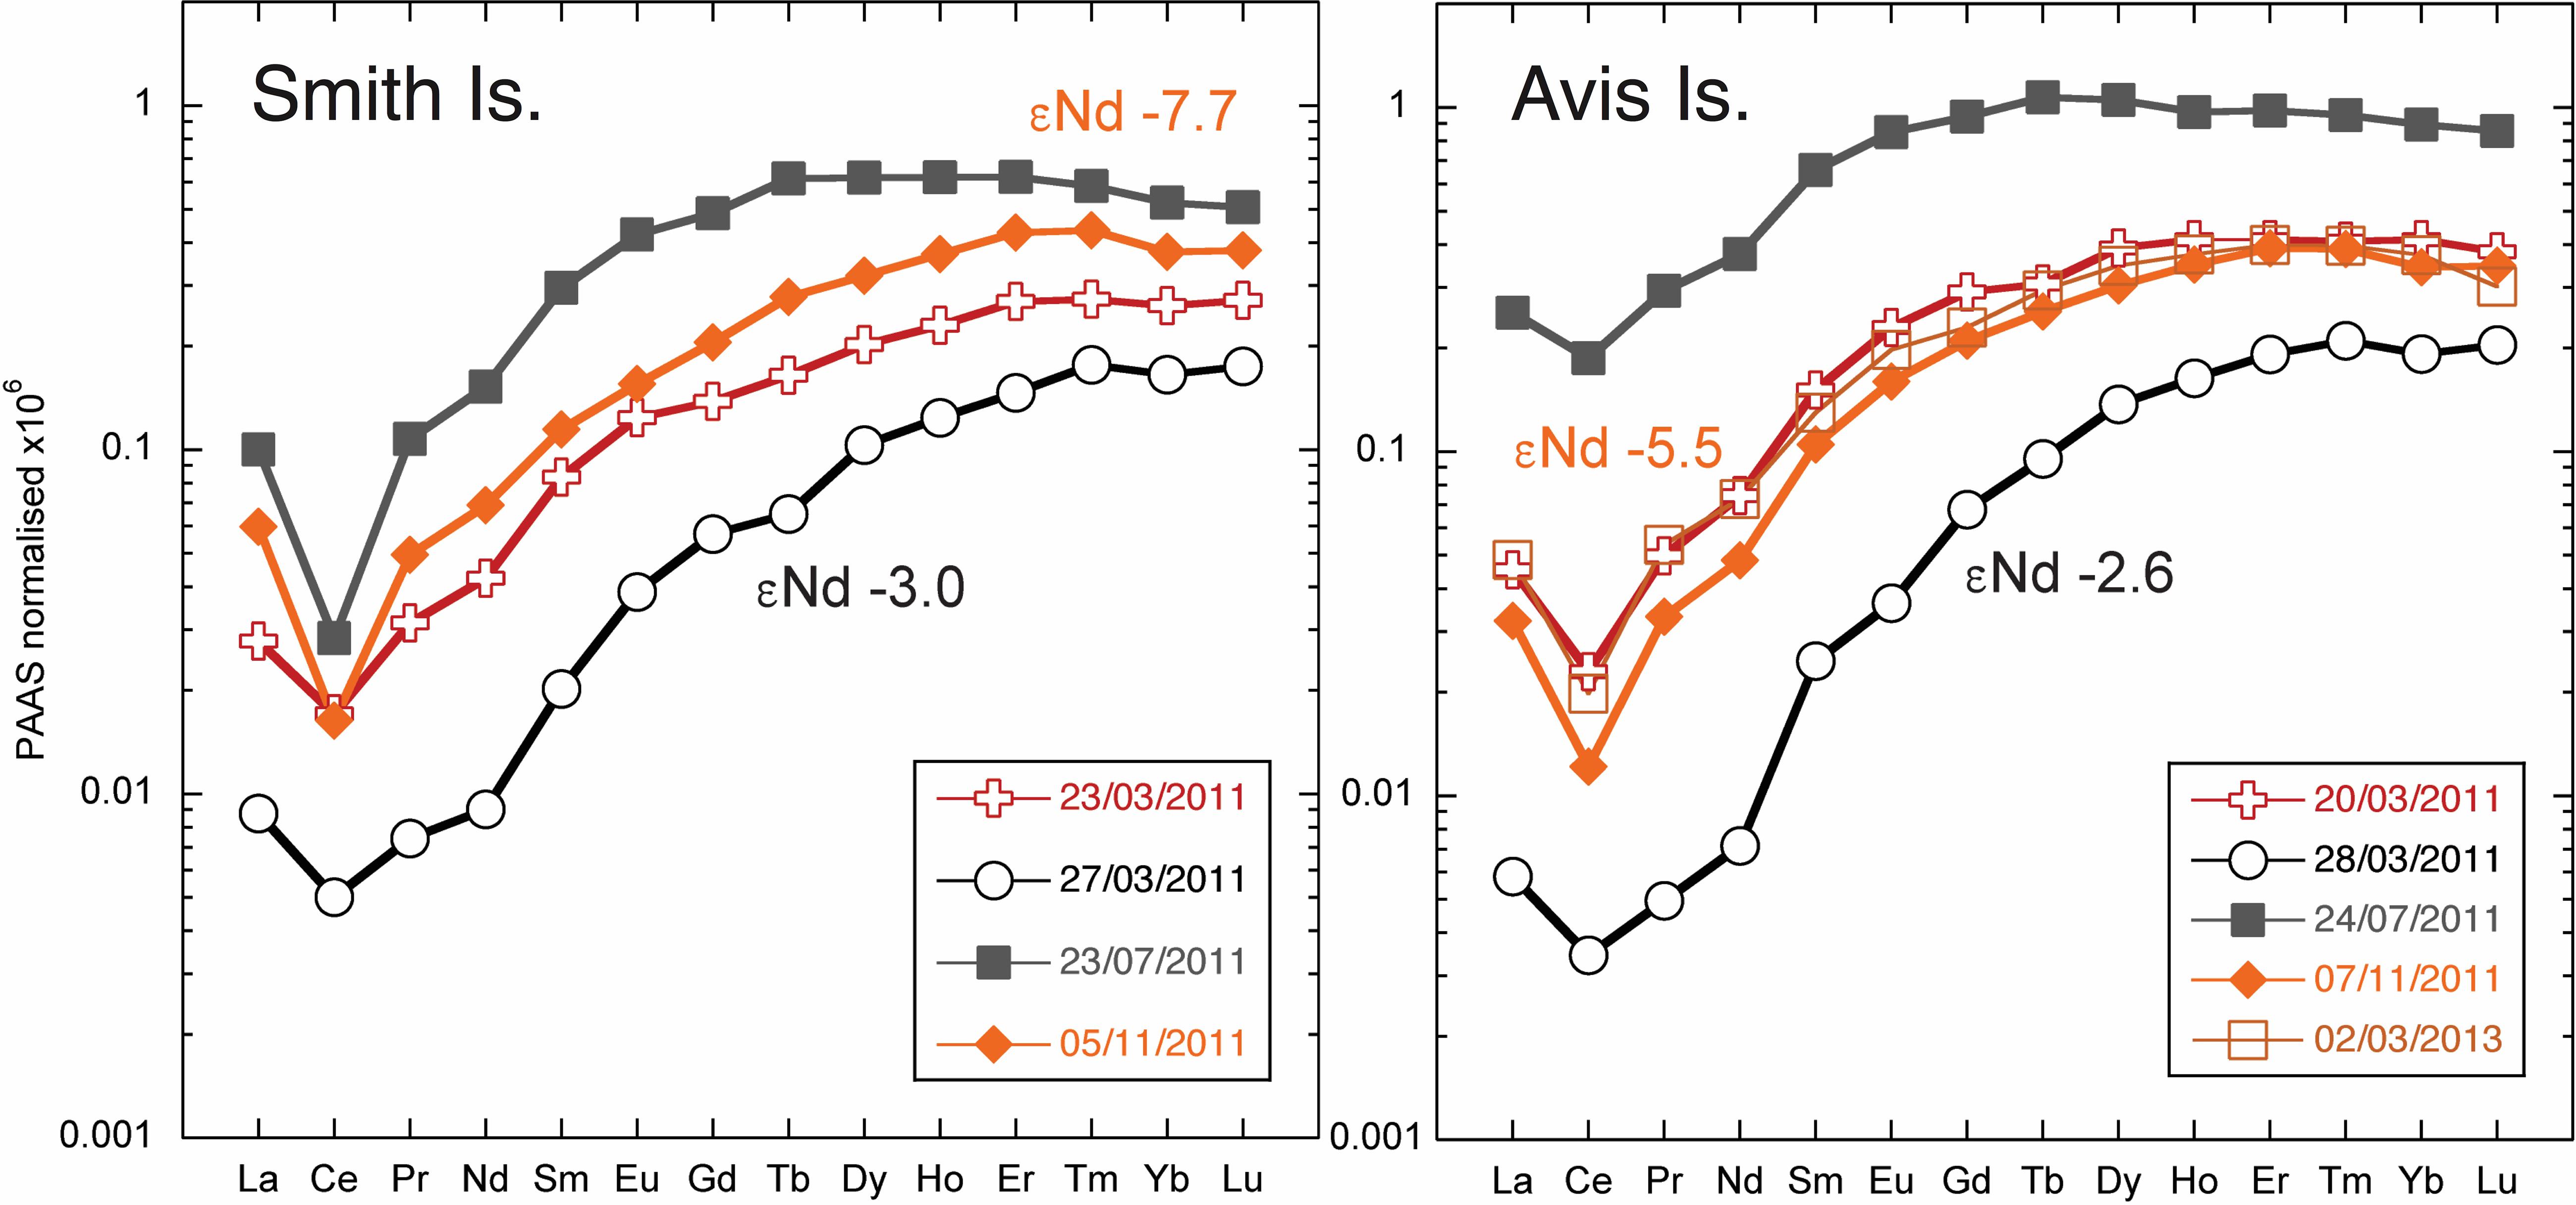
Figure 6. Shale (PAAS; Nance and Taylor, 1976) normalized rare earth element (REE) patterns for Smith and Avis Island time series. The Nd isotope composition measured for samples from March and November are marked with the same color as the associated REE pattern.
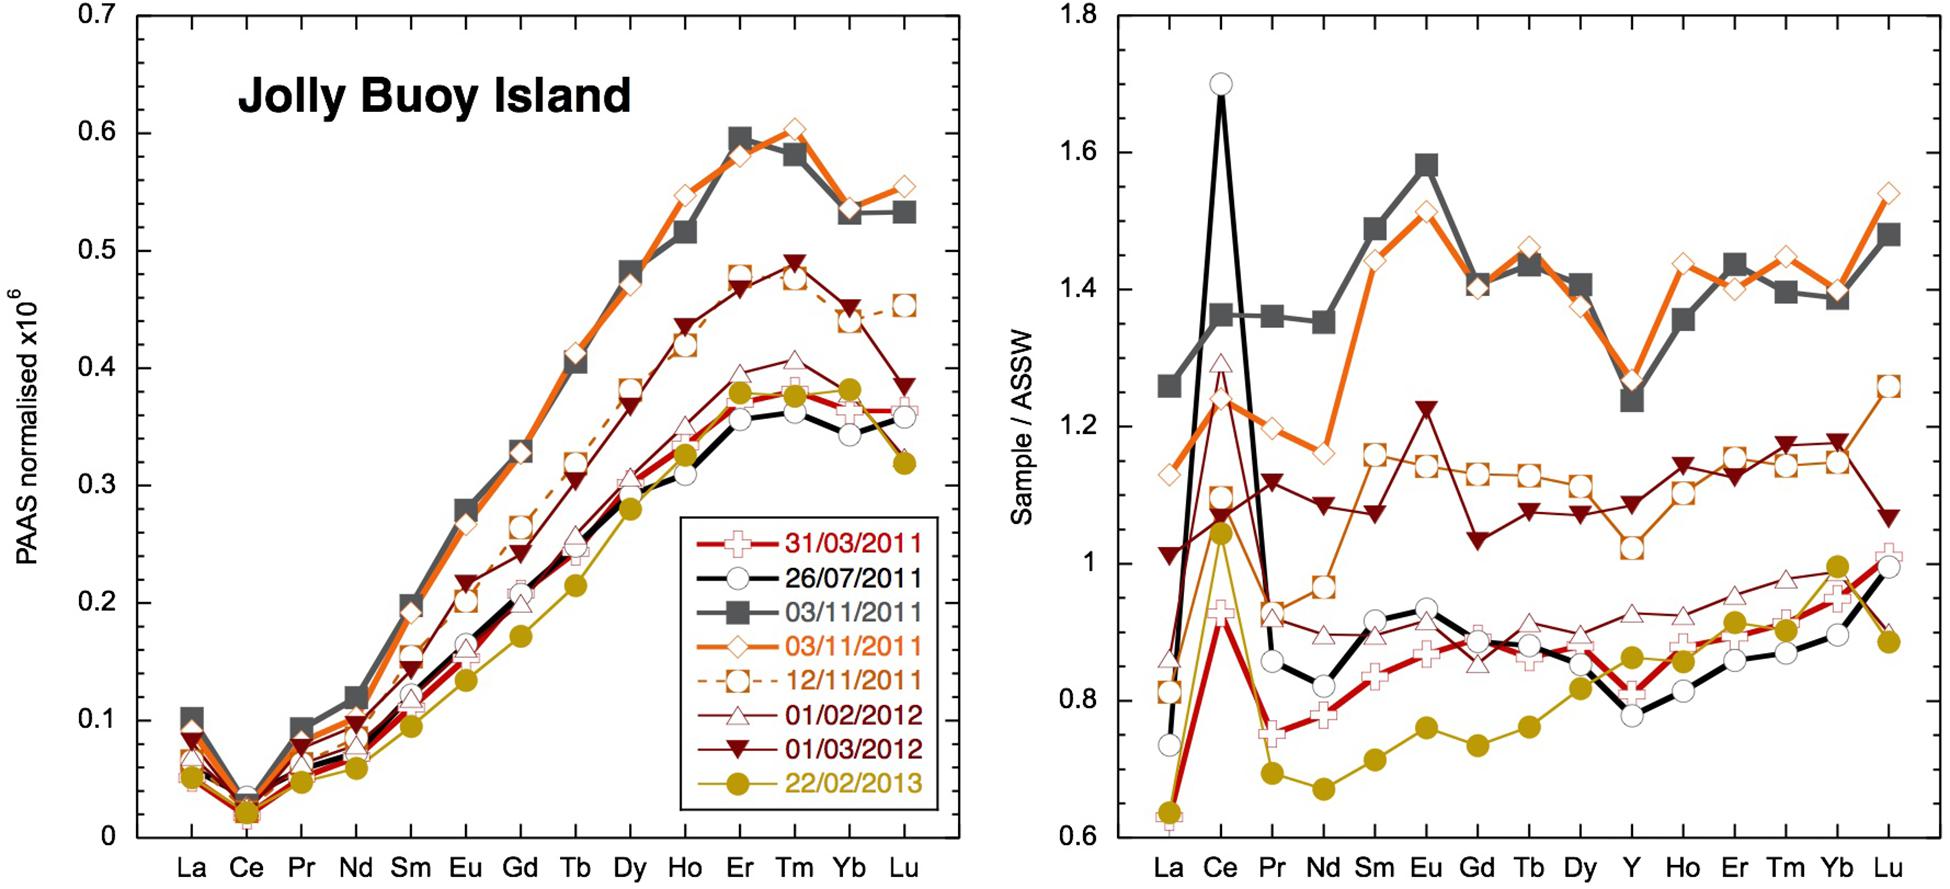
Figure 7. Jolly Buoy Island YREE time series shale (PAAS; Nance and Taylor, 1976) and Andaman Sea Surface water (ASSW) normalized (PA10 < 0.04-μm dissolved phase from Nozaki and Alibo, 2003).
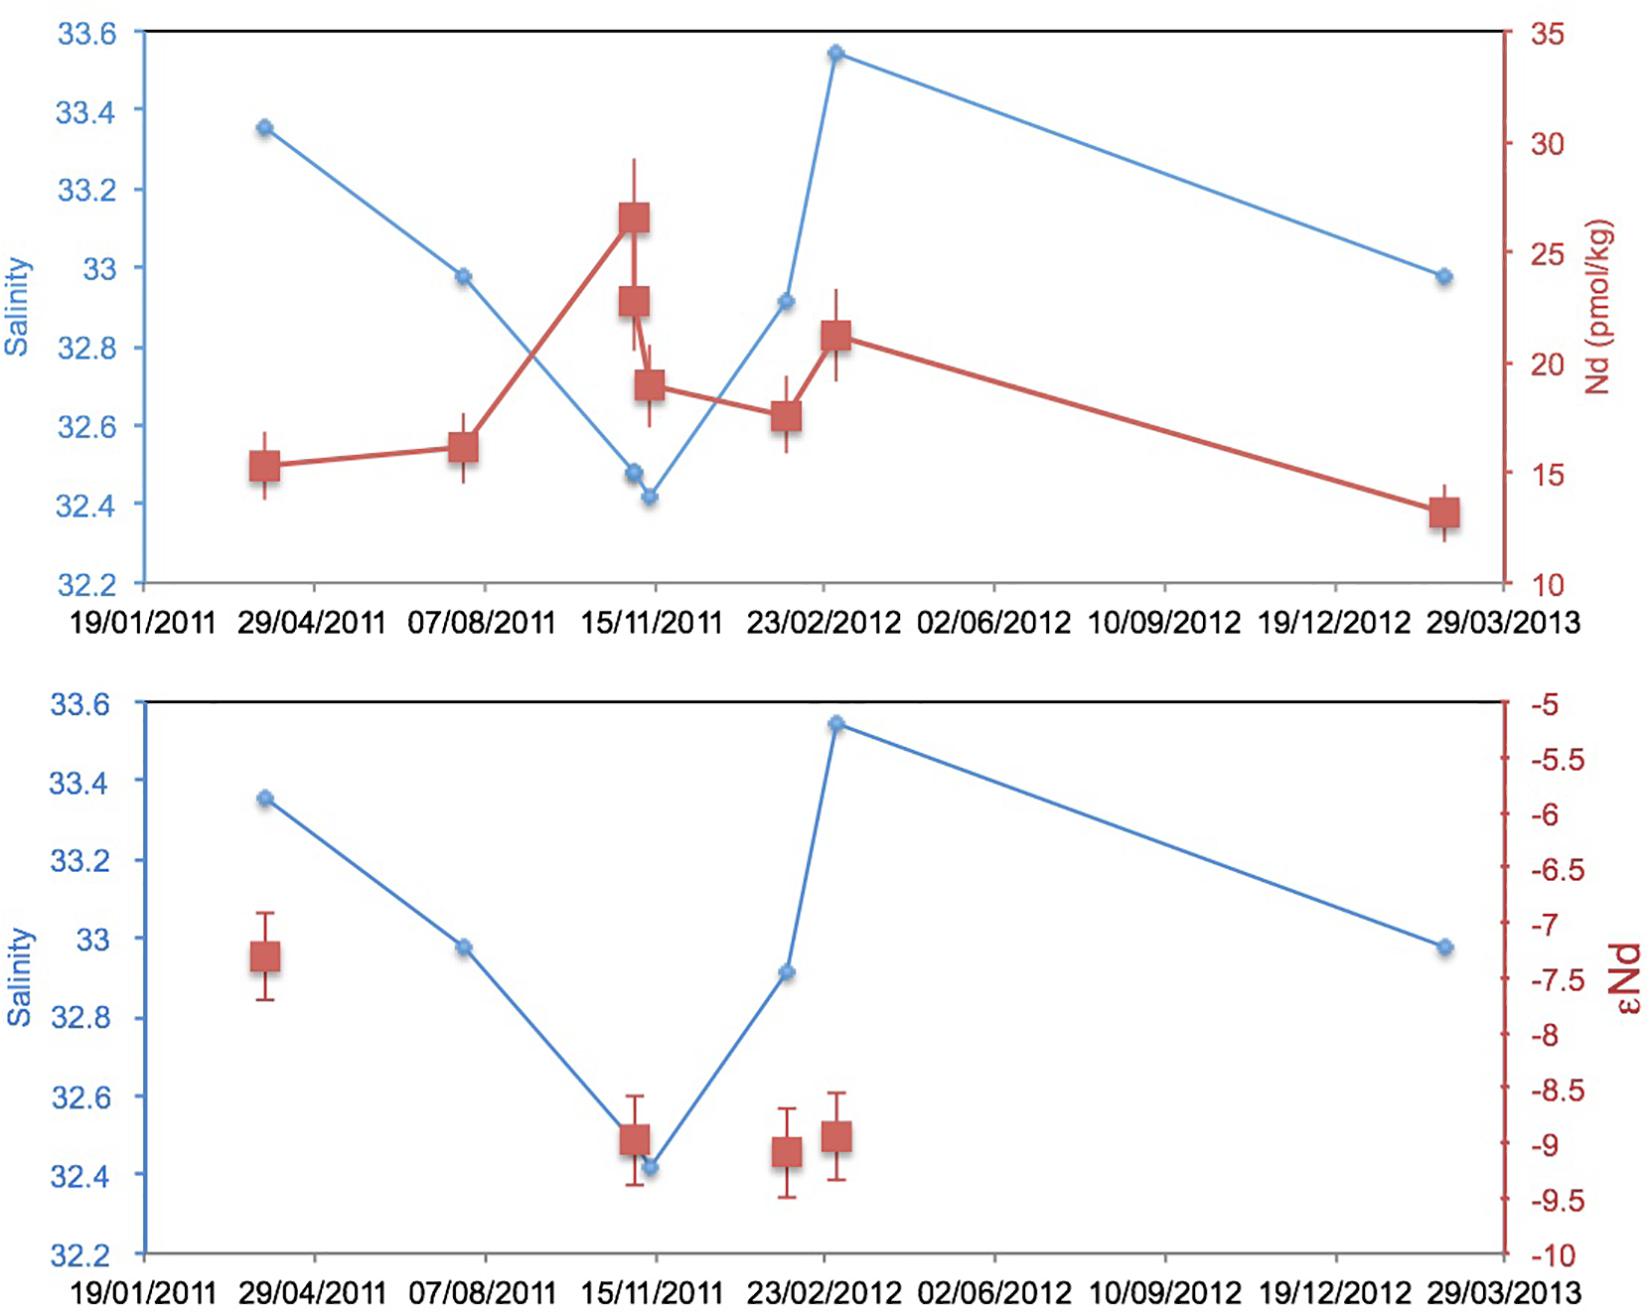
Figure 8. Jolly Buoy Island time series of Nd isotope composition and Nd concentration with measured salinity.
Neodymium Isotopes
A wide range of Nd isotope values are encountered in the filtered samples, from -9.6 to -2.6, with an apparent relationship with Nd concentrations (Figure 9). The Nd isotope composition at the Jolly Buoy site was -7.6 in March 2011 and then an invariable signature of -9 in November 2011 and February and March 2012 (Figure 8). This consistency is in strong contrast to the variations in salinity and Nd concentration between these sampling periods. The other sample from the western BoB side of the Islands (Interview Island) also has a similar Nd isotope composition, whereas samples from the eastern side of the Islands in the AnS have more radiogenic values ranging from -7 to -2.6. The most radiogenic values were measured for the samples with the lowest Nd and YREE concentrations (Figure 9).
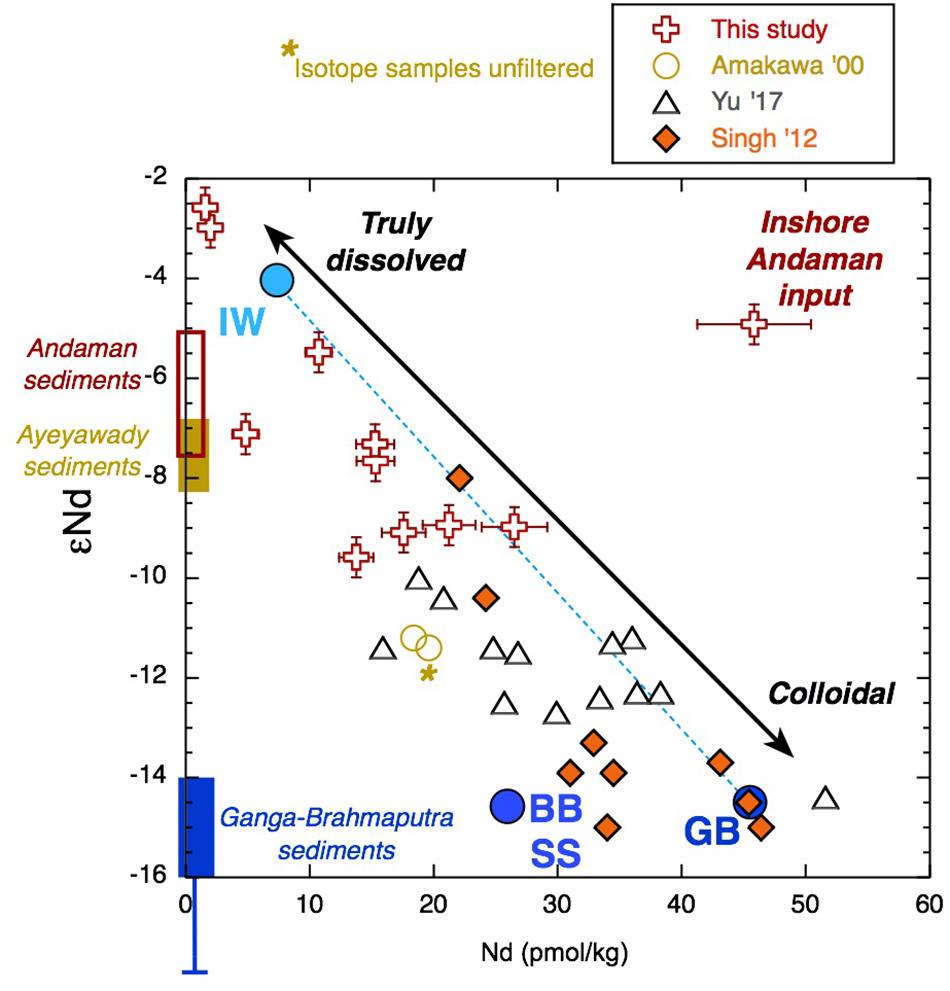
Figure 9. Radiogenic Nd isotope composition vs. Nd concentration for all large volume samples of this study together with values from the literature (Amakawa et al., 2000; Singh et al., 2012; Yu et al., 2017a, b) for samples from the upper 50-m water depth of the Bay of Bengal (BoB) and Andaman Sea (AnS) (Figure 1). Together, these data (excluding sample AN12) give a correlation coefficient value of r2 = 0.75. AN12 is plotted as the “Inshore Andaman Input” sample. Sediment Nd isotope values from potential sources are shown along the y-axis for the Ayeyarwady (Irrawaddy) (Allen et al., 2008a; Giosan et al., 2018), for the Andaman Islands (Ali et al., 2015), and for the Ganga-Brahmaputra (Singh and France-Lanord, 2002 and the references therein). Note the one Irrawaddy value from Colin et al. (1999), which has no location information, is less radiogenic than the other Ayeyarwady samples and is more similar to the Yangon or Sittaung rivers located nearby (Giosan et al., 2018). The mixing line between Indonesian throughflow waters (IW) with Ganga-Brahmaputra low salinity surface water (GB) employs the end members from Amakawa et al. (2000) and Singh et al. (2012). This cannot account for the lowest concentrations and most radiogenic samples (note that the IW endmember was not filtered for isotope analysis), and much of the data from the literature fall off the mixing line owing to lower Nd concentrations.
Discussion
Local Sources of YREE to Seawater
The dissolved Nd isotope composition measured is overall consistent with the local and regional geology (Figure 9), although the more radiogenic values were measured in clay size separates from the Archipelago group and from Karmatang Beach (Ali et al., 2015), which may represent a mixture of source rock contributions from the ophiolite and Mithakhari Melange (Garzanti et al., 2013). However, these rocks will only be of local importance, and the widespread enrichment of surface waters in Nd, evident also far away from the islands (Amakawa et al., 2000; Nozaki and Alibo, 2003), suggests that most of the radiogenic Nd likely originates from the Irrawaddy or IBR rivers (Allen et al., 2008b), especially in November. Like all samples from the BoB measured so far, the surface waters of the Andaman Islands exhibit a pronounced enrichment of the MREE relative to other ocean regions (Figure 10). An MREE enrichment has been found in many rivers (e.g., Elderfield et al., 1990; Sholkovitz, 1995) and has been attributed to phosphate mineral weathering (Hannigan and Sholkovitz, 2001), release from iron oxides/hydroxides (Tang and Johannesson, 2010), or possibly from sedimentary organic matter (Freslon et al., 2014). The carrier of the MREE enrichment is likely present in the colloidal phase, as it is not observed in the truly dissolved measurements of the Amazon tributary Solimões, which drains the Andes and is rich in inorganic colloids (Merschel et al., 2017b). A MREE bulge is also observed in the Yamuna tributary of the Ganga and local Andaman Island streams Jonga Nallah and Saddle Peak (Figure 5). The Saddle Peak stream samples ophiolite rocks, while the Junga Nallah source (AN92) is located in the Mithakhari Melange (Garzanti et al., 2013). The other streams sampled exhibit seawater-like REE patterns like those observed for rivers with higher pH values such as the Mississippi (e.g., Shiller, 2002; Adebayo et al., 2018), although with strong variations in concentrations. The stream on Interview Island flows through the carbonate-rich Archipelago group and has relatively high YREE concentrations. The waterfall sampled on Little Andaman Island most likely flows across the Archipelago group with Miocene limestones (Sarkar and Ghosh, 2015) and has the lowest stream REE concentrations. Interestingly, the south (S) Andaman Island stream near the east coast flows over the ophiolite rocks (Allen et al., 2008a) but has REE concentrations intermediate between Interview Island and Little Andaman Island streams with LREEs similar to those of Little Andaman and HREEs similar to those of Interview Island. Overall it appears that the local geology is not the only factor controlling the REE concentrations in the streams.
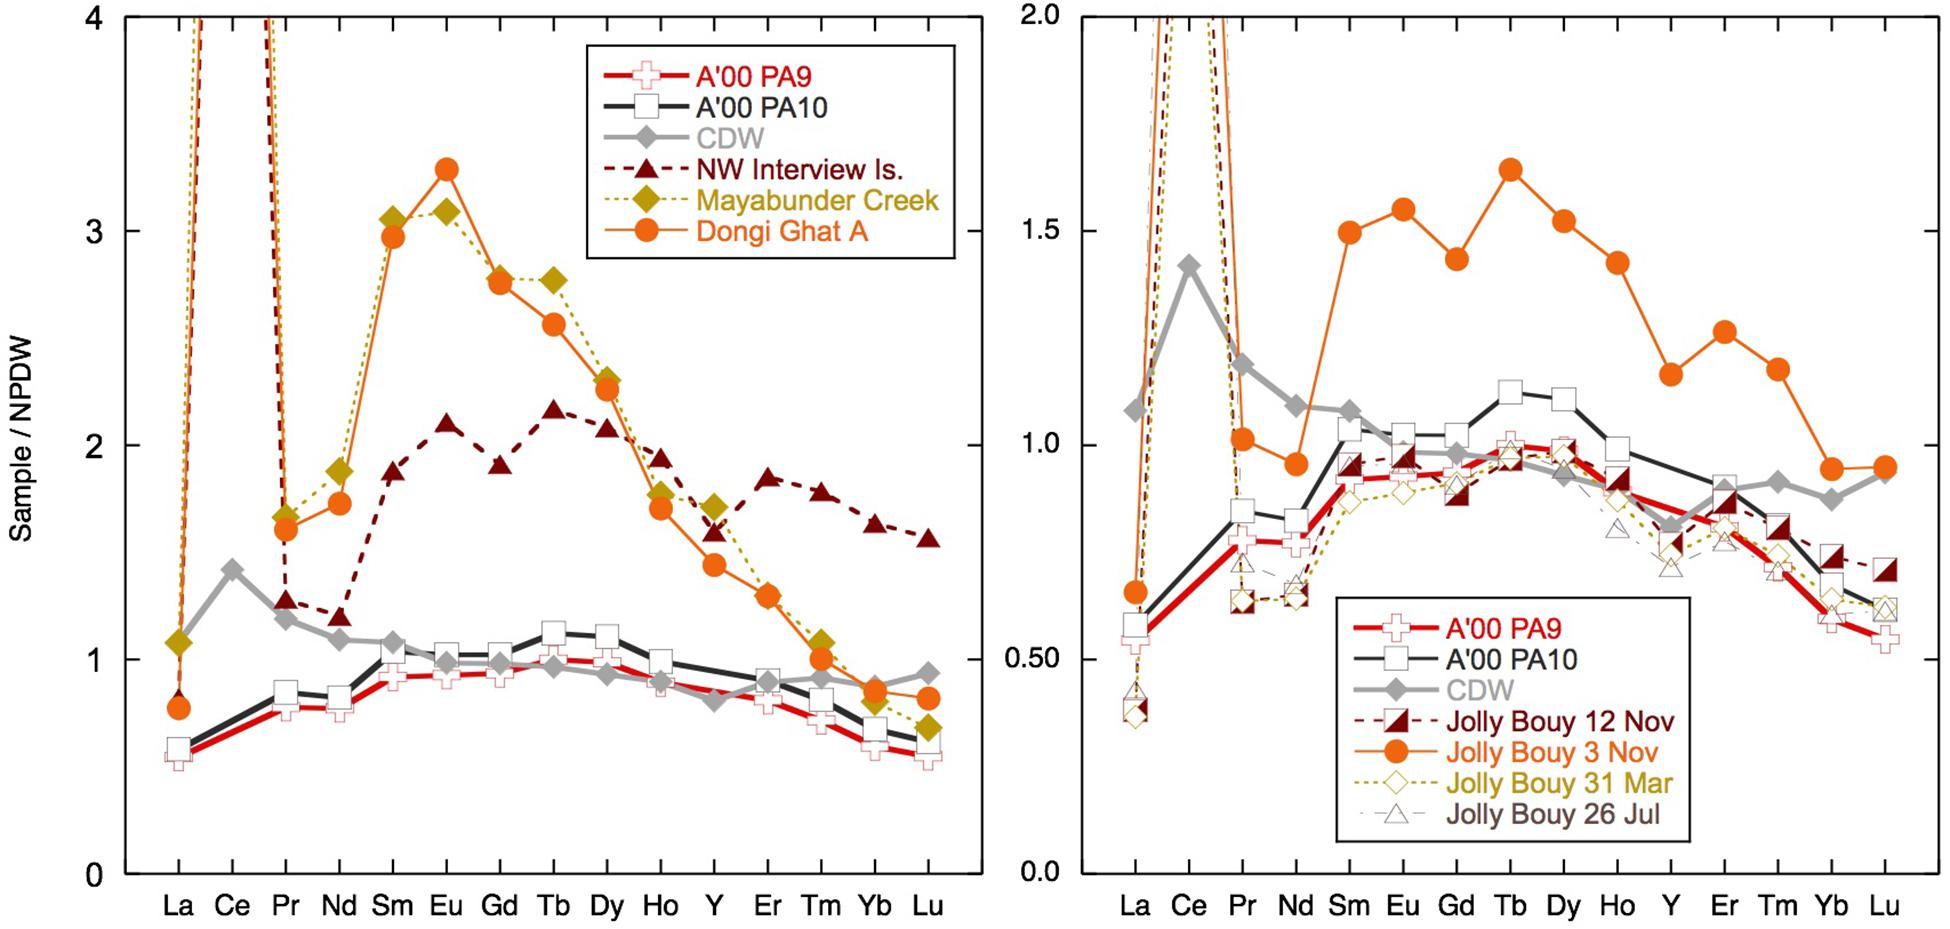
Figure 10. Selected samples normalized to North Pacific Deep water (NPDW) after Alibo and Nozaki (1999). The two surface samples measured by Amakawa et al. (2000) in the Bay of Bengal (BoB) and Andaman Sea (AnS) and Circumpolar Deep Water (CDW) from the Southern Ocean taken from Hathorne et al. (2015) are plotted for comparison.
The potential of local streams to influence the surface seawater YREE pattern will depend on the removal of YREE during mixing with seawater and salt-induced coagulation and the transfer of colloidal bound YREE to particles and their subsequent re-release from sediments (e.g., Elderfield et al., 1990; Sholkovitz and Szymczak, 2000; Rousseau et al., 2015; Adebayo et al., 2018). The few brackish water samples taken at the stream mixing zones suggest < 50% removal (the difference between the freshwater and brackish sample pair) of LREEs and virtually no removal for the HREE (Supplementary Table S1). Such limited removal is less than the global river average of 70% (see Rousseau et al., 2015 and the references therein), but similar results have been found for the Mississippi river and may be attributable to the relatively low YREE concentrations in the river water (Adebayo et al., 2018). Besides the Jonga Nallah and Interview Island samples, the stream water concentrations are of a similar magnitude to the highest seawater samples (Figures 4, 5). The highest concentrations are from locations inland up tidal creeks surrounded by mangroves (Figure 4, samples AN13 and AN140) or at small river mouths where the sediment loading is high (Figure 4, samples AN88 and AN146). Most importantly, these samples have MREE bulges like observed in many of the samples (Figure 10). However, this MREE bulge pattern is found throughout the AnS and BoB and may originate from both local input and the great rivers to the north (Figure 5).
The dust flux in the BoB exhibits a strong gradient from 0.3 to 6 g/m2/year, decreasing to the south and east and varies seasonally (Srinivas and Sarin, 2013). This large range is similar to that generally encountered in the northern hemisphere oceans (with the exception of the extremes of the tropical N Atlantic and Arabian Seas; Mahowald et al., 2005) and is similar to the lithogenic flux measured in southern BoB sediment traps (Unger et al., 2003), suggesting that dust could possibly be a source of YREE to surface seawater. However, the rain samples collected during the NE winter monsoon when winds may have supplied dust from the Asian continent have very low YREE concentrations and indicate that atmospheric sources of dissolved YREE are likely insignificant (Figure 5). The concentrations measured in the AnS rain samples are low compared with those found in the N Atlantic (Sholkovitz et al., 1993) and W Pacific (Nozaki et al., 1997). Although the concentrations measured in the filtered AnS rainwater (average of 3 pmol/kg of Nd) are much lower than concentrations observed in the Western Pacific (filtered values from 11.8 to 40.9 pmol/kg of Nd) by Nozaki et al. (1997), the shale-normalized patterns are similar, being relatively flat from La to Lu.
In summary, local inputs are clearly important to more inland samples and immediately at the mouths of streams, whereas the vast majority of the samples from around the reefs and outer islands reflect a more regional source of REE.
Rapid Removal of Dissolved YREE
The highly radiogenic values encountered following the removal of much of the Nd from the dissolved phase during the March 2011 rain event suggest that the remaining Nd was sourced from more mantle-derived radiogenic rock formations. The REEs remaining in solution have a similar concentration and shale-normalized pattern (Figure 11) to the ultrafiltered measurements of the truly dissolved fraction in the Amazon tributary Solimões (Merschel et al., 2017b). It also is interesting to note that the truly dissolved Solimões sample is some 2 εNd units more radiogenic than the > 1-kDa fraction (Merschel et al., 2017b), consistent with the radiogenic nature of the low REE samples observed here. Although a very general comparison made necessary by the scarcity of ultrafiltered water data, this suggests that the remaining REEs may represent the truly dissolved fraction characterized by a radiogenic Nd isotope composition. The rain sample (from a different place and time) has a Nd concentration similarly low to seawater after the rain event. However, the YREE patterns of the rain and the YREE-depleted surface water are distinctive and suggest that the rain was not a likely source for the highly radiogenic waters. Considering the likely dust sources to the region, Indian deserts with Himalayan-derived sediments or even Asian loess (e.g., Srinivas and Sarin, 2013) have much less radiogenic Nd isotope signatures, the rain itself cannot be responsible for the low Nd concentrations with radiogenic signatures. The change in salinity observed after the rain event in March 2011 is also too small for any significant volume of rainwater to have mixed with the surface waters causing these radiogenic values. The comparison of concentrations in the unfiltered and filtered samples reveals that there is much more Nd in the leachable particulate phase than needed to offset the loss from the dissolved pool after the rain event. The highest unfiltered/filtered values of 100 (see section “Discussion”) were found for these samples with active removal of YREE from the dissolved phase (e.g., AN11, AN14, AN17, and AN124), which have more extreme LREE-enriched unfiltered/filtered patterns than have those samples whose unfiltered/filtered ratio is high because they were taken at stream or river mouths or inshore locations (e.g., AN44, AN104, and AN146). Importantly, these unfiltered samples have relatively high concentrations, suggesting the active conversion from the colloidal fraction to the labile particulate pool (Figure 12). Additionally, the concentrations in these unfiltered samples are many times higher than the amount of REE removed following the rain event (e.g., 84 vs. 7 pmol/kg at Smith Island) and also much higher than observed in unfiltered samples at the same location during later visits (Figure 12). The shale-normalized pattern of these unfiltered samples does not suggest the presence of fresh volcanic material (Figure 12) that would help to explain the radiogenic Nd isotope values encountered in the filtered seawater but not the low dissolved YREE concentrations. Instead, the unfiltered YREE patterns suggest the input of locally derived suspended particulates (compared with inland sample AN12 unfiltered in Figure 12) as a result of the rain event, which then removed the colloidal component of the seawater. This could potentially occur in two ways: (1) the fresh local particles, not being equilibrated with seawater, could attract nearby colloids and/or simply collect colloids that they collide with, or (2) transported in a thin layer of freshwater runoff, the fresh particles and freshwater are mixed with the underlying seawater and colloidal flocculation mimicking estuarine mixing occurs on small length scales. It could also be the case that addition of dissolved Fe in the runoff would promote Fe hydroxide precipitation once mixed with seawater. It is informative to note that similarly low dissolved YREE concentrations associated with a high labile particulate fraction were also found for samples from the western (sun set) beach on Niel (Shaheed Dweep) Island (Figure 12). Variable salinity at the beach during sampling may be indicative of some groundwater discharge component, which may have introduced some particles that enhanced the removal of YREE from the dissolved pool or seawater recirculating through the aquifer encountering freshwater, and colloidal flocculation occurs. This feature was persistent at this location over all sampling visits and should be the focus of future work. More ultrafiltration work on river, seawater, and groundwater samples is required to confirm these suggestions, but the fortuitous sampling achieved here demonstrates that migration of YREEs from the dissolved pool to the labile particulate pool occurs on the timescale of days (Figure 6).
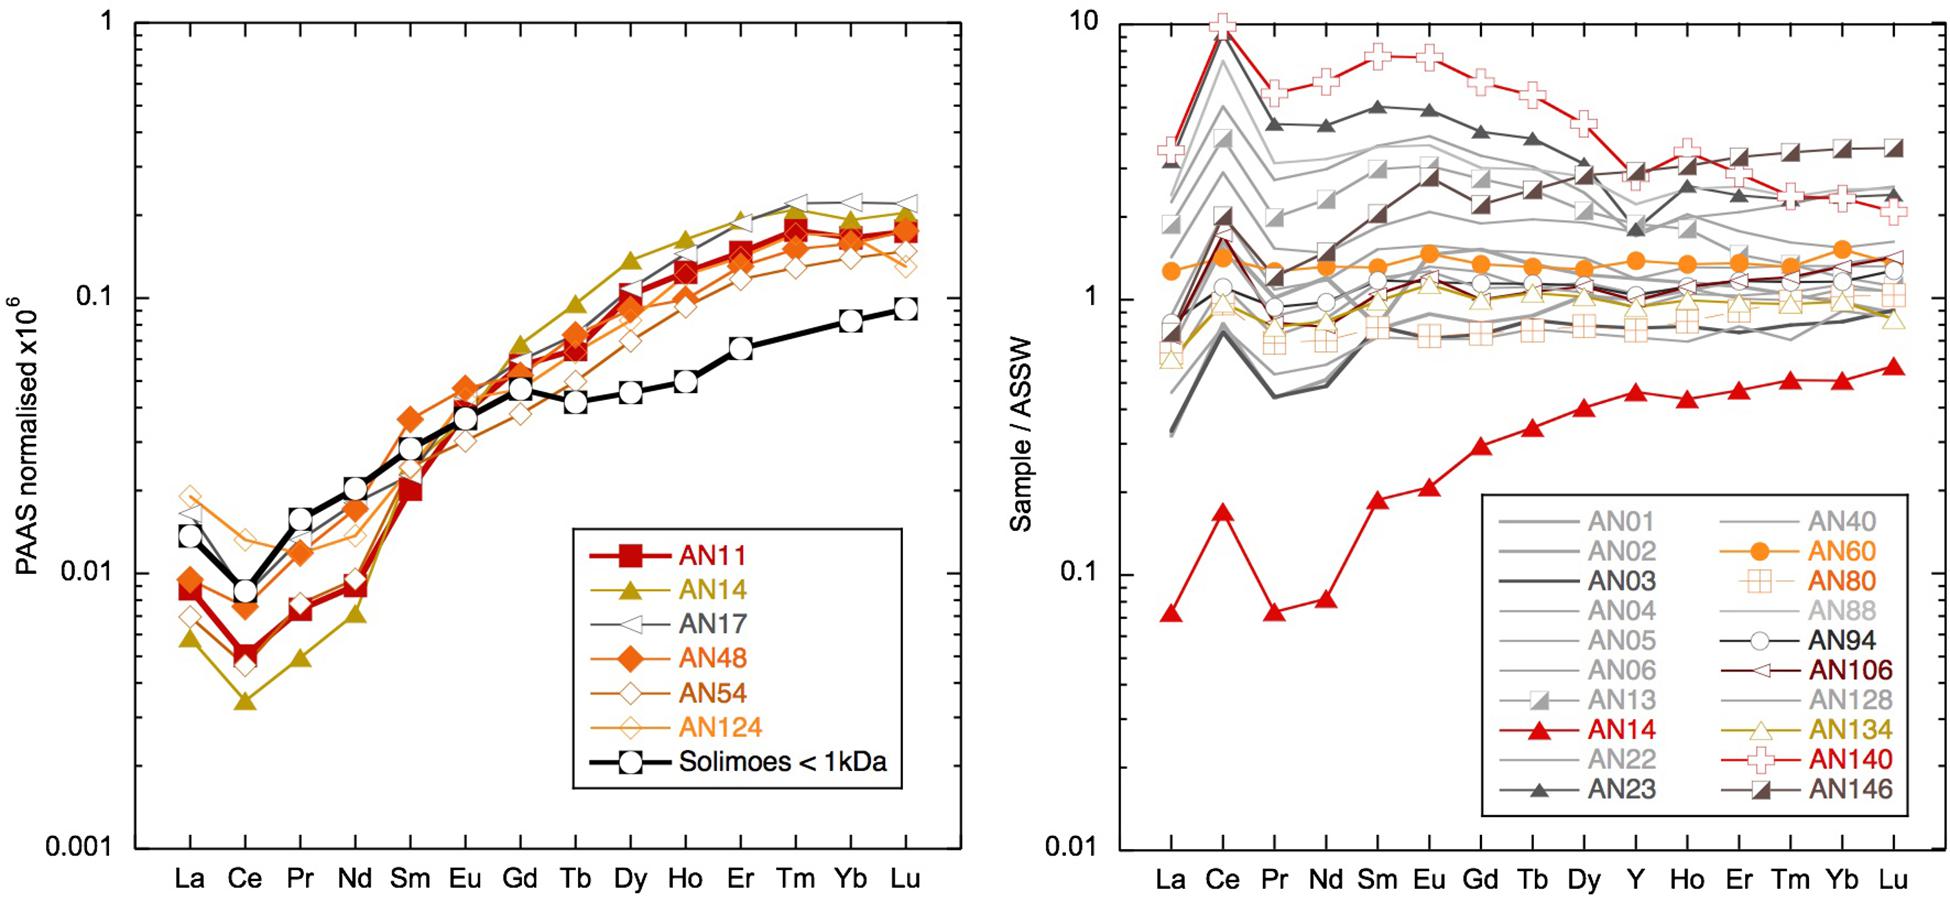
Figure 11. Left: low rare earth element (REE) concentration samples compared with < 1 kDa truly dissolved fraction from the Amazon tributary Solimões (Merschel et al., 2017b). Right: selected samples normalized to Andaman Sea Surface Water (ASSW) (PA10 < 0.04 μm of dissolved phase from Nozaki and Alibo, 2003).
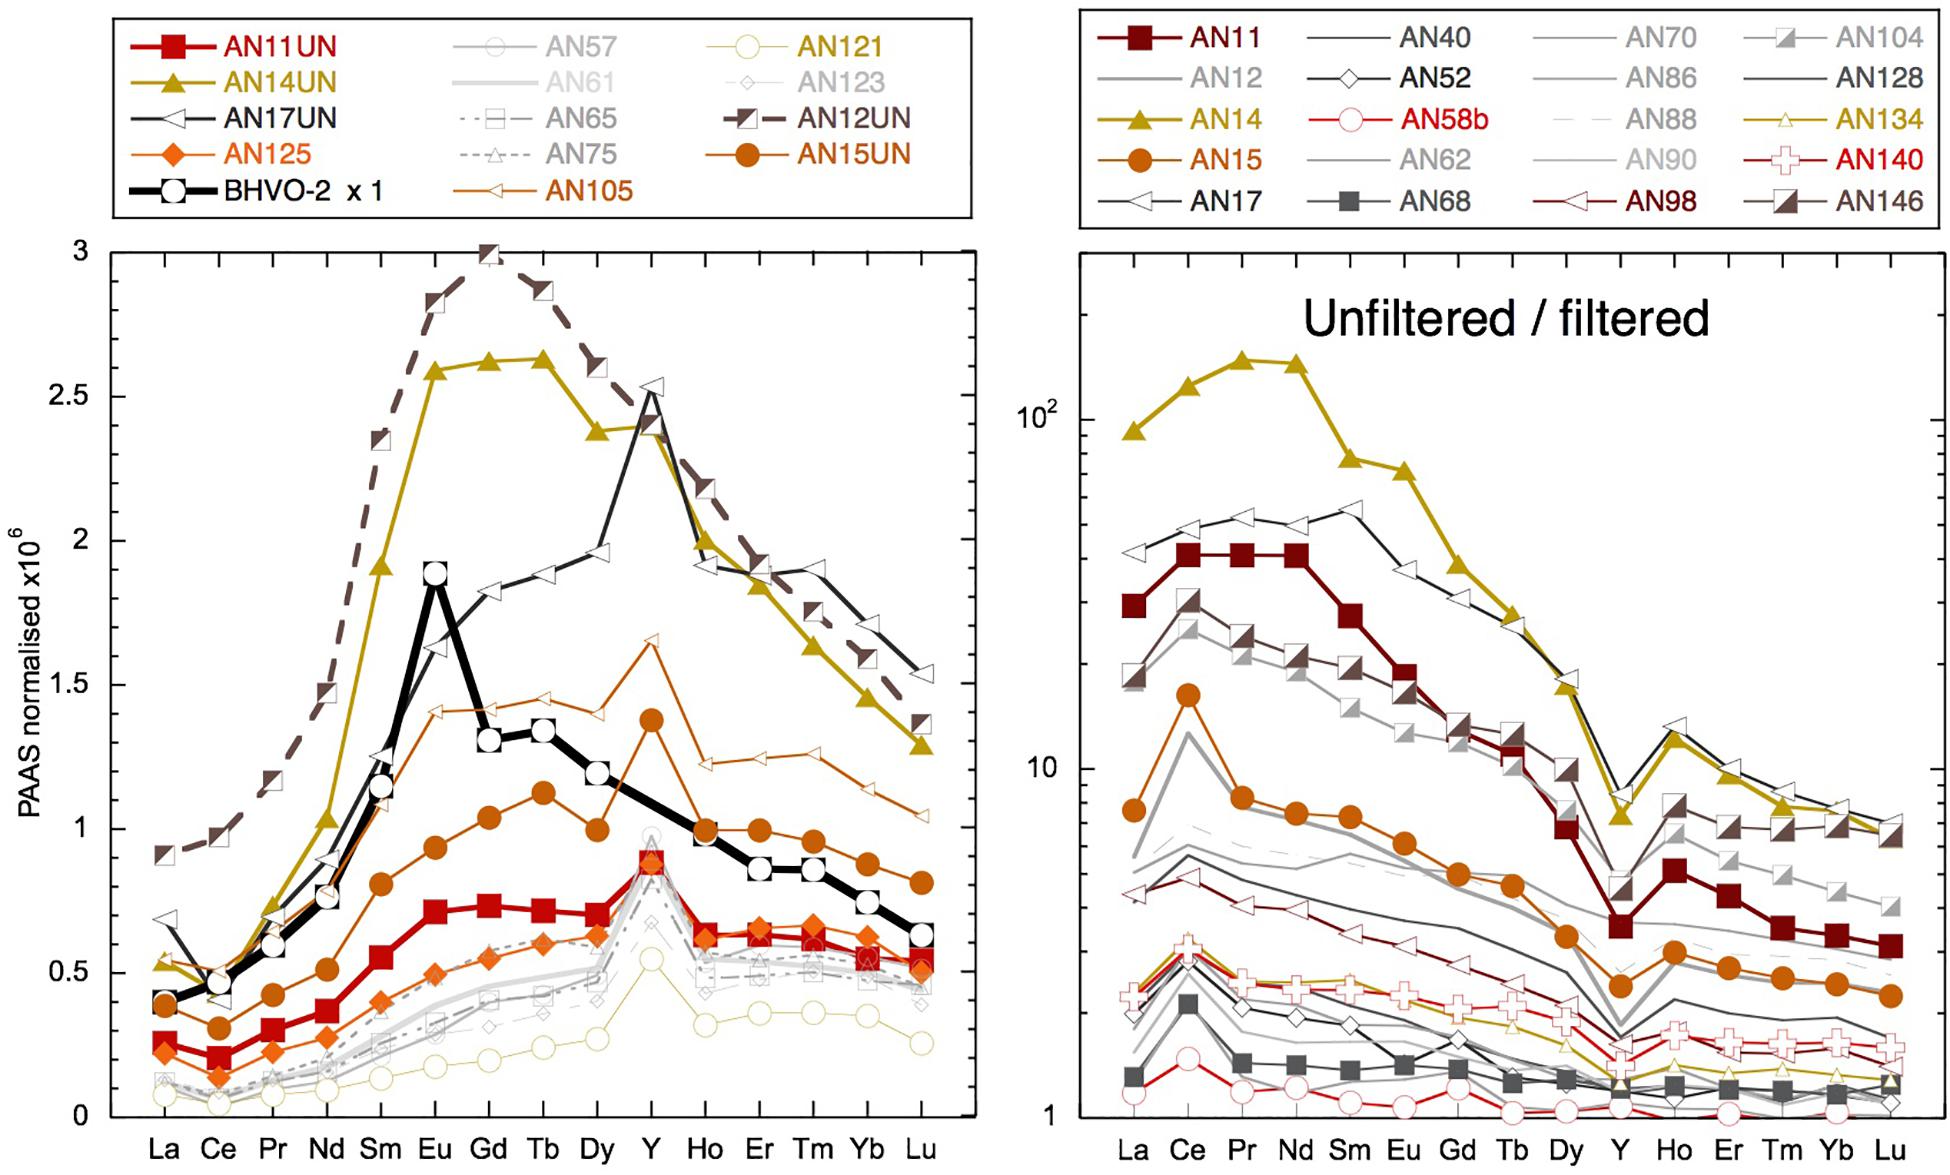
Figure 12. Left: unfiltered seawater samples and BHVO-2 basalt values (taken from GeoReM database Jochum et al., 2005) normalized to PAAS (Nance and Taylor, 1976). Right: unfiltered YREE/filtered YREE for various examples. Samples from the main locations use the same symbols: squares for Smith Island, vertical triangles for Avis Island, square rhombuses for Niel (Shaheed Dweep) Island, and horizontal triangles for Little Andaman Island.
Labile Particulate YREE
The leachable (0.1% HCl by volume making the pH around 2) particulate concentrations of Al, Fe, and Mn obtained in a similar manner to here from unfiltered samples from the shelf off South Georgia Island have been shown to correspond to particulate concentrations obtained from filters (Schlosser et al., 2018). Those samples from the Southern Ocean displayed high unfiltered/filtered concentration ratios for Fe and Al, but not for Mn, and direct comparison with particulate data indicates a fraction of the particulate Al and Fe was not leached from the particles in the unfiltered seawater (Schlosser et al., 2018). This suggests that the YREE concentrations measured in the unfiltered acidified seawater represent the labile particulate pool. The comparison of filtered and unfiltered samples reveals a very large readily exchangeable (in weak HCl) pool of suspended particulate YREE around the islands. Unfiltered/filtered values of up to 100 for Nd and many samples with values > 10 are in stark contrast to studies of open ocean waters where labile particulate YREE is around 5% of the dissolved pool (unfiltered/filtered values around 1.05; Sholkovitz et al., 1994; Alibo and Nozaki, 1999). The highest unfiltered/filtered values observed here are in the order of 100 and are from the samples with anomalously low REE concentrations resulting from active removal of YREE from the dissolved phase (Figure 12; AN11, AN14, AN17, and AN124). These have more extreme LREE-enriched unfiltered/filtered patterns than have those samples whose unfiltered/filtered ratio is high because of being close to local river or sediment input (Figure 12; AN104 and AN146). The samples with high-to-intermediate YREE concentrations exhibit unfiltered/filtered values generally between 2 and 20 demonstrating the persistence of a large labile particulate fraction in the region. Many of the unfiltered/filtered patterns display a clear Y/Ho fractionation, with Y being less enriched in the labile particulate fraction than Ho (Figure 12). This is to be expected as Y is less particle reactive than Ho despite having very similar ionic radii and charge (e.g., Bau, 1996; Nozaki et al., 1997). Both filtered and unfiltered samples from some stream waters and inland creeks with active input exhibit near crustal Y/Ho [Post-Archean Average Australian Sedimentary rocks (PAAS) has a molar Y/Ho of 50] with molar ratios around 60. However, for many sample pairs, the Y/Ho ratio of the filtered sample is higher, around 80, the most extreme examples being the samples with anomalously low filtered YREE concentrations having molar Y/Ho ratios around 100. In the same samples the labile particulate fraction has shale-like ratios of around 50 (Supplementary Table S1), which have also been observed for Ayeyarwady (Irrawaddy) shelf sediments (Kurian et al., 2008). These observations illustrate the control that the large labile particulate fraction has on the dissolved YREE patterns while indicating the dominance of crustal YREE in this fraction.
YREE Concentrations as Tracers of River Discharge
The elevated surface water YREE concentrations in the BoB have been taken as evidence for discharge of YREE from the great rivers draining into the Bay (Amakawa et al., 2000; Singh et al., 2012; Yu et al., 2017b). Based on N–S gradients in YREE concentrations in the BoB, Yu et al. (2017b) suggested high MREE∗ (MREE anomaly or bulge index) and low crustal Y/Ho ratios as good tracers for G-B river input, but we have found similar patterns from local input from Andaman sediments. However, the high MREE∗ values > 2 observed in some Andaman stream samples are significantly eroded during stream mixing, and there is no clear relationship between MREE∗ and salinity. The dissolved YREE concentrations from the Yamuna tributary of the Ganga, some 500 pmol/kg of Nd, are high compared with those of Andaman streams (Figure 5); but the removal in the G-B, Irrawaddy, and Salween estuaries is unknown, and the removal upon mixing of Andaman streams appears relatively low (only 50%). Therefore, it is not surprising that in many locations, it seems that the local input of YREE, from runoff directly or released from particles and sediments, produces the dominant signal in surface water concentrations. This is evident in both Smith and Avis island time series where there are distinctive peaks in YREE concentrations (with high MREE∗ and low Y/Ho) in the July samples exhibiting low salinities with the local monsoon rains (compare July and November samples in Figure 6). Additionally, strong monsoon winds may lead to enhance sediment resuspension and YREE release. This contrasts with the Jolly Buoy time series where the YREE pattern remains similar throughout the year, whereas YREE concentrations peak not in July following local monsoon rains but in November when the monsoon-induced river discharge would most likely pass the islands (Jian et al., 2009). It seems that the relatively remote location of Jolly Buoy Island, on the BoB side away from the larger islands and sediment sources (Figure 2), is the likely reason for the different timing of the YREE concentration peak. The Jolly Buoy samples also exhibit some of the smallest labile particulate YREE fractions measured here (Figure 12: plain circles), with the notable exception being the March 2011 sample (AN15), suggesting the labile particulate pool here is not sourced from discharge from the great rivers. Additionally, the samples from November with the highest YREE concentrations have very similar Y/Ho ratios to samples from the other seasons, and the labile particulate pool has a slightly higher Y/Ho, strongly arguing against a fresh crustal source. At the same time, the Jolly Buoy Island samples have relatively flat AnS Surface Water (ASSW PA-10 from Nozaki and Alibo, 2003) normalized patterns (Figure 11), suggesting that these samples are representative of the wider region. The positive Indian Ocean dipole event of 2011 and 2012 led to strong freshening events in the BoB from rainfall (Pant et al., 2015) but importantly not river discharge. It may be, therefore, that our sampling missed a large river discharge event and the associated YREE signal. Instead, exceptional rainfall in March 2011 appears to have generated the most distinctive YREE and Nd isotope signal in our dataset through the rapid migration of YREE from the dissolved to the labile particulate pool.
Although the YREE distributions are clearly sensitive to interaction with particles, the Nd isotope signatures of seawater are considered a more conservative tracer of input sources. As such, we compare the εNd with YREE indices of BoB surface waters from this study and the literature (Amakawa et al., 2000; Yu et al., 2017a, b). The YREE indices suggested as being good potential proxies for G-B sediment input, namely, Y/Ho and MREE∗ (Yu et al., 2017a), exhibit relatively little variability and no consistent relationship with eNd, whereas the La/Yb molar ratio and the PAAS-normalized Yb/Nd (referred to as HREE/LREE in Yu et al., 2017a) show a clear relationship with εNd (Figure 13). The one inshore sample influenced by local sediments (AN12 and marked in Figure 9) does not fit with the other data, again demonstrating that the εNd of the other Andaman surface seawater samples likely reflects a regional signal. The close relationship between La/Yb and εNd suggests that this can also be used to trace this regional signal.
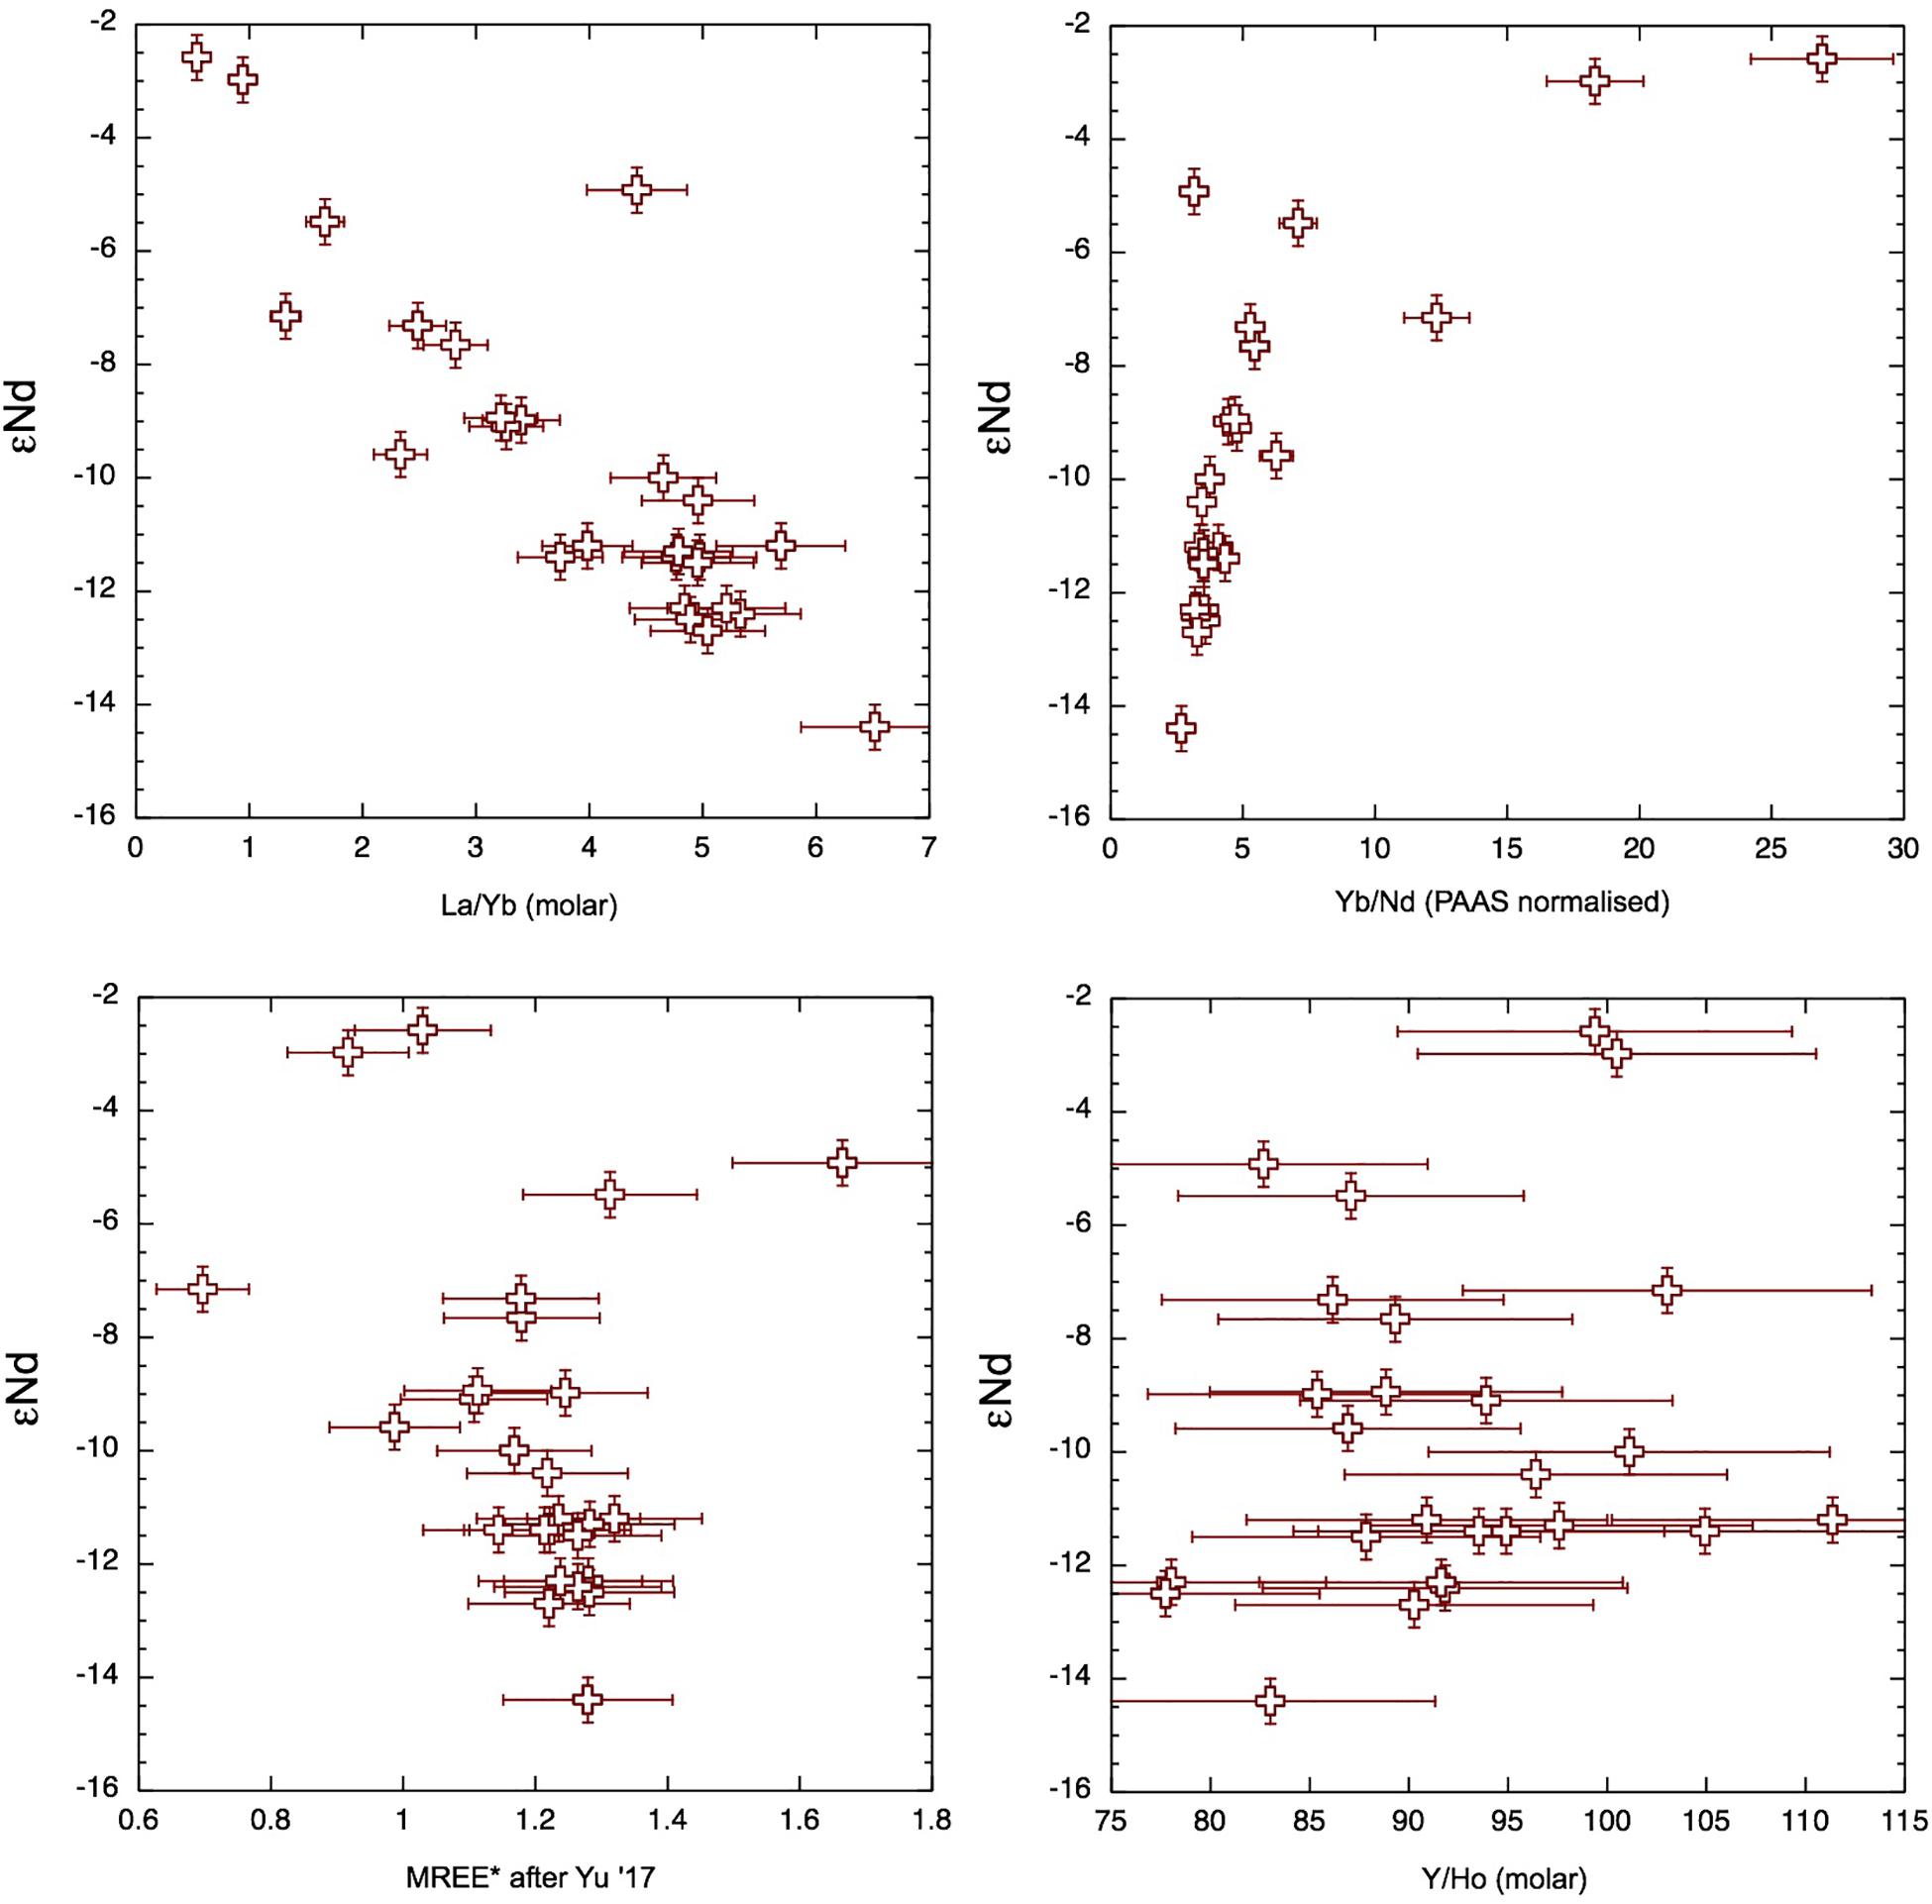
Figure 13. Radiogenic Nd isotope composition vs. YREE indices for samples of this study together with values from the literature (Amakawa et al., 2000; Yu et al., 2017a, b) for samples from the upper 50-m water depth of the Bay of Bengal (BoB) and Andaman Sea (AnS) (Figure 1).
Seasonal Changes of Neodymium Isotopes
Recent studies of Nd isotopes and concentrations in the BoB have revealed a substantial excess of Nd throughout the BoB when compared with those of the rest of the Indian Ocean, and this excess has a calculated Nd isotope composition similar to that of modern G-B river sediments (Singh et al., 2012). The resampling of similar locations (Figure 1) a couple of years later found significantly lower Nd concentrations and more radiogenic Nd isotope signatures (Yu et al., 2017a). These authors thought this difference is most likely explained by the Nd isotope composition of BoB seawater varying seasonally and inter-annually with sediment discharge from the G-B river system (Yu et al., 2017a). However, as the samples were not taken at exactly the same location, it was not possible to conclusively distinguish if the variability observed between these studies was truly seasonal/inter-annual or resulted from spatial heterogeneity (Yu et al., 2017a). Here, we have shown with samples collected at three fixed locations over a year that indeed the Nd isotope composition of filtered seawater can change on sub-annual timescales (Figures 6, 9). We have compared the Nd isotope data from around the Andaman Islands with those from the surface (for this purpose, we assume a mixed layer depth of 50 m) BoB from Amakawa et al. (2000), Singh et al. (2012), and Yu et al. (2017a), and a clear correlation between the Nd isotope composition and concentration appears (Figure 9). It must be noted that Amakawa et al. (2000) measured the Nd isotopes from winter (non-monsoon) collected samples from the BoB and AnS that were not filtered, whereas they measured Nd (and YREE) concentrations on filtered waters. It seems that the isotope composition of filtered seawater in the BoB is a function of mixing between a very low concentration radiogenic endmember that we encountered after the rain event in March 2011 and a high concentration unradiogenic endmember from the G-B river (Singh et al., 2012). Samples move away from this line with reduced Nd concentrations, and a third endmember could be BoB subsurface water (Figure 9). Singh et al. (2012) considered the surface water from the south to be 100% Indonesian throughflow water with a Nd concentration of only 7 pmol/kg and a radiogenic isotope composition of -4. This endmember (but again from Amakawa et al., 2000, so unfiltered for isotopes) plots near the low-concentration samples from the AnS (Figure 9) following the rain event in March 2011 when it appears that the colloidal fraction rapidly migrated to the labile particulate pool. The remaining Nd, hypothesized to be truly dissolved, may have been sourced from Indonesian throughflow water, but as it is even more radiogenic, it is more likely that more local radiogenic sources like the Indo-Burmese Ranges (Damodararao et al., 2016) also contributed. It follows that the apparent mixing between Indonesian throughflow water and G-B outflow water masses used to explain the BoB surface water composition (Singh et al., 2012) could potentially be a function of the proportion of the filtered BoB seawater in the truly dissolved and colloidal phases (Figure 9). It seems that this proportion can be rapidly changed by interaction with the large labile particulate fraction observed here, and this may also be responsible for the observed inter-annual changes in the Nd isotope composition of BoB surface water (Yu et al., 2017a). This is an extension to the idea of Elderfield et al. (1990) that the river water REE composition is controlled by the balance between truly dissolved and colloidal pools with the addition of a third pool, which is the labile particulate fraction. Future sampling campaigns should include both filtered and unfiltered samples for Nd isotope analyses as well as YREE concentrations, and ultrafiltration should be performed whenever logistically possible. Eventually, we would hope to be able to carry out residence time calculations, such as performed by Amakawa et al. (2000) and revisited by Yu et al. (2017b), for the YREE in each pool individually. The labile particulate pool may also help to explain variations in seawater Nd isotopes in the entire oceanic water column on the timescale of years observed in other regions (Grasse et al., 2017).
Conclusion
The dissolved YREE composition of filtered seawater around the Andaman Islands reveals both local input to and removal of YREE from the dissolved phase. Rapid removal following an exceptional rainfall event in March 2011 left the remaining Nd with a markedly radiogenic isotope composition, and as a result of this, the dissolved Nd isotope composition varies by some 7 εNd units across the islands. Changes in the YREE and Nd isotope composition within 1 year are observed at three fixed locations, confirming recent suggestions that short-term temporal variations occur in the BoB. The similarity of YREE patterns across the BoB and AnS suggests a common source for their enrichment in Indian Ocean surface waters. Taken together, the data for surface waters from this study and the literature appear to form a mixing relationship, but we hypothesize that this reflects the proportions of radiogenic Nd in the truly dissolved phase and of unradiogenic Nd in the colloidal pool. Based on comparison of filtered and unfiltered samples a third phase, a labile particulate pool is identified, which controls the proportion of dissolved YREE phases by removing the colloidal fraction. This control by particulate YREE phases is likely also important in other sediment and particle rich regions.
Data Availability Statement
All datasets generated for this study are included in the article/Supplementary Material.
Author Contributions
EH and PM collected the samples. EH performed the analyses and wrote the manuscript with contributions from MF and PM.
Conflict of Interest
The authors declare that the research was conducted in the absence of any commercial or financial relationships that could be construed as a potential conflict of interest.
The reviewer JS declared a past co-authorship with several of the authors EH, MF to the handling Editor.
Acknowledgments
We thank the National Geographic Committee for Exploration for funding the fieldwork on the Andaman Islands, and Sachin, Das, and numerous fishermen for their assistance in the field. We are grateful to the Andaman and Nicobar Administration Wildlife Division for allowing water sampling and in particular the officers in Mayabunder for their assistance. Katharina Pahnke-May and Philip Böning from the ICBM at the University of Oldenburg helped with the low-concentration Nd isotope measurements using their Neptune MC-ICPMS, and Eric Achterberg at GEOMAR and Christian Schlosser are thanked for use of their seaFAST and Element XR instrument, as well as for scientific discussion.
Supplementary Material
The Supplementary Material for this article can be found online at: https://www.frontiersin.org/articles/10.3389/fmars.2019.00767/full#supplementary-material
References
Adebayo, S. B., Cui, M., Hong, T., White, C. D., Martin, E. E., and Johannesson, K. H. (2018). Rare earth elements geochemistry and nd isotopes in the mississippi river and gulf of mexico mixing zone. Front. Mar. Sci. 5:166. doi: 10.3389/fmars.2018.00166
Akhil, V. P., Durand, F., Lengaigne, M., Vialard, J., Keerthi, M. G., Gopalakrishna, V. V., et al. (2014). A modeling study of the processes of surface salinity seasonal cycle in the Bay of Bengal. J. Geophys. Res. 119, 3926–3947. doi: 10.1002/2013JC009632
Akhil, V. P., Lengaigne, M., Vialard, J., Durand, F., Keerthi, M. G., Chaitanya, A. V. S., et al. (2016). A modeling study of processes controlling the Bay of Bengal sea surface salinity interannual variability. J. Geophys. Res. 121, 8471–8495. doi: 10.1002/2016JC011662
Ali, S., Hathorne, E. C., Frank, M., Gebregiorgis, D., Stattegger, K., Stumpf, R., et al. (2015). South Asian monsoon history over the past 60 kyr recorded by radiogenic isotopes and clay mineral assemblages in the Andaman Sea. Geochem. Geophys. Geosyst. 16, 505–521. doi: 10.1002/2014GC005586
Alibo, D. S., and Nozaki, Y. (1999). Rare earth elements in seawater: particle association, shale-normalization, and Ce oxidation. Geochim. Cosmochim. Acta 63, 363–372. doi: 10.1016/S0016-7037(98)00279-8
Allen, R., Carter, A., Najman, Y., Bandopadhyay, P. C., Chapman, H. J., Bickle, M. J., et al. (2008a). “New constraints on the sedimentation and uplift history of the Andaman-Nicobar accretionary prism, South Andaman Island,” Special Paper 436: Formation and Applications of the Sedimentary Record in Arc Collision Zones. Geological Society of America, Boulder, CL, 223–255. doi: 10.1130/2008.2436(11
Allen, R., Najman, Y., Carter, A., Barfod, D., Bickle, M. J., Chapman, H. J., et al. (2008b). Provenance of the Tertiary sedimentary rocks of the Indo-Burman Ranges, Burma (Myanmar): Burman arc or Himalayan-derived? J. Geol. Soc. 165, 1045–1057. doi: 10.1144/0016-76492007-143
Amakawa, H., Alibo, D. S., and Nozaki, Y. (2000). Nd isotopic composition and REE pattern in the surface waters of the eastern Indian Ocean and its adjacent seas. Geochim. Cosmochim. Acta 64, 1715–1727. doi: 10.1016/S0016-7037(00)00333-1
Bau, M. (1996). Controls on the fractionation of isovalent trace elements in magmatic and aqueous systems: evidence from Y/Ho. Zr/Hf, and lanthanide tetrad effect. Contrib. Mineral. Petrol. 123, 323–333. doi: 10.1007/s004100050159
Bau, M. (1999). Scavenging of dissolved yttrium and rare earths by precipitating iron oxyhydroxide: experimental evidence for Ce oxidation. Y-Ho fractionation, and lanthanide tetrad effect. Geochim. Cosmochim. Acta 63, 67–77. doi: 10.1016/S0016-7037(99)00014-9
Bertram, C. J., and Elderfield, H. (1993). The geochemical balance of the rare earth elements and neodymium isotopes in the oceans. Geochim. Cosmochim. Acta 57, 1957–1986. doi: 10.1016/0016-7037(93)90087-D
Byrne, R. H., Lee, J. H., and Bingler, L. S. (1991). Rare earth element complexation by PO43- ions in aqueous solution. Geochim. Cosmochim. Acta 55, 2729–2735. doi: 10.1016/0016-7037(91)90439-C
Cantrell, K. J., and Byrne, R. H. (1987). Rare earth element complexation by carbonate and oxalate ions. Geochim. Cosmochim. Acta 51, 597–605. doi: 10.1016/0016-7037(87)90072-X
Chaitanya, A. V. S., Durand, F., Mathew, S., Gopalakrishna, V. V., Papa, F., Lengaigne, M., et al. (2015). Observed year-to-year sea surface salinity variability in the Bay of Bengal during the 2009–2014 period. Ocean Dyn. 65, 173–186. doi: 10.1007/s10236-014-0802-x
Chatterjee, A., Shankar, D., McCreary, J. P., Vinayachandran, P. N., and Mukherjee, A. (2017). Dynamics of Andaman Sea circulation and its role in connecting the equatorial Indian Ocean to the Bay of Bengal. J. Geophys. Res. 122, 3200–3218. doi: 10.1002/2016JC012300
Chatterjee, A., Shankar, D., Shenoi, S. S. C., Reddy, G. V., Michael, G. S., Ravichandran, M., et al. (2012). A new atlas of temperature and salinity for the North Indian Ocean. J. Earth Syst. Sci. 121, 559–593. doi: 10.1007/s12040-012-0191-9
Colin, C., Turpin, L., Bertaux, J., Desprairies, A., and Kissel, C. (1999). Erosional history of the Himalayan and Burman ranges during the last two glacial–interglacial cycles. Earth Planet. Sci. Lett. 171, 647–660. doi: 10.1016/S0012-821X(99)00184-3
Curray, J. R., Emmel, F. J., and Moore, D. G. (2002). The Bengal Fan: morphology, geometry, stratigraphy, history and processes. Mar. Petrol. Geol. 19, 1191–1223. doi: 10.1016/S0264-8172(03)00035-7
Dai, A., Qian, T., Trenberth, K. E., and Milliman, J. D. (2009). Changes in continental freshwater discharge from 1948 to 2004. J. Clim. 22, 2773–2792. doi: 10.1175/2008JCLI2592.1
Damodararao, K., Singh, S. K., Rai, V. K., Ramaswamy, V., and Rao, P. S. (2016). Lithology, monsoon and sea-surface current control on provenance, dispersal and deposition of sediments over the andaman continental shelf. Front. Mar. Sci. 3:118. doi: 10.3389/fmars.2016.00118
Durand, F., Papa, F., Rahman, A., and Bala, S. K. (2011). Impact of Ganges–Brahmaputra interannual discharge variations on Bay of Bengal salinity and temperature during 1992–1999 period. J. Earth Syst. Sci. 120, 859–872. doi: 10.1007/s12040-011-0118-x
Elderfield, H. (1988). The oceanic chemistry of the rare-earth elements. Philos. Trans. R. Soc. Lond. A 325:105. doi: 10.1098/rsta.1988.0046
Elderfield, H., Upstill-Goddard, R., and Sholkovitz, E. R. (1990). The rare earth elements in rivers, estuaries, and coastal seas and their significance to the composition of ocean waters. Geochim. Cosmochim. Acta 54, 971–991. doi: 10.1016/0016-7037(90)90432-K
Fasullo, J., and Webster, P. J. (2003). A hydrological definition of indian monsoon onset and withdrawal. J. Climate 16, 3200–3211. doi: 10.1175/1520-04422003016
Frank, M. (2002). Radiogenic isotopes: tracers of past ocean circulation and erosional input. Rev. Geophys. 40:1-1-1-38
Freslon, N., Bayon, G., Toucanne, S., Bermell, S., Bollinger, C., Chéron, S., et al. (2014). Rare earth elements and neodymium isotopes in sedimentary organic matter. Geochim. Cosmochim. Acta 140, 177–198. doi: 10.1016/j.gca.2014.05.016
Gadgil, S., and Gadgil, S. (2006). The Indian monsoon, GDP and agriculture. Econom. Polit. Weekly 4887, 4889–4895.
Garzanti, E., Limonta, M., Resentini, A., Bandopadhyay, P. C., Najman, Y., Andò, S., et al. (2013). Sediment recycling at convergent plate margins (Indo-Burman ranges and Andaman–Nicobar ridge). Earth Sci. Rev. 123, 113–132. doi: 10.1016/j.earscirev.2013.04.008
Giosan, L., Naing, T., Min Tun, M., Clift, P. D., Filip, F., Constantinescu, S., et al. (2018). On the Holocene evolution of the Ayeyawady megadelta. Earth Surf. Dyn. 6, 451–466. doi: 10.5194/esurf-6-451-2018
Girishkumar, M. S., Ravichandran, M., and McPhaden, M. J. (2013). Temperature inversions and their influence on the mixed layer heat budget during the winters of 2006–2007 and 2007–2008 in the Bay of Bengal. J. Geophys. Res. Oceans 118, 3336–3349. doi: 10.1002/jgrc.20192
Girishkumar, M. S., Ravichandran, M., McPhaden, M. J., and Rao, R. R. (2011). Intraseasonal variability in barrier layer thickness in the south central Bay of Bengal. J. Geophys. Res 116:3009. doi: 10.1029/2010JC006657
Goldstein, S. J., and Jacobsen, S. B. (1987). The Nd and Sr isotopic systematics of river-water dissolved material: implications for the sources of Nd and Sr in seawater. Chem. Geol. 66, 245–272. doi: 10.1016/0168-9622(87)90045-5
Goldstein, S. J., and Jacobsen, S. B. (1988a). Nd and Sr isotopic systematics of river water suspended material: implications for crustal evolution. Earth Planet. Sci. Lett. 87, 249–265. doi: 10.1016/0012-821X(88)90013-1
Goldstein, S. J., and Jacobsen, S. B. (1988b). Rare earth elements in river waters. Earth Planet. Sci. Lett. 89, 35–47. doi: 10.1016/0012-821X(88)90031-3
Grasse, P., Bosse, L., Hathorne, E. C., Böning, P., Pahnke, K., and Frank, M. (2017). Short-term variability of dissolved rare earth elements and neodymium isotopes in the entire water column of the Panama Basin. Earth Planet. Sci. Lett. 475, 242–253. doi: 10.1016/j.epsl.2017.07.022
Hannigan, R. E., and Sholkovitz, E. R. (2001). The development of middle rare earth element enrichments in freshwaters: weathering of phosphate minerals. Chem. Geol. 175, 495–508. doi: 10.1016/S0009-2541(00)00355-7
Hathorne, E. C., Haley, B., Stichel, T., Grasse, P., Zieringer, M., and Frank, M. (2012). Online preconcentration ICP-MS analysis of rare earth elements in seawater. Geochem. Geophys. Geosyst. 13:Q01020. doi: 10.1029/2011GC003907
Hathorne, E. C., Stichel, T., Brück, B., and Frank, M. (2015). Rare earth element distribution in the Atlantic sector of the Southern Ocean: the balance between particle scavenging and vertical supply. Mar. Chem. 177, 157–171. doi: 10.1016/j.marchem.2015.03.011
Hoyle, J., Elderfield, H., Gledhill, A., and Greaves, M. (1984). The behaviour of the rare earth elements during mixing of river and sea waters. Geochim. Cosmochim. Acta 48, 143–149. doi: 10.1016/0016-7037(84)90356-9
Jian, J., Webster, P. J., and Hoyos, C. D. (2009). Large-scale controls on Ganges and Brahmaputra river discharge on intraseasonal and seasonal time-scales. Q. J. R. Meteorol. Soc. 135, 353–370. doi: 10.1002/qj.384
Jochum, K. P., Nohl, U., Herwig, K., Lammel, E., Stoll, B., and Hofmann, A. W. (2005). GeoReM: a new geochemical database for reference materials and isotopic standards. Geostand. Geoanalyt. Res. 29, 333–338. doi: 10.1111/j.1751-908X.2005.tb00904.x
Kiran Kumar, P., Singh, A., and Ramesh, R. (2018). Controls on δ18O, δD and δ18O-salinity relationship in the northern Indian Ocean. Mar. Chem. 207, 55–62. doi: 10.1016/j.marchem.2018.10.010
Kraft, S., Frank, M., Hathorne, E. C., and Weldeab, S. (2013). Assessment of seawater Nd isotope signatures extracted from foraminiferal shells and authigenic phases of Gulf of Guinea sediments. Geochim. Cosmochim. Acta 121, 414–435. doi: 10.1016/j.gca.2013.07.029
Krishna Kumar, K., Rupa Kumar, K., Ashrit, R. G., Deshpande, N. R., and Hansen, J. W. (2004). Climate impacts on Indian agriculture. Int. J. Climatol. 24, 1375–1393. doi: 10.1002/joc.1081
Kurian, S., Nath, B. N., Ramaswamy, V., Naman, D., Gnaneshwar Rao, T., Kamesh Raju, K. A., et al. (2008). Possible detrital, diagenetic and hydrothermal sources for Holocene sediments of the Andaman backarc basin. Mar. Geol. 247, 178–193. doi: 10.1016/j.margeo.2007.09.006
Lacan, F., Tachikawa, K., and Jeandel, C. (2012). Neodymium isotopic composition of the oceans: a compilation of seawater data. Chem. Geol. 30, 177–184. doi: 10.1016/j.chemgeo.2012.01.019
Laukert, G., Frank, M., Bauch, D., Hathorne, E. C., Rabe, B., von Appen, W.-J., et al. (2017). Ocean circulation and freshwater pathways in the Arctic Mediterranean based on a combined Nd isotope. REE and oxygen isotope section across Fram Strait. Geochim. Cosmochim. Acta 202, 285–309. doi: 10.1016/j.gca.2016.12.028
Liu, Y., Lo, L., Shi, Z., Wei, K.-Y., Chou, C.-J., Chen, Y.-C., et al. (2015). Obliquity pacing of the western Pacific Intertropical Convergence Zone over the past 282,000 years. Nat. Commun. 6:10018. doi: 10.1038/ncomms10018
Mahowald, N. M., Baker, A. R., Bergametti, G., Brooks, N., Duce, R. A., Jickells, T. D., et al. (2005). Atmospheric global dust cycle and iron inputs to the ocean. Glob. Biogeochem. Cycles 19:GB4025. doi: 10.1029/2004GB002402
McNeill, L. C., Dugan, B., Backman, J., Pickering, K. T., Pouderoux, H. F. A., Henstock, T. J., et al. (2017). Understanding Himalayan erosion and the significance of the Nicobar Fan. Earth Planet. Sci. Lett. 475, 134–142. doi: 10.1016/j.epsl.2017.07.019
Merschel, G., Bau, M., and Dantas, E. L. (2017a). Contrasting impact of organic and inorganic nanoparticles and colloids on the behavior of particle-reactive elements in tropical estuaries: an experimental study. Geochim. Cosmochim. Acta 197, 1–13. doi: 10.1016/j.gca.2016.09.041
Merschel, G., Bau, M., Schmidt, K., Münker, C., and Dantas, E. L. (2017b). Hafnium and neodymium isotopes and REY distribution in the truly dissolved, nanoparticulate/colloidal and suspended loads of rivers in the Amazon Basin. Brazil. Geochim. Cosmochim. Acta 213, 383–399. doi: 10.1016/j.gca.2017.07.006
Milliman, J. D., and Syvitski, J. P. M. (1992). Geomorphic/tectonic control of sediment discharge to the ocean: the importance of small mountainous rivers. J. Geol. 100, 525–544. doi: 10.1086/629606
Moffett, J. W. (1994). The relationship between cerium and manganese oxidation in the marine environment. Limnol. Oceanogr. 39, 1309–1318. doi: 10.4319/lo.1994.39.6.1309
Nance, W., and Taylor, S. (1976). Rare earth element patterns and crustal evolution—I. Australian post-Archean sedimentary rocks. Geochim. Cosmochim. Acta 40, 1539–1551. doi: 10.1016/0016-7037(76)90093-4
Nilsson-Kerr, K., Anand, P., Sexton, P. F., Leng, M. J., Misra, S., Clemens, S. C., et al. (2019). Role of Asian summer monsoon subsystems in the inter-hemispheric progression of deglaciation. Nat. Geosci. 12, 290–295. doi: 10.1038/s41561-019-0319-5
Nozaki, Y., and Alibo, D. S. (2003). Importance of vertical geochemical processes in controlling the oceanic profiles of dissolved rare earth elements in the northeastern Indian Ocean. Earth Planet. Sci. Lett. 205, 155–172. doi: 10.1016/s0012-821x(02)01027-0
Nozaki, Y., Zhang, J., and Amakawa, H. (1997). The fractionation between Y and Ho in the marine environment. Earth. Planet. Sci. Lett. 148, 329–340. doi: 10.1016/S0012-821X(97)00034-4
Osborne, A. H., Haley, B. A., Hathorne, E. C., Plancherel, Y., and Frank, M. (2015). Rare earth element distribution in Caribbean seawater: continental inputs versus lateral transport of distinct REE compositions in subsurface water masses. Mar. Chem. 177, 172–183. doi: 10.1016/j.marchem.2015.03.013
Osborne, A. H., Hathorne, E. C., Schijf, J., Plancherel, Y., Böning, P., and Frank, M. (2017). The potential of sedimentary foraminiferal rare earth element patterns to trace water masses in the past. Geochem. Geophys. Geosyst. 18, 1550–1568. doi: 10.1002/2016GC006782
Pal, T., Gupta, T. D., Chakraborty, P. P., and Gupta, S. C. D. (2005). Pyroclastic deposits of Mio-Pliocene age in the Arakan Yoma-Andaman-Java subduction complex, Andaman Islands, Bay of Bengal, India. Geochem. J. 39, 69–82. doi: 10.2343/geochemj.39.69
Pant, V., Girishkumar, M. S., Udaya Bhaskar, T. V. S., Ravichandran, M., Papa, F., and Thangaprakash, V. P. (2015). Observed interannual variability of near-surface salinity in the Bay of Bengal: salinity variability in the BoB. J. Geophys. Res. 120, 3315–3329. doi: 10.1002/2014JC010340
Quinn, K. A., Byrne, R. H., and Schijf, J. (2006). Sorption of yttrium and rare earth elements by amorphous ferric hydroxide: Influence of solution complexation with carbonate. Geochim. Cosmochim. Acta 70, 4151–4165. doi: 10.1016/j.gca.2006.06.014
Ramaswamy, V., Rao, P., Rao, K., Thwin, S., Rao, N. S., and Raiker, V. (2004). Tidal influence on suspended sediment distribution and dispersal in the northern Andaman Sea and Gulf of Martaban. Mar. Geol. 208, 33–42. doi: 10.1016/j.margeo.2004.04.019
Rengarajan, R., and Sarin, M. M. (2004). Distribution of rare earth elements in the Yamuna and the Chambal rivers. India. Geochem. J. 38, 551–569. doi: 10.2343/geochemj.38.551
Rizal, S., Damm, P., Wahid, M. A., Sundermann, J., Ilhamsyah, Y., Iskandar, T., et al. (2012). General circulation in the Malacca Strait and Andaman Sea: a numerical model study. Am. J. Environ. Sci. 8, 479–488. doi: 10.3844/ajessp.2012.479.488
Roberts, N. L., Piotrowski, A. M., Elderfield, H., Eglinton, T. I., and Lomas, M. W. (2012). Rare earth element association with foraminifera. Geochim. Cosmochim. Acta 94, 57–71. doi: 10.1016/j.gca.2012.07.009
Roberts, N. L., Piotrowski, A. M., McManus, J. F., and Keigwin, L. D. (2010). Synchronous deglacial overturning and water mass source changes. Science 327, 75–78. doi: 10.1126/science.1178068
Rousseau, T. C. C., Sonke, J. E., Chmeleff, J., van Beek, P., Souhaut, M., Boaventura, G., et al. (2015). Rapid neodymium release to marine waters from lithogenic sediments in the Amazon estuary. Nat. Commun. 6:8592. doi: 10.1038/ncomms8592
Saha, N., Webb, G. E., and Zhao, J.-X. (2016). Coral skeletal geochemistry as a monitor of inshore water quality. Sci. Total Environ. 56, 652–684. doi: 10.1016/j.scitotenv.2016.05.066
Sarkar, S., and Ghosh, A. K. (2013). Coral bleaching a nemesis for the Andaman reefs: building an improved conservation paradigm. Ocean Coast. Manag. 71, 153–162. doi: 10.1016/j.ocecoaman.2012.09.010
Sarkar, S., and Ghosh, A. K. (2015). Evaluation of coralline algal diversity from the Serravallian carbonate sediments of Little Andaman Island (Hut Bay). India. Carbonates Evaporites 30, 13–24. doi: 10.1007/s13146-014-0190-9
Schlosser, C., Schmidt, K., Aquilina, A., Homoky, W. B., Castrillejo, M., Mills, R. A., et al. (2018). Mechanisms of dissolved and labile particulate iron supply to shelf waters and phytoplankton blooms off South Georgia. Southern Ocean. Biogeosciences 15, 4973–4993. doi: 10.5194/bg-15-4973-2018
Sengupta, D., Bharath Raj, G. N., Ravichandran, M., Sree Lekha, J., and Papa, F. (2016). Near-surface salinity and stratification in the north Bay of Bengal from moored observations: salinity in the North Bay of Bengal. Geophys. Res. Lett. 43, 4448–4456. doi: 10.1002/2016GL068339
Sengupta, D., Bharath Raj, G. N., and Shenoi, S. S. C. (2006). Surface freshwater from Bay of Bengal runoff and Indonesian throughflow in the tropical Indian Ocean. Geophys. Res. Lett. 33, 1–7. doi: 10.1029/2006GL027573
Shaman, J., Cane, M., and Kaplan, A. (2005). The relationship between Tibetan snow depth. ENSO, river discharge and the monsoons of Bangladesh. Int. J. Remote Sens. 26, 3735–3748. doi: 10.1080/01431160500185599
Shiller, A. M. (2002). Seasonality of dissolved rare earth elements in the lower Mississippi River. Geochem. Geophys. Geosyst. 3, 1–14. doi: 10.1029/2002GC000372
Sholkovitz, E., and Szymczak, R. (2000). The estuarine chemistry of rare earth elements: comparison of the Amazon. Fly, Sepik and the Gulf of Papua systems. Earth Planet. Sci. Lett. 179, 299–309. doi: 10.1016/S0012-821X(00)00112-6
Sholkovitz, E. R. (1995). The aquatic chemistry of rare earth elements in rivers and estuaries. Aquatic Geochem. 1, 1–34. doi: 10.1007/BF01025229
Sholkovitz, E. R., Church, T. M., and Arimoto, R. (1993). Rare Earth element composition of precipitation, precipitation particles, and aerosols. J. Geophys. Res. 98:20587. doi: 10.1029/93JD01926
Sholkovitz, E. R., and Elderfield, H. (1988). Cycling of dissolved rare earth elements in Chesapeake Bay. Glob. Biogeochem. Cycles 2, 157–176. doi: 10.1029/GB002i002p00157
Sholkovitz, E. R., Landing, W. M., and Lewis, B. L. (1994). Ocean particle chemistry: the fractionation of rare earth elements between suspended particles and seawater. Geochim. Cosmochim. Acta 58, 1567–1579. doi: 10.1016/0016-7037(94)90559-2
Singh, S. K., and France-Lanord, C. (2002). Tracing the distribution of erosion in the Brahmaputra watershed from isotopic compositions of stream sediments. Earth Planet. Sci. Lett. 202, 645–662. doi: 10.1016/S0012-821X(02)00822-1
Singh, S. P., Singh, S. K., Goswami, V., Bhushan, R., and Rai, V. K. (2012). Spatial distribution of dissolved neodymium and εNd in the Bay of Bengal: role of particulate matter and mixing of water masses. Geochim. Cosmochim. Acta 94, 38–56. doi: 10.1016/j.gca.2012.07.017
Skinner, L. C., Sadekov, A., Brandon, M., Greaves, M., Plancherel, Y., de la Fuente, M., et al. (2019). Rare Earth Elements in early-diagenetic foraminifer ‘coatings’: pore-water controls and potential palaeoceanographic applications. Geochim. Cosmochim. Acta 245, 118–132. doi: 10.1016/j.gca.2018.10.027
Srinivas, B., and Sarin, M. M. (2013). Atmospheric dry-deposition of mineral dust and anthropogenic trace metals to the Bay of Bengal. J. Mar. Syst. 126, 56–68. doi: 10.1016/j.jmarsys.2012.11.004
Stichel, T., Frank, M., Rickli, J., and Haley, B. A. (2012). The hafnium and neodymium isotope composition of seawater in the Atlantic sector of the Southern Ocean. Earth Planet. Sci. Lett. 31, 282–294. doi: 10.1016/j.epsl.2011.11.025
Tachikawa, K., Jeandel, C., and Roy-Barman, M. (1999). A new approach to the Nd residence time in the ocean: the role of atmospheric inputs. Earth Planet. Sci. Lett. 170, 433–446. doi: 10.1016/S0012-821X(99)00127-2
Tachikawa, K., Toyofuku, T., Basile-Doelsch, I., and Delhaye, T. (2013). Microscale neodymium distribution in sedimentary planktonic foraminiferal tests and associated mineral phases. Geochim. Cosmochim. Acta 100, 11–23. doi: 10.1016/j.gca.2012.10.010
Tanaka, T., Togashi, S., Kamioka, H., Amakawa, H., Kagami, H., Hamamoto, T., et al. (2000). JNdi-1: a neodymium isotopic reference in consistency with LaJolla neodymium. Chem. Geol. 168, 279–281. doi: 10.1016/S0009-2541(00)00198-4
Tang, J., and Johannesson, K. H. (2010). Ligand extraction of rare earth elements from aquifer sediments: implications for rare earth element complexation with organic matter in natural waters. Geochim. Cosmochim. Acta 74, 6690–6705. doi: 10.1016/j.gca.2010.08.028
Thadathil, P., Muraleedharan, P. M., Rao, R. R., Somayajulu, Y. K., Reddy, G. V., and Revichandran, C. (2007). Observed seasonal variability of barrier layer in the Bay of Bengal. J Geophys. Res. 112:C02009
Turner, A. G., and Annamalai, H. (2012). Climate change and the South Asian summer monsoon. Nat. Climate Change 2, 587–595. doi: 10.1038/nclimate1495
Unger, D., Ittekkot, V., Schäfer, P., Tiemann, J., and Reschke, S. (2003). Seasonality and interannual variability of particle fluxes to the deep Bay of Bengal: influence of riverine input and oceanographic processes. Deep Sea Res. Part II 50, 897–923. doi: 10.1016/S0967-0645(02)00612-4
van de Flierdt, T., Griffiths, A. M., Lambelet, M., Little, S. H., Stichel, T., and Wilson, D. J. (2016). Neodymium in the oceans: a global database, a regional comparison and implications for palaeoceanographic research. Philos. Trans. R. Soc. A 374, 20150293. doi: 10.1098/rsta.2015.0293
van de Flierdt, T., Pahnke, K., Amakawa, H., Andersson, P., Basak, C., Coles, B., et al. (2012). GEOTRACES intercalibration of neodymium isotopes and rare earth element concentrations in seawater and suspended particles. Part 1: reproducibility of results for the international intercomparison: intercalibration of Seawater Nd Isotopes. Limnol. Oceanogr. 10, 234–251. doi: 10.4319/lom.2012.10.234
van Geldern, R., and Barth, J. A. C. (2012). Optimization of instrument setup and post-run corrections for oxygen and hydrogen stable isotope measurements of water by isotope ratio infrared spectroscopy (IRIS): water stable isotope analysis with IRIS. Limnol. Oceanogr. 10, 1024–1036. doi: 10.4319/lom.2012.10.1024
Varkey, M. J., Murty, V. S. N., and Suryanarayana, A. (1996). Physical oceanography of the Bay of Bengal and Andaman Sea. Oceanogr. Mar. Biol. 34, 1–70.
Wyndham, T., McCulloch, M., Fallon, S., and Alibert, C. (2004). High-resolution coral records of rare earth elements in coastal seawater: biogeochemical cycling and a new environmental proxy. Geochim. Cosmochim. Acta 68, 2067–2080. doi: 10.1016/j.gca.2003.11.004
Yu, Z., Colin, C., Douville, E., Meynadier, L., Duchamp-Alphonse, S., Sepulcre, S., et al. (2017a). Yttrium and rare earth element partitioning in seawaters from the Bay of Bengal. Geochem. Geophys. Geosyst. 18, 1388–1403. doi: 10.1002/2016GC006749
Keywords: yttrium and lanthanides, Bay of Bengal, Andaman Island, Nd isotope composition, river seasonality
Citation: Hathorne EC, Frank M and Mohan PM (2020) Rare Earth Elements in Andaman Island Surface Seawater: Geochemical Tracers for the Monsoon? Front. Mar. Sci. 6:767. doi: 10.3389/fmars.2019.00767
Received: 01 December 2018; Accepted: 27 November 2019;
Published: 09 January 2020.
Edited by:
Catherine Jeandel, UMR 5566 Laboratoire d’Études en Géophysique et Océanographie Spatiales (LEGOS), FranceReviewed by:
Johan Schijf, University of Maryland Center for Environmental Science (UMCES), United StatesGermain Bayon, Institut Français de Recherche pour l’Exploitation de la Mer (IFREMER), France
Ester Garcia-Solsona, University of Barcelona, Spain
Copyright © 2020 Hathorne, Frank and Mohan. This is an open-access article distributed under the terms of the Creative Commons Attribution License (CC BY). The use, distribution or reproduction in other forums is permitted, provided the original author(s) and the copyright owner(s) are credited and that the original publication in this journal is cited, in accordance with accepted academic practice. No use, distribution or reproduction is permitted which does not comply with these terms.
*Correspondence: Ed C. Hathorne, ZWhhdGhvcm5lQGdlb21hci5kZQ==