 Ruo-Jin Yan
 Kareen E. Schnabel
 Ashley A. Rowden
 Xiang-Zhao Guo1
 Jonathan P. A. Gardner
- 1School of Biological Sciences, Victoria University of Wellington, Wellington, New Zealand
- 2National Institute of Water and Atmospheric Research, Wellington, New Zealand
Studies of genetic diversity and population genetic structure in deep-sea fauna mainly focus on vulnerable marine ecosystem (VME) indicator taxa, whilst relatively few studies have focussed on VME-associated taxa whose distributions are not exclusively limited to VMEs. Knowledge of genetic connectivity (gene flow) amongst populations of VME-associated taxa, such as squat lobsters, will contribute to ongoing management decision-making related to the protection of VMEs. To better understand the genetic diversity and genetic structure of squat lobster populations (Munida isos, Munida endeavourae and Munida gracilis) at different spatial scales (biogeographic provinces, regions and geomorphic features) in the southwest Pacific Ocean, mitochondrial cytochrome c oxidase subunit I (COI) region and nuclear microsatellite markers were employed. Overall, the levels of genetic diversity were high for the COI region and moderate for the microsatellite loci across the three Munida species. Analysis of molecular variance (AMOVA) of COI variation revealed no significant genetic differentiation, whereas AMOVA of microsatellite variation revealed significant genetic differentiation amongst the three species, but at different spatial scales. Based on microsatellite variation, a range of analyses [Structure, principal coordinate analysis (PCoA), discriminant analysis of principal components (DAPC)] provided some evidence of limited genetic differentiation at different spatial scales across the three species. Low to moderate levels of assignment success (∼40–60%) based on microsatellite variation were achieved for the three Munida species, suggesting high levels of gene flow and possible panmixia. Nonetheless, for M. isos, populations from the Tasmanian slope were genetically differentiated from all other populations and may act as source populations, whereas populations from the Kermadec Ridge region may be sink populations for all three Munida species. Our results highlight the need to consider gene flow at trans-national scales when managing anthropogenic impacts on VMEs. The results are discussed in the context of existing marine protected areas (MPAs), which can contribute new information useful to the management of VMEs within the southwest Pacific Ocean.
Introduction
The deep sea is the largest ecosystem on earth, encompassing more than 90% of the global ocean area (Ramirez-Llodra et al., 2010; Taylor and Roterman, 2017). It harbours a wide range of marine ecosystem services with unique abiotic and biological characteristics that support a rich diversity of life (Ramirez-Llodra et al., 2010). For several decades, considerable attention has been paid to the ongoing declines in marine biodiversity caused by pressures including environmental change, pollution and human exploitation (Pandolfi et al., 2003; Ramirez-Llodra et al., 2011; Cordes et al., 2016). Consequently, international agreement on the need for marine protected areas (MPAs) has been reached (Food and Agricultural Organisation of the United Nations, 2009) that is widely acknowledged to be an important step to help reduce anthropogenic impacts on biodiversity (Leathwick et al., 2008; Gjerde et al., 2016).
Vulnerable marine ecosystems (VMEs), including seamounts, canyons, hydrothermal vent and cold seep habitats, as well as cold-water coral reefs and sponge beds, are vulnerable to the impact of intense or long-term anthropogenic activities, in particular to bottom trawling (Food and Agricultural Organisation of the United Nations, 2009). There is now increasing awareness that VMEs need protection from anthropogenic activities such as trawling that have been carried out for decades, but also from future activities such as mining which may commence in the near future (e.g. Beger et al., 2014; Boschen et al., 2016; van Dover et al., 2018). MPAs provide a means to restrict damaging human activities and thereby allow for the conservation of critical natural habitats such as VMEs, which can help facilitate the maintenance and restoration of biodiversity and ecosystem structure and function (Agardy, 1994; Clark et al., 2011). Given that population declines can lead to reduced individual fitness, reduced population resilience and possible eventual extinction, an understanding of the population connectivity of VME indicator taxa is useful for informing the design and implementation of MPAs, for assessing the effectiveness of existing MPAs and for improving the management and mitigation of impacts on VMEs (Palumbi, 2003; Miller and Gunasekera, 2017).
The presence of a VME can be indicated by taxa that form a VME, e.g. coral species that form complex reef habitats (refer to Parker et al., 2009 for the South Pacific Ocean and Parker and Bowden, 2010 for the Southern Ocean and Antarctica). Whilst there are numerous studies examining the population structure of VME indicator taxa (e.g. in the southwest Pacific Ocean—Miller et al., 2010, 2011; Herrera et al., 2012; Miller and Gunasekera, 2017; Zeng et al., 2017; Holland et al., 2019; Zeng et al., 2019), relatively few studies have focussed on VME-associated taxa whose distributions are not exclusively limited to VMEs but are often found together with VMEs (e.g. crinoids, brisingid seastars sensu; Parker et al., 2009). Squat lobsters are highly diverse anomuran crustaceans that are sometimes, but not always, closely associated with VMEs (e.g. coral thickets and sponge gardens) (Lumsden et al., 2007; Baba et al., 2008; Baeza, 2011). As such, squat lobsters are an abundant and ecologically important group that may provide new insights into the patterns of genetic connectivity amongst VMEs.
Using a range of different genetic markers, previous studies of population genetic structure for deep-sea squat lobsters across all or parts of their ranges have, perhaps not surprisingly, failed to reveal a consistent pattern of results. Whilst several different studies have reported no genetic population differentiation (e.g. Samadi et al., 2006; Haye et al., 2010; Bors et al., 2012; Cabezas et al., 2012; Roterman et al., 2016; Wang et al., 2016), others have reported evidence of limited to moderate genetic differences amongst populations (e.g. Pérez-Barros et al., 2014; Yang et al., 2016) and still others have reported no population genetic differentiation based on one marker type but population genetic differentiation based on a different marker type (e.g. Thaler et al., 2014). As VME-associated taxa, knowledge of connectivity amongst deep-sea squat lobster populations can be used to contribute to ongoing management decision-making about protection by assessing the effectiveness of existing MPAs and informing the placement of new MPAs. However, in the absence of consistent patterns of population genetic differentiation amongst squat lobster species reported in the literature, it is clear that new and region-specific assessments of genetic connectivity need to be carried out.
In the present study, the population genetic variation of three locally abundant Munida species [Munida isos (Ahyong and Poore, 2004), Munida endeavourae (Ahyong and Poore, 2004) and Munida gracilis (Henderson, 1885)] from the southwest Pacific Ocean region are investigated to better understand genetic diversity and genetic connectivity amongst VMEs. M. isos and M. endeavourae are widespread around New Zealand and south-eastern Australia where they occur from the edge of the continental shelves (∼400 m) to bathyal depths of 1800–2700 m, respectively. M. gracilis is a widespread New Zealand endemic species with a slightly shallower depth distribution of about 100–1200 m (Baba et al., 2008; Schnabel, unpublished). Munida species have free-swimming planktonic larval phases that may drift with ocean currents, but the larval dispersal strategies of these species are unknown in detail. However, it is presumed that they have similar development to other munidids which include between four and six planktotrophic zoeal larval stages and 15–83 days of larval development (Baba et al., 2011), which in turn suggests that larval dispersal over distances of 10s, if not 100s of km is likely. Munida species are associated with VMEs rather than being a functional component of VMEs as are many habitat-forming corals and sponges (Zeng et al., 2017, 2019). Squat lobsters therefore are a good choice of group to help investigate patterns of gene flow and population genetic differentiation amongst VMEs, and provide a valuable contrast to the more widely studied VME-forming groups. In conjunction, information about genetic connectivity and barriers to gene flow that may result in geographic genetic differentiation and/or genetic hotspots can be used in the planning of the placement and size of new MPAs (e.g. Miller et al., 2010, 2011; Bors et al., 2012; Miller and Gunasekera, 2017; Zeng et al., 2017, 2019; Holland et al., 2019). Based on the presumptive dispersal strategies and the known habitat preferences of these species, it is hypothesised that M. isos and M. endeavourae, which are typically found on physically isolated seamounts, will exhibit population genetic heterogeneity within the study area. In contrast, it is hypothesised that M. gracilis, which is also found on soft sediments that are generally contiguous over large areas of the deep sea, allowing greater physical movement of adults and larvae, will exhibit higher levels of population genetic homogeneity. If the connectivity of species inhabiting only seamounts differs from the connectivity of species inhabiting seamounts and non-seamount habitats, then this has implications for spatial management measures of these species across their respective ranges. We used a spatially explicit hierarchical framework to test these hypotheses, and to explore the drivers of the observed genetic connectivity patterns, to provide information that will contribute to the management of VMEs within the southwest Pacific Ocean.
Materials and Methods
Sample Collection and DNA Extraction
Specimens were obtained from the National Institute of Water and Atmospheric (NIWA) Research Invertebrate Collection (Wellington, New Zealand) and Museum Victoria (Melbourne, Australia). These were archived individuals collected mainly by scientific expeditions in the southwest Pacific Ocean since the 2000s. Most specimens were collected within the New Zealand’s Exclusive Economic Zone (EEZ), with additional samples from the south Tasman Sea within the Australian EEZ, and from the Louisville Seamount Chain, an Area Beyond National Jurisdiction, to the northeast of New Zealand’s EEZ (Figure 1). All specimens were preserved in > 80% ethanol after collection. The majority of specimens of M. isos and M. endeavourae were from seamount habitats, whilst the majority of specimens of M. gracilis were from soft sediment habitats at relatively shallower depths. Sample availability depends on collection activity at any given site with the result that our site-specific sample sizes are highly variable, but not low given these constraints. Sample details are summarised in Table 1; full details are presented in Supplementary Tables S1–S3.
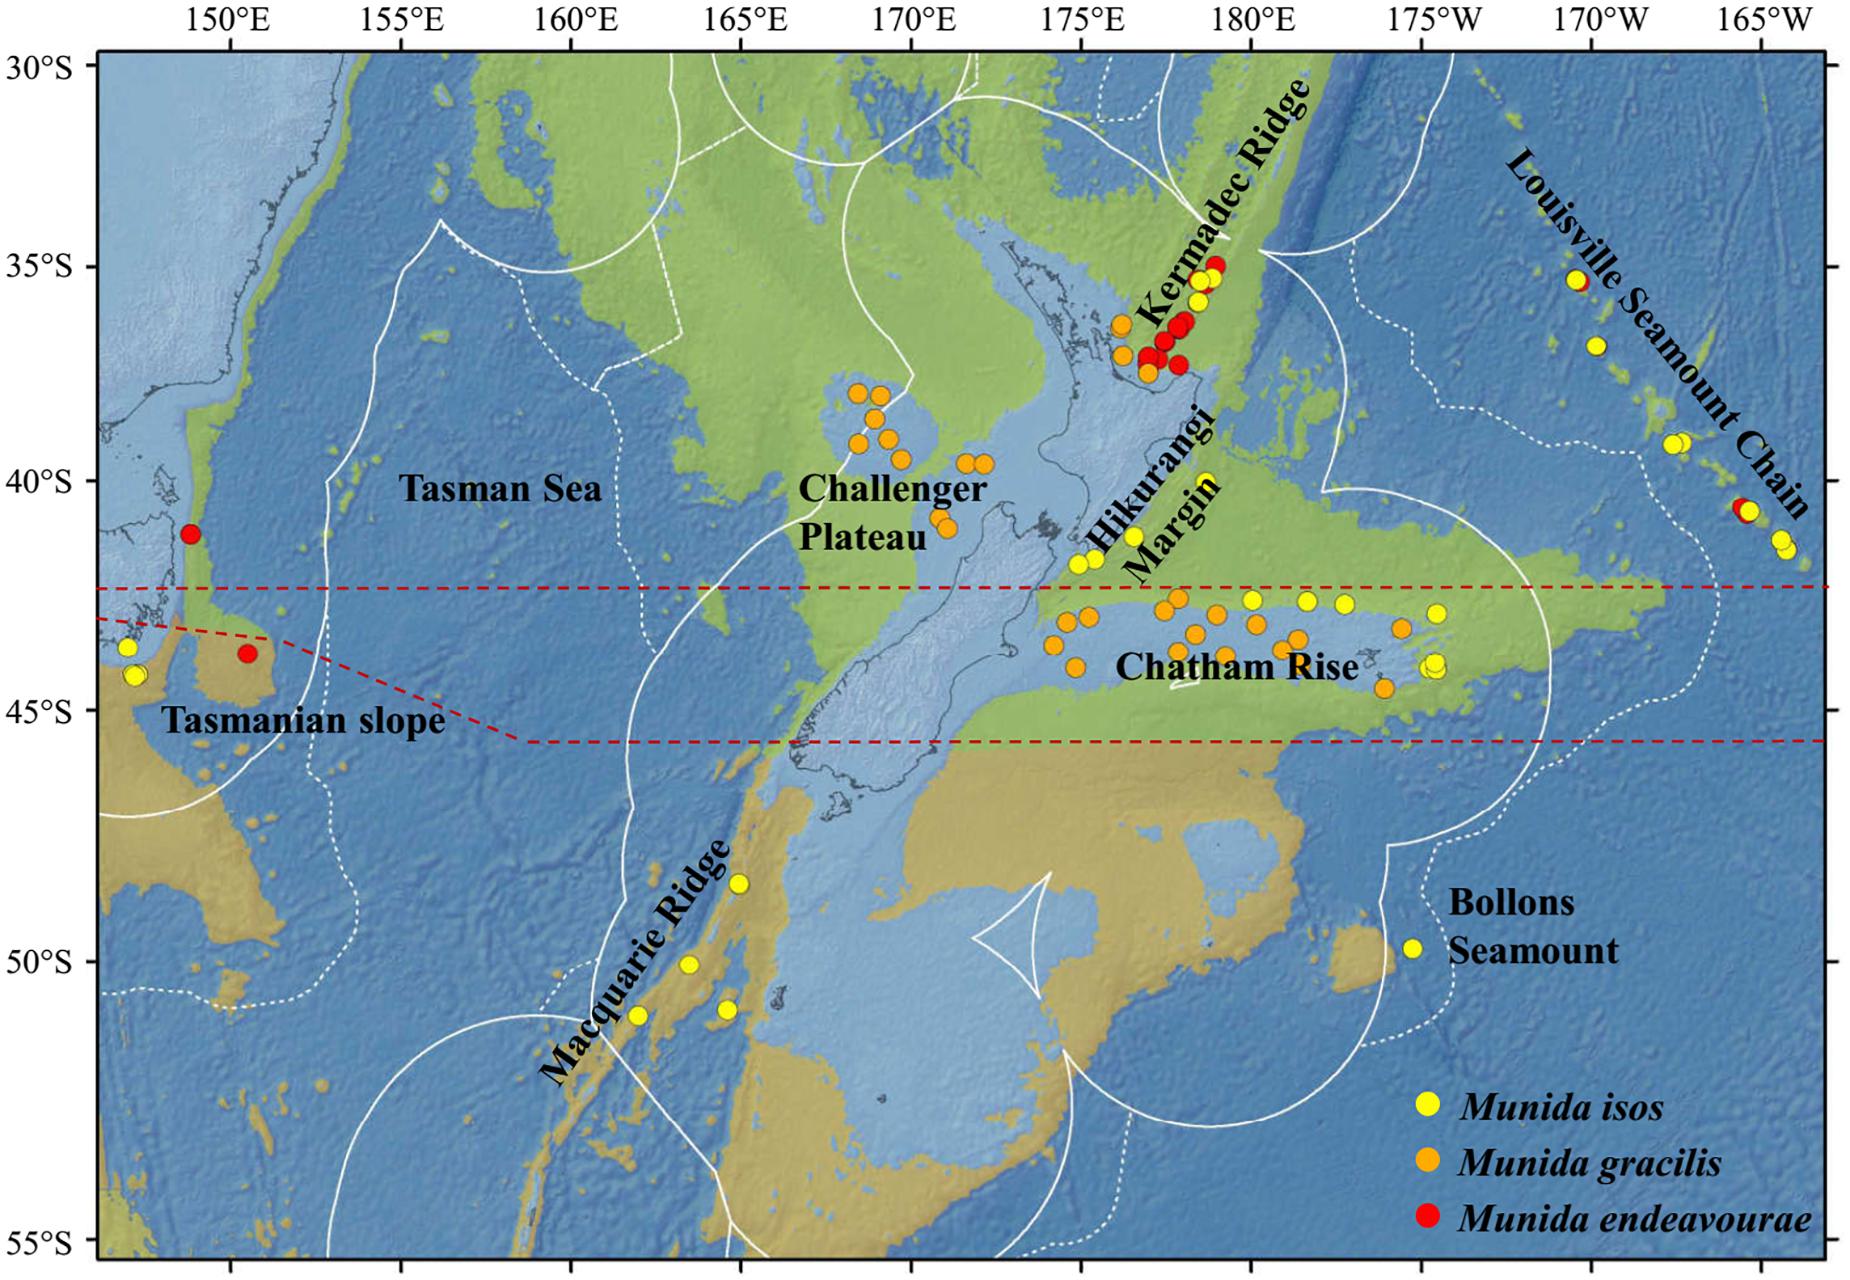
Figure 1. Map showing the locations of the samples for the study species. For Munida isos, hierarchical testing framework was employed: (1) green (northern) and khaki (southern) backgrounds indicate the two biogeographic lower bathyal provinces (BY6 and BY10) of Watling et al. (2013) in the New Zealand region; (2) red dashed lines at 42°S and approximately 45°S represent the boundaries between the North (< 42°S), Central (42°S to 45°S) and South (>45°S) regions; (3) major geomorphic features are named on the map.
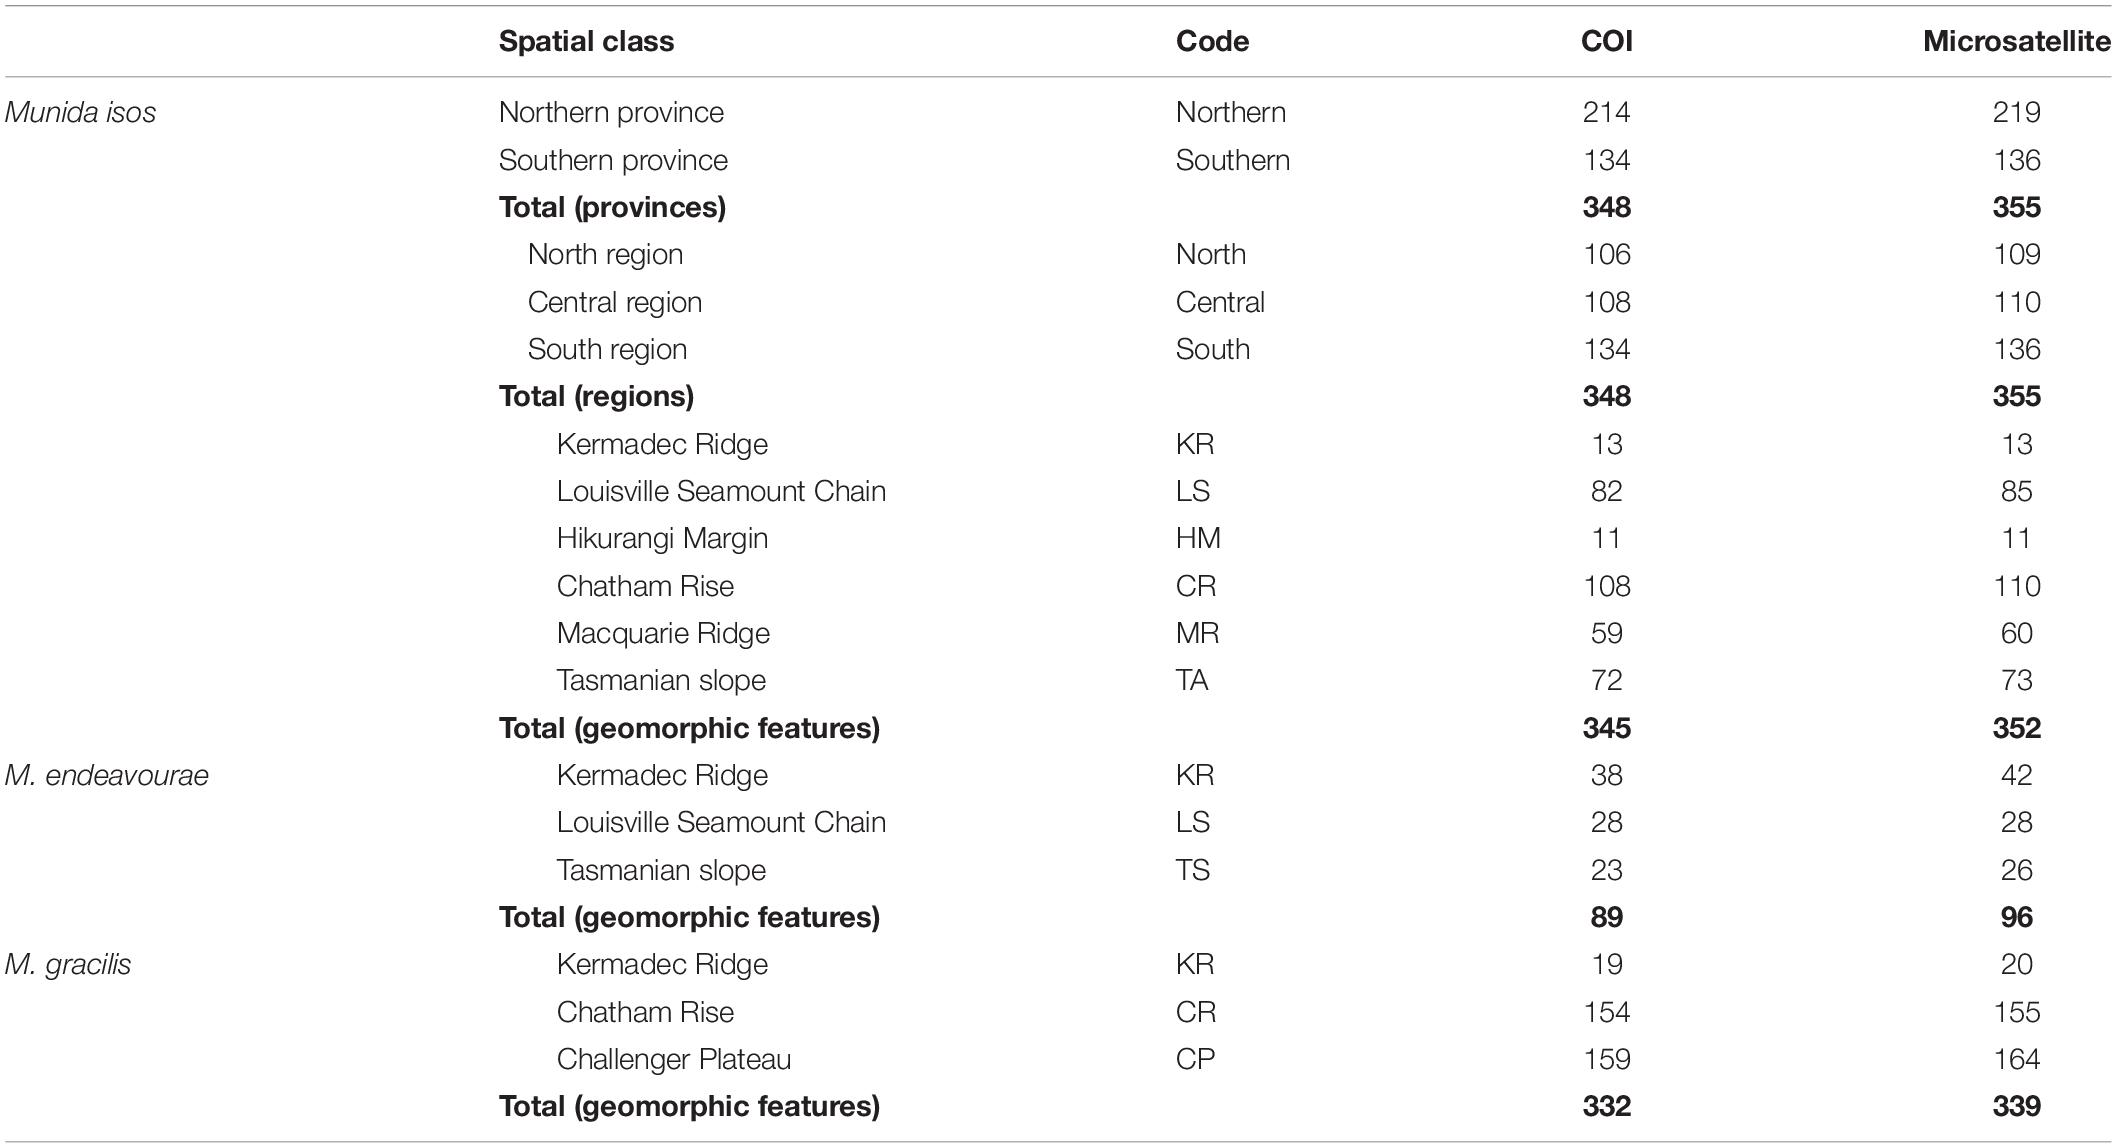
Table 1. Summary of sample sizes (N, number of specimens) for Munida isos at three spatial scales, and for M. endeavourae and M. gracilis at the geomorphic feature scale.
Abdominal muscle or pereopod tissue samples were collected and stored individually in 95% ethanol before being transferred to the laboratory, for further analysis. Whole genomic DNA was extracted using the DNeasy Blood and Tissue kit (Qiagen, Hilden, Germany) following the manufacturer’s instructions. DNA integrity and molecular weight were assessed using electrophoresis in 3% agarose gels and with a NanoPhotometer (Implen, Munich, Germany). Samples exhibiting poor quality DNA were discarded.
Squat lobster samples had previously been identified using the methods and keys described in Ahyong and Poore (2004) and Baba (2005). Species identification was further confirmed by genetic screening with GenBank accession numbers MF457406 (M. isos) and KJ544249 (M. gracilis) using the mitochondrial universal DNA barcoding primers LCO1490/HCO2198 (Folmer et al., 1994).
Data Testing Framework
For M. isos, for which there were large samples sizes and good spatial coverage, a spatially explicit hierarchical testing framework was employed to evaluate genetic differentiation amongst populations. This approach follows Zeng et al. (2017, 2019) and Holland et al. (2019).
First, samples of M. isos were assigned to the two deep, bathyal (800–3500 m), ocean floor biogeographic provinces of Watling et al. (2013); BY6, referred to here as the Northern province, and BY10 or the Southern province, with a boundary between them at approximately 45°S (Figure 1). The differential water mass characteristics (e.g. salinity, temperature and particulate organic carbon flux) of the two provinces may affect the Northern–Southern population distribution, resulting in a province-scale pattern of genetic differentiation across the study area.
Second, samples were assigned to three regions; North (north of Chatham Rise), Central (Chatham Rise) and South (south of Chatham Rise) regions (Figure 1). Subtropical Water (STW) that reaches New Zealand region via the East Australian Current and the South Pacific subtropical gyre, and Subantarctic Water (SAW) that is driven north by Ekman transport and westerly winds, meet along the Chatham Rise forming the Subtropical Front (Chiswell et al., 2015). This front may act as a barrier to pelagic larval dispersal, leading to a North–Central–South region scale pattern of genetic subdivision of populations, and a high level of genetic diversity may be expected in the Central region on the Chatham Rise where North–South population mixing may occur.
Third, samples were assigned to populations according to major geomorphic features of the seafloor in the study area: Kermadec Ridge, Louisville Seamount Chain, Hikurangi Margin, Chatham Rise, Macquarie Ridge and Tasmanian slope (Figure 1). Given the species-specific distribution and habitat requirement, the distinctive topographic and local hydrodynamic characteristics may act as barriers to gene flow (Rowden et al., 2010a, b; Zeng et al., 2017). Samples from Bollons Seamount were included in the province and region spatial scale analyses, but not in geomorphic feature scale analyses, due to the limited sample size.
For M. endeavourae and M. gracilis, due to patchy sampling site coverage, samples were only assigned to populations according to major geomorphic features for the assessment of genetic connectivity. For M. endeavourae, populations were included from the Kermadec Ridge, Louisville Seamount Chain and the Tasmanian slope. For M. gracilis, populations included those from the Kermadec Ridge, Chatham Rise and Challenger Plateau (Figure 1).
COI Sequencing and Data Analyses
The mitochondrial DNA protein encoding cytochrome c oxidase subunit I (COI) region was amplified for the three Munida species using universal invertebrate primers LCO1490 and HCO2198 (Folmer et al., 1994), yielding fragments of 649 bp in length. Reactions were performed in a 20 μL total volume containing approximately 1 μL of genomic DNA (∼30 ng/μL), 10 μL MyTaq Red Mix (Total Lab Systems Ltd., Auckland, New Zealand), 1 μL of both primers (forward and reverse) at a concentration of 10 μM and with the addition of 7 μL ddH2O. PCR amplifications for COI sequencing were carried out in a 96-well PCR Thermal Cycler (Applied Biosystems) programmed as follows: denaturation at 95°C for 5 min, followed by 40 cycles of denaturation at 95°C for 30 s, 48°C for 30 s, extension at 72°C for 45 s and a final extension at 72°C for 10 min. PCR products were visualised on a 1.5% agarose gel and then sequenced on an ABI 3730xl DNA analyser. Despite multiple attempts, some COI fragments could not be amplified for several samples. Sequences have been deposited in GenBank (MK155662–MK156049).
Cytochrome c oxidase subunit I sequences (forward strand only) were aligned in MEGA v7 (Kumar et al., 2016) following manual checking and editing using DNAStar software (Burland, 2000). Species-specific genetic diversity statistics including number of haplotypes (h), average number of nucleotide differences (K), number of segregating sites (S), haplotype diversity (Hd) and nucleotide diversity (π) were calculated using DNASP v6.11.01 (Rozas et al., 2017) and Arlequin v.3.5 (Excoffier and Lischer, 2010).
To assess hierarchical population genetic differentiation amongst squat lobster populations, the uncorrected p distances within/between regions were calculated in MEGA v7 (Kumar et al., 2016). Arlequin v.3.5 (Excoffier and Lischer, 2010) was used to perform a spatially explicit analysis of molecular variance (AMOVA) and to compute pairwise ΦST values. All groupings were evaluated with 10,000 permutations. Haplotype networks were constructed using a median-joining method in Popart (Leigh and Bryant, 2015). For each species, a maximum likelihood (ML) tree was drawn under the best-fit evolutionary model with the lowest Bayesian information criterion (BIC) score and 500 bootstraps in MEGA v7 (Kumar et al., 2016). Two species, Munida thoe (AY351013) and a yeti crab, Kiwa tyleri (KP763652), were designated as outgroups, the former being congeneric and the latter a more distantly related squat lobster. Nodes with bootstrap values > 90% were included on the final ML trees.
All analyses described above were carried out at three spatial scales (Northern–Southern provinces, North–Central–South regions and geomorphic features) for M. isos, and at the geomorphic level only for M. endeavourae and M. gracilis.
Microsatellite Genotyping and Data Analyses
From the 20 microsatellite markers described in Yan et al. (2019), 17, 11 and 9 microsatellite primer pairs were assayed for variation for M. isos, M. endeavourae and M. gracilis, respectively, based on their scoring reliability (Supplementary Table S4). Locus-specific PCR amplification conditions followed Yan et al. (2019). PCR products were run alongside a LIZ500 internal size standard on an ABI 3730xl DNA analyser (Sangon Inc., Shanghai, China). Alleles were scored automatically and reviewed manually using PeakScanner v2.0 (Applied Biosystems).
The genotype data were initially assessed in Lositan (Antao et al., 2008) for the neutrality test in an island model under the infinite alleles model (IAM) with 50,000 simulations. Microchecker v2.2.3 (van Oosterhout et al., 2004) was subsequently employed to detect the presence of null alleles, large allele dropout and scoring errors caused by stuttering, as well as to calculate null allele frequency (r) using the Brookfield (1996) method for each locus.
To quantify population genetic diversity, summary statistics including the actual number of alleles (NA), effective number of alleles (NE), observed (HO) and expected (HE) heterozygosity, polymorphism information content (PIC) values, allelic richness (AR), number of private alleles (NAP) and inbreeding coefficient (FIS) were calculated for each locus using GenAlEx v6.5 (Peakall and Smouse, 2012), Cervus v3.03 (Kalinowski et al., 2007) and Fstat v2.9.3.2 (Goudet, 2002). Exact tests of deviation from Hardy–Weinberg equilibrium (HWE) (Guo and Thompson, 1992) for each locus × population combination and tests for genotypic linkage disequilibrium (LD) between pairs of loci were performed in Arlequin v3.5 (Excoffier and Lischer, 2010) and Genepop v4.2 (Raymond and Rousset, 1995; Rousset, 2008). Significance levels (p < 0.05) for multiple pair-wise tests were adjusted using the false discovery rate (FDR) correction (Benjamini and Hochberg, 1995).
To quantify population genetic differentiation, Nei’s genetic distance (DA) (Nei et al., 1983) and pairwise FST values were computed using Populations v1.2.311 and Arlequin v.3.5 (Excoffier and Lischer, 2010). The latter was used to perform spatially explicit AMOVA, with all groupings tested with 10,000 permutations, for the different spatial scales.
General relationships amongst individuals were depicted through a principal coordinate analysis (PCoA) on the basis of a covariance pairwise genetic distance matrix in GenAlEx v6.5 (Peakall and Smouse, 2012). Discriminant analysis of principal components (DAPC) (Jombart et al., 2010) was applied to test for genetic structure amongst populations with the ‘adegenet’ package v2.0.1 (Jombart and Ahmed, 2011) in the program R v3.4.1 (R Development Core Team, 2017). For M. isos, DAPC was conducted at region and population scales but not at the province level due to the limited number of groups. To determine the best K, denoting the most likely number of putative genetic clusters, a Bayesian clustering approach was implemented in Structure v2.3.4 (Pritchard et al., 2000) using an admixture ancestry model with corrected initial ALPHA values (∼1/K), uncorrelated allele frequencies and prior location information (Hubisz et al., 2009; Wang, 2017). Preliminary testing revealed that choice of model made no substantive difference to analysis outcomes. Each Markov chain Monte Carlo (MCMC) simulation was run for 500,000 iterations, with an initial burn-in period of 50,000 iterations. Fifty independent runs were performed for each cluster set. The ΔK metric (Evanno et al., 2005) was employed to calculate the best K (average number of nucleotide differences) in Structure Harvester2. Post-processing of Structure results was carried out using CLUMPAK (Kopelman et al., 2015). A second clustering approach was carried out in BAPS v6 (Corander et al., 2008) as a complement to the Structure analyses. Calculations were performed under the mixture model, with the maximum number of populations set as the number of regions, i.e. six, three and three for M. isos, M. endeavourae and M. gracilis, respectively.
Individual assignment tests and first generation migrant detection with ‘L_home’ likelihood computation were implemented in GeneClass v2 (Piry et al., 2004). The contemporary migration rates amongst populations were calculated in BayesAss v3 (Wilson and Rannala, 2003), which can produce accurate estimates of migration and self-replenishment when FST is ≥ 0.05 (Faubet et al., 2007). Calculation parameters were set as follows: 10,000,000 iterations, of which 3,000,000 were burn-in; sampling frequency 1000; migration rates, allele frequencies and inbreeding coefficients set at 1, 1 and 1, respectively, to make the acceptance rates between 20 and 60%.
All analyses described above were carried out at three spatial scales (Northern–Southern provinces, North–Central–South regions and geomorphic features) for M. isos, and at geomorphic feature level for M. endeavourae and M. gracilis.
Results
Population Genetic Structure Based on COI Region
Genetic Diversity
Haplotypic diversity was very high across populations for all provinces, regions and geomorphic features of the three Munida species. For M. isos, 111 haplotypes, based on a 649-bp fragment of the gene, were obtained from 348 individuals at both the province and region spatial scales. The haplotype diversity and nucleotide diversity values of populations were slightly greater in populations of the Northern province than in the Southern province, and both estimates in the North region were greater than the other two regions (detailed results are reported in Supplementary Table S5). At the geomorphic feature scale, a total of 110, 67 and 200 COI haplotypes were obtained from 345, 89 and 332 individuals of M. isos, M. endeavourae and M. gracilis, respectively. Notably, the mean population haplotype diversity and nucleotide diversity values for M. isos (0.764; 0.26%) were lower than for M. endeavourae (0.980; 0.59%) and M. gracilis (0.973; 0.56%), respectively.
Genetic Differentiation
As revealed by uncorrected p distances and ΦST values, genetic differentiation amongst populations of provinces, regions and geomorphic features was low in the three Munida species (uncorrected p distances in the range of 0.002–0.006; ΦST values in the range of 0.000–0.035). Specifically, all of the uncorrected p distances were relatively low, but within the Decapoda intraspecific barcode threshold (0.285–1.375%) (da Silva et al., 2011). Significance (p < 0.05) was detected for three ΦST values, all from population pairs at geographical feature scale of M. isos, yet none was observed amongst regions or province population pairs of M. isos, nor population pairs of geomorphic features for M. endeavourae or M. gracilis (Supplementary Table S6). This lack of differentiation was supported AMOVA results, with no significant genetic differentiation observed for all Φ-statistic values and over 99% of the variance being attributed to differences within populations (Supplementary Table S7).
The median-joining networks, representing the most parsimonious relationship amongst haplotypes, were plotted for the three Munida species. For M. isos, a starburst-like pattern was observed from the 111 haplotypes, but no pattern of genetic structure was detected in populations at either the province (Supplementary Figure S1) or region scales (Supplementary Figure S2). At the geomorphic feature scale, haplotypes from both M. isos and M. endeavourae populations exhibited a starburst-like pattern, consistent with the mutational evolution of new haplotypes over time (Figure 2). However, the number of equally parsimonious haplotype connections was too great in M. gracilis for the most likely network to be determined. Similarly, there was no evidence of a pattern of genetic structure amongst populations of the three Munida species across their distributional ranges (Supplementary Figure S3). The ML phylogenetic trees were similar for the three Munida species, with all haplotypes occurring in a major non-differentiated cluster with strong support, and clearly differentiated from the two outgroup taxa (Supplementary Figure S4). These analyses indicate that there is no clear evidence of genetic subdivision amongst populations at the geomorphic feature, region or province scale for the three Munida species.
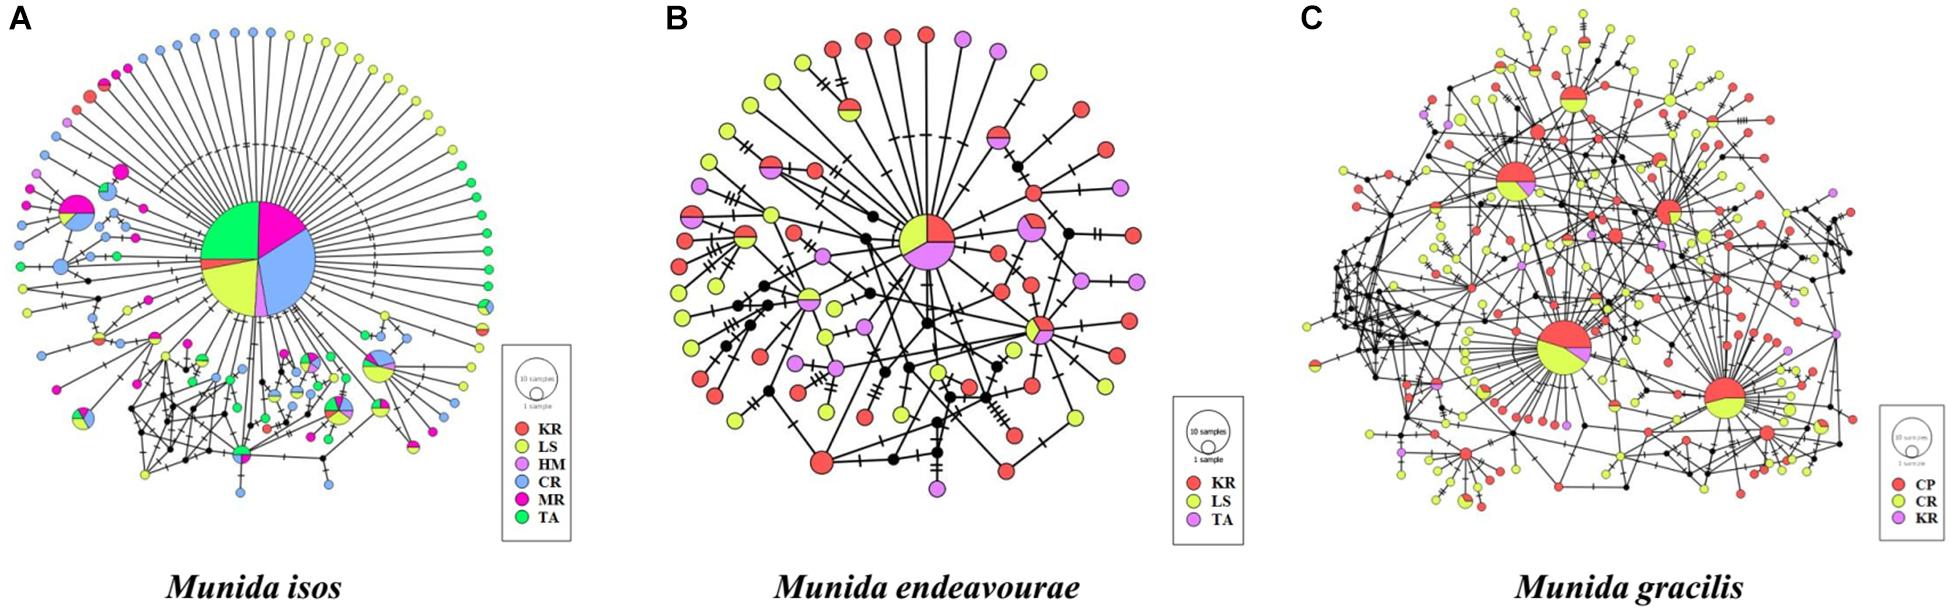
Figure 2. Median-joining network of COI haplotypes of (A) Munida isos, (B) M. endeavourae and (C) M. gracilis for geomorphic features. Coloured circles represent haplotypes and circle sizes are proportional to the number of individuals. Black circles represent hypothesised (not observed) haplotypes that are intermediate between observed haplotypes. Lines denote base pair changes.
Population Genetic Structure Based on Microsatellite Variation
Genetic Diversity
For all three species Lositan analyses indicated that no microsatellite locus was likely to be experiencing selection. Null alleles (r > 0.2) were detected at loci MI_06 (M. isos) and MI_02 (M. gracilis), but not observed at these loci in the two other species. Evidence of homozygote excess and stuttering was observed, but these were randomly distributed across loci in the three Munida species. No large allele dropout was indicated at any locus.
In total, 167, 63 and 74 alleles with size ranges of 78–134, 83–172and 82–200 bp were amplified at 17, 11 and nine microsatellite loci in M. isos, M. endeavourae and M. gracilis, respectively. In general, allelic variation (e.g. HE and PIC) was only moderately high. Four loci (MI_21, MI_29, MI_39 and MI_40) in M. isos, three (MI_06, MI_10 and MI_39) in M. endeavourae and one (MI_14) in M. gracilis exhibited a relatively low level of polymorphism compared to other loci (details are summarised in Supplementary Table S8). The M. isos of the Northern province exhibited a higher level of genetic diversity than those of the Southern province. The average number of effective alleles and expected heterozygosity were greatest in populations of the Central region, but the largest number of private alleles was found in the South region. At the geomorphic feature level, the observed and expected heterozygosities in the populations were reasonably consistent in all features for the three species (detailed results are reported in Supplementary Table S5). At the geomorphic feature scale, populations of M. isos and M. gracilis exhibited moderate levels of genetic diversity whilst M. endeavourae showed slightly lower genetic diversity. Private alleles were identified in nearly all populations of geomorphic features across the three Munida species, with the highest numbers being observed for the Chatham Rise (M. isos and M. gracilis) and Kermadec Ridge (M. endeavourae) populations, whilst none were detected for the Kermadec Ridge population of M. gracilis. Average FIS values were positive across populations of geomorphic features, with the only exception being the population of M. endeavourae from the Tasmanian slope, which exhibited a deficit of heterozygotes.
For M. isos, after FDR correction for multiple comparisons, 28 (82.35%) and 37 (72.55%) tests were significantly different from HWE (p < 0.05) at pairwise combinations of loci × populations at the province and region spatial scales, respectively. For geomorphic features, 38 (37.25%), 5 (15.15%) and 14 (51.85%) tests were significantly different from HWE (p < 0.05) in M. isos, M. endeavourae and M. gracilis, respectively, with the majority exhibiting heterozygote deficiencies. In particular, loci MI_25 and MI_02 demonstrated significant departures from HWE within all populations at the geomorphic feature scale of M. isos and M. gracilis, respectively.
For M. isos, only four of 136 locus-pairs showed significant LD after FDR correction (p < 0.05). No evidence of LD was found in M. endeavourae and M. gracilis.
Genetic Differentiation
Genetic population differentiation was low for the three species, as revealed by Nei’s genetic distance (DA) and FST values (DA in the range of 0.015–0.107; FST in the range of 0.001–0.051). For M. isos, FST values amongst populations of the two provinces and three regions remained low but significant (p < 0.05). For M. isos at the geomorphic feature scale, only the pairwise comparison between populations of the Hikurangi Margin and Tasmanian slope (FST = 0.051) exhibited a moderate level of differentiation (Supplementary Table S6). For population pairs of the other two species, significant difference from zero (p < 0.05) was detected for thirteen FST values after correction, of which 11 and two were from M. isos and M. endeavourae, respectively.
Analysis of molecular variance revealed significant genetic differentiation at different spatial levels: within all samples of M. isos and M. gracilis; amongst the populations of the two provinces, three regions, and six geomorphic features for M. isos and amongst populations of the three geomorphic features for M. endeavourae and M. gracilis (Supplementary Table S7). Nonetheless, AMOVA partitioned more than 96% of the genetic variation within samples for the three Munida species, leaving less than 4% variance attributable to the differences amongst populations and amongst populations within groups.
Genetic Structure
Principal coordinate analysis, with relatively low cumulative variation represented by the first two factors, revealed no evidence of genetic differentiation across populations of provinces or regions for M. isos, and amongst populations of geomorphic features for the three Munida species (Supplementary Figures S5, S6), whilst Structure showed the highest support for two clusters (ΔK = 2) for all datasets. However, given that the ΔK approach is unable to detect the best K when K = 1, post-processing of Structure bar plots was conducted in CLUMPAK. As a result, K = 1 and K = 2 could not be successfully differentiated between for M. isos (10/10; 10/10) at three spatial scales (provinces, regions and geomorphic features) and M. gracilis (10/10; 10/10) at geomorphic feature level, whereas K = 2 (5/10) was rejected in favour of K = 1 for M. endeavourae (Figures 3, 4). For M. isos, when K = 2, individuals from the Southern province and the South region were mostly assigned to the blue cluster based on provinces and region scales. At the geomorphic feature scale, the majority of individuals from the Hikurangi Margin, Macquarie Ridge and Tasmanian slope populations were assigned to the blue cluster, whilst populations from other features showed a more complex genetic structure with a shared membership of both the blue and orange clusters. This finding was supported by the fact that 10 out of 11 significant pairwise FST values were detected in populations from these three geomorphic features (Hikurangi Margin, Macquarie Ridge and Tasmanian slope). For M. endeavourae, no pattern was revealed, with all individuals assigned equally to both clusters, indicating no structure. For M. gracilis, individuals from populations of all three geomorphic features were randomly assigned to two clusters, echoing the AMOVA results as major variance was attributed to the differences within geomorphic features. In the BAPS analyses, the inferred number of populations was one (K = 1) for all datasets of three Munida species, indicating no genetic structure.
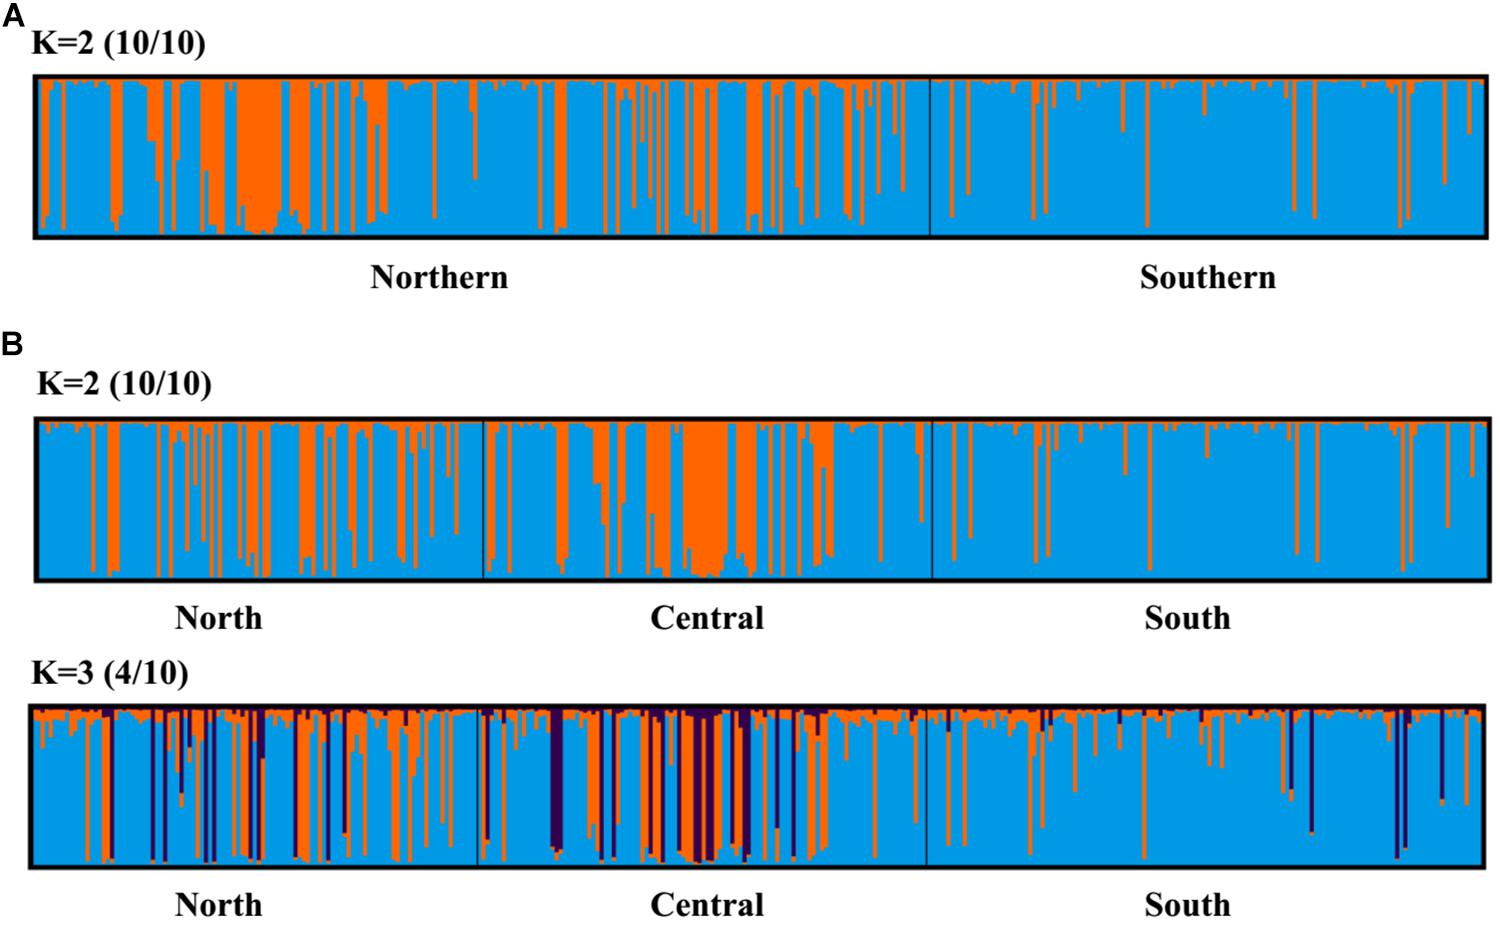
Figure 3. Structure cluster analyses of Munida isos based on spatial differentiation of (A) two provinces and (B) three regions as revealed by microsatellite variation.
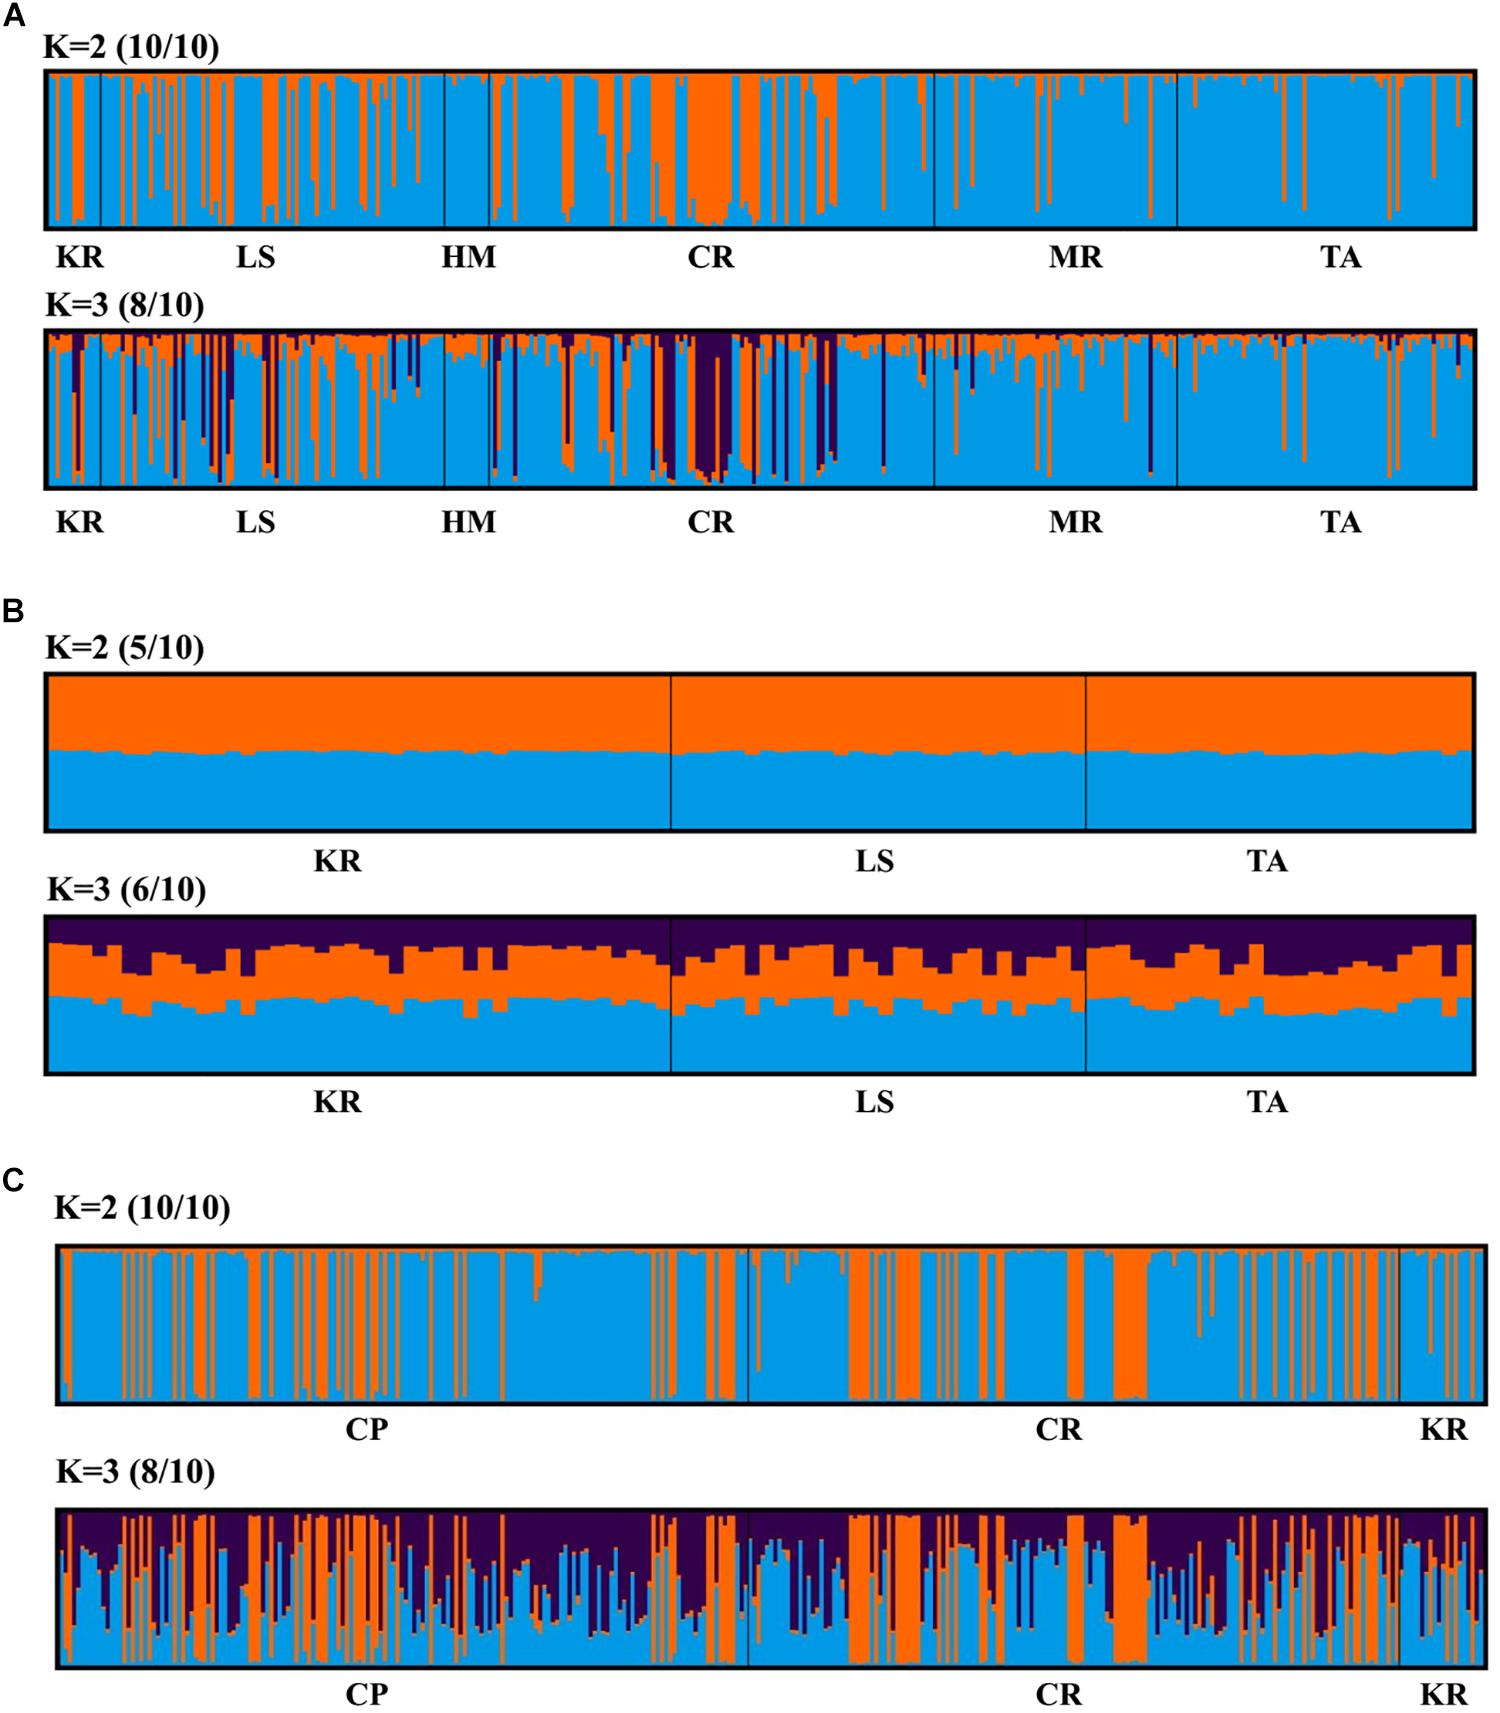
Figure 4. Structure cluster analyses of (A) Munida isos, (B) M. endeavourae and (C) M. gracilis based on microsatellite variation among populations on geomorphic features.
Results from DAPC, an analysis that can maximise genetic variation amongst groups whilst minimising separation within groups, indicated three genetic clusters corresponding to the three regions as defined by the first two principal components (PCs) for M. isos (Figure 5). At the geomorphic feature level, two, three and three major genetic clusters were calculated for M. isos, M. endeavourae and M. gracilis, respectively (Figure 6). For M. isos, PC1 separated the Tasmanian slope population from the populations of all other geomorphic features. The major cluster was further divided by PC2 into individuals from populations of the Kermadec Ridge and Louisville Seamount Chain, Chatham Rise and Macquarie Ridge and the Hikurangi Margin, which was congruent with the FST and Structure results. For M. endeavourae and M. gracilis, three distinct clusters corresponding to the populations from the three geomorphic features were revealed, with clusters overlapping to different degrees for the two species.
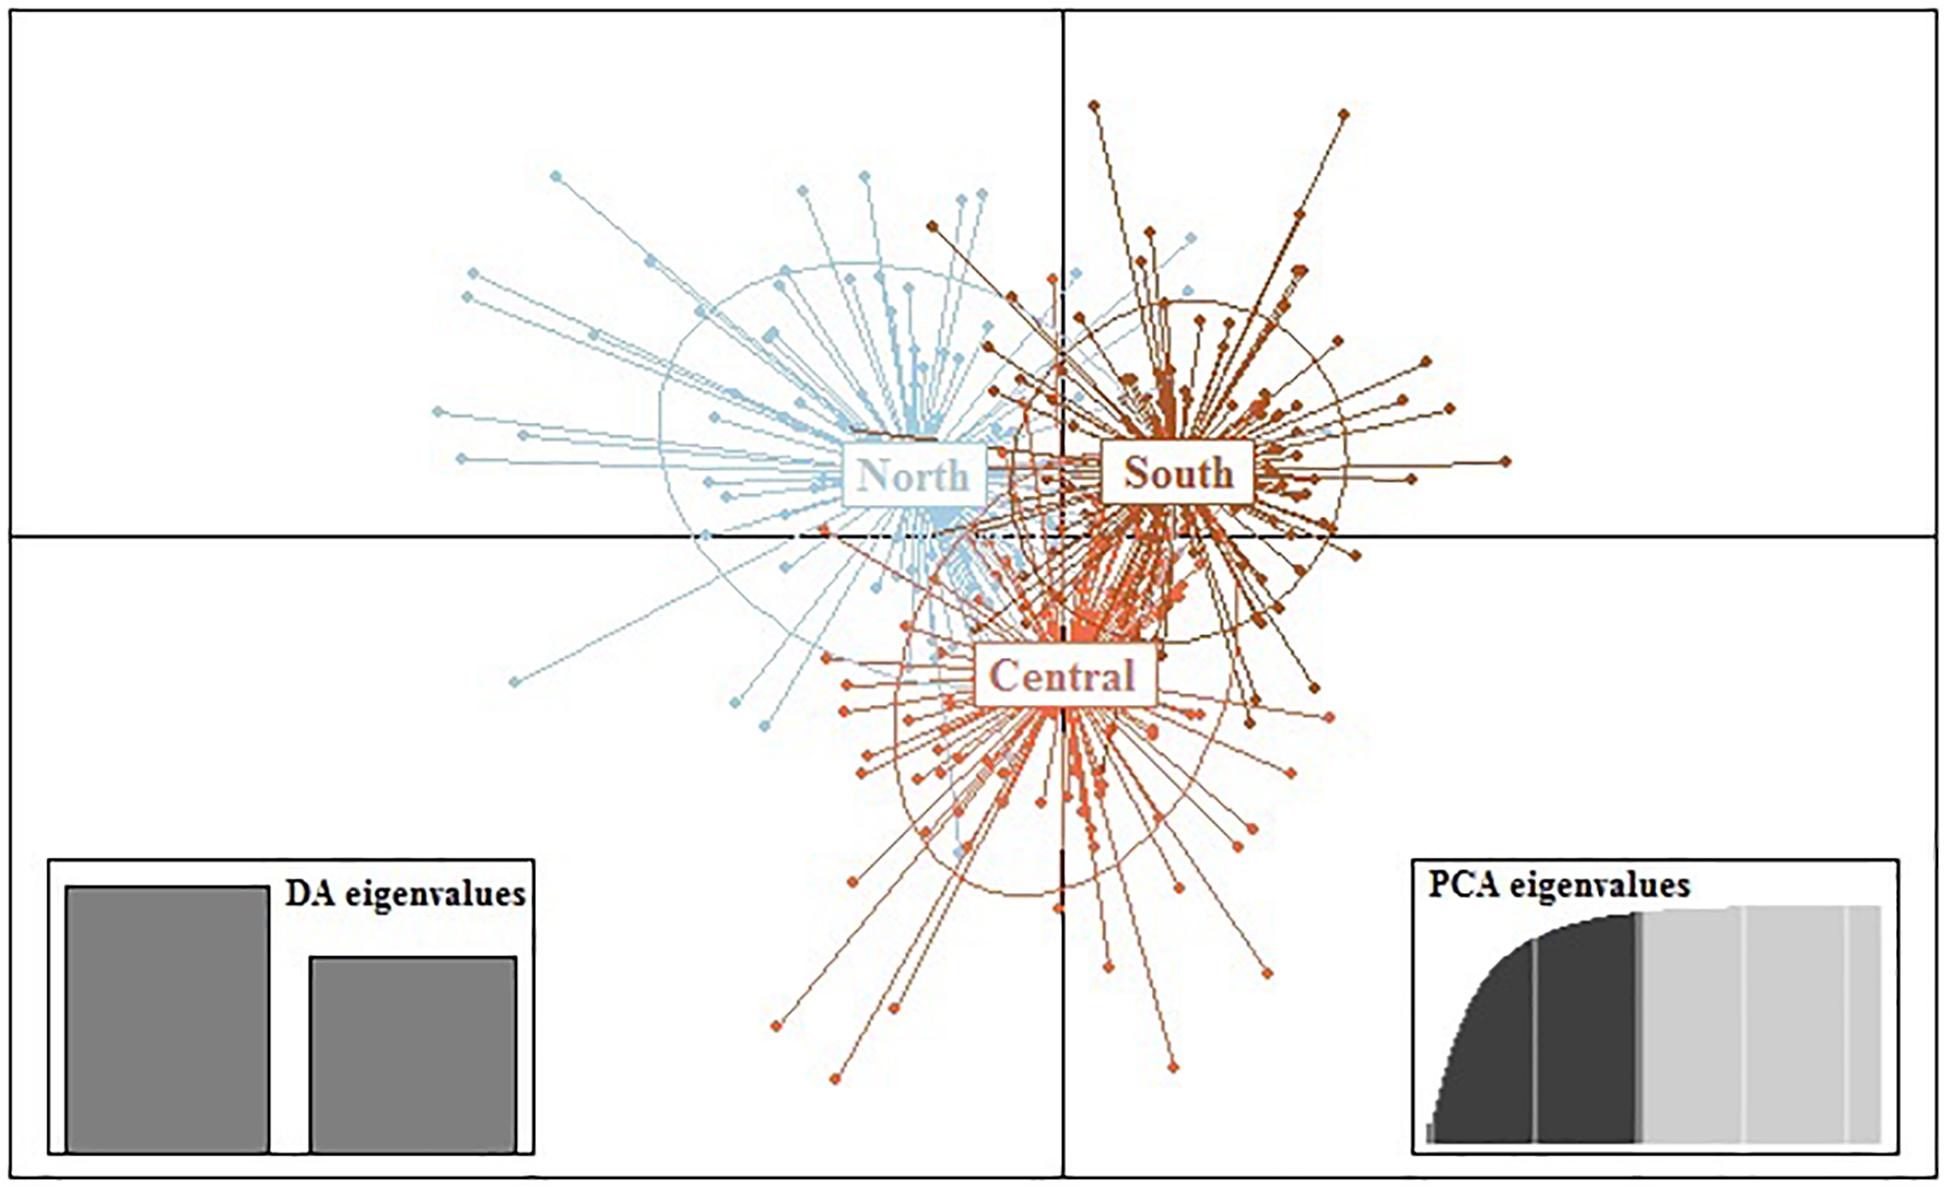
Figure 5. Scatterplot generated by the discriminant analysis of principal components (DAPC) of Munida isos based on three regions as revealed by microsatellite variation.
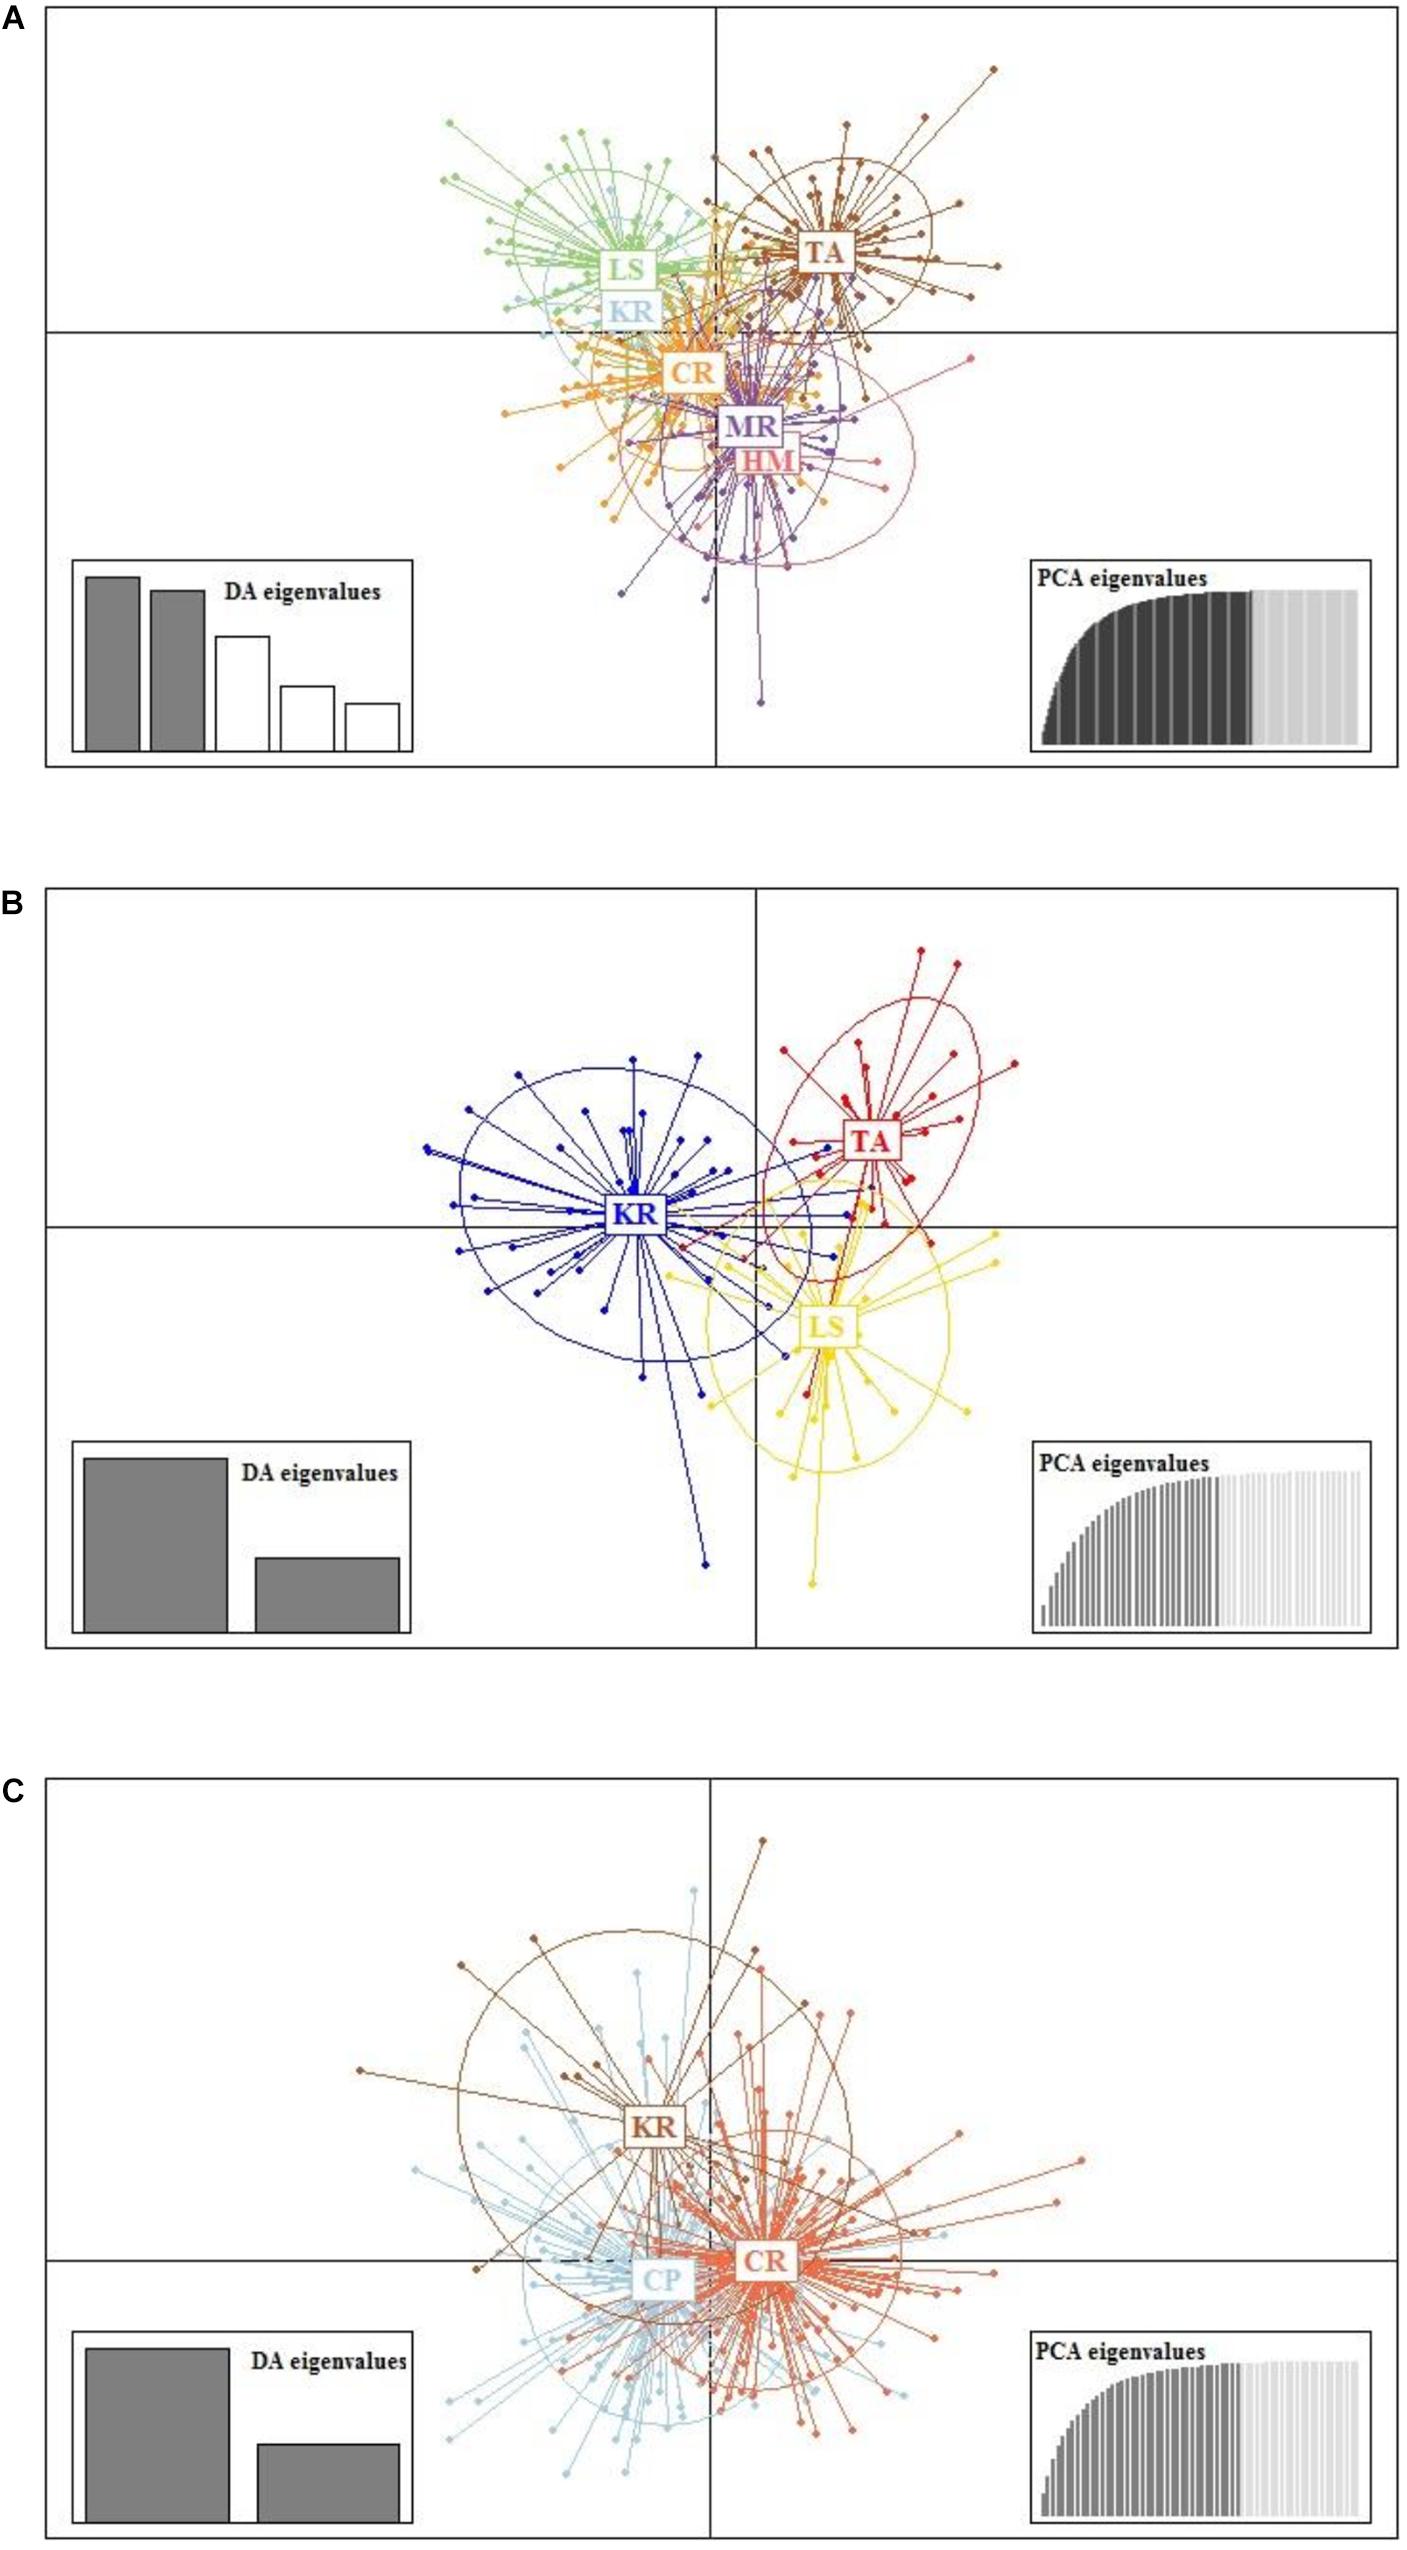
Figure 6. Scatterplot generated by the discriminant analysis of principal components (DAPC) of (A) Munida isos, (B) M. endeavourae and (C) M. gracilis based on microsatellite variation among populations of geomorphic features.
Gene Flow and Connectivity
Assignment-based tests performed in GeneClass had a low to moderate level of classification success. For M. isos, 231 (65.1%) and 179 (50.4%) individuals were correctly assigned to their province and region populations, respectively. At the geomorphic feature level, a total of 143 (40.6%), 53 (55.2%) and 156 (40.0%) individuals were correctly assigned to their own geomorphic feature populations for M. isos, M. endeavourae and M. gracilis, respectively. The ‘L_home’ statistics demonstrated some evidence of first-generation migrants amongst sampled province/region/geomorphic feature populations. In total, 19, two and eight individuals were below the threshold of the assignment tests (α = 0.01) for M. isos, M. endeavourae and M. gracilis, respectively, increasing the possibility that these individuals may be first generation immigrants that have been introduced from an unknown source.
For M. isos, BayesAss analyses were unable to reach the standard of 20–60% in the province and region spatial scale datasets: only results for geomorphic features are presented. At the geomorphic feature level, estimates of contemporary migrants between populations were low, and the proportions of self-recruitment were high to very high (Table 2). For M. isos, the Macquarie Ridge (81.22%) and Tasmanian slope (96.43%) populations exhibited evidence of genetic isolation with high proportions of contribution from within each population (self-recruitment). Similar patterns were observed for individuals from the Louisville Seamount Chain for M. endeavourae (95.47%) and from the Challenger Plateau for M. gracilis (88.26%). Notably, the Kermadec Ridge region was identified as a sink population (only receiving migrants from other populations) for all Munida species. For M. isos, the Tasmanian slope population was identified as a source population (providing migrants to other populations while receiving no or few migrants). This was incongruent with findings from M. endeavourae, for which the Tasmanian slope population (68.01%) acted as a sink population, receiving migrants (30.27%) from the Louisville Seamount Chain population. For M. gracilis, populations from both the Chatham Rise and Challenger Plateau were both source and sink populations.
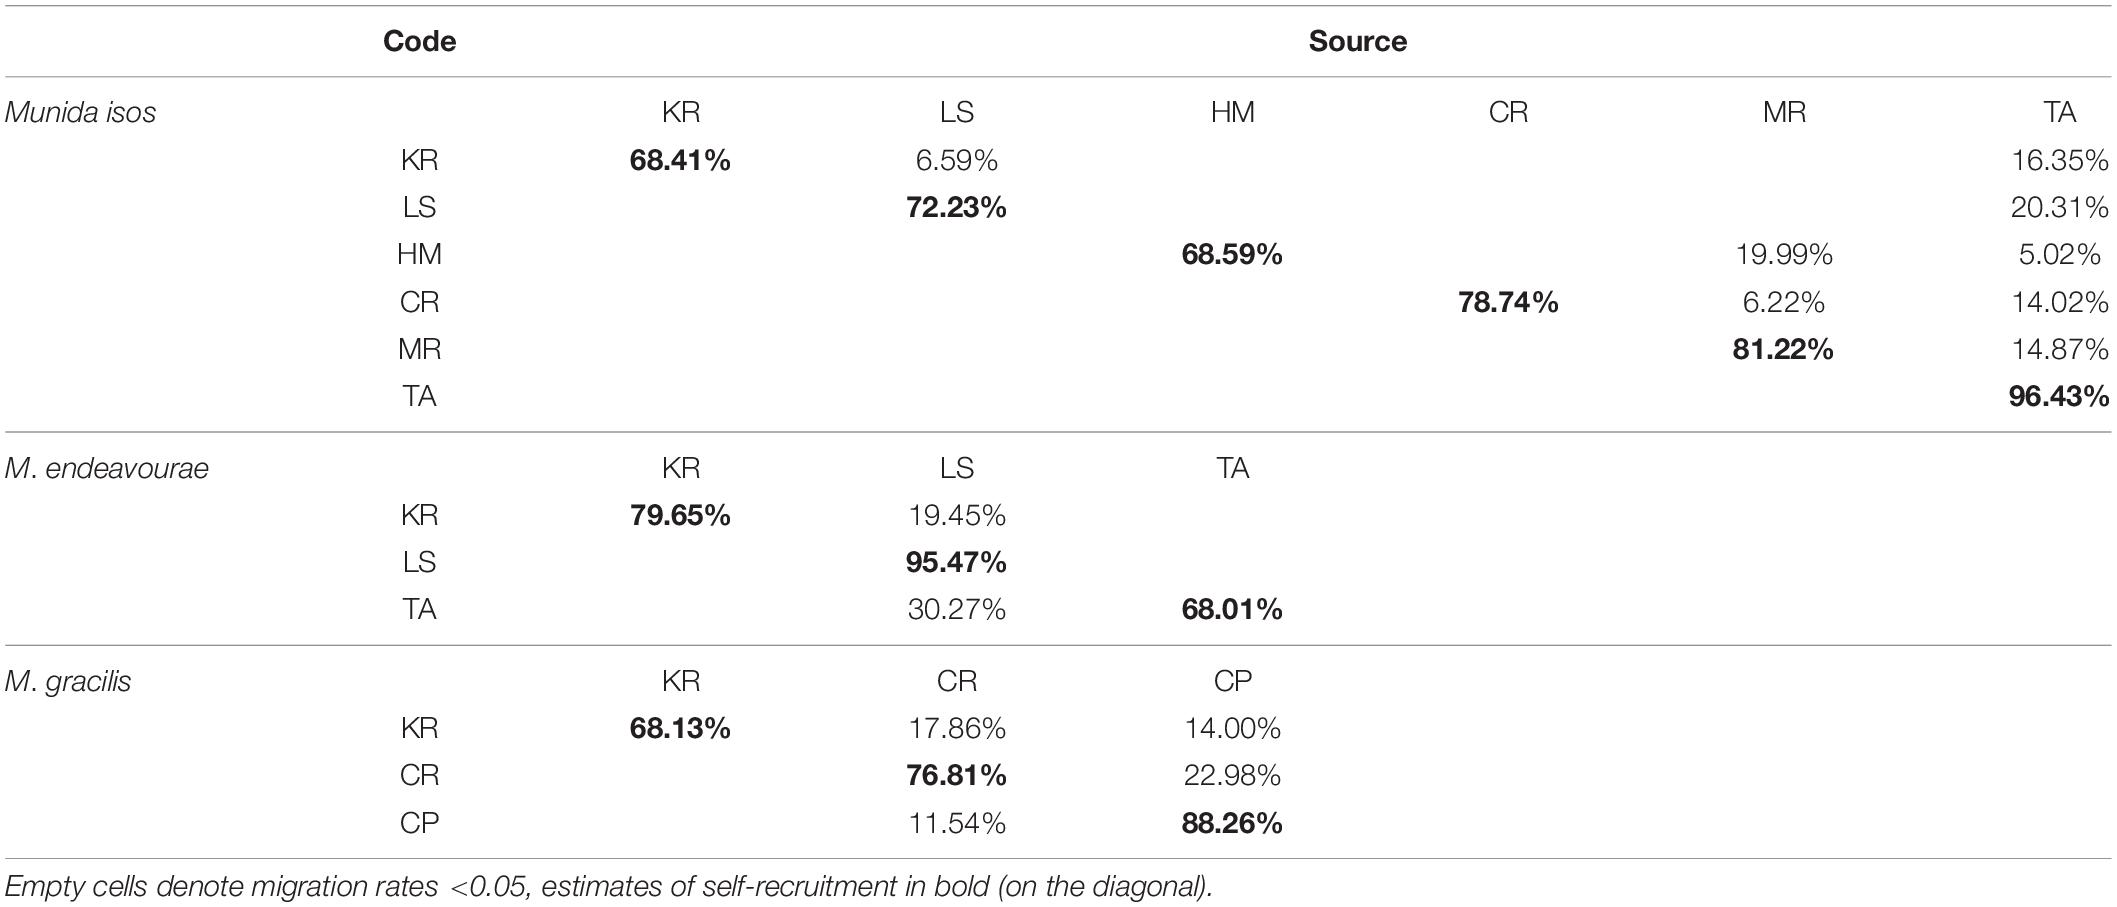
Table 2. Estimated migration rates from source populations (top) to recipient populations (side) for three Munida species based on microsatellite variation.
Discussion
Three munidid squat lobsters, M. isos, M. endeavourae and M. gracilis, have been tested for levels of genetic diversity and patterns of genetic connectivity in the southwest Pacific Ocean based on mitochondrial COI region and nuclear microsatellite variation. Overall, the level of genetic diversity was high as revealed by the COI region, and moderate as revealed by microsatellite markers, across all three Munida species. There was no evidence of genetic subdivision amongst populations of the three Munida species based on the COI sequence data, and only limited genetic differentiation was observed in M. isos and M. gracilis based on microsatellite variation (none was detected for M. endeavourae using microsatellites). These results provide new insights into the genetic connectivity of VME-associated taxa in the southwest Pacific Ocean.
Genetic Diversity
Genetic diversity of the three Munida species was randomly distributed across the study area, as indicated by both the COI region and microsatellite markers. The mitochondrial COI region, in particular, exhibited a high level of genetic diversity for haplotypes across the three Munida species. Notably, within the genus Munida, high levels of polymorphisms in COI can be indicative of a relatively fast mutation rate, or because population sizes are large, or because the taxa have an ancient origin, allowing for mutations to accumulate over time (Coykendall et al., 2017). The observation of high haplotype diversity was consistent with findings from other deep-sea squat lobsters, such as the chirostyloid K. tyleri (Roterman et al., 2016) and the munidid Pleuroncodes monodon (Haye et al., 2010). Nonetheless, M. isos exhibited lower genetic diversity compared to M. endeavourae and M. gracilis, as revealed by other genetic diversity estimates based on COI region, whilst M. endeavourae showed the lowest genetic diversity on the basis of microsatellite markers with respect to expected heterozygosity and effective number of alleles that could reflect genetic drift (Hedrick, 1999). Given that sample size is uneven when comparing populations of M. isos and M. gracilis, allelic richness, which is independent on sample size, is included as an index to evaluate the level of genetic diversity for the newly developed microsatellite markers. Consequently, these microsatellite markers performed reasonably well, exhibited a moderate level of genetic diversity and provided valuable genetic information for the three Munida species.
Significant deviations from HWE were observed in the three Munida species, which is common in squat lobster species (Molecular Ecology Resources Primer Development Consortium et al., 2010; Boyle et al., 2013; Nakajima et al., 2018). Deviations from HWE may be attributed to causes such as null alleles and the Wahlund effect (Johnson and Black, 1984). The presence of null alleles may result in mistyping of homozygotes and heterozygotes, leading to an over-estimation of genetic differentiation (DeWoody et al., 2006). However, null alleles are commonly observed in a variety of marine invertebrate species (e.g. Dailianis et al., 2011; Thaler et al., 2014; Roterman et al., 2016) and in population genetic studies null allele frequencies below 0.2 are commonly accepted when using microsatellite markers (Dakin and Avise, 2004). In this study, although low-to-moderate frequencies of null alleles were detected at a number of loci across the three Munida species, only two loci exhibited null allele frequencies above 0.2. Given that little genetic differentiation was observed amongst populations of M. isos and M. gracilis, the null alleles at these two loci were not expected to influence the overall interpretation of the results. The Wahlund effect is caused by individuals from different localities that are characterised by different genotype proportions, being mixed during sampling or during data analysis, resulting in excess homozygosity and significant FIS estimates (Freeland, 2005; Waples, 2014). The highly significant deficit of heterozygote genotypes, as revealed by positive inbreeding coefficients, was obtained across all populations in the three Munida species with only one exception (i.e. the Tasmanian slope population of M. endeavourae), indicating the presence of inbreeding. Moreover, HWE deviations occurred in the form of homozygote excesses, which might also result from small sample size (e.g. populations from Kermadec Ridge and Hikurangi Margin in M. isos), given the potential for extensive gene flow amongst populations and population demographic history (e.g. expansions or selective sweeps). However, small sample size and limited spatial scale sampling are unavoidable constraints in population genetic studies of deep-sea organisms (Baco et al., 2016). For microsatellite-based population genetic studies, 25–30 individuals per population is considered sufficient to provide accurate estimations of genetic diversity and gene flow (Hale et al., 2012), and the majority of the populations tested in the three Munida species meet this criterion.
Genetic Differentiation and Connectivity
Genetic differentiation at different spatial scales was evaluated based on mitochondrial COI region and nuclear microsatellite marker variation in the three Munida species. Levels of site-specific genetic diversity are a function, at least in part, of sample size and we recognise that our sample sizes are very variable amongst our sites. This variability reflects the differential availability of archived material in the museum collections, which is itself a function of the very different sampling efforts that our sites have been subject to over the last several decades and is a known and appreciated constraint for deep-sea population genetics research (e.g. Boschen et al., 2015; Baco et al., 2016; Zeng et al., 2017, 2019). For the COI region, according to the Decapoda intraspecific barcode threshold (0.285–1.375%) (da Silva et al., 2011), the maximum pairwise uncorrected p distances amongst the three Munida populations did not suggest the presence of cryptic species. These results support previous findings for M. gracilis in the New Zealand region (0–1.9%) (Bors et al., 2012) and align with observations in other squat lobsters, including Fennerogalathea chacei (0.13–0.61%) (Rodríguez-Flores et al., 2017). Despite the large geographic coverage of sampling sites, low and statistically non-significant global ΦST values were observed for the three Munida species, suggesting genetic similarity in the squat lobster populations across the southwest Pacific Ocean. In contrast, microsatellite markers revealed some limited evidence of genetic differentiation amongst populations of M. isos and M. gracilis, but not M. endeavourae. Although nuclear microsatellite markers showed signs of low levels of genetic differentiation for the three Munida species, more than 96% of the variance was attributed to differences within populations, again suggesting high levels of gene flow amongst populations leading to panmixia. Collectively, little genetic differentiation was observed amongst populations of three Munida species in the southwest Pacific Ocean, either from seamounts or soft sediments. Therefore, the hypothesis that M. isos and M. endeavourae (typically found on isolated seamounts) exhibit population genetic differentiation was rejected, whilst the hypothesis that gene flow amongst populations of M. gracilis, (typically found on soft sediments) results in high levels of population genetic homogeneity was accepted. The absence of genetic structure is usually interpreted as being consistent with either panmixia or recent demographic expansion following a genetic bottleneck event can leave little or no signature in the genome. Additionally, a recent colonisation from another area of the species’ distribution is possible, although we see no evidence of this. This lack of population genetic differentiation has been observed in a number of squat lobster species (e.g. Samadi et al., 2006; Haye et al., 2010; Bors et al., 2012; Cabezas et al., 2012; Wang et al., 2016), including for M. gracilis in the New Zealand region (Bors et al., 2012). Similarly, no significant population genetic structure was observed across the same province, region and geomorphic feature scales for a deep-sea sponge species in the study area (Zeng et al., 2019). However, this pattern of genetic similarity is not consistent across all deep-sea marine species, including corals and sponges (e.g. Miller et al., 2011; Herrera et al., 2012; Miller and Gunasekera, 2017). For example, within the Southwest Pacific region, a North–Central–South region pattern of structure has been detected in a cup coral based on ITS sequence variation (Miller et al., 2010), province-scale differentiation has been reported in branching stony corals using a combination of D-loop, ITS and microsatellite markers (Zeng et al., 2017), and genetic differentiation has been detected in a deep-sea sponge species based on province, region and geomorphic feature spatial scales as revealed by COI, Cytb and microsatellite variation (Zeng et al., 2019).
Based on mitochondrial COI sequence data, an overall lack of population genetic structure was detected for the three Munida species accordingly to ML tree and median-joining network. Similar haplotype networks have been reported for other squat lobster taxa, such as K. tyleri (Roterman et al., 2016), Munida intermedia (García-Merchán et al., 2012), M. gracilis (Bors et al., 2012), Munida gregaria (Pérez-Barros et al., 2014) and P. monodon (Haye et al., 2010). For nuclear microsatellite data, given that the differentiation amongst populations was weak for the three Munida species, it was difficult to infer population genetic structure. The Bayesian clustering software programmes Structure and BAPS can both perform reasonably well at low levels of genetic differentiation and are able to correctly identify the maximum (upper limit) number of genetically distinct groups (Latch et al., 2006). In this study, considering the low FST values for all three Munida species, Structure and BAPS were employed to calculate the best K (average number of nucleotide differences). Little or no structure was found for the three Munida species when using both approaches. Nonetheless, populations from the Tasmanian slope are potentially genetically differentiated, but not isolated, from the other M. isos populations as revealed by results from the FST, Structure and DAPC analyses. Considering the difficulty in detecting any structure, we refrain from speculating why M. isos populations are potentially more structured compared to those of the other two Munida species.
The three Munida species exhibited low to moderate levels of assignment success, indicative of panmixia across the study area, and which is most probably driven by high levels of gene flow in the region. Interestingly, estimations of migration rate were not always consistent for populations from the Tasmanian slope, which acted as a source population for M. isos and as a sink population for M. endeavourae. Moreover, populations from the Kermadec Ridge acted as sink populations in the three Munida species, which was inconsistent with a previous study of two stony corals where the Kermadec Ridge is a migrant source (Zeng et al., 2017). Given the fact that BayesAss can only produce accurate estimates of migration and self-replenishment when FST is ≥ 0.05 (Faubet et al., 2007), all estimates of migration rates as revealed by BayesAss should be cautiously interpreted and are best viewed in combination with other analyses.
Overall, we have evidence of moderate to high levels of gene flow, of low levels of genetic differentiation and of low levels of assignment success, all of which point to population genetic homogeneity or perhaps even panmixia at large spatial scales. But we also have evidence of limited differentiation of the Tasmanian slope populations from all other populations to the east, in the New Zealand EEZ and beyond (i.e. the Louisville Seamount Chain) based on FST values and the DAPC plots. We interpret these results as indicating that the Tasmanian slope populations are differentiated to a small extent, perhaps at the limits of detection by some of the analyses, from all other populations. Our data suggest that there is likely to be asymmetrical gene flow from the Tasmanian slope populations to the east (i.e. the Tasmanian slope populations are source populations), and this is supported by, and consistent with, the regional physical oceanography. For example, the major surface current circulation, the STW and SAW, both flow eastwards (from Australia towards New Zealand) before meeting and mixing along the Chatham Rise to the east of New Zealand (Chiswell et al., 2015). Our data point to gene flow from the Australian EEZ to the New Zealand EEZ, but not vice versa, a finding that is consistent with results for other species such as shallow water rock lobsters and the intertidal black nerite that have a long pelagic larval duration (e.g. Chiswell et al., 2003; Bruce et al., 2007; Morgan et al., 2013; Gardner et al., submitted).
Larval dispersal is crucial for connectivity and colonisation through migration in deep-sea environments. Specific larval development characteristics are unknown for M. isos, M. endeavourae and M. gracilis but based on egg size, a ‘regular’ (not abbreviated) planktotrophic larva is inferred as in other Munida species (Baba et al., 2011), The only complete larval development study was conducted for a congeneric species, M. gregaria, with a PLD that may reach 83 days at a rearing temperature of 8°C in the laboratory (Pérez-Barros et al., 2007). The potentially long PLD of the three Munida species that lasts for perhaps several months is but one of various possible explanations for the panmixia observed in the study region. The larval lifespans may be extended by low temperature-induced metabolic rate reduction in a low-temperature environment, lessening the impact of dispersal strategy on patterns of genetic differentiation (Roterman et al., 2016). In addition, the density of seamounts, as potential stepping stones, may be higher than is presently thought, facilitating dispersal, and deep water currents may act as a driving force for the enhancement of connectivity as well (Handayani et al., 2014). Interestingly, the estimates of genetic homogeneity in marine organisms are often found to be inconsistent with expectations from inferred PLD, which may be due to oversimplification of PLD estimation (Weersing and Toonen, 2009; Selkoe and Toonen, 2011; Faurby and Barber, 2012). Developmental biology studies of the three Munida species in the future should test the potential relationship between PLD and connectivity in squat lobster populations across their distributional range. Understanding this relationship will help inform the construction of biophysical models that are also used to inform the design of MPA networks (Hilário et al., 2015).
Implications for Conservation and Management
In recent years, VMEs have suffered severe damage from anthropogenic activities at a regional or local scale, as well as from physical environmental changes such as increasing ocean temperature and acidification (Thresher et al., 2015; Gollner et al., 2017). To date, some efforts have been made to lessen human impacts on the VMEs by establishing MPAs that provide a means to restrict human activity for a conservation purpose to protect critical natural habitats, which can help facilitate the protection and restoration of biodiversity and ecosystem function of VMEs (Agardy, 1994; Clark et al., 2011). An understanding of spatially explicit genetic diversity as well as patterns of connectivity within and amongst populations of deep-sea organisms that characterise or are associated with VMEs, is fundamental to inform the management of impacts on VMEs, through assessing the effectiveness of current MPAs and informing the design of the spatial arrangement of new MPAs (Palumbi, 2003; Coleman et al., 2011; Pujolar et al., 2013; Santini et al., 2016).
In 2001, New Zealand implemented a seamount management strategy, with 17 areas (containing 19 seamounts) within New Zealand’s EEZ closed to all bottom trawling in order to protect the benthic habitat and communities on seamounts, including VMEs (Brodie and Clark, 2003). Following these seamount closures, in 2007 the New Zealand Government closed 17 benthic protected areas (BPAs) within the EEZ to dredging and bottom trawling (and prohibiting mid-water trawling within 50 m of the seafloor) to protect benthic biodiversity, including VMEs (Helson et al., 2010). As a consequence, 32% of New Zealand’s seafloor is now protected from dredging and bottom trawling (but no other form of anthropogenic disturbance), a total area which comprises roughly four times the landmass of New Zealand (Figure 7). In 2007, the United Nations General Assembly Resolution 61/105 on sustainable fisheries (United Nations General Assembly, 2007) appealed to States and regional fisheries management organisations to protect VMEs from significant adverse impacts caused by destructive fishing activities in international waters. Consequently, in the South Pacific Ocean, interim measures to protect VMEs have been adopted by the South Pacific Regional Fisheries Management Organization (SPRFMO). These measures include 20 min longitude × 20 min latitude areas closed to bottom trawling, as well as areas open to trawling, some of which include the provision of a ‘move-on rule’ to avoid damage to VMEs (Penney et al., 2009). To date, the suitability and effectiveness of the BPAs and seamount closures within New Zealand’s EEZ, and the SPRFMO interim measures, have been assessed using cost-benefit analyses (Leathwick et al., 2008; Penney and Guinotte, 2013), as well as some limited evaluation using genetic tools and connectivity patterns (e.g. Boschen et al., 2016; Holland et al., 2019).
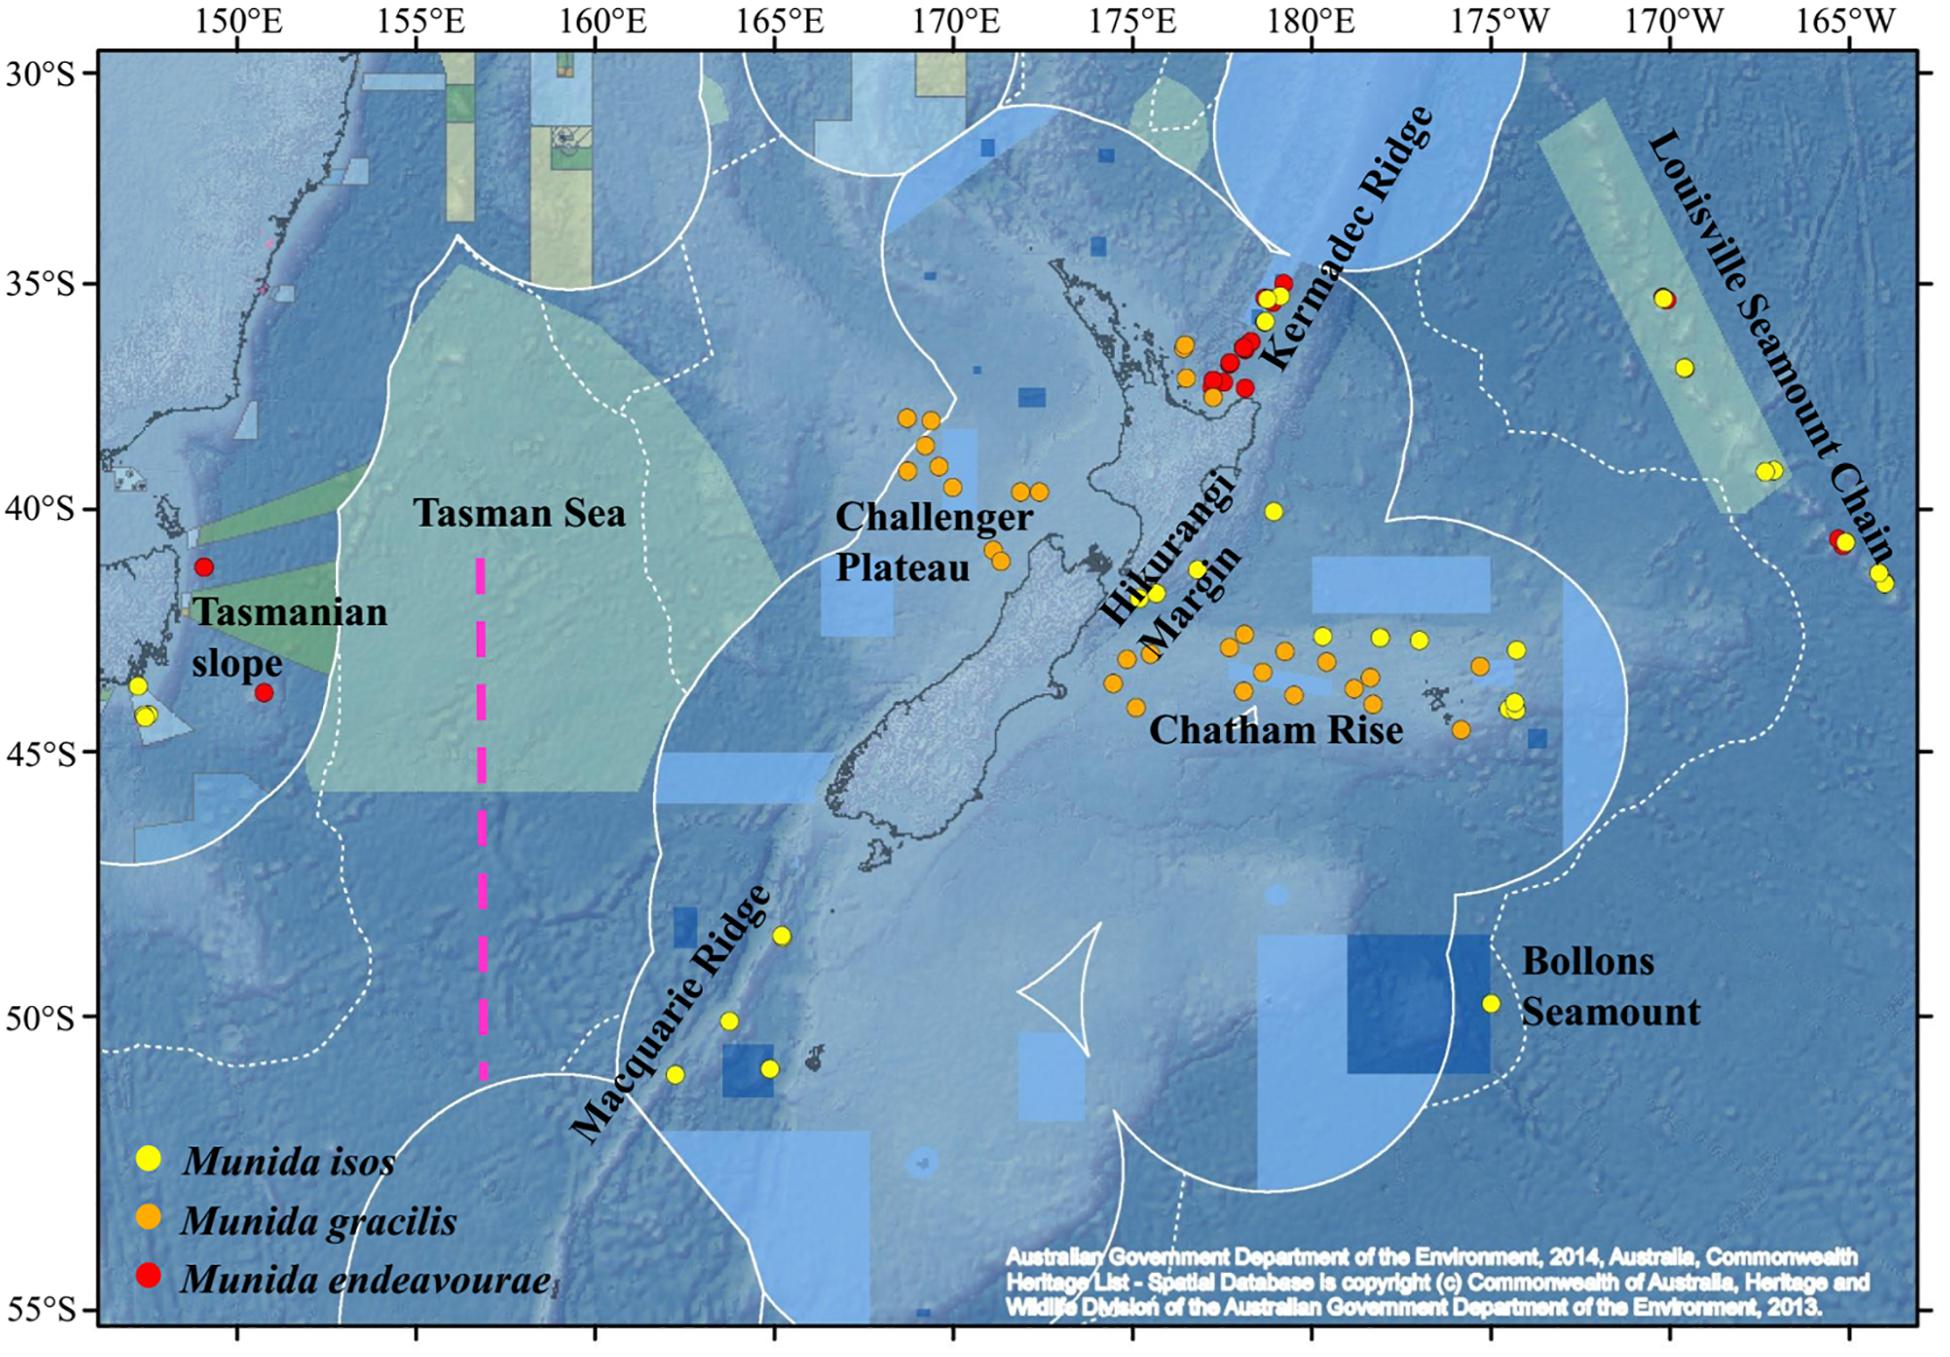
Figure 7. Map showing the distribution of marine protected areas (shaded), major geomorphic features and locations of the samples in the southwest Pacific Ocean region. White solid lines indicate the boundary of economic exclusive zone. White dashed lines represent the boundary of Extended Continental Shelf. Pink dashed line is marked as the potential genetic barrier.
A key finding of this study is that the relatively high levels of genetic connectivity and the low levels of genetic differentiation reported amongst geographically isolated populations of Munida spp. suggests that any damage to a localised site squat lobster population (e.g. natural disturbance such as slumps or man-made disturbance such as fishing or mining) may be counteracted by the high levels of larval connectivity from other sites. Whilst this appears to be true for Munida spp. that are associated with the VMEs, the same cannot be said of VME habitat-forming taxa such as corals and sponges (Zeng et al., 2017, 2019).
Squat lobster populations on the Tasmanian slope are located in the 9991 km2 Huon Commonwealth Marine Reserve (part of the Southeast Commonwealth Marine Reserve Network) within the Australian EEZ. Three of the sample sites are within the Habitat Protection Zone (IUCN IV), with mining prohibition and commercial fishing needing to be authorised, whilst the fourth site for this population is situated in the Huon-Multiple Use Zone (IUCN VI), where activities such as mining and fishing can occur if authorised (Iftekhar et al., 2014). Thus, the conservation of populations of a VME-associated taxon on the Tasmanian slope is managed. Moreover, the population of M. isos in the Huon Marine Park is a potential source population for populations within New Zealand’s EEZ, and therefore its protection is helpful for the conservation of the genetic diversity of this species in the New Zealand region.
Squat lobsters from within New Zealand’s EEZ and beyond (i.e. at the Louisville Seamount Chain) exhibited high levels of gene flow across New Zealand’s EEZ and beyond. Thus, it is essential to have MPAs distributed throughout these regions to reflect and to protect this wide-ranging genetic connectivity. Significantly, it is necessary to separately protect VMEs on the Louisville Seamount Chain, because the impacts of bottom trawling on VMEs in the SPRFMO Convention Area are managed separately from the management of similar impacts in New Zealand’s EEZ. Furthermore, the currently closed areas on the Louisville Seamount Chain are part of a broader protection measure that not only distributes VME protection elsewhere in the SPRFMO Convention Area, but also includes limits on VME indicator taxa bycatch (including VME habitat associated taxa).
Ongoing monitoring of genetic diversity and patterns of connectivity within and amongst populations of deep-sea fauna before and after bottom trawling will allow researchers to evaluate the impact of anthropogenic activity on population differentiation and connectivity, and will provide valuable information to inform best practices in management and conservation. Collectively, the results of this study illustrate the importance of considering the international cross-boundary implications of conservation measures when trying to design effective MPA networks (e.g. Miller et al., 2018; van Dover et al., 2018).
Data Availability Statement
The datasets for this study can be found in the NCBI GenBank (https://www.ncbi.nlm.nih.gov/nucleotide/).
Author Contributions
AR and JG designed the research project. KS and AR contributed to the collection of the analysed samples. KS and R-JY provided the identifications of the squat lobster species. R-JY and X-ZG conducted the laboratory and statistical analyses. The first draft of the manuscript was written by R-JY. R-JY, KS, AR, and JG contributed to the reworking and editing of the draft manuscript towards the submitted version.
Funding
This work was supported by funding from Victoria University of Wellington to JG (SB80802), National Institute of Water and Atmospheric to Richard Wysoczanski [Crustacea as indicators of marine environmental change (CAIME)] and Sadie Mills (New Zealand Ministry for Business, Innovation and Employment core funding to NIWA under Coasts and Oceans Research Programme). Sample collections were supported by funding from the former New Zealand Foundation for Research, Science and Technology, former New Zealand Ministry of Fisheries, Land Information New Zealand, Department of Conservation (New Zealand), GNS Science (New Zealand), Auckland University and Woods Hole Oceanographic Institute (United States).
Conflict of Interest
The authors declare that the research was conducted in the absence of any commercial or financial relationships that could be construed as a potential conflict of interest.
Acknowledgments
Squat lobster specimens were supplied for genetic work by the National Institute of Water and Atmospheric (NIWA) Invertebrate Collection, Wellington, New Zealand, and Museum Victoria, Melbourne, Australia. Particular special thanks to Ms. Sadie Mills and Ms. Diana Macpherson of the NIWA Invertebrate Collection and Dr. Anna McCallum of the Museum Victoria, for their diligent assistance with loans.
Supplementary Material
The Supplementary Material for this article can be found online at: https://www.frontiersin.org/articles/10.3389/fmars.2019.00791/full#supplementary-material
Footnotes
- ^ http://bioinformatics.org/t̃ryphon/populations/
- ^ http://taylor0.biology.ucla.edu/structureHarvester/
References
Agardy, M. T. (1994). Advances in marine conservation: the role of marine protected areas. Trends Ecol. Evol. 9, 267–270. doi: 10.1016/0169-5347(94)90297-6
Ahyong, S. T., and Poore, G. C. (2004). Deep-water Galatheidae (Crustacea: Decapoda: Anomura) from southern and eastern Australia. Zootaxa 472, 3–76. doi: 10.11646/zootaxa.472.1.1
Antao, T., Lopes, A., Lopes, R. J., Beja-Pereira, A., and Luikart, G. (2008). LOSITAN: a workbench to detect molecular adaptation based on a F ST-outlier method. BMC Bioinformatics 9:323. doi: 10.1186/1471-2105-9-323
Baba, K. (2005). Deep-sea chirostylid and galatheid crustaceans (Decapoda: Anomura) from the Indo-Pacific, with a list of species. Galathea Rep. 20, 1–317.
Baba, K., Fujita, Y., Wehrtmann, I. S., and Scholtz, G. (2011). “Developmental biology of squat lobsters,” in The Biology of Squat Lobsters, eds G. C. B. Poore, S. T. Ahyong, and J. Taylor, (Melbourne: CSIRO Publishing), 105–148.
Baba, K., Macpherson, E., Poore, G. C., Ahyong, S. T., Bermudez, A., Cabezas, P., et al. (2008). Catalogue of Squat Lobsters of the World (Crustacea: Decapoda: Anomura—Families Chirostylidae, Galatheidae and Kiwaidae). Auckland: Magnolia Press.
Baco, A. R., Etter, R. J., Ribeiro, P. A., von der Heyden, S., Beerli, P., and Kinlan, B. P. (2016). A synthesis of genetic connectivity in deep-sea fauna and implications for marine reserve design. Mol. Ecol. 25, 3276–3298. doi: 10.1111/mec.13689
Baeza, J. A. (2011). “Squat lobsters as symbionts and in chemo-autotrophic environments,” in The Biology of Squat Lobsters, eds G. C. B. Poore, S. T. Ahyong, and J. Taylor, (Melbourne: CSIRO Publishing), 249–270.
Beger, M., Selkoe, K. A., Treml, E., Barber, P. H., Von Der Heyden, S., Crandall, E. D., et al. (2014). Evolving coral reef conservation with genetic information. Bull. Mar. Sci. 90, 159–185. doi: 10.5343/bms.2012.1106
Benjamini, Y., and Hochberg, Y. (1995). Controlling the false discovery rate: a practical and powerful approach to multiple testing. J. R. Stat. Soc. Ser. B Methodol. 57, 289–300. doi: 10.1111/j.2517-6161.1995.tb02031.x
Bors, E. K., Rowden, A. A., Maas, E. W., Clark, M. R., and Shank, T. M. (2012). Patterns of deep-sea genetic connectivity in the New Zealand region: implications for management of benthic ecosystems. PLoS One 7:e49474. doi: 10.1371/journal.pone.0049474
Boschen, R. E., Collins, P. C., Tunnicliffe, V., Carlsson, J., Gardner, J. P. A., Lowe, J., et al. (2016). A primer for use of genetic tools in selecting and testing the suitability of set-aside sites protected from deep-sea seafloor massive sulfide mining activities. Ocean Coast. Manag. 122, 37–48. doi: 10.1016/j.ocecoaman.2016.01.007
Boschen, R. E., Rowden, A. A., Clark, M. R., and Gardner, J. P. A. (2015). Limitations in the use of archived vent mussel samples to assess genetic connectivity among seafloor massive sulfide deposits: a case study with implications for environmental management. Front. Mar. Sci. 2:105. doi: 10.3389/fmars.2015.00105
Boyle, E. A., Thaler, A. D., Jacobson, A., Plouviez, S., and Van Dover, C. L. (2013). Characterization of 10 polymorphic microsatellite loci in Munidopsis lauensis, a squat-lobster from the southwestern Pacific. Conserv. Genet. Resour. 5, 647–649. doi: 10.1007/s12686-013-9872-1
Brodie, S., and Clark, M. R. (2003). “The New Zealand seamount management strategy–steps towards conserving offshore marine habitat,” in Aquatic Protected Areas: what Works Best and How Do We Know? Proceedings of the World Congress on Aquatic Protected Areas, Cairns, Australia, August 2002, eds J. P. Beumer, A. Grant, and D. C. Smith, (Cairns: Australian Society of Fish Biology), 664–673.
Brookfield, J. F. Y. (1996). A simple new method for estimating null allele frequency from heterozygote deficiency. Mol. Ecol. 5, 453–455. doi: 10.1046/j.1365-294X.1996.00098.x
Bruce, B. D., Griffin, D. A., and Bradford, R. W. (2007). Larval Transport and Recruitment Processes of Southern Rock Lobster. Hobart: CSIRO Marine and Atmospheric Research.
Burland, T. G. (2000). “DNASTAR’s Lasergene sequence analysis software,” in Bioinformatics Methods and Protocols, eds S. Misener, and S. A. Krawetz, (Totowa, NJ: Humana Press), 71–91. doi: 10.1385/1-59259-192-2:71
Cabezas, P., Alda, F., Macpherson, E., and Machordom, A. (2012). Genetic characterization of the endangered and endemic anchialine squat lobster Munidopsis polymorpha from Lanzarote (Canary Islands): management implications. ICES J. Mar. Sci. 69, 1030–1037. doi: 10.1093/icesjms/fss062
Chiswell, S. M., Bostock, H. C., Sutton, P. J. H., and Williams, M. J. M. (2015). Physical oceanography of the deep seas around New Zealand: a review. N. Z. J. Mar. Freshwater Res. 49, 286–317. doi: 10.1080/00288330.2014.992918
Chiswell, S. M., Wilkin, J., Booth, J. D., and Stanton, B. (2003). Trans-Tasman Sea larval transport: is Australia a source for New Zealand rock lobsters? Mar. Ecol. Prog. Ser. 247, 173–182. doi: 10.3354/meps247173
Clark, M. R., Watling, L., Rowden, A. A., Guinotte, J. M., and Smith, C. R. (2011). A global seamount classification to aid the scientific design of marine protected area networks. Ocean Coast. Manag. 54, 19–36. doi: 10.1016/j.ocecoaman.2010.10.006
Coleman, M. A., Chambers, J., Knott, N. A., Malcolm, H. A., Harasti, D., Jordan, A., et al. (2011). Connectivity within and among a network of temperate marine reserves. PLoS One 6:e20168. doi: 10.1371/journal.pone.0020168
Corander, J., Marttinen, P., Sirén, J., and Tang, J. (2008). Enhanced bayesian modelling in BAPS software for learning genetic structures of populations. BMC Bioinformatics 9:539. doi: 10.1186/1471-2105-9-539
Cordes, E. E., Jones, D. O., Schlacher, T. A., Amon, D. J., Bernardino, A. F., Brooke, S., et al. (2016). Environmental impacts of the deep-water oil and gas industry: a review to guide management strategies. Front. Environ. Sci. 4:58. doi: 10.3389/fenvs.2016.00058
Coykendall, D. K., Nizinski, M. S., and Morrison, C. L. (2017). A phylogenetic perspective on diversity of Galatheoidea (Munida, Munidopsis) from cold-water coral and cold seep communities in the western North Atlantic Ocean. Deep Sea Res. Part II Top. Stud. Oceanogr. 137, 258–272. doi: 10.1016/j.dsr2.2016.08.014
da Silva, J. M., Creer, S., dos Santos, A., Costa, A. C., Cunha, M. R., Costa, F. O., et al. (2011). Systematic and evolutionary insights derived from mtDNA COI barcode diversity in the Decapoda (Crustacea: Malacostraca). PLoS One 6:e19449. doi: 10.1371/journal.pone.0019449
Dailianis, T., Tsigenopoulos, C. S., Dounas, C., and Voultsiadou, E. (2011). Genetic diversity of the imperilled bath sponge Spongia officinalis Linnaeus, 1759 across the Mediterranean Sea: patterns of population differentiation and implications for taxonomy and conservation. Mol. Ecol. 20, 3757–3772. doi: 10.1111/j.1365-294X.2011.05222.x
Dakin, E. E., and Avise, J. C. (2004). Microsatellite null alleles in parentage analysis. Heredity 93, 504–509. doi: 10.1038/sj.hdy.6800545
DeWoody, J., Nason, J. D., and Hipkins, V. D. (2006). Mitigating scoring errors in microsatellite data from wild populations. Mol. Ecol. Notes 6, 951–957. doi: 10.1111/j.1471-8286.2006.01449.x
Evanno, G., Regnaut, S., and Goudet, J. (2005). Detecting the number of clusters of individuals using the software STRUCTURE: a simulation study. Mol. Ecol. 14, 2611–2620. doi: 10.1111/j.1365-294X.2005.02553.x
Excoffier, L., and Lischer, H. E. L. (2010). Arlequin suite ver 3.5: a new series of programs to perform population genetics analyses under Linux and Windows. Mol. Ecol. Resour. 10, 564–567. doi: 10.1111/j.1755-0998.2010.02847.x
Faubet, P., Waples, R. S., and Gaggiotti, O. E. (2007). Evaluating the performance of a multilocus Bayesian method for the estimation of migration rates. Mol. Ecol. 16, 1149–1166. doi: 10.1111/j.1365-294X.2007.03218.x
Faurby, S., and Barber, P. H. (2012). Theoretical limits to the correlation between pelagic larval duration and population genetic structure. Mol. Ecol. 21, 3419–3432. doi: 10.1111/j.1365-294X.2012.05609.x
Folmer, O., Black, M., Hoeh, W., Lutz, R., and Vrijenhoes, R. (1994). DNA primers for amplification of mitochondrial cytochrome c oxidase subunit I from diverse metazoan invertebrates. Mol. Mar. Biol. Biotechnol. 3, 294–299.
Food and Agricultural Organisation of the United Nations (2009). International Guidelines for the Management of Deep-Sea Fisheries in the High Seas. Rome: FAO.
Freeland, J. R. (2005). “Molecular markers in ecology,” in Molecular Ecology, ed. H. Kirk, (Chichester: John Wiley and Sons), 31–62.
García-Merchán, V. H., Robainas-Barcia, A., Abelló, P., Macpherson, E., Palero, F., García-Rodríguez, M., et al. (2012). Phylogeographic patterns of decapod crustaceans at the Atlantic–Mediterranean transition. Mol. Phylogenet. Evol. 62, 664–672. doi: 10.1016/j.ympev.2011.11.009
Gjerde, K. M., Reeve, L. L. N., Harden-Davies, H., Ardron, J., Dolan, R., Durussel, C., et al. (2016). Protecting Earth’s last conservation frontier: scientific, management and legal priorities for MPAs beyond national boundaries. Aquat. Conserv. 26, 45–60. doi: 10.1002/aqc.2646
Gollner, S., Kaiser, S., Menzel, L., Jones, D. O., Brown, A., Mestre, N. C., et al. (2017). Resilience of benthic deep-sea fauna to mining activities. Mar. Environ. Res. 129, 76–101. doi: 10.1016/j.marenvres.2017.04.010
Goudet, J. (2002). FSTAT, a Program to Estimate and Test Gene Diversities and Fixation Indices, version 2.9.3. Available at: https://www2.unil.ch/popgen/softwares/fstat.htm [accessed December 4, 2018].
Guo, S. W., and Thompson, E. A. (1992). Performing the exact test of Hardy-Weinberg proportion for multiple alleles. Biometrics 48, 361–372. doi: 10.2307/2532296
Hale, M. L., Burg, T. M., and Steeves, T. E. (2012). Sampling for microsatellite-based population genetic studies: 25 to 30 individuals per population is enough to accurately estimate allele frequencies. PLoS One 7:e45170. doi: 10.1371/journal.pone.0045170
Handayani, M., Anggoro, S., Widowati, I., and Hideyuki, I. (2014). Molecular ecology comparison of blue leg hermit crab (Calcinus elegans) based on spatial factor in south coast of Java Island. Int. J. Mar. Aquat. Resour. Conserv. Coexistence 1, 12–18. doi: 10.14710/ijmarcc.1.1.p
Haye, P. A., Salinas, P., Acuna, E., and Poulin, E. (2010). Heterochronic phenotypic plasticity with lack of genetic differentiation in the southeastern Pacific squat lobster Pleuroncodes monodon. Evol. Dev. 12, 628–634. doi: 10.1111/j.1525-142X.2010.00447.x
Hedrick, P. W. (1999). Perspective: highly variable loci and their interpretation in evolution and conservation. Evolution 53, 313–318. doi: 10.1111/j.1558-5646.1999.tb03767.x
Helson, J., Leslie, S., Clement, G., Wells, R., and Wood, R. (2010). Private rights, public benefits: industry-driven seabed protection. Mar. Policy 34, 557–566. doi: 10.1016/j.marpol.2009.11.002
Henderson, J. R. (1885). Diagnoses of new species of Galatheidae collected during the “Challenger” expedition. Annals and Magazine of Natural History (ser. 5) 16, 407–421. doi: 10.1080/00222938509459908
Herrera, S., Shank, T. M., and Sánchez, J. A. (2012). Spatial and temporal patterns of genetic variation in the widespread antitropical deep-sea coral Paragorgia arborea. Mol. Ecol. 21, 6053–6067. doi: 10.1111/mec.12074
Hilário, A., Metaxas, A., Gaudron, S. M., Howell, K. L., Mercier, A., Mestre, N. C., et al. (2015). Estimating dispersal distance in the deep sea: challenges and applications to marine reserves. Front. Mar. Sci. 2:6. doi: 10.3389/fmars.2015.00006
Holland, L. P., Rowden, A. A., Hamilton, J. Z., Clark, M. R., Chiswell, S. M., and Gardner, J. P. A. (2019). Genetic Connectivity of Deep-Sea Corals in the New Zealand Region. Wellington: Ministry for Primary Industries.
Hubisz, M. J., Falush, D., Stephens, M., and Pritchard, J. K. (2009). Inferring weak population structure with the assistance of sample group information. Mol. Ecol. Resour. 9, 1322–1332. doi: 10.1111/j.1755-0998.2009.02591.x
Iftekhar, M., Tisdell, J., and Gilfedder, L. (2014). Private lands for biodiversity conservation: review of conservation covenanting programs in Tasmania, Australia. Biol. Conserv. 169, 176–184. doi: 10.1016/j.biocon.2013.10.013
Johnson, M. S., and Black, R. (1984). The Wahlund effect and the geographical scale of variation in the intertidal limpet Siphonaria sp. Mar. Biol. 79, 295–302. doi: 10.1007/BF00393261
Jombart, T., and Ahmed, I. (2011). adegenet 1.3-1: new tools for the analysis of genome-wide SNP data. Bioinformatics 27, 3070–3071. doi: 10.1093/bioinformatics/btr521
Jombart, T., Devillard, S., and Balloux, F. (2010). Discriminant analysis of principal components: a new method for the analysis of genetically structured populations. BMC Genet. 11:94. doi: 10.1186/1471-2156-11-94
Kalinowski, S. T., Taper, M. L., and Marshall, T. C. (2007). Revising how the computer program CERVUS accommodates genotyping error increases success in paternity assignment. Mol. Ecol. 16, 1099–1106. doi: 10.1111/j.1365-294X.2007.03089.x
Kopelman, N. M., Mayzel, J., Jakobsson, M., Rosenberg, N. A., and Mayrose, I. (2015). CLUMPAK: a program for identifying clustering modes and packaging population structure inferences across K. Mol. Ecol. Resour. 15, 1179–1191. doi: 10.1111/1755-0998.12387
Kumar, S., Stecher, G., and Tamura, K. (2016). MEGA7: molecular evolutionary genetics analysis version 7.0 for bigger datasets. Mol. Biol. Evol. 33, 1870–1874. doi: 10.1093/molbev/msw054
Latch, E. K., Dharmarajan, G., Glaubitz, J. C., and Rhodes, O. E. (2006). Relative performance of Bayesian clustering software for inferring population substructure and individual assignment at low levels of population differentiation. Conserv. Genet. 7, 295–302. doi: 10.1007/s10592-005-9098-1
Leathwick, J., Moilanen, A., Francis, M., Elith, J., Taylor, P., Julian, K., et al. (2008). Novel methods for the design and evaluation of marine protected areas in offshore waters. Conserv. Lett. 1, 91–102. doi: 10.1111/j.1755-263X.2008.00012.x
Leigh, J. W., and Bryant, D. (2015). POPART: full-feature software for haplotype network construction. Methods Ecol. Evol. 6, 1110–1116. doi: 10.1111/2041-210X.12410
Lumsden, S. E., Hourigan, T. F., Bruckner, A. W., and Dorr, G. (2007). The State of Deep Coral Ecosystems of the United States. Silver Spring, MD: NOA Technical Memorandum CRCP-3.
Miller, K. A., Thompson, K. F., Johnston, P., and Santillo, D. (2018). An overview of seabed mining including the current state of development, environmental impacts and knowledge gaps. Front. Mar. Sci. 4:418. doi: 10.3389/fmars.2017.00418
Miller, K. J., and Gunasekera, R. M. (2017). A comparison of genetic connectivity in two deep sea corals to examine whether seamounts are isolated islands or stepping stones for dispersal. Sci. Rep. 7:46103. doi: 10.1038/srep46103
Miller, K. J., Rowden, A. A., Williams, A., and Häussermann, V. (2011). Out of their depth? Isolated deep populations of the cosmopolitan coral Desmophyllum dianthus may be highly vulnerable to environmental change. PLoS One 6:e19004. doi: 10.1371/journal.pone.0019004
Miller, K. J., Williams, A., Rowden, A. A., Knowles, C., and Dunshea, G. (2010). Conflicting estimates of connectivity among deep-sea coral populations. Mar. Ecol. 31, 144–157. doi: 10.1111/j.1439-0485.2010.00380.x
Molecular Ecology Resources Primer Development Consortium, Andris, M., Aradottir, G. I., Arnau, G., Audzijonyte, A., Bess, E. C., et al. (2010). Permanent genetic resources added to molecular ecology resources database 1 June 2010–31 July 2010. Mol. Ecol. Resour. 10, 1106–1108. doi: 10.1111/j.1755-0998.2010.02916.x
Morgan, E. M., Green, B. S., Murphy, N. P., and Strugnell, J. M. (2013). Investigation of genetic structure between deep and shallow populations of the southern rock lobster, Jasus edwardsii in Tasmania, Australia. PLoS One 8:e77978. doi: 10.1371/journal.pone.0077978
Nakajima, Y., Shinzato, C., Khalturina, M., Nakamura, M., Watanabe, H. K., Nakagawa, S., et al. (2018). Isolation and characterization of novel polymorphic microsatellite loci for the deep-sea hydrothermal vent limpet, Lepetodrilus nux, and the vent-associated squat lobster, Shinkaia crosnieri. Mar. Biodivers. 48, 677–684. doi: 10.1007/s12526-017-0704-5
Nei, M., Tajima, F., and Tateno, Y. (1983). Accuracy of estimated phylogenetic trees from molecular data. J. Mol. Evol. 19, 153–170. doi: 10.1007/bf02300753
Palumbi, S. R. (2003). Population genetics, demographic connectivity, and the design of marine reserves. Ecol. Appl. 13, 146–158. doi: 10.1890/1051-0761(2003)013%5B0146:pgdcat%5D2.0.co;2
Pandolfi, J. M., Bradbury, R. H., Sala, E., Hughes, T. P., Bjorndal, K. A., Cooke, R. G., et al. (2003). Global trajectories of the long-term decline of coral reef ecosystems. Science 301, 955–958. doi: 10.1126/science.1085706
Parker, S. J., and Bowden, D. A. (2010). Identifying taxonomic groups vulnerable to bottom longline fishing gear in the Ross Sea region. CCAMLR Sci. 17, 105–127.
Parker, S. J., Penney, A. J., and Clark, M. R. (2009). Detection criteria for managing trawl impacts on vulnerable marine ecosystems in high seas fisheries of the South Pacific Ocean. Mar. Ecol. Prog. Ser. 397, 309–317. doi: 10.3354/meps08115
Peakall, R., and Smouse, P. E. (2012). GenAlEx 6.5: genetic analysis in Excel. Population genetic software for teaching and research—an update. Bioinformatics 28, 2537–2539. doi: 10.1093/bioinformatics/bts460
Penney, A. J., and Guinotte, J. M. (2013). Evaluation of New Zealand’s high-seas bottom trawl closures using predictive habitat models and quantitative risk assessment. PLoS One 8:e82273. doi: 10.1371/journal.pone.0082273
Penney, A. J., Parker, S. J., and Brown, J. H. (2009). Protection measures implemented by New Zealand for vulnerable marine ecosystems in the South Pacific Ocean. Mar. Ecol. Prog. Ser. 397, 341–354. doi: 10.3354/meps08300
Pérez-Barros, P., Lovrich, G. A., Calcagno, J. A., and Confalonieri, V. A. (2014). Is Munida gregaria (Crustacea: Decapoda: Munididae) a truly transpacific species? Polar Biol. 37, 1413–1420. doi: 10.1007/s00300-014-1531-9
Pérez-Barros, P., Thatje, S., Calcagno, J. A., and Lovrich, G. A. (2007). Larval development of the subantarctic squat lobster Munida subrugosa (White, 1847) (Anomura: Galatheidae), reared in the laboratory. J. Exp. Mar. Biol. Ecol. 352, 35–41. doi: 10.1016/j.jembe.2007.06.035
Piry, S., Alapetite, A., Cornuet, J.-M., Paetkau, D., Baudouin, L., and Estoup, A. (2004). GENECLASS2: a software for genetic assignment and first-generation migrant detection. J. Hered. 95, 536–539. doi: 10.1093/jhered/esh074
Pritchard, J. K., Stephens, M., and Donnelly, P. (2000). Inference of population structure using multilocus genotype data. Genetics 155, 945–959.
Pujolar, J. M., Schiavina, M., Di Franco, A., Melià, P., Guidetti, P., Gatto, M., et al. (2013). Understanding the effectiveness of marine protected areas using genetic connectivity patterns and Lagrangian simulations. Divers. Distrib. 19, 1531–1542. doi: 10.1111/ddi.12114
Ramirez-Llodra, E., Tyler, P. A., Baker, M. C., Bergstad, O. A., Clark, M. R., Escobar, E., et al. (2011). Man and the last great wilderness: human impact on the deep sea. PLoS One 6:e22588. doi: 10.1371/journal.pone.0022588
Ramirez-Llodra, E. Z., Brandt, A., Danovaro, R., De Mol, B., Escobar, E., German, C. R., et al. (2010). “Deep, diverse and definitely different: unique attributes of the world’s largest ecosystem,” in Biogeosciences, eds J. P. Gattuso, and J. Kesselmeier, (Göttingen: Copernicus Publications), 2851–2899. doi: 10.5194/bg-7-2851-2010
Raymond, M., and Rousset, F. (1995). An exact test for population differentiation. Evolution 49, 1280–1283. doi: 10.1111/j.1558-5646.1995.tb04456.x
R Development Core Team (2017) R: A Language and Environment for Statistical Computing. Available at: https://www.R-project.org/
Rodríguez-Flores, P. C., Machordom, A., and Macpherson, E. (2017). Three new species of squat lobsters of the genus Fennerogalathea Baba, 1988 (Decapoda: Galatheidae) from the Pacific Ocean. Zootaxa 4276, 46–60. doi: 10.11646/zootaxa.4276.1.2
Roterman, C. N., Copley, J. T., Linse, K. T., Tyler, P. A., and Rogers, A. D. (2016). Connectivity in the cold: the comparative population genetics of vent-endemic fauna in the Scotia Sea, Southern Ocean. Mol. Ecol. 25, 1073–1088. doi: 10.1111/mec.13541
Rousset, F. (2008). GENEPOP’007: a complete re-implementation of the GENEPOP software for Windows and Linux. Mol. Ecol. Resour. 8, 103–106. doi: 10.1111/j.1471-8286.2007.01931.x
Rowden, A. A., Schlacher, T. A., Williams, A., Clark, M. R., Stewart, R., Althaus, F., et al. (2010a). A test of the seamount oasis hypothesis: seamounts support higher epibenthic megafaunal biomass than adjacent slopes. Mar. Ecol. 31, 95–106. doi: 10.1111/j.1439-0485.2010.00369.x
Rowden, A. A., Schnabel, K. E., Schlacher, T. A., Macpherson, E., Ahyong, S. T., and de Forges, B. R. (2010b). Squat lobster assemblages on seamounts differ from some, but not all, deep-sea habitats of comparable depth. Mar. Ecol. 31, 63–83. doi: 10.1111/j.1439-0485.2010.00374.x
Rozas, J., Ferrer-Mata, A., Sánchez-DelBarrio, J. C., Guirao-Rico, S., Librado, P., Ramos-Onsins, S. E., et al. (2017). DnaSP 6: DNA sequence polymorphism analysis of large data sets. Mol. Biol. Evol. 34, 3299–3302. doi: 10.1093/molbev/msx248
Samadi, S., Bottan, L., Macpherson, E., De Forges, B. R., and Boisselier, M.-C. (2006). Seamount endemism questioned by the geographic distribution and population genetic structure of marine invertebrates. Mar. Biol. 149, 1463–1475. doi: 10.1007/s00227-006-0306-4
Santini, L., Saura, S., and Rondinini, C. (2016). Connectivity of the global network of protected areas. Divers. Distrib. 22, 199–211. doi: 10.1111/ddi.12390
Selkoe, K. A., and Toonen, R. J. (2011). Marine connectivity: a new look at pelagic larval duration and genetic metrics of dispersal. Mar. Ecol. Prog. Ser. 436, 291–305. doi: 10.3354/meps09238
Taylor, M. L., and Roterman, C. N. (2017). Invertebrate population genetics across Earth’s largest habitat: the deep-sea floor. Mol. Ecol. 26, 4872–4896. doi: 10.1111/mec.14237
Thaler, A. D., Plouviez, S., Saleu, W., Alei, F., Jacobson, A., Boyle, E. A., et al. (2014). Comparative population structure of two deep-sea Hydrothermal-Vent-Associated decapods (Chorocaris sp. 2 and Munidopsis lauensis) from southwestern Pacific back-arc basins. PLoS One 9:e101345. doi: 10.1371/journal.pone.0101345
Thresher, R. E., Guinotte, J. M., Matear, R. J., and Hobday, A. J. (2015). Options for managing impacts of climate change on a deep-sea community. Nat. Clim. Chang. 5, 635–639. doi: 10.1038/nclimate2611
United Nations General Assembly (2007). Resolution 61/105. Sustainable Fisheries, Including through the 1995 Agreement for the Implementation of the Provisions of the United Nations Convention on the Law of the Sea of 10 December 1982 Relating to the Conservation and Management of Straddling Fish Stocks and Highly Migratory Fish Stocks, and Related Instruments. UNGA A/RES/61/105. Available at: www.un.org/Depts/los/general_assembly/general_assembly_resolutions.htm (accessed December 4, 2018).
van Dover, C. L., Arnaud-Haond, S., Gianni, M., Helmreich, S., Huber, J. A., Jaeckel, A. L., et al. (2018). Scientific rationale and international obligations for protection of active hydrothermal vent ecosystems from deep-sea mining. Mar. Policy 90, 20–28. doi: 10.1016/j.marpol.2018.01.020
van Oosterhout, C., Hutchinson, W. F., Wills, D. P. M., and Shipley, P. (2004). MICRO-CHECKER: software for identifying and correcting genotyping errors in microsatellite data. Mol. Ecol. Resour. 4, 535–538. doi: 10.1111/j.1471-8286.2004.00684.x
Wang, C., Agrawal, S., Laudien, J., Häussermann, V., and Held, C. (2016). Discrete phenotypes are not underpinned by genome-wide genetic differentiation in the squat lobster Munida gregaria (Crustacea: Decapoda: Munididae): a multi-marker study covering the Patagonian shelf. BMC Evol. Biol. 16:258. doi: 10.1186/s12862-016-0836-4
Wang, J. (2017). The computer program STRUCTURE for assigning individuals to populations: easy to use but easier to misuse. Mol. Ecol. Resour. 17, 981–990. doi: 10.1111/1755-0998.12650
Waples, R. S. (2014). Testing for Hardy–Weinberg proportions: have we lost the plot? J. Hered. 106, 1–19. doi: 10.1093/jhered/esu062
Watling, L., Guinotte, J., Clark, M. R., and Smith, C. R. (2013). A proposed biogeography of the deep ocean floor. Prog. Oceanogr. 111, 91–112. doi: 10.1016/j.pocean.2012.11.003
Weersing, K., and Toonen, R. J. (2009). Population genetics, larval dispersal, and connectivity in marine systems. Mar. Ecol. Prog. Ser. 393, 1–12. doi: 10.3354/meps08287
Wilson, G. A., and Rannala, B. (2003). Bayesian inference of recent migration rates using multilocus genotypes. Genetics 163, 1177–1191.
Yan, R. J., Schnabel, K. E., Guo, X. Z., and Gardner, J. P. A. (2019). Development and characterization of 20 polymorphic microsatellite loci in the deep sea squat lobster, Munida isos Ahyong and Poore, 2004 and cross-amplification in two congeneric species. J. Genet. 98:11. doi: 10.1007/s12041-019-1062-9
Yang, C.-H., Tsuchida, S., Fujikura, K., Fujiwara, Y., Kawato, M., and Chan, T.-Y. (2016). Connectivity of the squat lobsters Shinkaia crosnieri (Crustacea: Decapoda: Galatheidae) between cold seep and hydrothermal vent habitats. Bull. Mar. Sci. 92, 17–31. doi: 10.5343/bms.2015.1031
Zeng, C., Clark, M. R., Rowden, A. A., Kelly, M., and Gardner, J. P. A. (2019). The use of spatially explicit genetic variation data from four deep-sea sponges to inform the protection of Vulnerable Marine Ecosystems. Sci. Rep. 9:5482. doi: 10.1038/s41598-019-41877-9
Zeng, C., Rowden, A. A., Clark, M. R., and Gardner, J. P. A. (2017). Population genetic structure and connectivity of deep-sea stony corals (Order Scleractinia) in the New Zealand region: implications for the conservation and management of vulnerable marine ecosystems. Evol. Appl. 10, 1040–1054. doi: 10.1111/eva.12509
Keywords: genetic diversity, genetic connectivity, management, conservation, southwest Pacific Ocean, vulnerable marine ecosystems
Citation: Yan R-J, Schnabel KE, Rowden AA, Guo X-Z and Gardner JPA (2020) Population Structure and Genetic Connectivity of Squat Lobsters (Munida Leach, 1820) Associated With Vulnerable Marine Ecosystems in the Southwest Pacific Ocean. Front. Mar. Sci. 6:791. doi: 10.3389/fmars.2019.00791
Received: 31 May 2019; Accepted: 09 December 2019;
Published: 14 January 2020.
Edited by:
Les Watling, University of Hawai‘i at Mānoa, United StatesReviewed by:
Enrique Macpherson, Spanish National Research Council (CSIC), SpainCheryl L. Morrison, United States Geological Survey (USGS), United States
Copyright © 2020 Yan, Schnabel, Rowden, Guo and Gardner. This is an open-access article distributed under the terms of the Creative Commons Attribution License (CC BY). The use, distribution or reproduction in other forums is permitted, provided the original author(s) and the copyright owner(s) are credited and that the original publication in this journal is cited, in accordance with accepted academic practice. No use, distribution or reproduction is permitted which does not comply with these terms.
*Correspondence: Ruo-Jin Yan, cmp5YW5Ac3VkYS5lZHUuY24=