Abstract
The California Current Ecosystem (CCE) is a dynamic marine ecosystem from which many socioeconomically important fisheries species are harvested. Here, a genotyping-by-sequencing (GBS) approach was used to examine genomic variation in an early life stage (megalopae) of the Dungeness crab (Cancer magister), which constitutes the most valuable single-species commercial fishery in the CCE. Variation in abundance and timing of megalopae recruitment has been extensively studied for over two decades in Coos Bay, Oregon, United States. Within the CCE, documented timing of Dungeness crab life history events indicates that coastal megalopae recruitment is expected to occur April through July; however, long-term studies in Coos Bay have observed late-season recruitment from August to October. Based on variation at 1,913 presumably neutral loci, evidence was found for weak, yet significant differentiation (FST estimate = 0.0011) between the 2014 expected-season recruits (n = 47) and late-season recruits (n = 47) collected in Coos Bay. However, two putatively adaptive loci with a high FST estimate (0.2036) between expected-season and late-season recruits were identified. These findings support the hypothesis that expected-season and late-season megalopae recruiting to Coos Bay within the same year may have originated from different locations or from different breeding groups. Understanding marine species connectivity between ecosystems is important when considering how future changes in ocean conditions may impact fishery harvests.
Introduction
The California Current Ecosystem (CCE) is a dynamic marine ecosystem that spans from Vancouver Island, British Columbia, Canada to Baja California, Mexico (Fautin et al., 2010). This large marine ecosystem exhibits spatial and temporal variations in ocean conditions, such as sea surface temperature, sea surface height, timing of spring transition, alongshore winds, and upwelling events (Guisan and Thuiller, 2005). Ocean conditions resulting from climate forcing are the primary drivers of fisheries harvest variability within the CCE (Sherman, 2006). The many fishery species annually harvested within the CCE have socioeconomic-importance to the adjacent coastal communities (Fuller et al., 2017; Miller et al., 2017; Ritzman et al., 2018).
The Dungeness crab (Cancer magister, Dana, 1852, following the naming convention currently recognized by the Integrated Taxonomic Information System) is considered the most valuable single-species commercial fishery within the CCE, regularly earning the highest annual coastwide ex-vessel value (Rasmuson, 2013; California Department of Fish and Wildlife, 2018; Oregon Department of Fish and Wildlife, 2018; Washington Department of Fish and Wildlife, 2018). Dungeness crab landings within the CCE have fluctuated annually, by an order of magnitude, since the establishment of the commercial fishery in the early 1900s (Rasmuson, 2013). At present, managers regulate the CCE Dungeness crab commercial fishery using the “3-S strategy,” size, sex, and season, which limits harvest to only male crab of a certain carapace width during a specified season (Fisher and Velasquez, 2008; Rasmuson, 2013; California Department of Fish and Wildlife, 2018; Oregon Department of Fish and Wildlife, 2018). Although methods for aging adult Dungeness crab currently do not exist, catch models approximate that, on average, the CCE crab reach legal size for commercial harvest at age four (Botsford, 1984; Johnson et al., 1986). Therefore, under the current management strategy, it is estimated that greater than 90% of all age four male crabs are harvested annually; indicating that the coastwide CCE Dungeness crab commercial fishery landings (Washington, Oregon, and California, United States) are a reasonable proxy for the size of the age 4 year class (Hackett et al., 2003). Furthermore, the CCE harvest variability has often been attributed to larval success of each year class, when the Dungeness crab are most vulnerable to ocean conditions (reviewed in Botsford et al., 1989; reviewed in Botsford and Lawrence, 2002; reviewed in Rasmuson, 2013).
Although the Dungeness crab is characterized as benthic at harvest, its life history begins with a long pelagic larval duration (PLD) of 3–4 months. Reproducing female crab brood their eggs until hatching, at which time the first pelagic larval stage (zoea) are moved offshore and dispersed along the coast by two main current systems within the CCE. First, zoea are transported northward by the Davidson Current (pre-spring transition; northern flowing coastal winds) and then southward by the California Current (post-spring transition; southern flowing coastal winds) (Wild and Tasto, 1983; Shanks and Roegner, 2007; Shanks, 2013). During the PLD, zoea develop through five stages before metamorphosing into a final megalopae stage (Wild and Tasto, 1983). Recruitment of the megalopae from offshore back to the nearshore occurs during coastal upwelling, when the megalopae migrate toward the coast with internal tides and then successfully settle in the nearshore environment (Jamieson and Phillips, 1988; Johnson and Shanks, 2002; Rasmuson, 2013). Migration is thought to be limited after the recruiting megalopae settle (i.e., less than 20 km a year) (Hildenbrand et al., 2011). Based on growth and survival rates within the local nearshore habitat, male Dungeness crab reproduce at least once before reaching harvestable size within the CCE fishery (McKelvey et al., 1980; Hackett et al., 2003).
Dungeness crab inhabit a large geographic area, which extends northward from the CCE to the Aleutian Islands, Alaska, United States, encompassing the Salish Sea Ecosystem (SSE) and the Gulf of Alaska (GOA) ecosystem (Wild and Tasto, 1983; Sherman and McGovern, 2012). Within and among these ecosystems, the timing of life history events differs along a latitudinal gradient (Figure 1) (reviewed in Rasmuson, 2013). For example, within the CCE, SSE, and GOA, mating occurs March–June, April–September, and June–July, respectively (Strathmann, 1987; Fisher, 2006). Likewise, subsequent egg brooding and larval hatch timing differs latitudinally. Within the southern portion of the CCE (coastal California), larval hatching occurs December-February and within the northern portion of the CCE (coastal Oregon and Washington), larval hatching occurs January-March. Furthermore, hatching occurs February–May within the SSE and much later in the year (i.e., June–July) within the GOA (Strathmann, 1987; Fisher, 2006).
FIGURE 1

Documented timing of Dungeness crab early life history from mating to recruitment of megalopae to the nearshore [data from Rasmuson (2013) review] (PLD: pelagic larval duration). Oregon late-season Dungeness crab recruits indicated in gray. California Current Ecosystem (CCE) locations include: coastal Washington, Oregon, and California. Puget Sound is within the Salish Sea Ecosystem (SSE) and Alaska is within the Gulf of Alaska (GOA) Ecosystem. British Columbia spans both the SSE and the GOA Ecosystem. Asterisk (*) indicates the region sampled for this study.
Documented studies of early life history of the Dungeness crab are spatially limited across the species’ large geographic distribution, but the recruitment timing and abundance of the Dungeness crab megalopae has been closely studied over the past two decades in Coos Bay, Oregon (Shanks and Roegner, 2007; Shanks et al., 2010; Shanks, 2013). Throughout the species range, regional nearshore recruitment and settlement of megalopae generally occurs 3–4 months after hatching; thus, matching the documented 3–4 month PLD of the species (Rasmuson, 2013). However, research in Coos Bay has found that megalopae recruitment continues later into the year than expected with recruits settling through August and into late October in some years (Shanks and Roegner, 2007; Shanks et al., 2010; Shanks, 2013). These late-season megalopae recruits do not fit the documented life history timing for this species.
Ocean conditions play an important role in larval transport, dispersal, survival, and overall population connectivity (Cowen and Sponaugle, 2009). The previous studies of Dungeness crab megalopae recruitment in Coos Bay have demonstrated that the Pacific Decadal Oscillation (PDO), physical spring transition, and upwelling events, are correlated with annual megalopae recruitment abundances of the Dungeness crab. For instance, the abundance of megalopae recruits in Coos Bay is higher during years of a negative PDO, earlier spring transition, and stronger upwelling (Shanks and Roegner, 2007; Shanks et al., 2010; Shanks, 2013). Accordingly, annual megalopae recruitment abundances vary annually by orders of magnitude in Coos Bay. Interestingly, Shanks et al. (2010) and Shanks (2013) also found a density dependent correlation between the annual megalopae recruitment abundances in Coos Bay and the total coastwide CCE Dungeness crab commercial landings 4 years later, when the megalopae recruitment cohort is expected to reach harvestable size (Hackett et al., 2003).
It has been hypothesized that the Dungeness crab megalopae recruiting to Coos Bay later in the year (late-season: August-September) than expected (expected-season: April–July), are from the northern portion of the species distribution such as the SSE or the GOA (Shanks, 2013). This hypothesis is based on several observations of the pelagic larval stage. First, higher abundances of Coos Bay late-season megalopae recruits are observed in negative PDO years, when the southern flowing California Current is stronger (Shanks, 2013). During negative PDO years, more water is diverted from the North Pacific Gyre to the California Current than to the GOA Current (Keister et al., 2011; Shanks, 2013); therefore, greater southern transport of larvae could occur during stronger negative PDO years. Second, the August-September timing of the late-season megalopae recruitment in Coos Bay aligns with the timing of megalopae recruitment in the two northern ecosystems of the species range, the SSE and the GOA. Third, morphologically, the Coos Bay late-season recruits are smaller than the expected-season recruits (Shanks et al., 2010), and this is consistent with studies of juvenile Dungeness crab in coastal Washington (CCE) and Puget Sound (SSE) where three intra-annual recruitment events have been observed based on differences in recruitment timing and physical size of megalopae recruits (Dinnel et al., 1993). The researchers found that the recruitment events that occurred later in the year (from August to September) was composed of smaller recruits, and concluded these smaller recruits had originated from within the Puget Sound (SSE) (Dinnel et al., 1993).
Previous genetics studies analyzing 10 neutral microsatellite loci have found evidence for genetic differentiation among the Dungeness crab from different ecosystems along the west coast of North America. For example, O’Malley et al. (2017) found evidence for strong genetic differentiation (FST > 0.16) between benthic stage Dungeness crab in coastal Oregon (CCE) and in British Columbia (samples from both the southern GOA and the northern SSE). A second study utilizing the same methods, but different geographic sampling locations, found evidence for weak, yet significant genetic differentiation (FST range = 0.002–0.004) between the benthic stage Dungeness CCE and in Puget Sound (southern SSE) (Jackson and O’Malley, 2017). The degree of population connectivity among benthic stage Dungeness crab has also been shown to vary inter-annually. Jackson et al. (2017) found evidence for genetic variation among CCE benthic adults in 2012 but not in 2014 (FST range = 0.000–0.015). Temporal variation in genetic connectivity can be a result of chaotic genetic patchiness (Johnson and Black, 1982); however, the authors hypothesized that the recruiting year classes experienced different CCE ocean conditions (i.e., spring transition and upwelling) resulting in an isolation by distance (IBD) signal in 1 year but not in the other year.
Here, we present the first study of Dungeness crab megalopae using a genotyping-by-sequencing (GBS) approach. Specifically, we examined megalopae recruiting in 2014 to Coos Bay, Oregon, a geographic location where megalopae recruitment abundances have been extensively studied by others (Shanks and Roegner, 2007; Shanks et al., 2010; Shanks, 2013). Moreover, the findings were placed in the context of the 2014 ocean conditions (i.e., positive PDO, later spring transition, and below average upwelling; Table 1) as well as the CCE commercial fishery landings during the 2018 fishery season. The primary objective of this study was to test for genetic differentiation between expected-season and late-season megalopae recruits, using both presumably neutral and putatively adaptive loci to inform inferences about the origin of late-season recruits. We hypothesized that the expected-season and late-season recruits would be genetically differentiated based on variation at presumably neutral and putatively adaptive loci because the late-season recruits originated from outside the CCE, likely the SSE or the GOA.
TABLE 1
| Ocean condition | Measure defined | 2014 | Mean 1998–2016 |
| Pacific Decadal Oscillation (PDO) | Sum of monthly PDO index (January–July) | 6.1 | 1.31 |
| Upwelling | Sum of daily upwelling (mtons/s/100 m of coastline) (March–September) at 45°N | 3,945 | 4,377 |
| Spring transition | Physical at 45°N (Julian day of year) | 129 | 104 |
California Current Ecosystem ocean conditions in 2014 [Pacific Decadal Oscillation (PDO), upwelling, and spring transition].
Materials and Methods
Larval Sample Collection
Following the methods of Shanks et al. (2010), a light trap was deployed in Coos Bay, Oregon, United States (43.34° N, 124.33° W) (Figure 2) in 2014 to collect and enumerate daily Dungeness crab megalopae recruits. The deployment time period spanned the expected-season (April–July) and late-season (August–September) recruitment for Dungeness crab megalopae, and daily counts of megalopae were recorded (Figure 3). During large recruitment events, 50 megalopae were subsampled from 1 day and preserved in 95% ethanol for genomic analyses. The carapace length and width were measured for each sampled megalopae. Despite a positive PDO, later spring transition, and below average upwelling, recruits were observed in both the expected-season and the late-season.
FIGURE 2

Location of the Dungeness crab megalopae sampling site, Coos Bay, Oregon, United States.
FIGURE 3
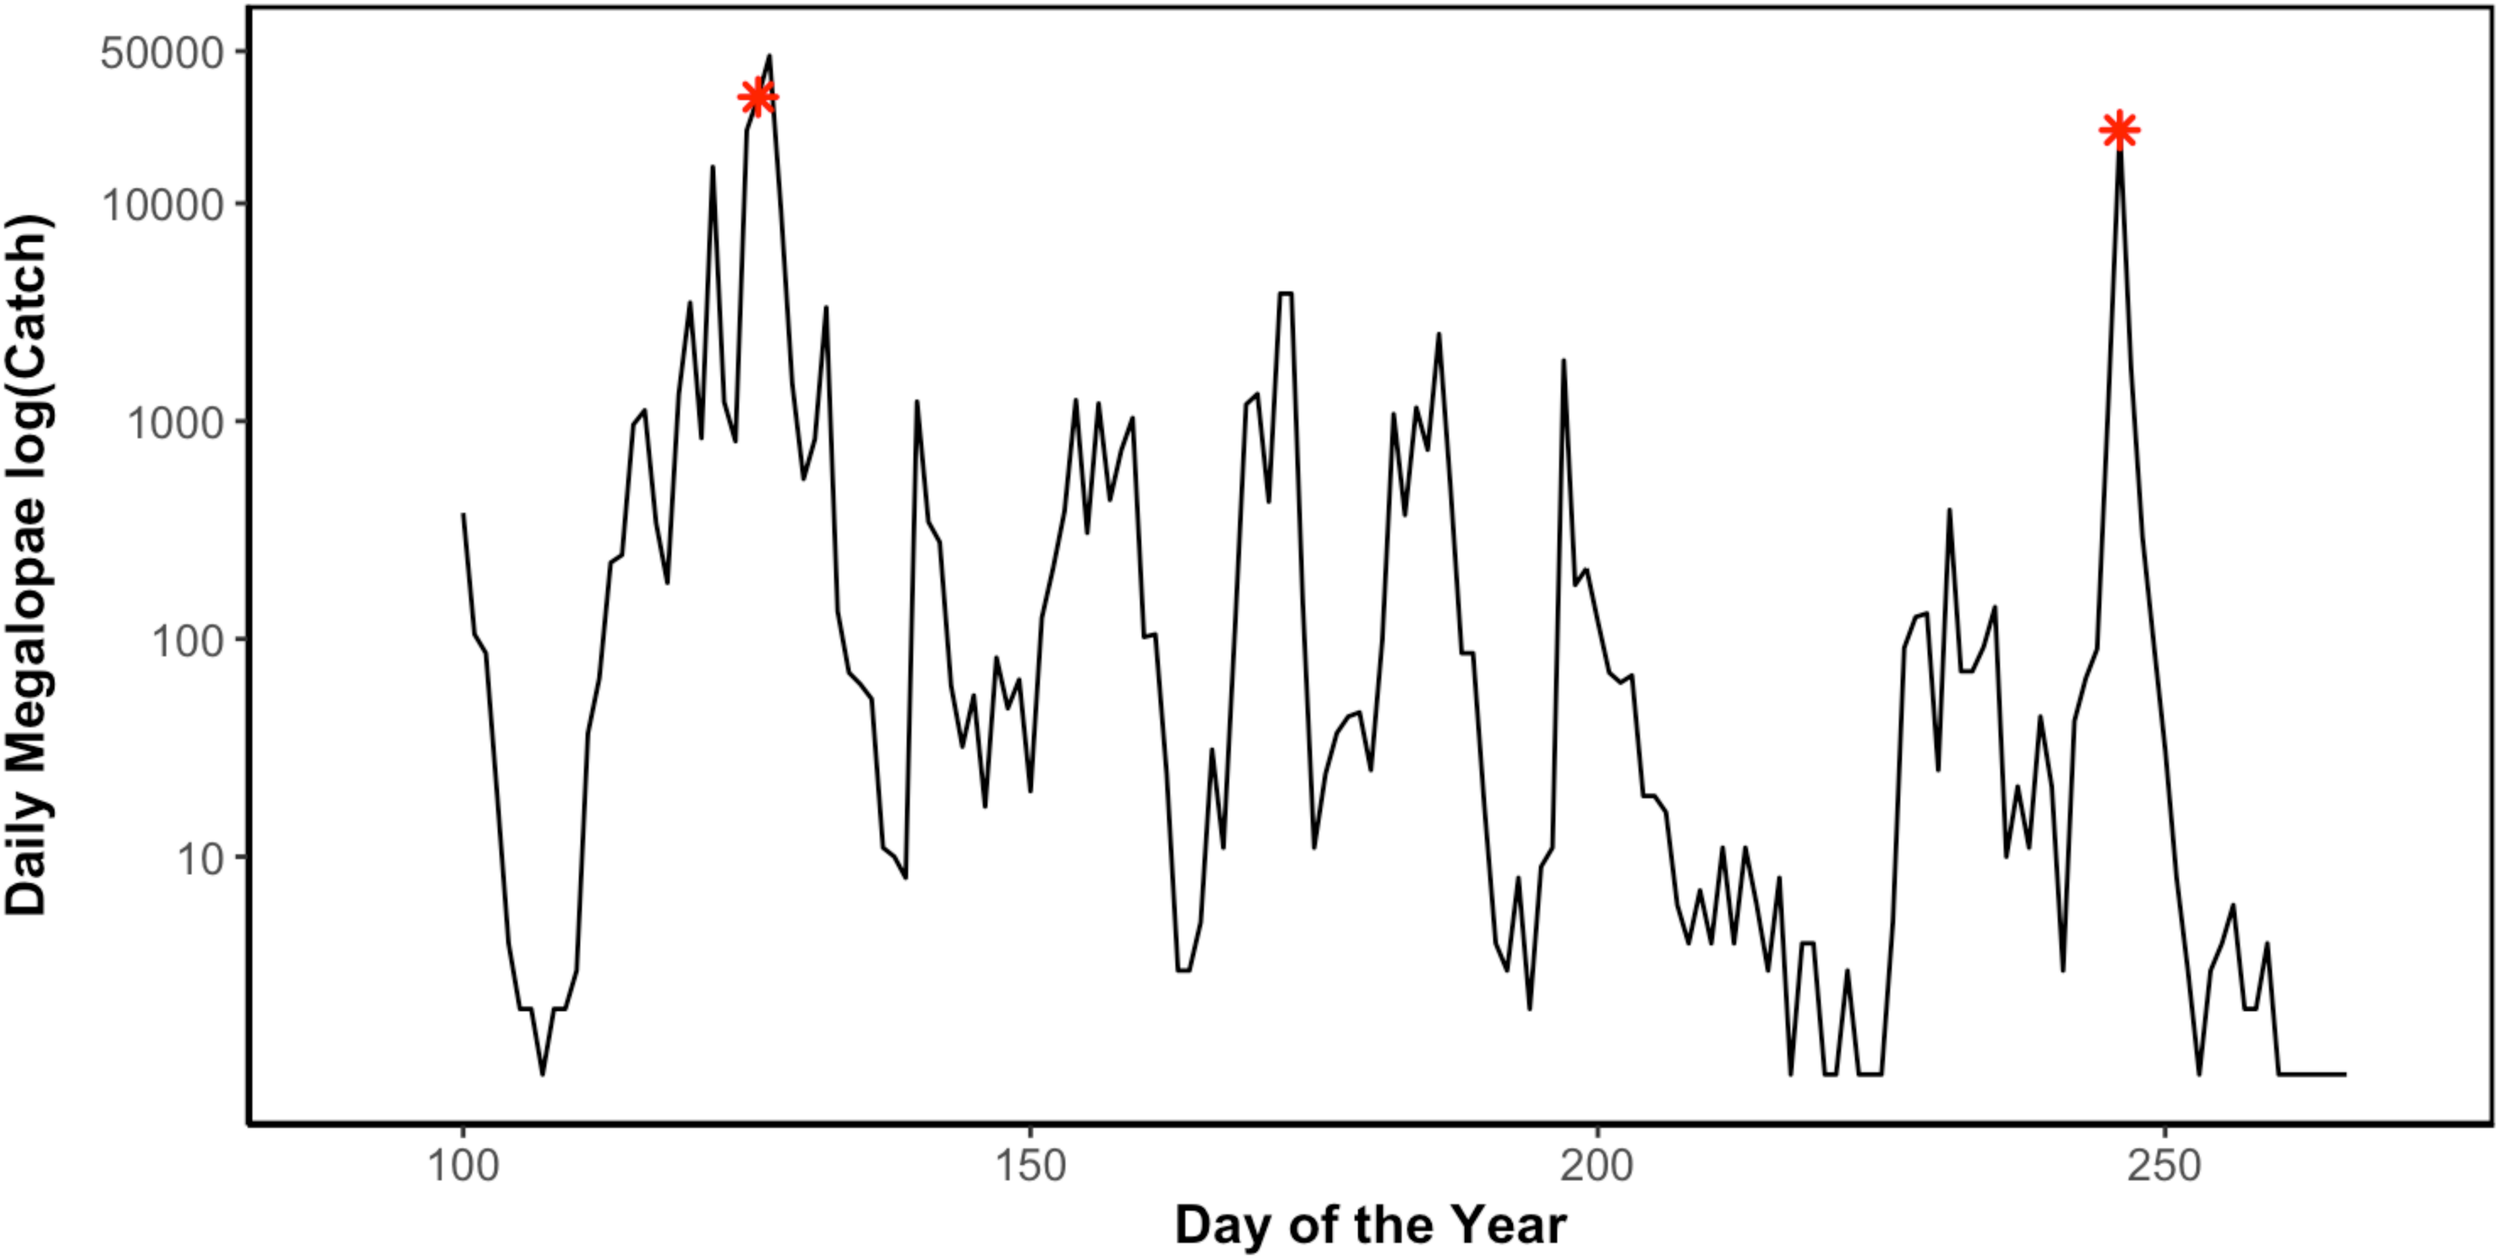
Daily Dungeness crab (C. magister) megalopae catch in Coos Bay, Oregon light trap during the 2014 recruitment season (April 10–September 29) (Julian day of year). Asterisks (∗) indicate sampling points when megalopae recruits were collected for genomic analyses (May 7 and September 3) (unpublished data Shanks, 2018).
Library Preparation and Sequencing
To investigate intra-annual differentiation among Dungeness crab recruits, 47 individual megalopae were sampled during the peak of the expected-season (May) and 47 individual megalopae were sampled during the peak of the late-season (September) (Figure 3) (unpublished data Shanks, 2018). Each individual megalopae was homogenized using a TissueLyser II (Qiagen, Hilden, Germany) and genomic DNA was extracted using the Qiagen DNeasy Blood and Tissue Kit (Qiagen, Hilden, Germany).
A GBS approach was used to sequence a set of loci across the Dungeness crab genome. Libraries consisting of 96 samples (94 unique megalopae individuals and two replicates) were constructed following the methods of Elshire et al. (2011), with the modification of double digesting the samples with the high-fidelity restriction enzymes SbfI and MspI for 1 h at 37°C. Adapters with 96 unique barcodes (5–10 base pairs in length) were ligated to the 96 samples before multiplexing, to allow for individual sample identification in downstream analyses. Size selection was not performed on the library before polymerase chain reaction (PCR) amplification with Illumina sequencing primers. A Qiagen QIAquick PCR Purification Kit (Qiagen, Hilden, Germany) was used to purify the library and an Agilent 2100 Bioanalyzer (Agilent Technologies, Santa Carla, CA, United States) was used to assess the quality of the library. The library was sequenced on an Illumina HiSeq 3000 (Illumina, San Diego, CA, United States) flow cell lane with 150 base pair (bp) paired-end sequencing chemistry. Raw, unfiltered sequencing reads were recorded in a FASTQ format file (Cock et al., 2009).
Quality Filtering and Genotyping
The raw sequencing reads were filtered before conducting population genomic analyses. The program FASTQC (v.0.11.3, Andrews, 2010) was used to assess the quality of Illumina raw reads and CUTADAPT (v.1.5, Martin, 2011) was used to trim any Illumina adapters from the raw sequences. The STACKS (v.2.2, Catchen et al., 2011, 2013) process_radtags program was used to further filter and demultiplex the paired-end reads (-P) using the inline unique barcodes (-inline_null). The process_radtags parameters were set to remove reads with an uncalled base (-c), correct barcodes and restriction enzyme sites that were one mismatch different from a true barcode or restriction site sequence (-r), and remove reads that dropped below an average quality score of 20 (-q 20) within a sliding window of 15% of the read length (-w 0.15).
Genotyping the individual megalopae using the filtered short-read sequences was accomplished using the STACKS (v.2.2, Catchen et al., 2011, 2013) software pipeline (Rochette and Catchen, 2017). The STACKSdenovo_map.pl program was used to execute each of the programs in the STACKS pipeline: ustacks, cstacks, sstacks, tsv2bam, gstacks, and populations. Parameters for each program in the pipeline were optimized for the Dungeness crab megalopae samples following the recommendations of Mastretta-Yanes et al. (2015) and Paris et al. (2017). The ustacks program (-M 2, -m 3, -N 4) was used to de novo assemble matching reads within an individual to form a set of putative loci using a maximum likelihood framework. The cstacks program (-n 1) was used to compile a catalog of all loci within the samples. The sstacks program was used to match all individuals to the complied catalog. The tsv2bam program was used to transpose the data. Finally, the gstacks program was used to assemble paired-end reads into contigs using the catalog of loci and then call single nucleotide polymorphisms (SNPs) within each locus.
Population Genomic Analyses
The STACKS (v.2.2, Catchen et al., 2011, 2013) populations program was used to compare loci between expected-season and late-season megalopae recruits (Rochette and Catchen, 2017; Paris et al., 2017). The populations program identified loci found in both expected-season and late-season samples (-p 2) and found in at least 70% of individuals in both expected-season and late-season samples (-r 0.7). Additionally, loci with minor allele frequencies greater than 0.05 (–min_maf 0.05) were retained. Only the first SNP in each locus was used for downstream analyses to maintain independence of loci (–write_single_snp). Results of the populations module were output as a Variant Call Format (VCF) file (Danecek et al., 2011). Putative Paralogous Sequence Variants (PSVs) were identified within the expected-season and late-season samples as loci with >0.6 proportion of heterozygotes and/or allele depth ratio deviation ±5 (McKinney et al., 2017), and consequently removed from the dataset. The program PLINK (v. 1.07, Purcell et al., 2007) was used to identify loci in linkage disequilibrium (r2 > 0.80), and one locus of each pair was removed. Loci were removed from the dataset using a blacklist (-B) in the STACKSpopulations program. Each remaining locus was evaluated for departure from Hardy–Weinberg Proportion (HWP) within expected-season and late-season groups using the program VCFTOOLS (v.0.1.13, Wigginton et al., 2005; Danecek et al., 2011), and a false discovery rate (FDR) correction was applied because of multiple testing (Storey et al., 2004). The R package HIERFSTAT (v.3.5.0, Goudet, 2005; R Core Team, 2018) was used to calculate allelic richness (AR), observed heterozygosity (HO), expected heterozygosity (HE), and inbreeding coefficients (FIS) within expected-season and late-season sampling groups (Nei and Chesser, 1983; Nei, 1987; El Mousadik and Petit, 1996).
Identifying Putatively Adaptive Loci
Two methods were used to identify putatively adaptive loci considered to be under selective pressure within expected-season and late-season samples. Loci with high FST values (outlier loci) were identified using the program BAYESCAN (v.2.1, Foll and Gaggiotti, 2008) with a prior of 100 and a false discovery rate threshold (q-value) of 0.05. With the program OUTFLANK (v0.2, Whitlock and Lotterhos, 2015), loci outside an inferred neutral distribution of FST values (outlier loci) were identified with a false discovery threshold (q-value) of 0.01. Putatively adaptive loci sequences were compared against the National Center for Biotechnology Information (NCBI) database using BLASTN (Nucleotide Basic Local Alignment Search Tool) (Altschul et al., 1990) and the Somewhat similar sequences program selection.
Testing for Differentiation
To test for differentiation between the expected-season and late-season megalopae recruits, pairwise FST estimates were computed for presumably neutral and putatively adaptive loci. The R packages ADEGENET (v. 3.5.0, Jombart, 2008; Jombart and Ahmed, 2011; R Core Team, 2018) and STAMPP (v. 3.5.0, Pembleton et al., 2013; R Core Team, 2018) were used to calculate pairwise FST estimate using 10,000 bootstraps across presumably neutral loci, putatively adaptive loci, and all loci to determine 95% confidence intervals and p-values (Weir and Cockerham, 1984). The R package ADEGENET was also used for a Discriminate Analysis of Principle Components (DAPC) across all loci (v. 3.5.0, Jombart et al., 2010; R Core Team, 2018).
Results
Larval Sample Collection
In 2014, 197,242 megalopae were caught in a light trap deployed in Coos Bay, Oregon between April 1 and September 30 (Figure 3) (unpublished data Shanks, 2018). Megalopae were caught on the first day the light trap was deployed, April 10. The trap was checked daily through September 23, and the last day megalopae were caught was September 17. During this time period, daily megalopae catch abundances fluctuated from 0 to 47,600. A total of 170,833 megalopae recruits (87%) were caught within the expected-season (April–July) and a total of 26,562 megalopae recruits (13%) were caught within the late-season (August–September). The largest peak in abundance was observed in May during expected-season (maximum daily count of 47,600 on May 7) and the second largest peak in abundance was observed in September during the late-season (maximum daily count of 21,700 on September 3). Forty-seven megalopae from each peak were used for the genomic analyses. The mean carapace length of the May megalopae recruits were significantly larger than the August megalopae recruits (Kolmogorov-Smirnov-test; n = 47; p < 0.01; Figure 4).
FIGURE 4
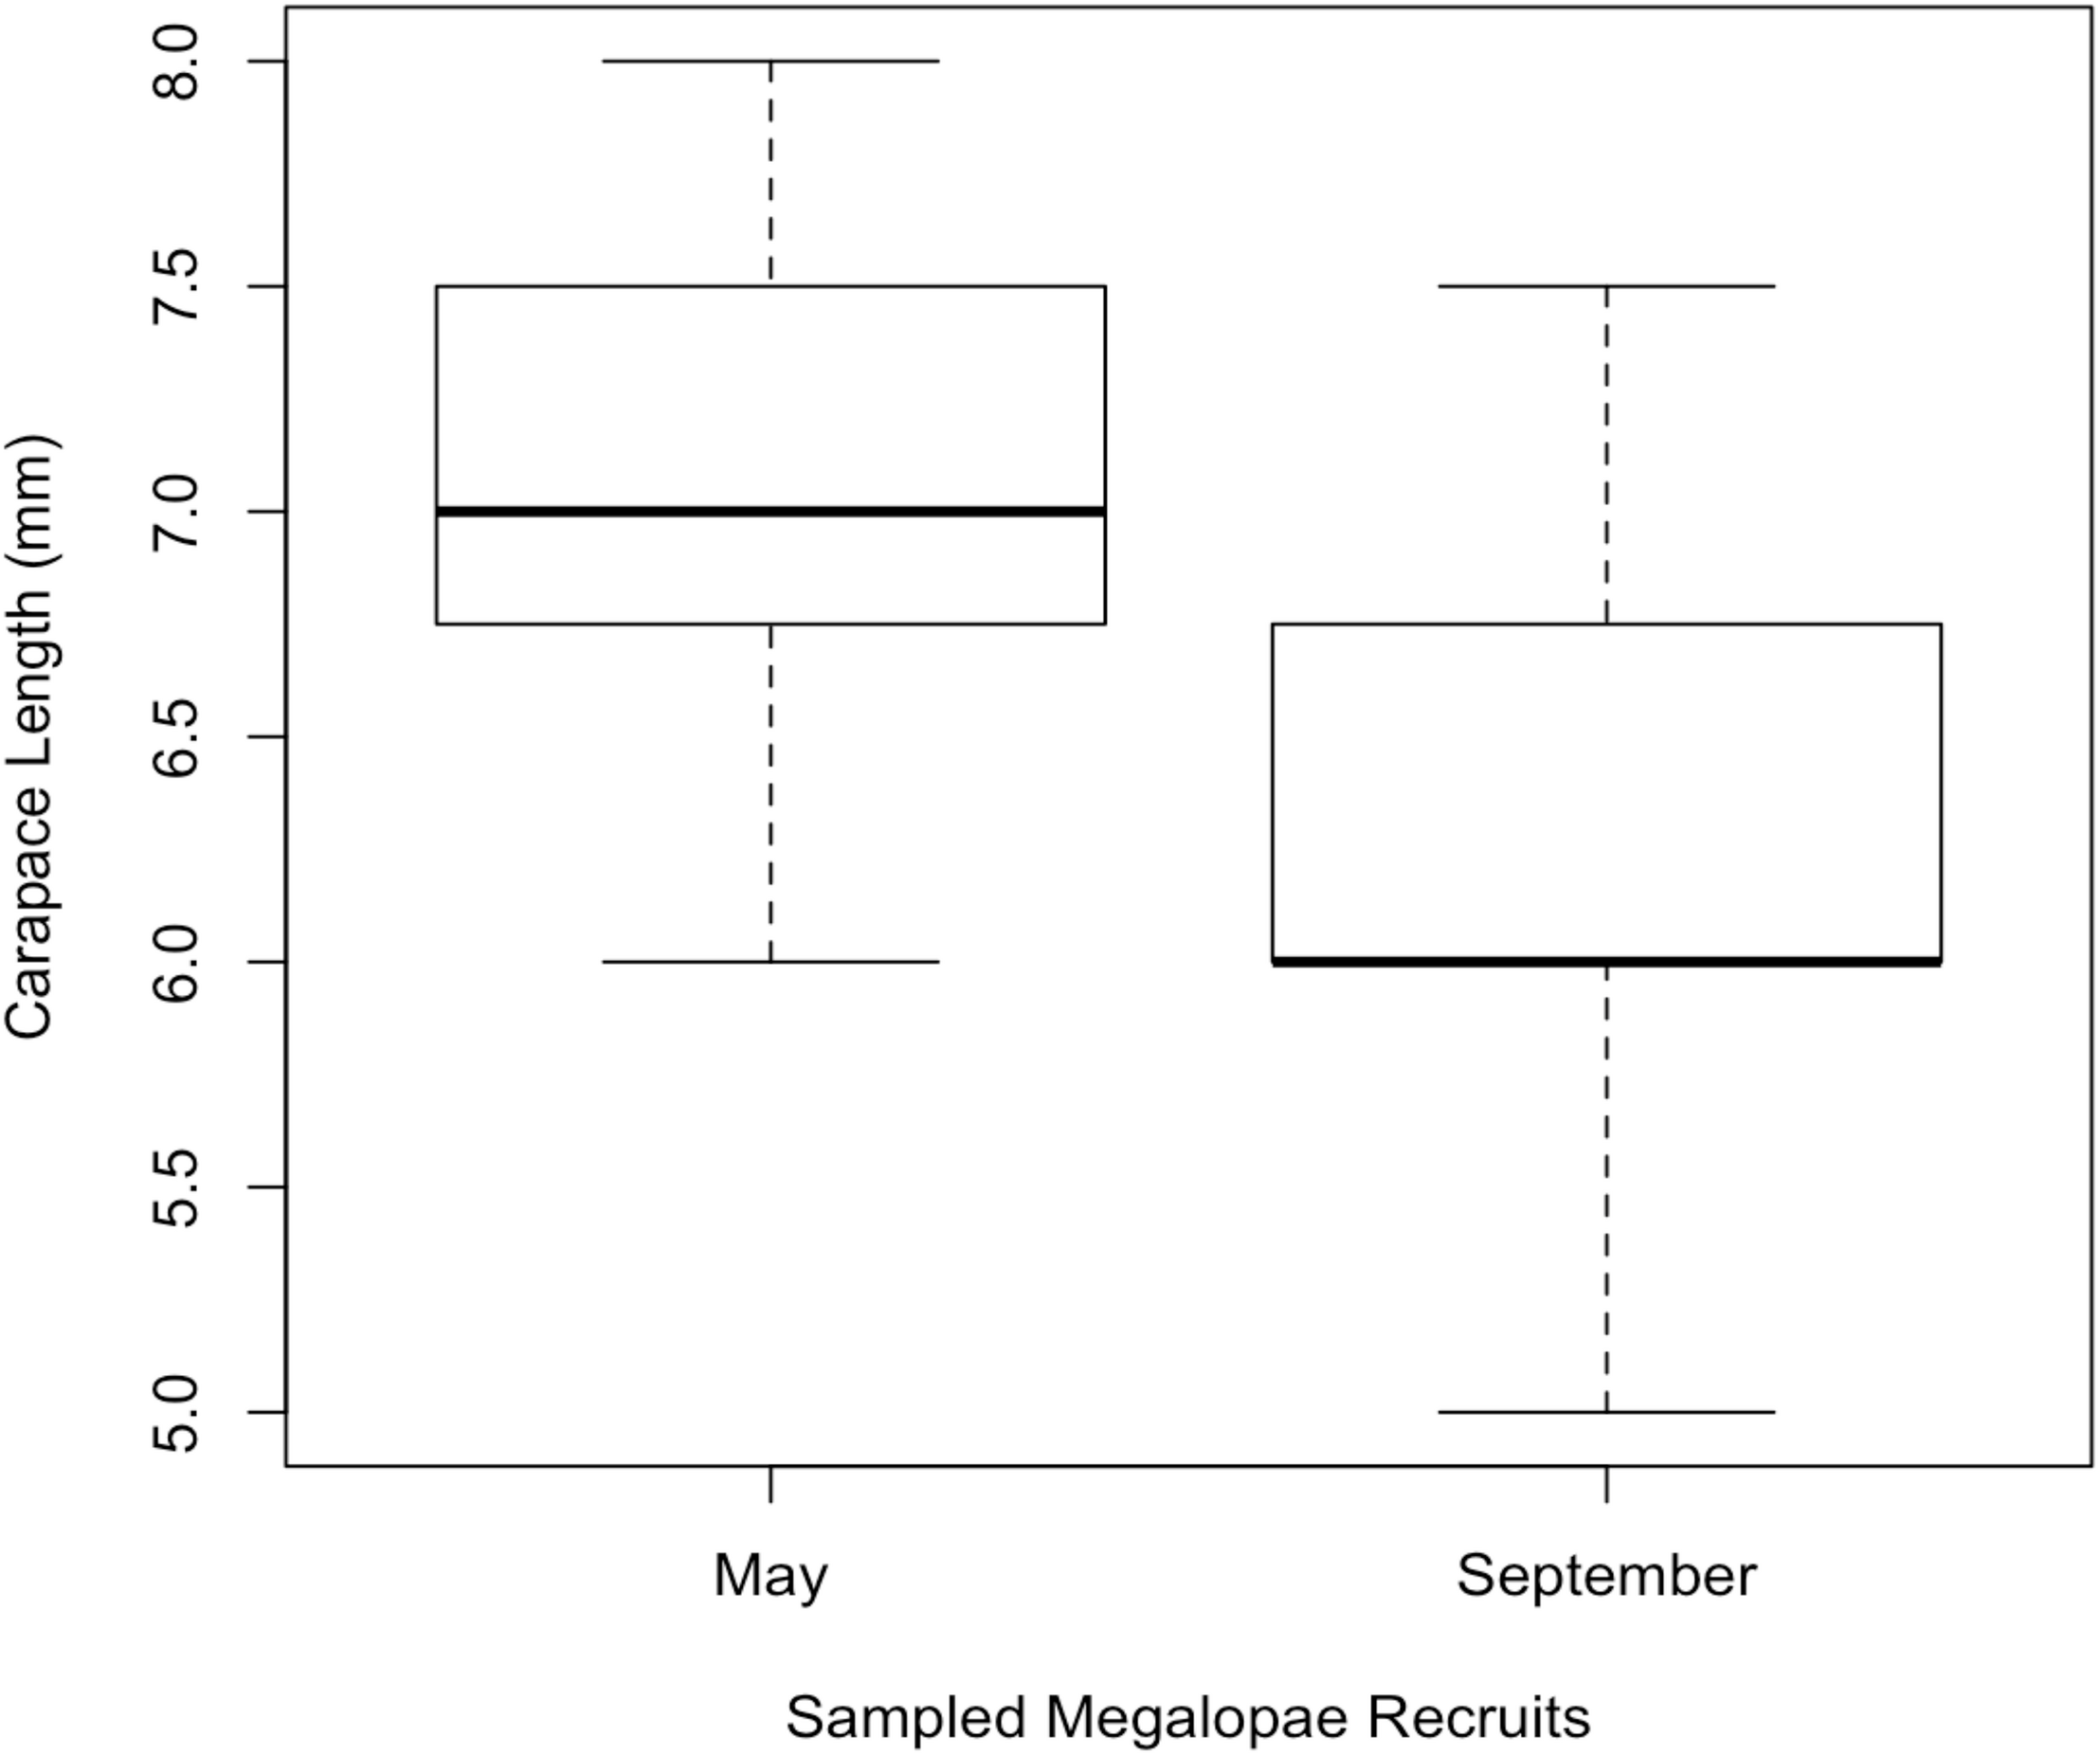
Mean carapace length of megaloape recruits sampled for genomic analysis from Coos Bay in May (expected-season; n = 47) and September (late-season; n = 47).
Library Sequencing, Filtering, and Genotyping
Genomic DNA was successfully extracted from all 47 expected-season and all 47 late-season megalopae and GBS libraries were constructed and sequenced. The 402,561,387 paired reads (805,122,774 total reads) that resulted from sequencing were evaluated for read quality with FASTQC. Of these paired reads, 146,482,358 (36.39%) were removed due to the presence of an Illumina adapter. Read quality was further assessed using the STACKSprocess_radtags program. In total, 33,559,227 paired reads without barcodes, 40,492,029 paired reads without a restriction enzyme cut site, and 14,828,129 paired reads with low quality were removed from the dataset. Demultiplexing the reads with the sample barcodes revealed that the 94 individual megalopae were adequately represented with a mean of 322,785 (± 80,967 SE) reads per individual.
Similar sequences for each of the 94 individuals were aligned into putative loci with the STACKSustacks program and combined into a catalog of 354,735 putative loci using the cstacks program. The catalog of consensus sequences was compared against each individual’s stacks with sstacks, tsv2bam was used to transform the data, and finally, gstacks built contigs from the paired-end data and called 5,811 SNPs.
Population Genomic Analyses
The STACKSpopulations program identified 2,216 putative polymorphic loci between expected-season and late-season recruits. After removing loci identified as PSVs, 1,915 loci remained. There was no evidence of linkage disequilibrium between pairs of loci within expected-season and late-season sampling groups. Of the 1,915 loci, 333 loci within the expected-season group and 322 loci within the late-season group showed significant deviation from Hardy–Weinberg Proportion after correction for multiple testing. Removal of the loci out of HWP did not affect the results of downstream genetic differentiation analyses. However, these loci were retained in the final set of 1,915 loci because we were interested in examining intra-annual genetic structure and not the genetic structure within each seasonal group.
The set of 1,915 loci were used for population genetic analyses. Allelic richness for expected-season recruits and late-season recruits was 1.998 and 1.997, respectively (Table 2). Observed heterozygosity was 0.2299 for expected-season recruits and 0.2321 for late-season recruits (Table 2). Expected heterozygosity was higher for both the expected-season recruits (0.2726) and for the late-season recruits (0.2729) (Table 2). The inbreeding coefficient (FIS) was slightly higher for expected-season recruits (0.1455) than late-season recruits (0.1414) (Table 2), but the values were not significantly different (p > 0.05; Kruskal–Wallis rank sum test). FIS was significantly different from zero for both expected-season and late-season (p < 0.01; one-sample t-test) indicating that individuals in each group are more related than expected under a model of random mating.
TABLE 2
| Population genetic measure | Expected-season | Late-season |
| Allelic richness (AR) | 1.9998 | 1.9973 |
| Observed heterozygosity (HO) | 0.2299 | 0.2321 |
| Expected heterozygosity (HE) | 0.2726 | 0.2729 |
| Inbreeding coefficient (FIS) | 0.1455 | 0.1414 |
Population genetic measurements for the 2014 expected-season and late-season megalopae recruits in Coos Bay, Oregon.
Identification of Putatively Adaptive Loci
Using the program BAYESCAN, two putatively adaptive loci were identified. The program OUTFLANK also identified these two loci as well as nine additional loci. The two loci identified by both programs were categorized as putatively adaptive loci for downstream analyses. Using BLASTN, one of the putatively adaptive loci matched a hypothetical protein mRNA sequence of the Asian mud crab (Scylla paramamosain) in the NCBI database with an e-value of 5e-28 (GenBank Sequence ID: HM217907.1).
Differentiation Between Expected-Season and Late-Season Recruits
The expected-season megalopae recruits were significantly differentiated from the late-season megalopae recruits based on variation at 1,913 presumably neutral loci (FST = 0.0011; p = 0.0262; Table 3). The degree of differentiation between the two recruiting groups was much larger based on variation at the two putatively adaptive loci (FST = 0.2036; p < 0.001; Table 3). The DAPC using both the presumably neutral and putatively adaptive loci (1,915 loci) indicted that two groups (expected-season and late-season) could be differentiated using five or more principle components (Figure 5). Accordingly, the expected-season and late-season megalopae were also significantly differentiated based on variation at both the presumably neutral and putatively adaptive loci (FST = 0.0013; p = 0.0109; Table 3).
TABLE 3
| Loci type | Pairwise FST estimate |
| Presumably neutral | 0.0011 |
| Putatively adaptive | 0.2036 |
| Combined (presumably neutral and putatively adaptive) | 0.0013 |
Pairwise FST estimates between the expected-season and late-season Dungeness crab recruits from Coos Bay in 2014 based on variation at presumably neutral and putatively adaptive loci.
FIGURE 5

Discriminate Analysis of Principle Components (DAPC) for expected-season (blue) and late-season (red) megalopae recruits in 2014 in Coos Bay, Oregon using both presumably neutral (1,913) and putatively adaptive (2) loci using PC 1 through PC 10.
Discussion
Differentiation Between Dungeness Crab Megalopae Recruits
We found evidence for weak genetic differentiation, based on variation at 1,913 presumably neutral loci, between the 2014 expected-season (May) and late-season (September) Dungeness crab megalopae recruits in Coos Bay, Oregon, an estuary within the CCE. We hypothesized that expected-season and late-season recruits would be different because previous studies (1) suggest that the CCE late-season recruits originate from northern ecosystems (GOA or SSE) (Shanks, 2013) and (2) provide evidence for genetic differentiation between benthic-stage Dungeness crab from the CCE and northern ecosystems (Jackson and O’Malley, 2017; O’Malley et al., 2017). Furthermore, we identified two putatively adaptive loci, for which strong genetic differentiation was observed between expected-season and late-season recruits. Taken together, these findings suggest that late-season megalopae recruits may have originated from a northern ecosystem.
Although differentiation between expected-season and late-season megalopae recruits was significant based on variation at presumably neutral loci, the FST estimate (0.0011) was recognizably low, even for a marine species. Gene flow is expected to be high for marine species given that few dispersal barriers exist and effective population sizes are typically large (Palumbi, 1994; Ward et al., 1994; Waples, 1998). However, significant yet low FST estimates have been found to be biologically meaningful in several genomic studies of marine species with lengthy PLDs. For example, a study of southern rock lobster (Jasus edwardsii) larval recruits concluded the significant inter-annual genetic differentiation between years and within sites resulted from ocean currents influencing the annual sources of larvae (FST range: 0.0062–0.0240; Villacorta-Rath et al., 2017). Moreover, a study on the giant California sea cucumber (Parastichopus californicus) demonstrated that species with a longer PLD that span the divide between northern and southern ecosystems along the North American west coast may exhibit lower, but biologically relevant FST estimates (FST = 0.002) that have implications for management of the species (Xuereb et al., 2018). Taken in the context of these past studies, we conclude that more years of data are needed to confirm if our finding of weak genetic differentiation between expected- and late-season recruits is biologically meaningful.
Heterozygote deficiency (positive FIS) is often observed in marine invertebrates, and the reasoning for this deficiency is often population or study specific (reviewed in Raymond et al., 1997; Addison and Hart, 2005). Positive FIS can be attributed to several processes: selection, inbreeding, laboratory or data artifacts, null alleles, or the Wahlund effect (i.e., unrecognized spatial or temporal structure within samples) (Addison and Hart, 2005). The Wahlund effect describes a situation in which there is a deficit of heterozygotes due to the pooling of several breeding groups into one sample (Wahlund, 1928). Since reproducing Dungeness crab are typically confined to a small spatial area due to limited benthic movement (Hildenbrand et al., 2011), the departure from HWP may result from a mixture of larvae from a small number of parental cohorts. The Wahlund effect has been observed often in marine species (Planes and Lenfant, 2002).
The GBS approach used in this study allowed for the identification of over a thousand loci including two putatively adaptive loci, where past genetic studies on Dungeness crab used 10 neutral microsatellite loci (Jackson and O’Malley, 2017; Jackson et al., 2017; O’Malley et al., 2017). Using both neutral and adaptive loci together to examine genomic variation within a species is advantageous because it provides information on gene flow and genetic drift, as well as natural selection. For example, in a study on the adult stage of the eastern rock lobster (Sagmariasus verreauxi) (8–12 month PLD) within the Tasman Sea, population structure was not observed based on variation at 645 neutral loci, but based on variation at 15 outlier loci (high FST) informative genetic differentiation was observed between geographic regions (Woodings et al., 2018). None of the 15 outlier loci mapped to genes, but the researchers presumed the loci may represent adaptive regions. We observed strong differentiation between the expected-season and late-season recruits based on variation at the two putatively adaptive loci. This finding may be attributed to differences in selective pressures between the CCE and the more northern SSE and GOA, such as temperature and ocean chemistry. Such selective pressures would result in adaptive differences between groups of individuals originating from different regions. It is important to emphasize that these putatively adaptive loci are outliers with high FST values, and although informative to questions of differentiation, may not truly reflect regions of the genome under selection (Shafer et al., 2015). However, one of the putatively adaptive loci identified between megalopae recruits exhibited similarity to a hypothetical mRNA sequence in the NCBI database for the Asian mud crab (S. paramamosain), providing additional support that the identified loci may be adaptive. It is unsurprising that only one putatively adaptive locus matched because, currently, there are a limited number of mapped and annotated crustacean genomes (Rotllant et al., 2018).
The benthic stage CCE Dungeness crab have exhibited inter-annual variations in population genetic structure ranging from weak IBD (2012) to panmixia (2014) based on variation at neutral microsatellite loci (Jackson et al., 2017). Presumably, the 2014 panmictic population would have contributed to the 2014 larval cohort; Dungeness crab reach sexual maturity at ∼100 mm width carapace (Rasmuson, 2013). With a panmictic reproductive population in the CCE, we would expect the larval recruits of 2014 to be genetically homogenous if they all originated from within the CCE. However, we observed weak differentiation between the expected-season and the late-season megalopae recruits based on variation at presumably neutral loci and stronger differentiation based on putatively adaptive loci. This finding supports the idea that the late-season megalopae recruits did not originate from within the CCE.
Alternatively, the late-season megalopae recruits could be offspring from of a group of CCE adults reproducing later in the season than documented or the PLD may be longer than 3–4 months for some Dungeness crab within the CCE. Therefore, the megalopae recruits would not need to be from different ecosystems (CCE vs. SSE or GOA) to be genetically differentiated. This alternative scenario could still represent a different reproductive source of megalopae leading to weak, yet significant, intra-annual differentiation.
Further evidence is needed to confirm the hypothesis that the source of the late-season megalopae recruits is from an ecosystem north of the CCE. Such evidence would include a comparison of the late-season megalopae recruits to reproducing adult populations in the CCE, SSE, and GOA. Additionally, a reproducible pattern of intra-annual differentiation across multiple years and/or a stronger pairwise FST estimate between expected- and late-season recruits based on variation at the presumably neutral loci could indicate that recruits originate from a different ecosystem. Past population genetic studies on Dungeness crab have only observed weak genetic differentiation among adult Dungeness crab in the CCE at neutral loci (Jackson et al., 2017; O’Malley et al., 2017), so a strong signature of genetic differentiation would suggest that one of the megalopae recruitment cohorts did not originate from within the CCE. GBS approaches utilizing both neutral and adaptive loci can provide greater power to detect fine-scale population structure than previous microsatellite studies (Vendrami et al., 2017).
Ocean Conditions and Megalopae Recruitment in 2014
In an effort to understand how ocean conditions allow for the exchange of Dungeness crab larvae within and between ecosystems, we examined the 2014 megalopae recruitment abundance within the context of previous years (Shanks and Roegner, 2007; Shanks et al., 2010; Shanks, 2013). The 2014 positive PDO suggests that there was less southward transport, potentially reducing larval transport from the GOA and the SSE to the CCE. However, the late spring transition and below average upwelling in 2014 suggest that larvae spent more time offshore in the southern flowing California Current, potentially increasing the southern transport of the larvae (Shanks, 2013). While abundances of late-season megalopae recruits vary inter-annually and are often very low, late-season megalopae recruits (August–October) have been observed in Coos Bay every year monitored prior to 2018 (1998–2001 and 2007–2017) (Shanks and Roegner, 2007; Shanks et al., 2010; Shanks, 2013, 2018). In 2014, the abundance of late-season recruits was below average but above the median, ranking as the ninth lowest year of megalopae recruitment in a 15-year dataset (1998–2001 and 2007–2017) of daily recruitment monitoring (Shanks and Roegner, 2007; Shanks et al., 2010; Shanks, 2013; unpublished data Shanks, 2018).
Based on models by Shanks and Roegner (2007); Shanks et al. (2010), and Shanks (2013), the lower abundance of recruiting megalopae in 2014 should have resulted in a lower commercial catch during the 2018 Dungeness crab commercial fishery season. However, the Dungeness crab commercial catch within the CCE during the 2018 fishery season was above average and the sixth largest seasonal catch in reported history (California Department of Fish and Wildlife, 2018; Oregon Department of Fish and Wildlife, 2018; Washington Department of Fish and Wildlife, 2018). It is uncertain as to why more Dungeness crab were caught in the 2018 commercial fishery than expected by megalopae abundance; however, Shanks (2018) has suggested that the atypical ocean warming event from 2014 to 2016 (i.e., “the Blob,” Peterson et al., 2017) may have played a role in this discrepancy. This highlights the fact that researchers do not fully understand the relationship between megalopae recruitment, adult population size, and, ultimately, the fishery harvest. Therefore, a better understanding of how megalopae recruitment corresponds to adult population size is needed to understand the implications of early life stage variations for the fishery, especially in the face of changing ocean conditions. In this study, we demonstrated that there are genetic differences between expected- and late-season larval recruits in the CCE. This information may be applicable to future management efforts assessing the adaptive capacity of Dungeness crab in the CCE to changing ocean conditions.
Conclusion
In this paper, we present and interpret genomic data from Dungeness crab megalopae recruits collected from a site within the CCE where megaloape recruitment patterns have been documented and studied for over two decades. Although there are still many uncertainties surrounding the coupled human-natural system of the Dungeness crab fishery, this case study demonstrates that utilizing genomic techniques to study the early life stage of the Dungeness crab can improve our understanding of this important fishery species through enhanced knowledge of the fine-scale, intra-annual genetic differentiation between expected-season and late-season megalopae recruits. Furthermore, the laboratory and bioinformatic methods provide a framework for future genomic studies of Dungeness crab megalopae. This case study of the 2014 Coos Bay, Oregon Dungeness crab megalopae recruitment cohort highlights the importance of understanding early life stage variation, as it provides a 4-year foresight into the socioeconomically important Dungeness crab fishery.
Statements
Data availability statement
This manuscript contains previously unpublished data. The GENEPOP file containing all filtered loci (1,915) is available through Dryad, doi: https://doi.org/10.5061/dryad.7wm37pvpb.
Ethics statement
No vertebrate animal or cephalopod studies are presented in this manuscript. All applicable international, national, and institutional guidelines for the care and use of animals were followed.
Author contributions
EL and KO designed the study, analyzed the data, and wrote the manuscript.
Funding
This study was funded by NSF-NRT award #1545188 (Risk and uncertainty quantification and communication in marine science and policy), the Oregon Sea Grant Robert E. Malouf Marine Studies Scholarship (grant #NA14OAR4170064 and project #E/INT-157), and the Hatfield Marine Science Center Mamie Markham Research Award. The statements, findings, conclusions, and recommendations are those of the authors and do not necessarily reflect the views of these funders.
Acknowledgments
We thank Alan Shanks and the members of the Shanks lab at the Oregon Institute of Marine Biology, University of Oregon for providing the megalopae samples and light trap abundance data for this study. We also thank Oregon State University’s Center for Genome Research and Biocomputing for preparing and sequencing our megalopae samples. Thanks to our team of faculty and students in the Oregon State University National Science Foundation Research Traineeship (NRT) program, Risk and Uncertainty Quantification in Marine Science for supporting this project. And special thanks to the members of the State Fisheries Genomics Lab at Hatfield Marine Science Center for providing valuable guidance throughout this project.
Conflict of interest
The authors declare that the research was conducted in the absence of any commercial or financial relationships that could be construed as a potential conflict of interest.
References
1
AddisonJ. A.HartM. W. (2005). Spawning, copulation and inbreeding coefficients in marine invertebrates.Biol. Lett.1450–453. 10.1098/rsbl.2005.0353
2
AltschulS. F.GishW.MillerW.MyersE. W.LipmanD. J. (1990). Basic local alignment search tool.J. Mol. Biol.215403–410.
3
AndrewsS. (2010). FastQC: a Quality Control Tool for High Throughput Sequence Data. Available at: http://www.bioinformatics.babraham.ac.uk/projects/fastqc(accessed December 1, 2018).
4
BotsfordL. W. (1984). Effect of individual growth rates on expected behavior of the northern California Dungeness crab (Cancer magister) fishery.Can. J. Fish. Aquat. Sci.499–107. 10.1139/f84-009
5
BotsfordL. W.ArmstrongD. A.ShenkerJ. M. (1989). “Oceanographic influences on the dynamics of commercially fished populations,” in Coastal Oceanography of Washington and Oregon, edsLandryM. R.HickeyB. M. (Amsterdam: Elsevier), 511–565. 10.1016/s0422-9894(08)70355-6
6
BotsfordL. W.LawrenceC. A. (2002). Patterns of co-variability among California current chinook salmon, coho salmon, dungeness crab, and physical oceanographic conditions.Prog. Oceanogr.53283–305. 10.1016/s0079-6611(02)00034-4
7
California Department of Fish and Wildlife, (2018). Available at: https://www.wildlife.ca.gov/(accessed December 1, 2018). 10.1016/s0079-6611(02)00034-4
8
CatchenJ. M.AmoresA.HohenloheP.CreskoW.PostlethwaitJ. H. (2011). Stacks: building and genotyping loci de novo from short-read sequences.G31171–182. 10.1534/g3.111.000240
9
CatchenJ. M.HohenloheP. A.BasshamS.AmoresA.CreskoW. A. (2013). Stacks: an analysis tool set for population genomics.Mol. Ecol.223124–3140. 10.1111/mec.12354
10
CockP. J.FieldsC. J.GotoN.HeuerM. L.RiceP. M. (2009). The sanger FASTQ file format for sequences with quality scores, and the Solexa/Illumina FASTQ variants.Nucleic Acids Res.381767–1771. 10.1093/nar/gkp1137
11
CowenR. K.SponaugleS. (2009). Larval dispersal and marine population connectivity.Ann. Rev. Mar. Sci.1443–466. 10.1146/annurev.marine.010908.163757
12
DanecekP.AutonA.AbecasisG.AlbersC. A.BanksE.DePristoM. A.et al (2011). The variant call format and VCFtools.Bioinformatics272156–2158. 10.1093/bioinformatics/btr330
13
DinnelP. A.ArmstrongD. A.McMillanR. O. (1993). Evidence for multiple recruitment-cohorts of Puget Sound Dungeness crab, Cancer magister.Marine Biology11553–63. 10.1007/BF00349386
14
El MousadikA.PetitR. J. (1996). High level of genetic differentiation for allelic richness among populations of the argan tree (Argania spinosa (L.) Skeels) endemic to Morocco.Theor. Appl. Genet.92832–839. 10.1007/BF00221895
15
ElshireR. J.GlaubitzJ. C.SunQ.PolandJ. A.KawamotoK.BucklerE. S.et al (2011). A robust, simple genotyping-by-sequencing (GBS) approach for high diversity species.PLoS One5:e19379. 10.1371/journal.pone.0019379
16
FautinD.DaltonP.InczeL. S.LeongJ. A.PautzkeC.RosenbergA.et al (2010). An overview of marine biodiversity in United States waters.PLoS One8:e11914. 10.1371/journal.pone.0011914
17
FisherJ. L. (2006). Seasonal timing and duration of brachyuran larvae in a high-latitude fjord.Mar. Ecol. Prog. Ser.323213–222. 10.3354/meps323213
18
FisherW.VelasquezD. (2008). Management Recommendations for Washington’s Priority Habitats and Species.Washington Department of Fish and Wildlife.
19
FollM.GaggiottiO. E. (2008). A genome scan method to identify selected loci appropriate for both dominant and codominant markers: a Bayesian perspective.Genetics180977–993. 10.1534/genetics.108.092221
20
FullerE. C.SamhouriJ. F.StollJ. S.LevinS. A.WatsonJ. R.BlasiakR. (2017). Characterizing fisheries connectivity in marine social–ecological systems.ICES J. Mar. Sci.742087–2096. 10.1093/icesjms/fsx128
21
GoudetJ. (2005). Hierfstat, a package for R to compute and test hierarchical F-statistics.Mol. Ecol. Notes5184–186. 10.1111/j.1471-8286.2004.00828.x
22
GuisanA.ThuillerW. (2005). Predicting species distribution: offering more than simple habitat models.Ecol. Lett.8993–1009. 10.1111/j.1461-0248.2005.00792.x
23
HackettS. C.KracheyM. J.DeweesC. M.HankinD. G.SortaisK. (2003). An economic overview of dungeness crab (Cancer magister) processing in California.Cal. Coop. Oceanic Fish.4486–93.
24
HildenbrandK.GladicsA.EderB. (2011). Crab Tagging Study: Adult Male Dungeness Crab (Metacarcinus magister) Movements Near Reedsport, Oregon from a Fisheries Collaborative Mark-Recapture Study.Portland, OR: Oregon Wave Energy Trust.
25
JacksonT. M.O’MalleyK. G. (2017). Comparing genetic connectivity among Dungeness crab (Cancer magister) inhabiting Puget Sound and coastal Washington.Mar. Biol.164164–123.
26
JacksonT. M.RoegnerG. C.O’MalleyK. G. (2017). Evidence for interannual variation in genetic structure of Dungeness crab (Cancer magister) along the California Current System.Mol. Ecol.2752–368. 10.1111/mec.14443
27
JamiesonG. S.PhillipsA. C. (1988). Occurrence of Cancer crab (C. magister and C. oregonensis) megalopae off the west coast of Vancouver Island. British Columbia.Fish. Bull.86525–542.
28
JohnsonD. F.BotsfordL. W.MethotR. D.Jr.WainwrightT. C. (1986). Wind stress and cycles in Dungeness crab (Cancer magister) catch off California, Oregon, and Washington.Can. J. Fish. Aquat. Sci.43838–845. 10.1139/f86-103
29
JohnsonJ.ShanksA. L. (2002). Time series of the abundance of the post-larvae of the crabs Cancer magister and Cancer spp. on the Southern Oregon coast and their cross-shelf transport.Estuaries251138–1142. 10.1007/bf02692211
30
JohnsonM. S.BlackR. (1982). Chaotic genetic patchiness in an intertidal limpet. Siphonaria sp.Mar. Biol.70157–164. 10.1007/bf00397680
31
JombartT. (2008). Adegenet: a R package for the multivariate analysis of genetic markers.Bioinformatics241403–1405. 10.1093/bioinformatics/btn129
32
JombartT.AhmedI. (2011). Adegenet 1.3-1: new tools for the analysis of genome-wide SNP data.Bioinformatics273070–3071. 10.1093/bioinformatics/btr521
33
JombartT.DevillardS.BallouxF. (2010). Discriminant analysis of principal components: a new method for the analysis of genetically structured populations.BMC Genet.11:94. 10.1186/1471-2156-11-94
34
KeisterJ. E.Di LorenzoE.MorganC. A.CombesV.PetersonW. T. (2011). Zooplankton species composition is linked to ocean transport in the Northern California Current.Glob. Change Biol.172498–2511. 10.1111/j.1365-2486.2010.02383.x
35
MartinM. (2011). Cutadapt removes adapter sequences from high-throughput sequencing reads.EMBnet J.1710–12.
36
Mastretta-YanesA.ArrigoN.AlvarezN.JorgensenT. H.PiñeroD.EmersonB. C. (2015). Restriction site-associated DNA sequencing, genotyping error estimation and de novo assembly optimization for population genetic inference.Mol. Ecol. Resour.1528–41. 10.1111/1755-0998.12291
37
McKelveyR.HankinD.YanoskoK.SnyggC. (1980). Stable cycles in multistage recruitment models: an application to the northern California Dungeness crab (Cancer magister) fishery.Can. J. Fish. Aquat.372323–2345. 10.1139/f80-279
38
McKinneyG. J.WaplesR. K.SeebL. W.SeebJ. E. (2017). Paralogs are revealed by proportion of heterozygotes and deviations in read ratios in genotyping-by-sequencing data from natural populations.Mol. Ecol. Resour.17656–669. 10.1111/1755-0998.12613
39
MillerR. R.FieldJ. C.SantoraJ. A.MonkM. H.KosakaR.ThomsonC. (2017). Spatial valuation of California marine fisheries as an ecosystem service.Can. J. Fish. Aquat.741732–1748. 10.1016/j.jenvman.2016.04.053
40
NeiM. (1987). Molecular Evolutionary Genetics.New York, NY: Columbia University Press.
41
NeiM.ChesserR. K. (1983). Estimation of fixation indices and gene diversities.Ann. Hum. Genet.47253–259. 10.1111/j.1469-1809.1983.tb00993.x
42
O’MalleyK. G.CorbettK.BeachamT. D.JacobsonD. P.JacksonT. M.RoegnerG. C. (2017). Genetic connectivity of the Dungeness crab (Cancer magister) across oceanographic regimes.J. Shellfish Res.36453–465.
43
Oregon Department of Fish and Wildlife, (2018). Available at: https://www.dfw.state.or.us/(accessed December 1, 2018).
44
PalumbiS. R. (1994). Genetic divergence, reproductive isolation, and marine speciation.Annu. Rev. Ecol. Syst.25547–572. 10.1146/annurev.es.25.110194.002555
45
ParisJ. R.StevensJ. R.CatchenJ. M. (2017). Lost in parameter space: a road map for stacks.Methods Ecol. Evol.81360–1373. 10.1111/2041-210x.12775
46
PembletonL. W.CoganN. O.ForsterJ. W. (2013). StAMPP: an R package for calculation of genetic differentiation and structure of mixed-ploidy level populations.Mol. Ecol. Res.13946–952. 10.1111/1755-0998.12129
47
PetersonW. T.FisherJ. L.StrubP. T.DuX.RisienC.PetersonJ.et al (2017). The pelagic ecosystem in the Northern California Current off Oregon during the 2014–2016 warm anomalies within the context of the past 20 years.J. Geophys. Res. Oceans1227267–7290. 10.1002/2017jc012952
48
PlanesS.LenfantP. (2002). Temporal change in the genetic structure between and within cohorts of a marine fish, Diplodus sargus, induced by a large variance in individual reproductive success.Mol. Ecol.111515–1524. 10.1046/j.1365-294x.2002.01521.x
49
PurcellS.NealeB.Todd-BrownK.ThomasL.FerreiraM. A.BenderD.et al (2007). PLINK: a tool set for whole-genome association and population-based linkage analyses.Am. J. Hum. Genet.81559–575. 10.1086/519795
50
R Core Team, (2018). R: A Language and Environment for Statistical Computing.Vienna: R Foundation for Statistical Computing.
51
RasmusonL. K. (2013). “The biology, ecology and fishery of the Dungeness crab, Cancer magister,” in Advances in Marine Biology, Vol. 65ed.LesserM. (Cambridge, MA: Academic Press), 95–148. 10.1016/b978-0-12-410498-3.00003-3
52
RaymondM.VääntöR. L.ThomasF.RoussetF.de MeeüsT.RenaudF. (1997). Heterozygote deficiency in the mussel Mytilus edulis species complex revisited.Mar. Ecol. Prog. Ser.156225–237. 10.3354/meps156225
53
RitzmanJ.BrodbeckA.BrostromS.McGrewS.DreyerS.KlingerT.et al (2018). Economic and sociocultural impacts of fisheries closures in two fishing-dependent communities following the massive 2015 US West Coast harmful algal bloom.Harmful Algae8035–45. 10.1016/j.hal.2018.09.002
54
RochetteN. C.CatchenJ. M. (2017). Deriving genotypes from RAD-seq short-read data using Stacks.Nat. Protoc.122640–2659. 10.1038/nprot.2017.123
55
RotllantG.PaleroF.MatherP. B.Bracken-GrissomH. D.SantosM. B. (2018). Preface: recent advances in Crustacean genomics.Hydrobiologia8251–4. 10.1007/s10750-018-3773-y
56
ShaferA. B.WolfJ. B.AlvesP. C.BergströmL.BrufordM. W.BrännströmI.et al (2015). Genomics and the challenging translation into conservation practice.Trends Ecol. Evol.3078–87. 10.1016/j.tree.2014.11.009
57
ShanksA.RoegnerG. C.MillerJ. (2010). Using megalopae abundance to predict future commercial catches of Dungeness crabs (Cancer magister) in Oregon.Cal. Coop. Ocean Fish.51106–118.
58
ShanksA. L. (2013). Atmospheric forcing drives recruitment variation in the Dungeness crab (Cancer magister), revisited.Fish. Oceanog.22263–272. 10.1111/fog.12020
59
ShanksA. L. (2018). Report on the Recruitment of Dungeness Crab Megalopae During the 2018 Recruitment Season.Coos Bay: Oregon Dungeness Crab Commission.
60
ShanksA. L.RoegnerG. C. (2007). Recruitment limitation in Dungeness crab populations is driven by variation in atmospheric forcing.Ecology881726–1737. 10.1890/06-1003.1
61
ShermanK. (2006). The large marine ecosystem network approach to WSSD targets.Ocean Coast. Manag.49, 640–648. 10.1016/j.ocecoaman.2006.06.012
62
ShermanK.McGovernG. (2012). Frontline Observations on Climate Change and Sustainability of Large Marine Ecosystems.New York, NY: United Nations Development Programme.
63
StoreyJ. D.TaylorJ. E.SiegmundD. (2004). Strong control, conservative point estimation and simultaneous conservative consistency of false discovery rates: a unified approach.J. R. Stat. Soc. B66187–205. 10.1111/j.1467-9868.2004.00439.x
64
StrathmannM. F. (1987). Reproduction and Development of Marine Invertebrates of the Northern Pacific Coast: Data and Methods for the Study of Eggs, Embryos, and Larvae.Washington, DC: University of Washington Press.
65
VendramiD. L.TelescaL.WeigandH.WeissM.FawcettK.LehmanK.et al (2017). RAD sequencing resolves fine-scale population structure in a benthic invertebrate: implications for understanding phenotypic plasticity.R. Soc. Open Sci.4:160548. 10.1098/rsos.160548
66
Villacorta-RathC.SouzaC. A.MurphyN. P.GreenB. S.GardnerC.StrugnellJ. M. (2017). Temporal genetic patterns of diversity and structure evidence chaotic genetic patchiness in a spiny lobster.Mol. Ecol.2754–65. 10.1111/mec.14427
67
WahlundS. (1928). The combination of populations and the appearance of correlation examined from the standpoint of the study of heredity.Hereditas1165–106.
68
WaplesR. S. (1998). Separating the wheat from the chaff: patterns of genetic differentiation in high gene flow species.J. Hered.89438–450. 10.1093/jhered/89.5.438
69
WardR. D.WoodwarkM.SkibinskiD. O. (1994). A comparison of genetic diversity levels in marine, freshwater, and anadromous fishes.J. Fish. Biol.44213–232. 10.1111/j.1095-8649.1994.tb01200.x
70
Washington Department of Fish and Wildlife, (2018). Available at: https://wdfw.wa.gov/(Accessed December 1, 2018).
71
WeirB. S.CockerhamC. C. (1984). Estimating F-statistics for the analysis of population structure.Evolution381358–1370. 10.1111/j.1558-5646.1984.tb05657.x
72
WhitlockM. C.LotterhosK. E. (2015). Reliable detection of loci responsible for local adaptation: inference of a null model through trimming the distribution of FST.Am. Nat.186S24–S36.
73
WiggintonJ. E.CutlerD. J.AbecasisG. R. (2005). A note on exact tests of Hardy-Weinberg equilibrium.Am. J. Hum. Genet.76887–893. 10.1086/429864
74
WildP. W.TastoR. N. (1983). Life History, Environment, and Mariculture Studies of the Dungeness Crab, Cancer magister, with Emphasis on the Central California Fishery Resource.Sacramento, CA: Department of Fish and Game California.
75
WoodingsL. N.MurphyN. P.DoyleS. R.HallN. E.RobinsonA. J.LigginsG. W.et al (2018). Outlier SNPs detect weak regional structure against a background of genetic homogeneity in the Eastern Rock Lobster, Sagmariasus verreauxi.Mar. Biol.12165–185.
76
XuerebA.BenestanL.NormandeauE.DaigleR. M.CurtisJ. M.BernatchezL.et al (2018). Asymmetric oceanographic processes mediate connectivity and population genetic structure, as revealed by RADseq, in a highly dispersive marine invertebrate (Parastichopus californicus).Mol. Ecol.272347–2364. 10.1111/mec.14589
Summary
Keywords
population genomics, population connectivity, genotyping-by-sequencing, ocean conditions, California Current Ecosystem, larval transport, larval dispersal, Dungeness crab
Citation
Lee EMJ and O’Malley KG (2020) Big Fishery, Big Data, and Little Crabs: Using Genomic Methods to Examine the Seasonal Recruitment Patterns of Early Life Stage Dungeness Crab (Cancer magister) in the California Current Ecosystem. Front. Mar. Sci. 6:836. doi: 10.3389/fmars.2019.00836
Received
22 May 2019
Accepted
27 December 2019
Published
22 January 2020
Volume
6 - 2019
Edited by
Sandie M. Degnan, The University of Queensland, Australia
Reviewed by
Shane Lavery, The University of Auckland, New Zealand; Julie S. Barber, Swinomish Indian Tribal Community, United States
Updates
Copyright
© 2020 Lee and O’Malley.
This is an open-access article distributed under the terms of the Creative Commons Attribution License (CC BY). The use, distribution or reproduction in other forums is permitted, provided the original author(s) and the copyright owner(s) are credited and that the original publication in this journal is cited, in accordance with accepted academic practice. No use, distribution or reproduction is permitted which does not comply with these terms.
*Correspondence: Elizabeth M. J. Lee, elizabethmjlee@gmail.com
†ORCID: Elizabeth M. J. Lee orcid.org/0000-0003-3412-1591 Kathleen G. O’Malley orcid.org/0000-0003-0995-599X
This article was submitted to Marine Molecular Biology and Ecology, a section of the journal Frontiers in Marine Science
Disclaimer
All claims expressed in this article are solely those of the authors and do not necessarily represent those of their affiliated organizations, or those of the publisher, the editors and the reviewers. Any product that may be evaluated in this article or claim that may be made by its manufacturer is not guaranteed or endorsed by the publisher.