 Min Dai1
 Songlin Li
- 1Research Centre of the Agriculture Ministry on Environmental Ecology and Fish Nutrition, Shanghai Ocean University, Shanghai, China
- 2Guangxi Key Laboratory of Marine Natural Products and Combinatorial Biosynthesis Chemistry, Guangxi Beibu Gulf Marine Research Center, Guangxi Academy of Sciences, Nanning, China
- 3National Demonstration Center for Experimental Fisheries Science Education, Shanghai Ocean University, Lingang New City, China
The study was conducted to explore the improvement function of marine protein hydrolyzates on nutritive values of diets for largemouth bass. The diet with no inclusion of marine protein hydrolyzate was considered as the control (NC), and four other diets were formulated with fish soluble (FS), squid paste (SqP), shrimp paste (ShP), or a mixture of FS, SqP, and ShP (Mix). Triplicate tanks of fish were fed to apparent satiation twice daily for 81 days. Results showed that the growth performance was elevated due to the inclusion of marine protein hydrolyzates along with significantly elevated feed intake and protein digestibility. Thereinto, the inclusion of FS and ShP significantly improved the growth performance compared to NC. The supplementation of marine protein hydrolyzates elevated the protein content and lysozyme activity of serum, but significantly decreased the activity of liver alanine transaminase and aspartate transaminase. The gene expression analysis revealed that marine protein hydrolyzate inclusion up-regulated the expression of insulin-like growth factor I (IGF-I) with increased expression of TOR pathway-related genes including protein kinase B (AKT) 1 and ribosomal protein S6. However, the expression of activating transcription factor 4 (ATF4) and regulated in development and DNA damage responses 1 (REDD1) involved in the amino acids response (AAR) pathway was depressed with the addition of marine protein hydrolyzates. The activation of the TOR pathway and depression of the AAR pathway may be beneficial for the improved performance of fish. In the above, the marine protein hydrolyzate, especially FS and ShP, can elevate nutritive values of diets for largemouth bass.
Introduction
Fish meal has been recognized as an indispensable protein source in the feed for carnivorous fish with high protein requirement because of its abundant protein content, excellent amino acid profile, and high palatability (Tacon and Metian, 2008). However, the reduced resource and rising price of fish meal seriously limit its use (FAO, 2016), and therefore, alternative protein sources have been widely explored to reduce the use of fish meal in aquafeed (Gatlin et al., 2007; Lim and Webster, 2008).
In general, high inclusion of plant protein in aquafeed commonly produces negative effects on digestive physiology and further reduces the growth performance of farmed fish, mainly due to their shortcomings in enriched anti-nutritional factors, unbalanced amino acid composition, and poor palatability (Burel et al., 2000; Barros et al., 2002; Colburn et al., 2012; Song et al., 2014). The marine by-products, such as the by-products of shrimp, squid, scallop, and fish, could be effectively converted to biologically functional products via enzymatic hydrolysis (Shahidi, 1994; Gildberg and Stenberg, 2001). The study in red sea bream (Pagrus major) has demonstrated the improving nutritive values of low fish meal diet with the inclusion of small amounts (10%) of some crude ingredients including fish soluble, krill meal, and squid meal (Kader et al., 2010). In addition, the mixture of seafood by-products and soybean proteins realizes the complete substitution of fish meal in the diet for red sea bream (Kader et al., 2012). Accordingly, marine protein hydrolyzates, containing balanced amino acids and high trace elements including taurine and free amino acids similar to fish meal, have been confirmed to improve the growth performance of farmed fish fed with high plant protein diets (Cahu et al., 2004; Kader et al., 2010, 2012; Kader and Koshio, 2012).
The nutritional status effectively affects the growth hormone (GH)/insulin-like growth factor (IGF) system to regulate the development and growth of vertebrates (Thissen et al., 1994; Duan, 1998; Reinecke et al., 2005). In general, high replacement of fish meal commonly produces negative effects on growth performance of fish species with depressed expression of IGF-I (Gómez-Requeni et al., 2004; Luo et al., 2012; Men et al., 2014; Wang et al., 2017). The mechanistic target of rapamycin (TOR) pathway and amino acids response (AAR) pathway act as the main cellular nutrient-sensing pathway to regulate protein synthesis and downstream metabolism (Kimball and Jefferson, 2002). The activation of the TOR pathway promotes protein synthesis and inhibits autophagy to regulate organismal growth (Laplante and Sabatini, 2012), while the AAR pathway could be activated by amino acid deficiency to repress global protein synthesis (Kilberg et al., 2005). In the study of teleost, the replacement of fish meal with soybean meal or meat and bone meal resulted in the down-regulation of the TOR pathway and activation of the AAR pathway, and this accounted for the reduced growth performance of turbot, Scophthalmus maximus (Song et al., 2016; Xu et al., 2016). Available literatures have reported that the marine protein hydrolyzates act as attractants in high plant protein-based diets for maintaining normal feeding behavior and growth performance (Hidaka et al., 2000; Toften et al., 2003; Kofuji et al., 2006; Kousoulaki et al., 2009; Kader et al., 2010, 2012), while it is unclear whether the improved growth performance is mediated by the TOR pathway and AAR pathways.
Largemouth bass (Micropterus salmoides) has been widely cultured in China and its production is approximately 432,000 tons in 2018 in China (Yearbook, 2019). This carnivorous fish possesses high dietary protein requirement (48%) with fish meal as major protein source (Huang et al., 2017). A previous study in our lab has demonstrated that soybean meal could reduce the use of fish meal in the diet for largemouth bass to 35% without negative effect on growth performance (Chen et al., 2013). The present study was conducted to evaluate the effect of marine protein hydrolyzate inclusion, fish soluble (FS), squid paste (SqP), and shrimp paste (ShP), on the growth performance and feed utilization of largemouth bass fed the diet with relative low fishmeal. In addition, the response of IGF-1 expression, TOR pathway, and AAR pathway was investigated at the transcription level in the present study.
Materials and Methods
Experimental Diets and Experimental Procedure
Five isonitrogenous (crude protein 48%) and isolipidic (12%) diets were formulated, where diet was with no inclusion of marine protein hydrolzsate (NC) or with 10% FS, SqP, ShP, or a mixture of the above three protein hydrolyzate each at the 3.33% (Mix) (Table 1). The contents of amino acids and free amino acids in experimental diets were presented in Tables 2, 3, respectively. The marine protein hydrolyzate, FS, SqP, and ShP, used in the present study was supplied by Zhejiang Yifeng Marine Biological Products Co., Ltd (Zhejiang, China). The addition of marine protein hydrolyzate was conducted at the expense of fermented soybean meal and corn gluten meal to maintain consistent crude protein content. Fish oil content was changed to adjust the lipid content caused by the addition of marine by-product, and soybean oil was used to maintain the consistent of crude lipid content. Cr2O3 was added as an indicator to evaluate the apparent digestibility coefficients (ADCs) of nutrients. The formulated process of experimental diets was conducted following the description of Li et al. (2019). Briefly, the low-lipid ingredients, after being grounded through 75-μm mesh, were blended thoroughly, followed by the mixture with lipid ingredients. Then, water was added to make a stiff dough, which was then extruded by a pelleting machine. The extruded pellets were stored at −20°C after being cooked for starch gelatinization and dried in a ventilated oven until used.
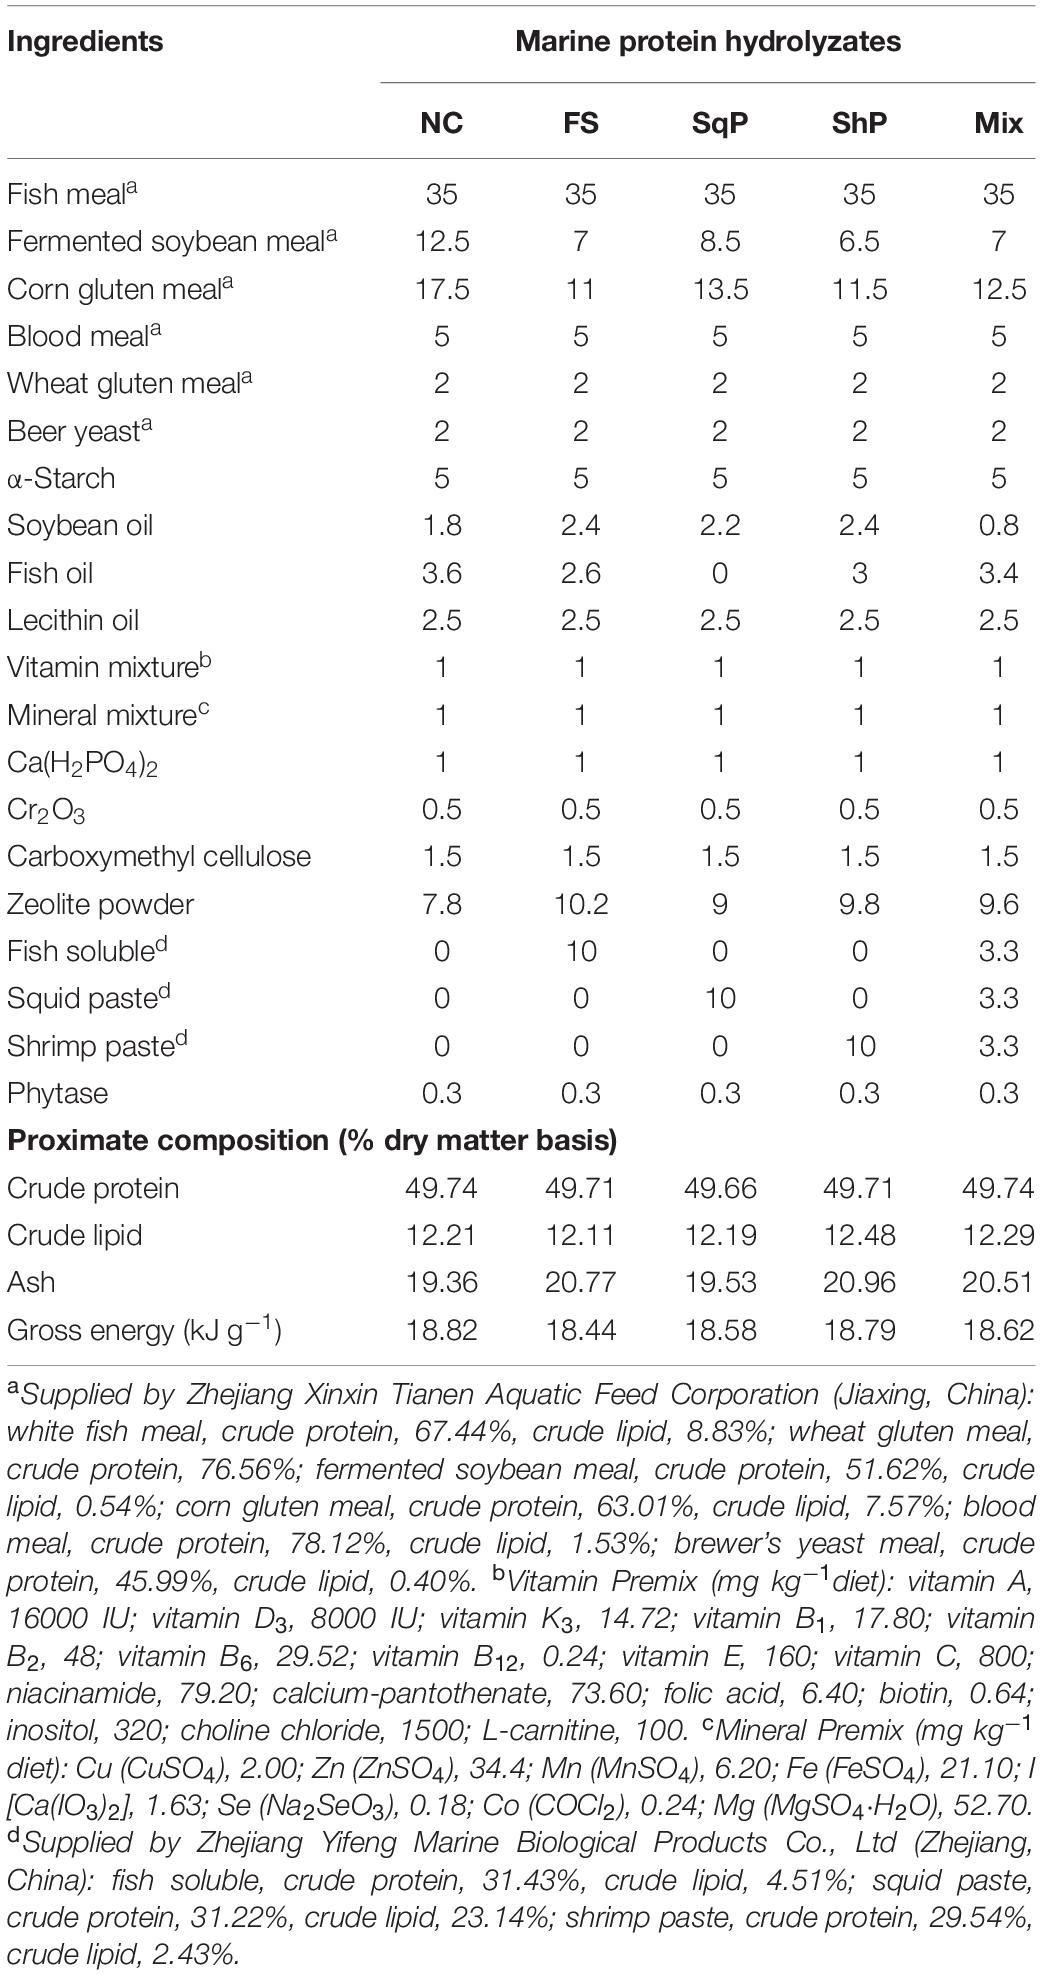
Table 1. Ingredient composition and proximate analysis of the experimental diet (% dry matter).
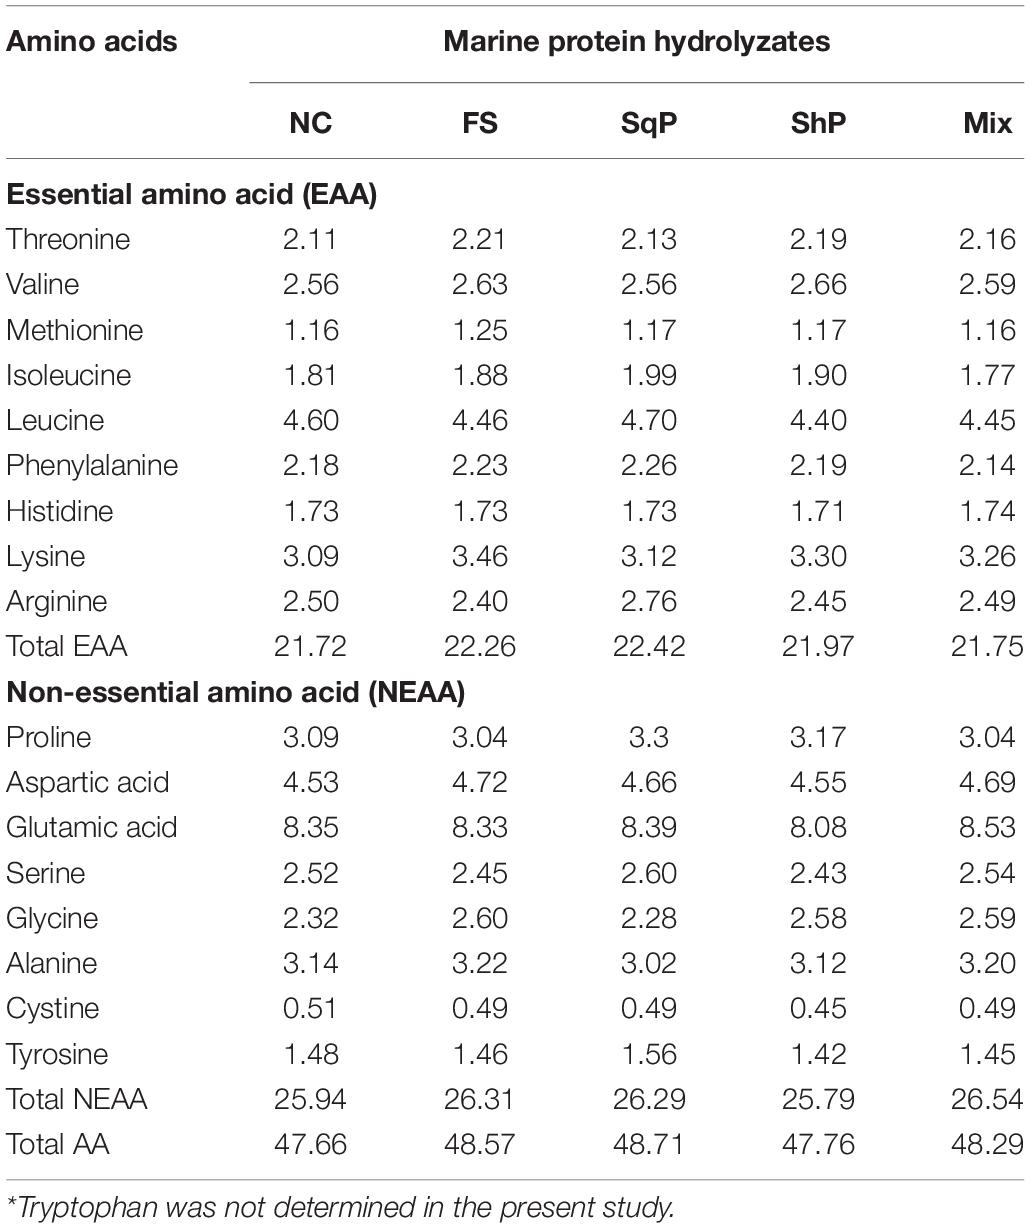
Table 2. Amino acid content of the diets (g 100 g–1 dry matter)*.
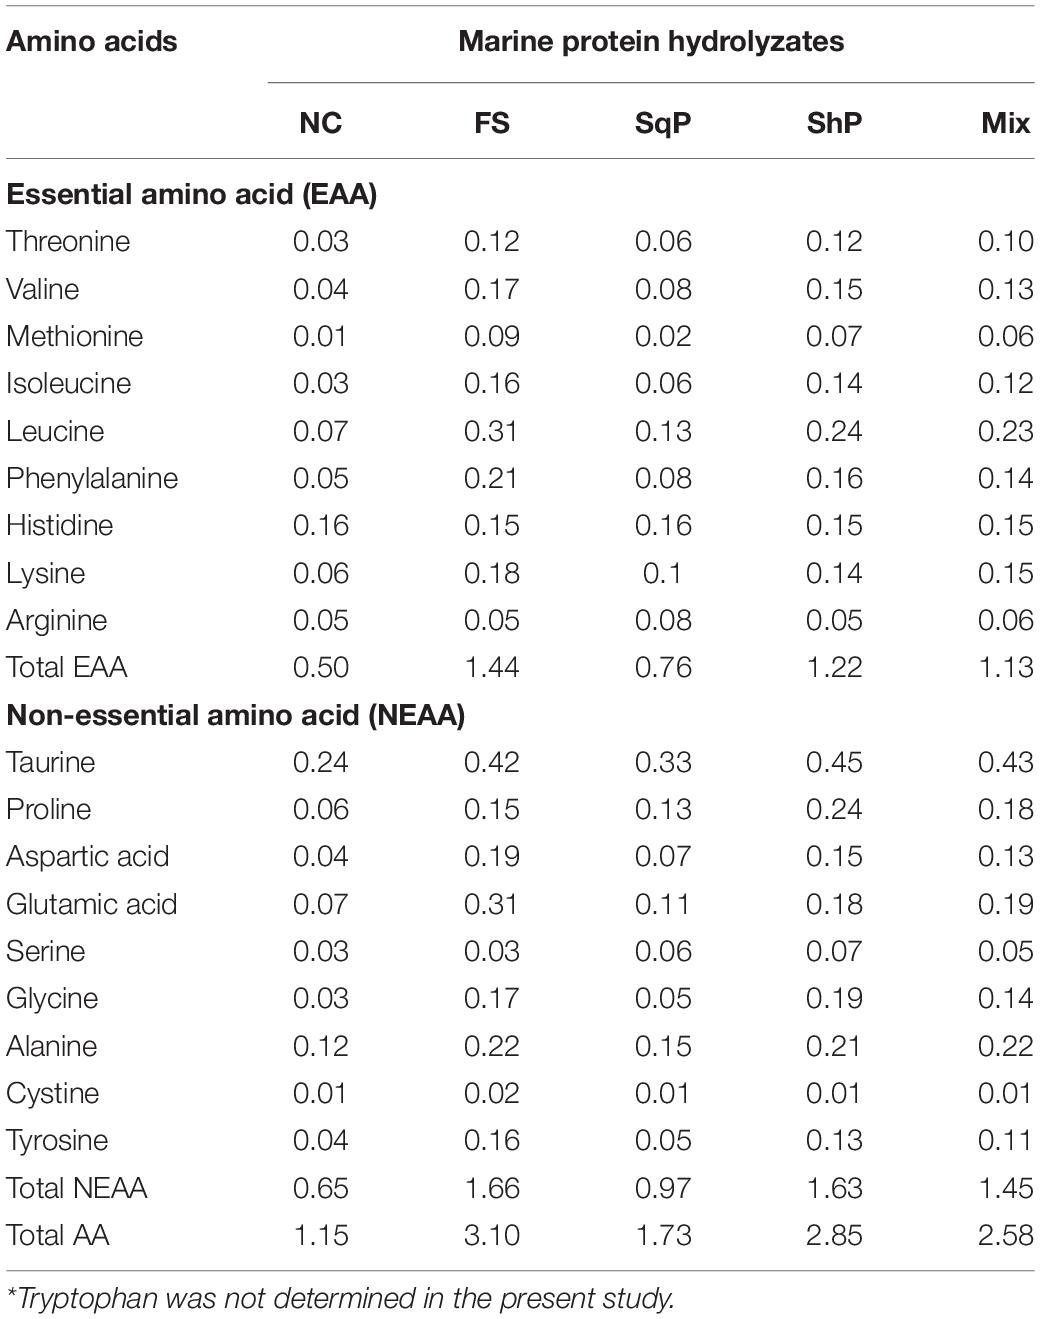
Table 3. Free amino acid content of the diets (g 100 g–1 dry matter)*.
The animal study was reviewed and approved by the Animal Care and Use Committee of Shanghai Ocean University. The experimental largemouth bass were obtained from a commercial hatchery (Suzhou, China) and then reared in an indoor temperature-controlled recirculating freshwater system (Shanghai, China) for 4 weeks’ domestication with commercial feed. After acclimatization, the fish with uniform size (initial body weight, 10.68 ± 0.01 g), after being fasted for 24 h, were selected and allocated into 15 glass reinforced plastic tanks with a density of 40 fish per tank. Triplicate tanks were fed to apparent satiation twice daily (8:00 and 16:00 h) for 81 days. During the feeding trial, the water in the system was recirculated after being deposited, filtered by sponges and coral sand, and sterilized by ultraviolet light. In addition, water quality was monitored: water temperature was 27 ± 1°C, pH was 7.2 ± 0.2, dissolved oxygen was ≥6 mg/L, and ammonia nitrogen content was ≤0.2 mg/L.
Sample Collection
Fifteen juveniles were randomly collected prior to the feeding trial for the analysis of initial body composition. Feces samples were collected with the collection column fixed to the bottom of experimental tanks following the description of Lee (2002) after 4 weeks’ feeding. When the feeding trial was finished, fish number per tank was counted and final body weight was recorded after fish being fasted for 24 h. Then, five fish per tank were randomly picked for whole body composition analysis, and another 12 fish of each tank were randomly selected for the measurement of body length and weight to calculate condition factor (CF) followed by the collection of blood samples with syringes. The blood samples were then centrifuged at 4000 × g for 10 min (4°C) to separate the serum to evaluate the non-specific immune response. After that, liver samples of six fish were sampled for gene expression analysis and enzymatic activity analysis. Another six fish were sampled to dissect and weight the viscera and liver to calculate viscerosomatic index (VSI) and hepatosomatic index (HSI), respectively, and the liver and muscle samples were obtained for proximate composition analysis.
Chemical Analysis
The moisture, ash, and crude protein content were detected following the method described by AOAC (2003). Briefly, moisture was measured by the weight loss method through drying samples to constant weight at 105°C, and ash was measured by the burning method with muffle furnace (AOAC, 2003). Crude protein was determined by the Kjeldahl method (N × 6.25) (Kjeltec 2200, FOSS, Denmark) (AOAC, 2003). Crude lipid was measured with the chloroform–methanol extraction method (Folch et al., 1957). Oxygen bomb calorimeter (6200, Parr, United States) was used to determine the gross energy of diets. The Cr2O3 content of diet and feces was analyzed with the wet-acid digestion method based on the description of Divakaran et al. (2002). Amino acid content was determined by an automatic amino acid analyzer (S-433D, Sykam, Germany) following the method of Llames and Fontaine (1994), and free amino acid content was analyzed using the o-phthaldialdehyde precolumn derivatization method (Antoine et al., 1999).
Non-specific Immune Response and Transaminase Activities
The activity of serum lysozyme was evaluated following the method of Ellis (1990), and serum protein content was determined with the Coomassie Brilliant Blue method (Bradford, 1976). The obtained liver simples were homogenized in ice-cold phosphate buffer (1:9, w/v) and then centrifuged (3000 rpm, 10 min, 4°C) to separate the supernatant. Then, the isolated supernatant was maintained at −20°C until it is used for the measurement of transaminase activities. The activity of alanine transaminase (ALT) and aspartate transaminase (AST) was measured with the Reitman–Frankel method (Reitman and Frankel, 1957).
RNA Extraction and Real-Time Quantitative PCR
The total RNA of liver samples was extracted using Trizol Reagent (Takara, Japan) followed by quality measurement with denaturing agarose gel. Then, first-strand cDNA was synthesized through reverse transcription reaction with Prime ScriptTM RT kit (Takara, Japan). Specific primers used in the present study were designed based on the obtained nucleotide sequences (Table 4). The β-action was used as housekeeping gene following the verification of its stability, and the amplification was conducted in a quantitative thermal cycler (Mastercycler EP Realplex, Eppendorf, Germany) with the following procedure: 95°C for 2 min, followed by 40 cycles of 95°C for 10 s, 57°C for 10 s, and 72°C for 20 s. Melting curve analysis was conducted, after the reaction, to confirm the single PCR product in the reactions. The relative gene expressions were calculated with the 2–ΔΔCt method (Livak and Schmittgen, 2001).
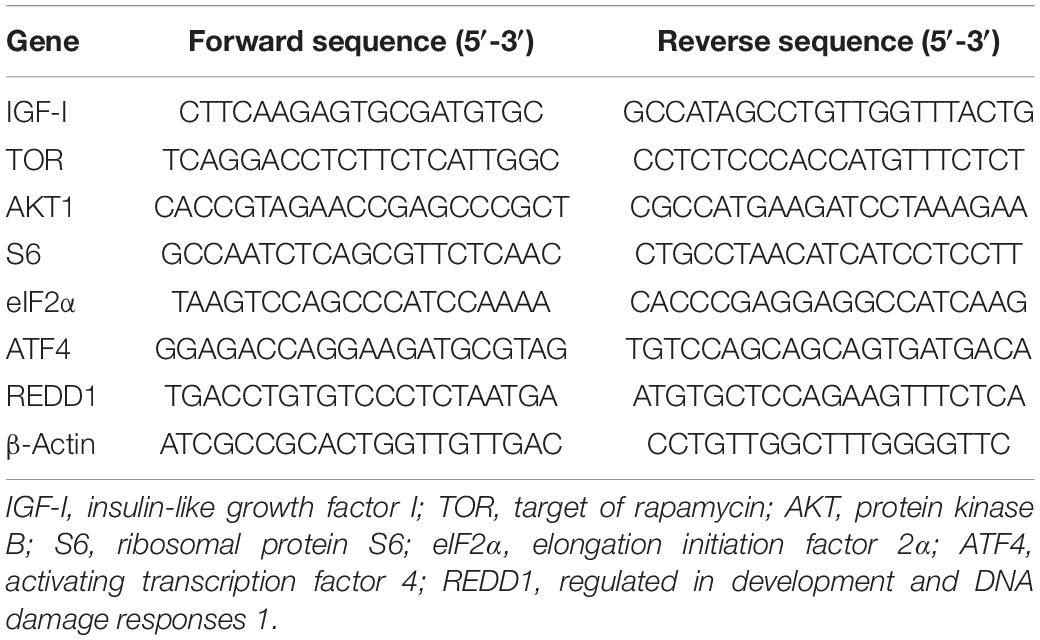
Table 4. Specific primer used in the present study.
Calculations and Statistical Methods
The following variables were calculated:
Survival rate (SR,%) = final fish number/initial fish number × 100.
Specific growth rate (SGR,%/day) = (Ln final body weight – Ln initial body weight) × 100/days.
Condition factor (CF) = final body weight (g)/length (cm)3 × 100.
Hepatosomatic index (HSI,%) = liver weight/final body weight × 100.
Viscerosomatic index (VSI,%) = viscera weight/final body weight × 100.
Feed efficiency ratio (FER) = Increased body weight/dry feed consumed;
Protein efficiency ratio (PER) = Increased body weight/protein intake.
Feed intake (g/day) = (Feed offered – feed discarded or uneaten feed)/days.
Nutrient retention rate (NRR,%) = Nutrient retention/nutrient intake × 100.
Apparent digestibility coefficient (ADC) of nutrient (%) = 100 – 100 × (tracer in diet/tracer in feces) × (nutrient in feces/nutrient in diet).
The results were expressed as the mean ± standard error of the mean (SEM). All data were compared with one-way analysis of variance (ANOVA) using SPSS. Turkey’s multiple range test was chosen as multiple comparison test, and P < 0.05 was considered significantly.
Results
Growth Performance and Feed Utilization
No significant difference was observed in survival rate (SR) with the inclusion of marine protein hydrolyzates (P > 0.05) (Table 5). Meanwhile, the addition of marine protein hydrolyzates elevated growth of largemouth bass, and the final body weight (FBW) and specific growth rate (SGR) in fish fed the diets with FS and ShP were significantly higher than that of NC (P < 0.05) (Table 5). However, marine protein hydrolyzates produced no significant influence on morphological index including CF, HSI, and VSI (P > 0.05) (Table 5).
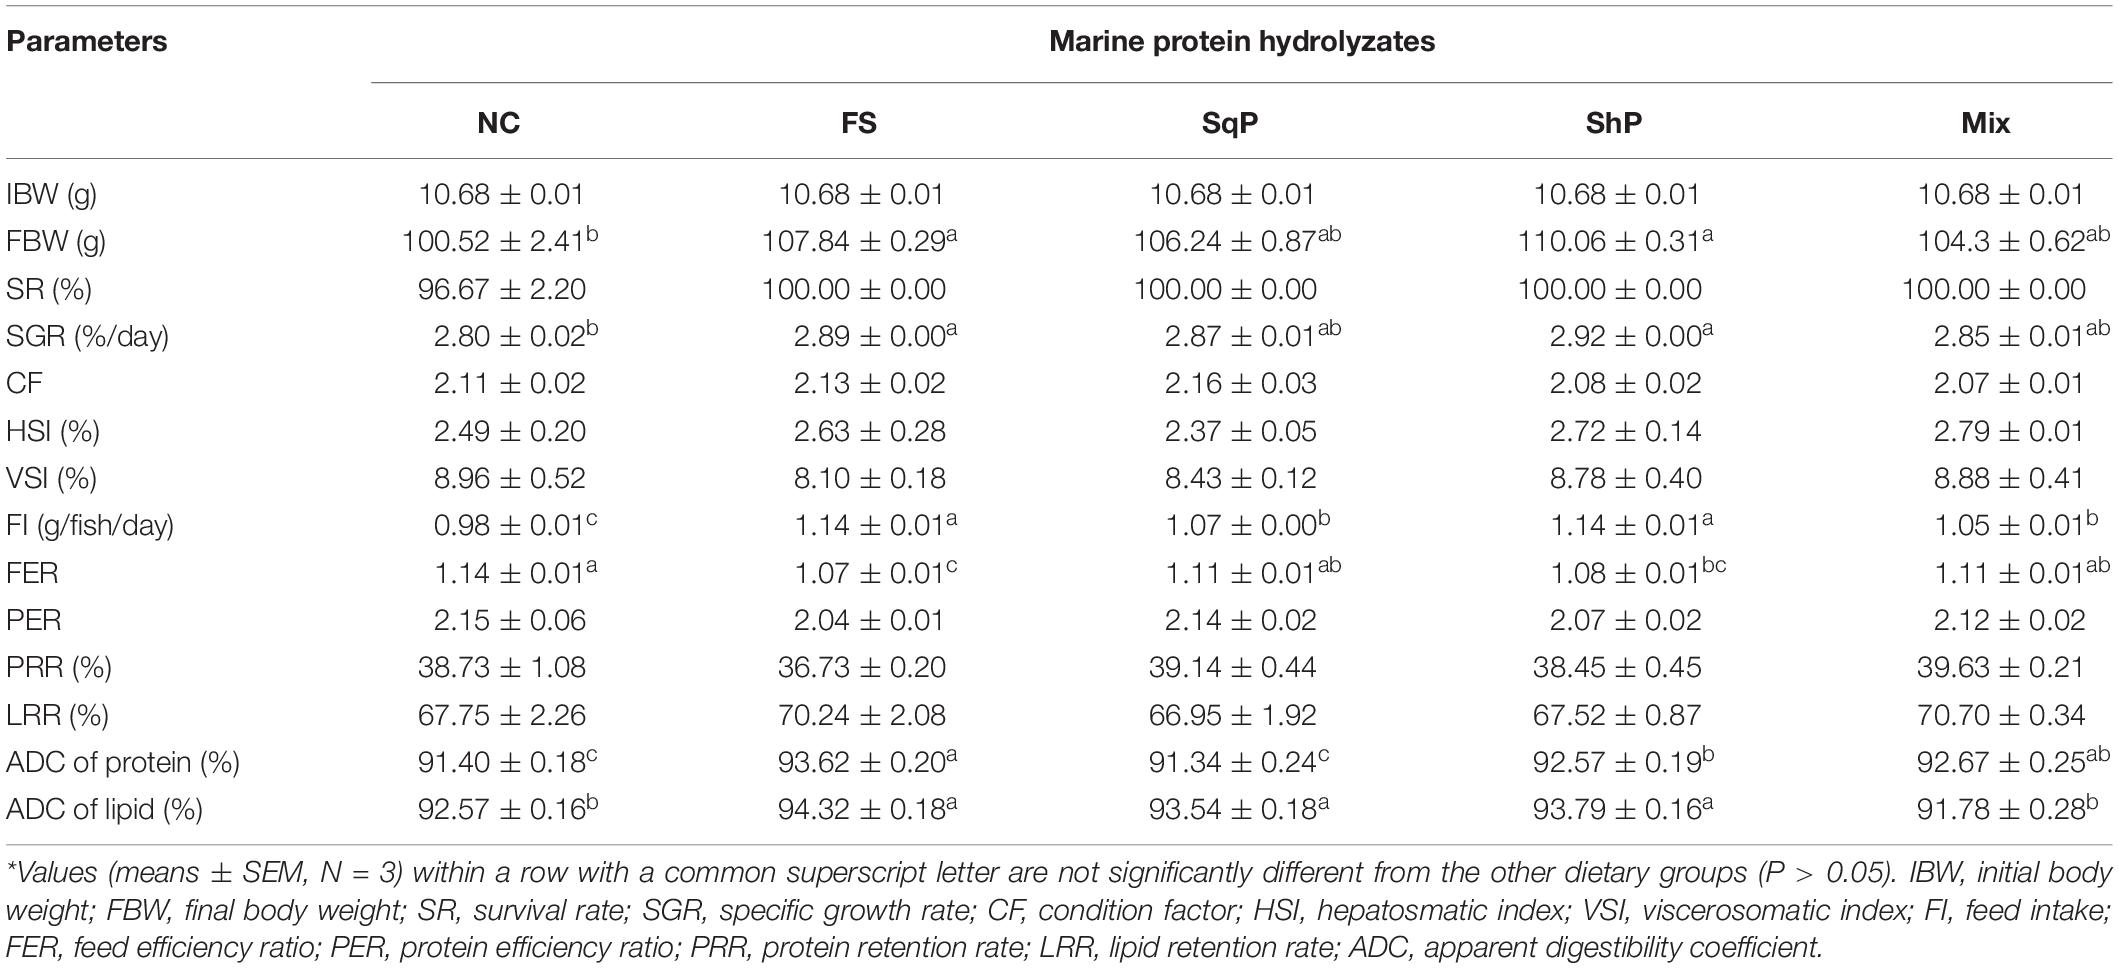
Table 5. Growth performance and feed utilization of largemouth bass fed the experimental diets for 81 days*.
The inclusion of marine protein hydrolyzates significantly elevated the feed intake (FI) (P < 0.05), and meanwhile, the value in fish fed the diet with FS and ShP were remarkably higher than that of SqP and Mix (P < 0.05) (Table 5). However, the feed efficiency ratio (FER) was significantly reduced due to the inclusion of FS and ShP compared to NS (P < 0.05) (Table 5). The marine protein hydrolyzates did not cause any significant difference on protein efficiency ratio (PER) and protein retention rate (PRR), which was consistent with the variation of lipid retention rate (LRR) (P > 0.05) (Table 5). However, the ADC of protein in fish fed the diet with FS, ShP, and Mix was significantly higher than that of NC with the highest value in FS group (P < 0.05), while the inclusion of SqP did not lead to any significant difference on ADC of protein (P > 0.05) (Table 5). The fish fed the diet with FS, SqP, and ShP obtained significantly higher ADC of lipid than the other two groups (P < 0.05) (Table 5).
Body Composition Analysis
The inclusion of protein hydrolyzates caused no significant difference on the proximate composition except the ash content (P > 0.05) (Table 6). The ash content in fish fed the diet with FS, ShP, and Mix was significantly higher than that of NC (P < 0.05) (Table 6). However, the inclusion of marine protein hydrolyzates significantly decreased the hepatic lipid content without any significant difference on the content of moisture, protein, and ash in liver (P < 0.05) (Table 6). The moisture, protein, and lipid content of muscle in fish fed the diet with marine protein hydrolyzates showed no significant difference than that of NC (P > 0.05) (Table 6). However, the ash content in muscle of fish fed the diet with Mix was significantly higher than that of ShP (P < 0.05) (Table 6).

Table 6. Whole-body, liver proximate composition, and muscle proximate composition of largemouth bass fed the experimental diets for 81 days*.
Non-specific Immune Response and Transaminase Activities
The activity of serum lysozyme was elevated with the inclusion of marine protein hydrolyzates, and fish fed the diet with FS and Mix significantly improved its activity compared to that of NS (P < 0.05) (Table 7). Meanwhile, the marine protein hydrolyzates increased the serum protein content, and the inclusion of Mix resulted in a significant serum protein content compared to that of NC (P < 0.05) (Table 7). The activity of hepatic ALT was significantly decreased with the inclusion of marine protein hydrolyzates (P < 0.05) (Table 7), and the variation of AST activity followed a similar pattern with that of ALT (P < 0.05) (Table 7).
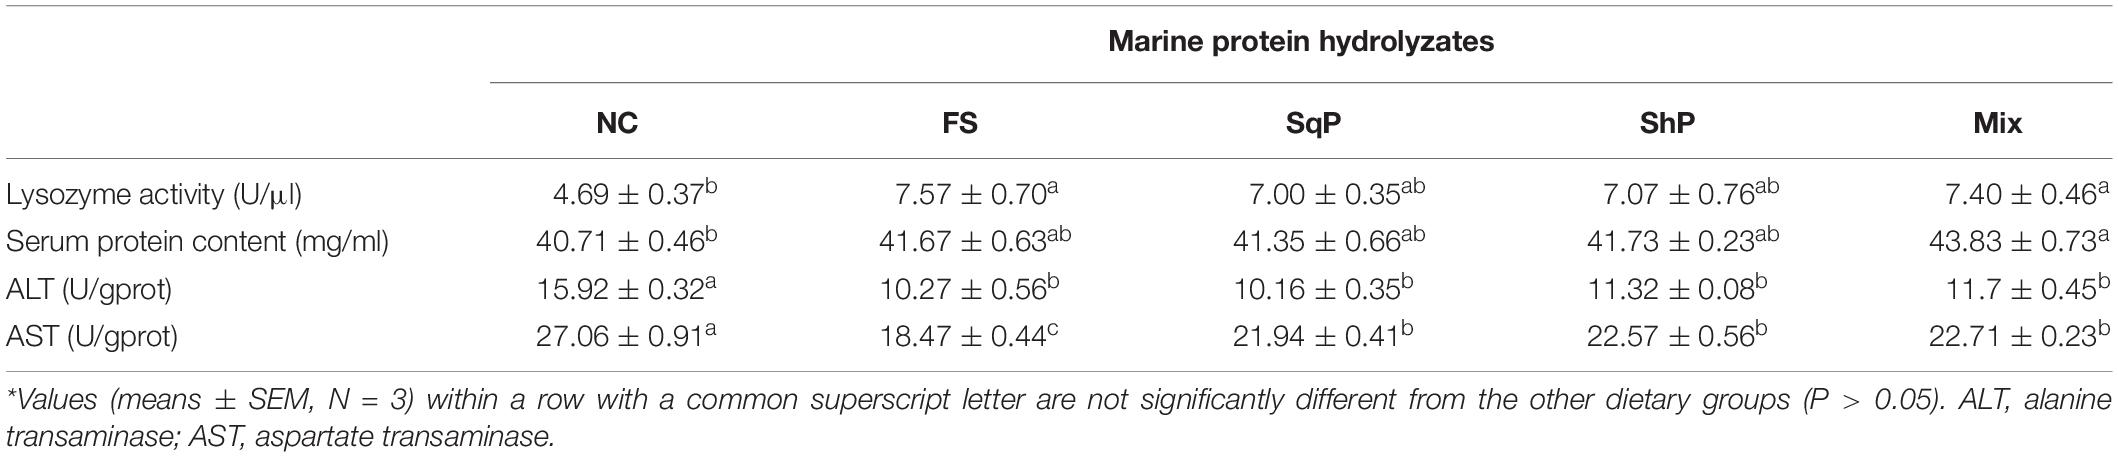
Table 7. Non-specific immune response and hepatic transaminase activities of largemouth bass fed the experimental diets for 81 days*.
Gene Expression Analysis
The inclusion of marine protein hydrolyzates elevated the expression of IGF-I, and its expression in fish fed the diet with FS was significantly higher than that of NS (P < 0.05) (Figure 1). No significant difference was observed in the expression of TOR with the inclusion of marine protein hydrolyzates (P < 0.05) (Figure 2). However, the supplementation of marine protein hydrolyzates significantly up-regulated the expression of protein kinase B (AKT) 1 (P < 0.05), and meanwhile, the expression of AKT1 in the FS group was significantly higher than that of SqP and Mix (P < 0.05) (Figure 2). The marine protein hydrolyzates including FS, SqP, and ShP elevated the expression of ribosomal protein S6 (S6), and the inclusion of FS significantly elevated its expression compared to that of NC (P < 0.05) (Figure 2). The inclusion of marine protein hydrolyzates did not result in any significant difference on the expression of elongation initiation factor 2α (eIF2α) (P > 0.05) (Figure 3). However, the expression of the activating transcription factor 4 (ATF4) was decreased with the supplementation of marine protein hydrolyzates, and ATF4 expression of fish fed the diet with ShP was significantly lower than that of NC (P < 0.05) (Figure 3). Additionally, the expression of regulated in development and DNA damage responses 1 (REDD1) was significantly down-regulated with the inclusion of marine protein hydrolyzates (P < 0.05), and SqP and Mix supplementation significantly reduced the expression of REDD1 compared to the FS and ShP (P < 0.05) (Figure 3).
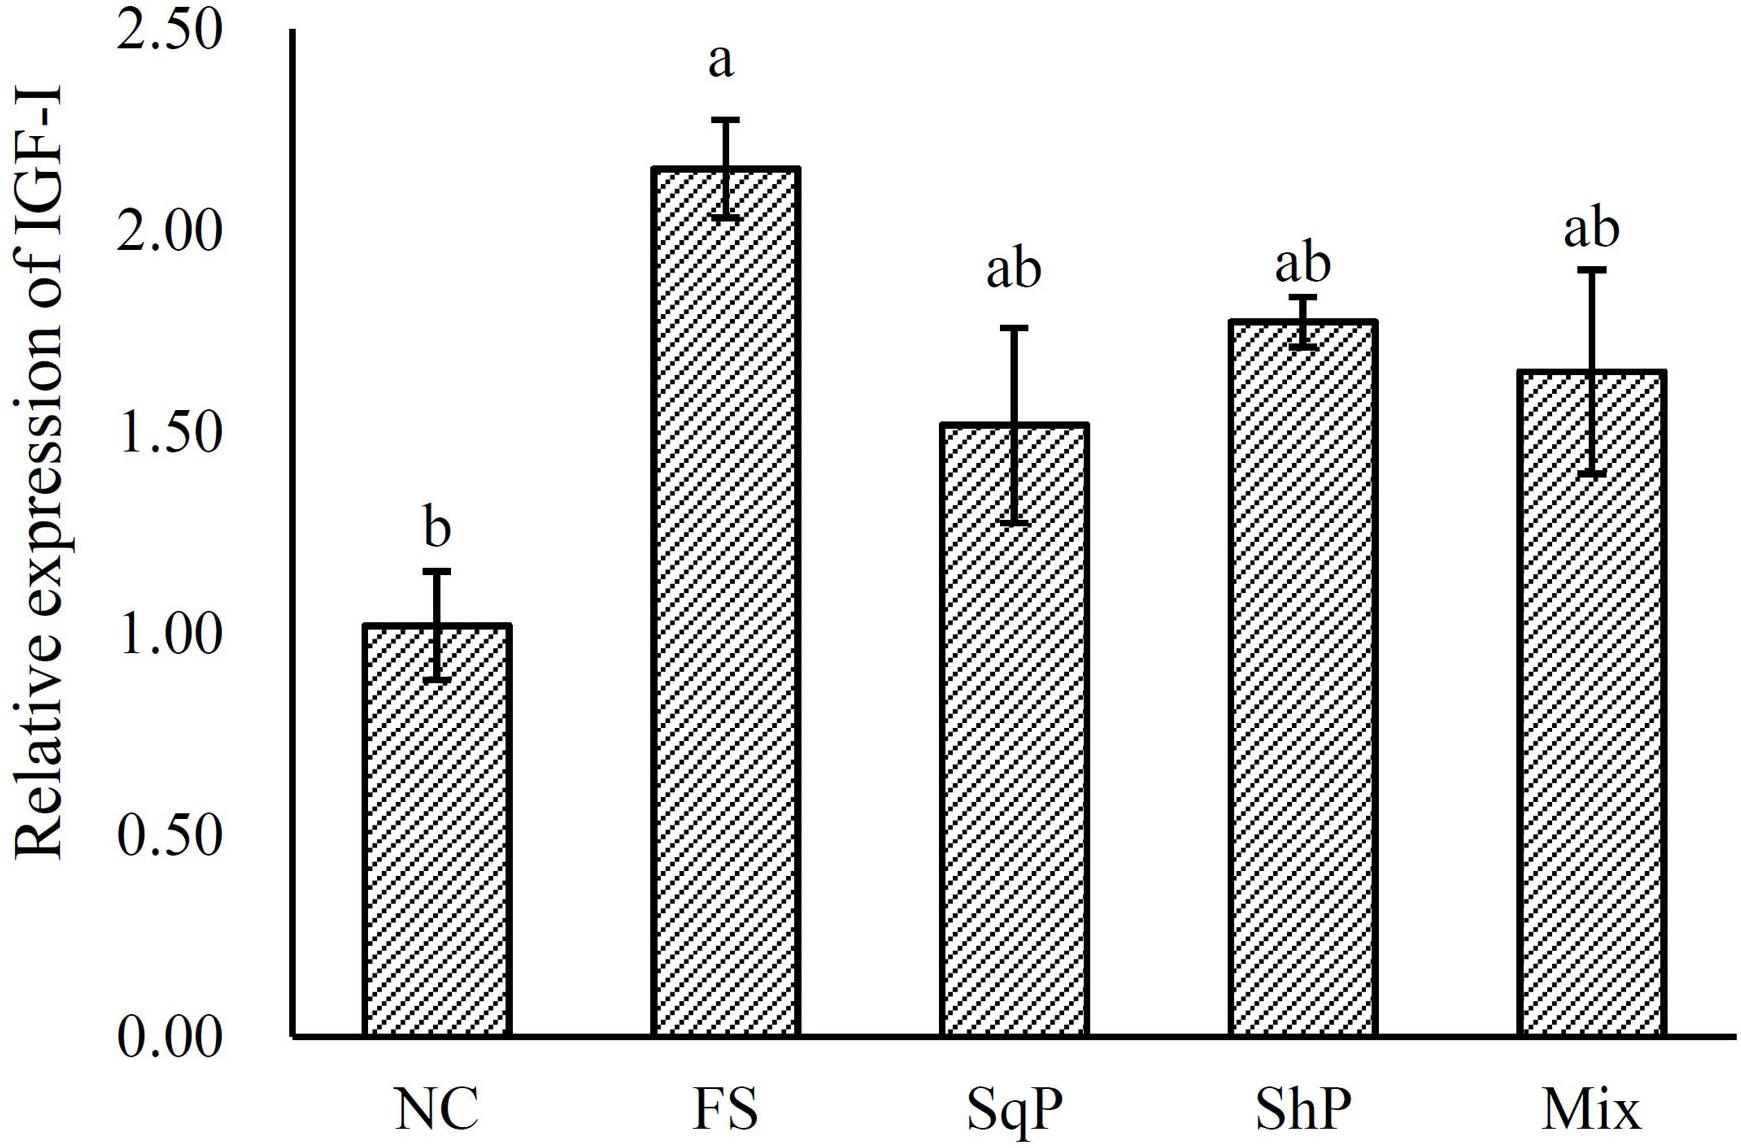
Figure 1. Relative expression of hepatic insulin-like growth factor I (IGF-I) gene of largemouth bass fed the experimental diets for 81 days. Values (means ± standard error of the mean, SEM) in bars that have the same letter are not significantly different (P > 0.05; Tukey’s test) among treatments (N = 3).
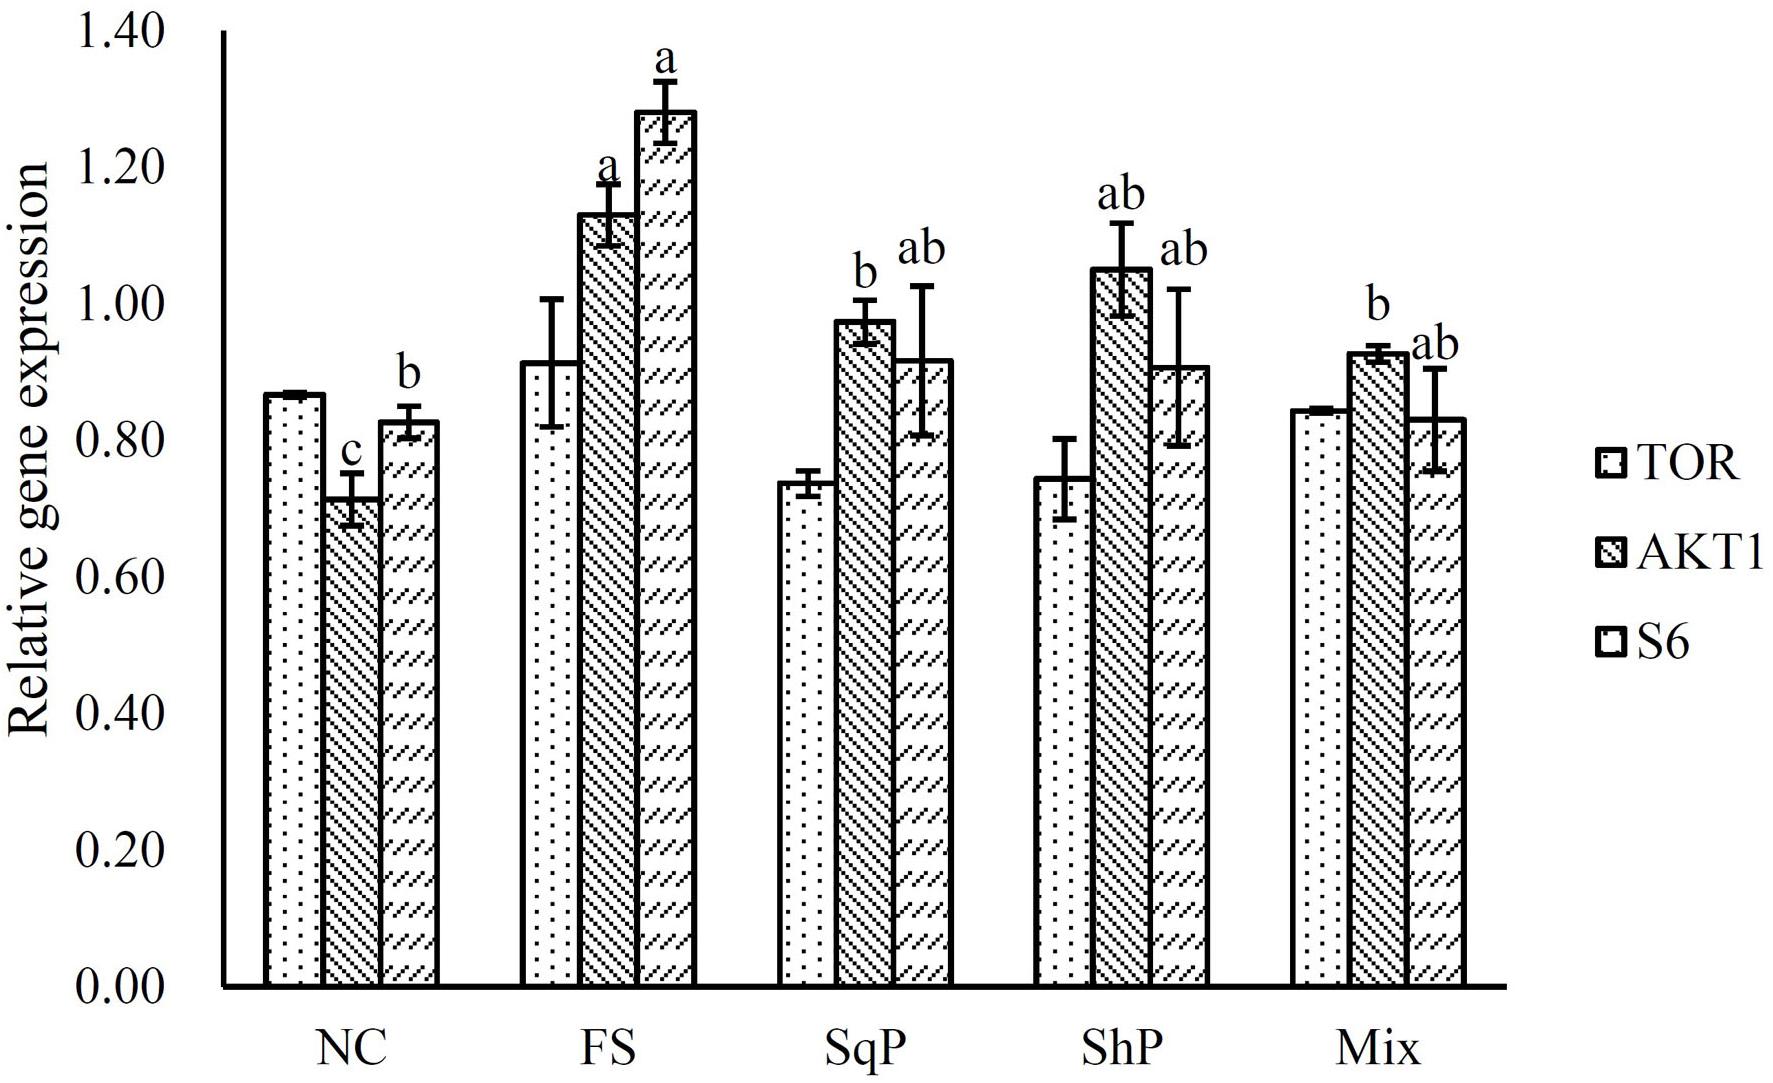
Figure 2. The expression of TOR pathway-related genes, target of rapamycin (TOR), protein kinase B (AKT) 1, and ribosomal protein S6 (S6) of largemouth bass fed the experimental diets for 81 days. Values (means ± standard error of the mean, SEM) in bars that have the same letter are not significantly different (P > 0.05; Tukey’s test) among treatments (N = 3).
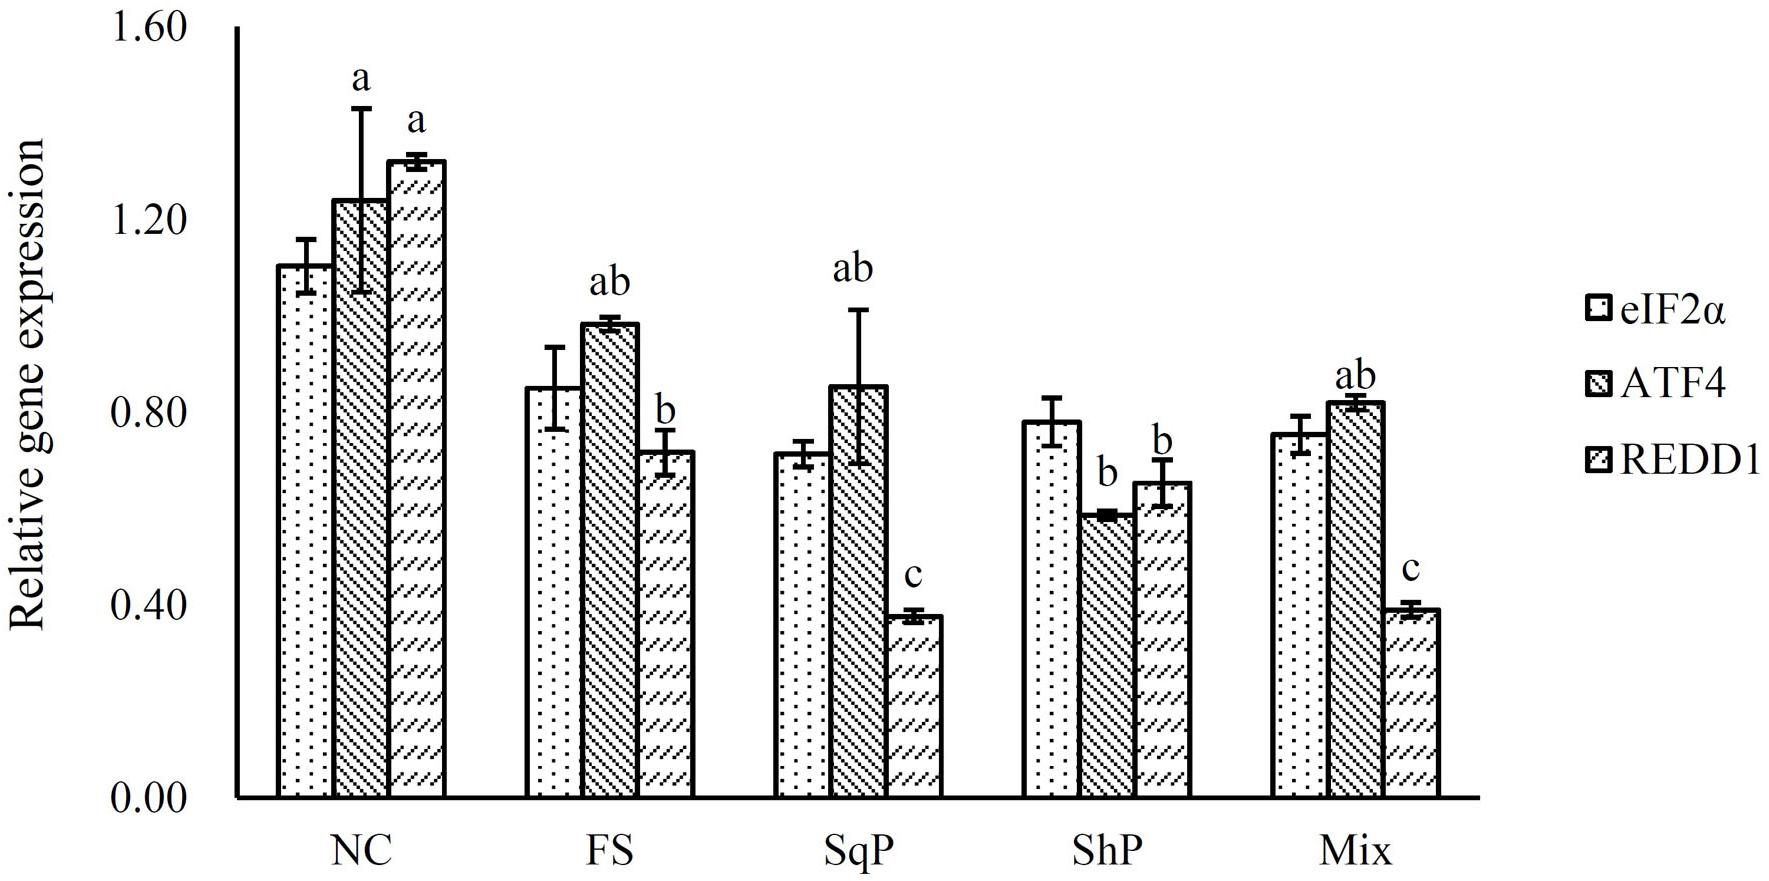
Figure 3. The expression of AAR pathway-related genes, elongation initiation factor 2α (eIF2α), activating transcription factor 4 (ATF4), and regulated in development and DNA damage responses 1 (REDD1) of largemouth bass fed the experimental diets for 81 days. Values (means ± standard error of the mean, SEM) in bars that have the same letter are not significantly different (P > 0.05; Tukey’s test) among treatments (N = 3).
Discussion
The replacement of fish meal with alternative protein sources is essential for sustainable aquaculture due to the limited fish meal resources. The fish meal content could be reduced to 35% with plant protein source in the diet for largemouth bass without negative effects on growth performance (Chen et al., 2013). Previous studies have demonstrated that the supplementation of some marine protein hydrolyzates could benefit for improving nutritive values of low fish meal diet (Toften et al., 2003; Kousoulaki et al., 2009; Kader et al., 2010, 2012; Kader and Koshio, 2012; Bui et al., 2014; Wu et al., 2018). In the present study, the effect of three marine protein hydrolyzates (FS, SqP, and ShP) inclusion on the overall performance of largemouth bass was investigated at the fish meal level of 35%, which could determine the optimal marine protein hydrolyzate and provide basis for further reducing the use of fish meal in the diets for largemouth bass.
The growth performance was elevated with the inclusion of marine protein hydrolyzates in the present study. The promotion effect of marine protein hydrolyzates on growth performance has also been observed in red sea bream (Kader et al., 2010, 2012; Bui et al., 2014), rainbow trout Oncorhynchus mykiss (Toften et al., 2003), Atlantic salmon Salmo salar (Kousoulaki et al., 2009), and yellow catfish Pelteobagrus fulvidraco (Wu et al., 2018). Meanwhile, the inclusion of marine by-products in the present significantly elevated the FI in accordance as described previously (Toften et al., 2003; Kofuji et al., 2006; Kousoulaki et al., 2009; Kader et al., 2010, 2012), and this mainly related to the increased SGR. Some free amino acids, such as alanine and glycine, have been considered as feeding stimulant to enhance the appetite of fish (Shamushaki et al., 2007). Additionally, taurine exhibits the function of promoting feeding in fish (Kim et al., 2005; Chatzifotis et al., 2008). Therefore, the elevated free amino acids and taurine may partly account for the elevated FI and SGR with the inclusion of marine protein hydrolyzates. Meanwhile, fish fed the diet with FS and ShP showed relative higher growth and feed intake than that of SqP and Mix, which also followed a similar pattern with the content of taurine and free amino acids in diets.
The improvement in the non-specific immune response has been reported with the inclusion of marine protein hydrolyzates in some previous studies (Bui et al., 2014; Khosravi et al., 2015; Siddik et al., 2019). Lysozyme is an essential component of innate immune system, and its activity effectively reflects the innate immune response to pathogen infection (Saurabh and Sahoo, 2008). The activity of lysozyme was significantly elevated with the inclusion of marine protein hydrolyzates in red sea bream (Bui et al., 2014; Khosravi et al., 2015) and barramundi Lates calcarifer (Siddik et al., 2019). Similarly, in the present study, the inclusion of marine protein hydrolyzates significantly elevated the serum lysozyme activity. The major components of serum protein are albumin and immunoglobulin, and the supplementation of marine protein increased the immunoglobulin content in red seabream (Bui et al., 2014; Khosravi et al., 2015). Meanwhile, the serum protein content was significantly increased with the marine protein hydrolyzate inclusion in the present study, indicating the immunostimulatory effect of marine protein hydrolyzates. Aminotransferases, such as AST and ALT, are capable of catabolizing amino acids and transferring amino to α-keto acids, commonly used for the detection of liver damage or organ dysfunction in fish species (Lin and Luo, 2011; Luo et al., 2012; Li et al., 2014; Lu et al., 2017). In general, high fish meal replacement with plant protein significantly decreased the activity of AST and ALT with negative effects on growth performance (Lin and Luo, 2011; Luo et al., 2012; Li et al., 2014). However, in the present study, the inclusion of marine protein hydrolyzates significantly decreased the activity of AST and ALT, which seemed to be in conflict with the improved performance with the marine protein hydrolyzate inclusion. The marine protein hydrolyzates are also rich in soluble protein, peptides, and low-molecular-weight components (Harnedy and FitzGerald, 2012), and the more digestible protein hydrolyzates may account for the decreased transaminase activities and the elevated ADC of protein in fish fed the diet with marine protein hydrolyzates.
It is well known that IGF-I is essential in regulating the development and growth of vertebrates (Moriyama et al., 2000). In general, the expression of IGF-I could partly illustrate the variation in growth performance induced by feed intake (Duan, 1998), and meanwhile, a positive relationship between IGF-I and growth has been observed in Japanese flounder Paralichthys olivaceus (Zheng et al., 2012), gilthead seabream Sparus aurata (Gómez-Requeni et al., 2004), Japanese seabass Lateolabrax japonicus (Men et al., 2014), and hybrid grouper Epinephelus lanceolatus × E. fuscoguttatus (Luo et al., 2016). The inclusion of fish protein hydrolyzates has been confirmed to promote liver IGF-I mRNA expression and serum IGF-I content (Zheng et al., 2012). Similarly, in the present study, the expression of IGF-I was improved with the inclusion of marine protein hydrolyzates, and the elevated IGF-I expression could partly account for the better growth performance in those groups.
The IGF system has been considered as the main nutrient-sensing pathway, which develops its function in regulating protein synthesis through the integration of phosphatidylinositol 3-kinase (PI3K)/AKT/TOR pathways (Fuentes et al., 2013). In the present study, the expression of AKT1 was elevated with the inclusion of marine protein hydrolyzates, which may be associated with the increased expression of IGF-1. Meanwhile, the activation of TOR directly induces the expression of translation regulators eukaryotic initiation factor 4E (elF4E) binding protein 1 (4EBP1) and S6 to promote protein synthesis (Ma and Blenis, 2009). The up-regulation of S6 in the present study revealed the activation of the TOR pathway to some extent. Meanwhile, the TOR pathway is necessary to perceive the amino acid abundance at the cellular level (Gallinetti et al., 2013). The significantly enhanced ADC of protein in the marine protein hydrolyzate groups may produce the variation in amino acid abundance, which partly accounted for the activation of the TOR pathway. Additionally, in mammals, the inclusion of taurine could also activate the TOR pathway (Li et al., 2012; Solon et al., 2012), and therefore, the increased taurine content caused by the inclusion of marine protein hydrolyzates may also be responsible for the activation of the TOR pathway. The AAR pathway commonly functions in opposition to the TOR pathway, and the scarce or imbalanced amino acids commonly leads to the phosphorylation of eIF2α to reduce protein synthesis and the promotion of translation of ATF4 (Kilberg et al., 2009; Castilho et al., 2014). Previous studies in turbot suggest that the activation of the AAR pathway partly accounts for the protein synthesis with high replacement of fish meal (Song et al., 2016; Xu et al., 2016). In the present study, the inclusion of marine protein hydrolyzates significantly decreased the expression of ATF4, which indicated the inhibition of the AAR pathway to some extent. However, no significant difference was observed in the expression of eIF2α, which may be regulated at the phosphorylation level as in mammals. The phosphorylation of eIF2α induces the expression of REDD1 in an ATF4-dependent manner (Jin et al., 2009; Whitney et al., 2009). In the present study, the expression of REDD1 was significantly decreased with the inclusion of marine protein hydrolyzates, and this confirmed the down-regulation of the AAR pathway in those groups. In addition, REDD1 acts as a negative regulator of the TOR pathway in mammals (Ma and Blenis, 2009), and the down-regulation of REDD1 and activation of the TOR pathway indicated the existence of similar regulation mechanism in fish species.
In the above, the inclusion of marine protein hydrolyzates improved the growth performance of largemouth bass with enhanced non-specific immunity, and fish fed the diet with FS and ShP obtained significantly higher growth than that of NC. The promotion of growth was partly associated with the elevated feed intake and protein digestibility. In addition, with the supplementation of marine protein hydrolyzates, the expression of IGF-I was up-regulated along with the activation of the TOR pathway and depression of the AAR pathway. Further studies would be conducted to replace the use of fish meal with suitable marine protein hydrolyzates, FS and ShP, in the diet of largemouth bass.
Data Availability Statement
All datasets generated for this study are included in the article/supplementary material.
Ethics Statement
The animal study was reviewed and approved by the Animal Care and Use Committee of the Shanghai Ocean University.
Author Contributions
MD conducted most of the experiment, analyzed the data, and wrote the manuscript under the guidance of SL and NC. CF and HQ offered their help in the feeding trial. All authors read and approved the final manuscript.
Funding
This study was supported by the China Agriculture Research System (CARS-46 to NC) and the Shanghai Talent Development Fund (No. 2019116 to SL).
Conflict of Interest
The authors declare that the research was conducted in the absence of any commercial or financial relationships that could be construed as a potential conflict of interest.
References
Antoine, F. R., Wei, C. I., Littell, R. C., and Marshall, M. R. (1999). HPLC method for analysis of free amino acids in fish using o-phthaldialdehyde precolumn derivatization. J. Agr. Food Chem. 47, 5100–5107. doi: 10.1021/jf990032+
Barros, M. M., Lim, C., and Klesius, P. H. (2002). Effect of soybean meal replacement by cottonseed meal and iron supplementation on growth, immune response and resistance of Channel Catfish (Ictalurus puctatus) to Edwardsiella ictaluri challenge. Aquaculture 207, 263–279. doi: 10.1016/S0044-8486(01)00740-2
Bradford, M. M. (1976). A rapid and sensitive method for the quantitation of microgram quantities of protein utilizing the principle of protein-dye binding. Anal. Biochem. 72, 248–254. doi: 10.1016/0003-2697(76)90527-3
Bui, H. T. D., Khosravi, S., Fournier, V., Herault, M., and Lee, K. J. (2014). Growth performance, feed utilization, innate immunity, digestibility and disease resistance of juvenile red seabream (Pagrus major) fed diets supplemented with protein hydrolysates. Aquaculture 418, 11–16. doi: 10.1016/j.aquaculture.2013.09.046
Burel, C., Boujard, T., Kaushik, S. J., Boeuf, G., Van Der Geyten, S., Mol, K. A., et al. (2000). Potential of plant-protein sources as fish meal substitutes in diets for turbot (Psetta maxima): growth, nutrient utilisation and thyroid status. Aquaculture 188, 363–382. doi: 10.1016/S0044-8486(00)00342-2
Cahu, C., Rønnestad, I., Grangier, V., and Infante, J. Z. (2004). Expression and activities of pancreatic enzymes in developing sea bass larvae (Dicentrarchus labrax) in relation to intact and hydrolyzed dietary protein; involvement of cholecystokinin. Aquaculture 238, 295–308. doi: 10.1016/j.aquaculture.2004.04.013
Castilho, B. A., Shanmugam, R., Silva, R. C., Ramesh, R., Himme, B. M., and Sattlegger, E. (2014). Keeping the eIF2 alpha kinase Gcn2 in check. BBA-Mol. Basis. Dis. 1843, 1948–1968. doi: 10.1016/j.bbamcr.2014.04.006
Chatzifotis, S., Polemitou, I., Divanach, P., and Antonopoulou, E. (2008). Effect of dietary taurine supplementation on growth performance and bile salt activated lipase activity of common dentex, Dentex dentex, fed a fish meal/soy protein concentrate-based diet. Aquaculture 275, 201–208. doi: 10.1016/j.aquaculture.2007.12.013
Chen, N., Ma, X., Zhao, M., Ji, Z., and Tong, C. (2013). Suitable inclusion levels of white fish meal and two kinds of soybean meal in diets for juvenile largemouth bass (Micropterus salmoides). J. Fish. China. 37, 1389–1400. doi: 10.3724/SP.J.1231.2013.38638
Colburn, H. R., Walker, A. B., Breton, T. S., Stilwell, J. M., Sidor, I. F., Gannam, A. L., et al. (2012). Partial replacement of fishmeal with soybean meal and soy protein concentrate in diets of Atlantic cod. N. Am. J. Aquacult. 74, 330–337. doi: 10.1080/15222055.2012.676008
Divakaran, S., Obaldo, L. G., and Forster, I. P. (2002). Note on the methods for determination of chromic oxide in shrimp feeds. J. Agr. Food Chem. 50, 464–467. doi: 10.1021/jf011112s
Duan, C. M. (1998). Nutritional and developmental regulation of insulin-like growth factors in fish. J. Nutr. 128, 306S–314S. doi: 10.1093/jn/128.2.306S
Ellis, A. E. (1990). “Lysozyme assays,” in Techniques in fish immunology, eds J. S. Stolen, T. C. Fletcher, D. P. Anderson, S. L. Kaattari, and A. F. Rowley (Fair Haven, NJ: SOS Publications), 101–103.
FAO (2016). The State of World Fisheries and Aquaculture 2016: Contributing to Food Security and Nutrition for All. Rome: FAO, 200.
Folch, J., Lees, M., and Sloane-Stanley, G. H. (1957). A simple method for the isolation and purification of total lipids from animal tissues. J. Biol. Chem. 226, 497–509.
Fuentes, E. N., Valdés, J. A., Molina, A., and Björnsson, B. T. (2013). Regulation of skeletal muscle growth in fish by the growth hormone-insulin-like growth factor system. Gen. Comp. Endocr. 192, 136–148. doi: 10.1016/j.ygcen.2013.06.009
Gallinetti, J., Harputlugil, E., and Mitchell, J. R. (2013). Amino acid sensing in dietary-restriction-mediated longevity: roles of signal-transducing kinases GCN2 and TOR. Biochem. Eng. J. 449, 1–10. doi: 10.1042/BJ20121098
Gatlin, D. M. III, Barrows, F. T., Brown, P., Dabrowski, K., Gaylord, T. G., Hardy, R. W., et al. (2007). Expanding the utilization of sustainable plant products in aquafeeds: a review. Aquac. Res. 38, 551–579. doi: 10.1111/j.1365-2109.2007.01704.x
Gildberg, A., and Stenberg, E. (2001). A new process for advanced utilisation of shrimp waste. Process Biochem. 36, 809–812. doi: 10.1016/S0032-9592(00)00278-8
Gómez-Requeni, P., Mingarro, M., Calduch-Giner, J. A., Médale, F., Martin, S. A. M., Houlihan, D. F., et al. (2004). Protein growth performance, amino acid utilisation and somatotropic axis responsiveness to fish meal replacement by plant protein sources in gilthead sea bream (Sparus aurata). Aquaculture 232, 493–510. doi: 10.1016/S0044-8486(03)00532-5
Harnedy, P. A., and FitzGerald, R. J. (2012). Bioactive peptides from marine processing waste and shellfish: a review. J. Funct. Foods 4, 6–24. doi: 10.1016/j.jff.2011.09.001
Hidaka, I., Kohbara, J., Araki, T., Morishita, T., Miyajima, T., Shimizu, S., et al. (2000). Identification of feeding stimulants from a jack mackerel muscle extract for young yellowtail Seriola quinqueradiata. Aquaculture 181, 115–126. doi: 10.1016/S0044-8486(99)00221-5
Huang, D., Wu, Y., Lin, Y., Chen, J., Karrow, N., Ren, X., et al. (2017). Dietary protein and lipid requirements for juvenile largemouth bass, Micropterus salmoides. J. World Aquacult. Soc. 48, 782–790. doi: 10.1111/jwas.12417
Jin, H. O., Seo, S. K., Woo, S. H., Kim, E. S., Lee, H. C., Yoo, D. H., et al. (2009). Activating transcription factor 4 and CCAAT/enhancer-binding protein-β negatively regulate the mammalian target of rapamycin via Redd1 expression in response to oxidative and endoplasmic reticulum stress. Free Radical Bio. Med. 46, 1158–1167. doi: 10.1016/j.freeradbiomed.2009.01.015
Kader, M. A., Bulbul, M., Koshio, S., Ishikawa, M., Yokoyama, S., Nguyen, B. T., et al. (2012). Effect of complete replacement of fishmeal by dehulled soybean meal with crude attractants supplementation in diets for red sea bream, Pagrus major. Aquaculture 350, 109–116. doi: 10.1016/j.aquaculture.2012.04.009
Kader, M. A., and Koshio, S. (2012). Effect of composite mixture of seafood by-products and soybean proteins in replacement of fishmeal on the performance of red sea bream. Pagrus Major. Aquaculture 368, 95–102. doi: 10.1016/j.aquaculture.2012.09.014
Kader, M. A., Koshio, S., Ishikawa, M., Yokoyama, S., and Bulbul, M. (2010). Supplemental effects of some crude ingredients in improving nutritive values of low fishmeal diets for red sea bream, Pagrus major. Aquaculture 308, 136–144. doi: 10.1016/j.aquaculture.2010.07.037
Khosravi, S., Rahimnejad, S., Herault, M., Fournier, V., Lee, C. R., Bui, H. T. D., et al. (2015). Effects of protein hydrolysates supplementation in low fish meal diets on growth performance, innate immunity and disease resistance of red sea bream Pagrus major. Fish Shellfish Immu. 45, 858–868. doi: 10.1016/j.fsi.2015.05.039
Kilberg, M. S., Pan, Y. X., Chen, H., and Leung-Pineda, V. (2005). Nutritional control of gene expression: how mammalian cells respond to amino acid limitation. Annu. Rev. Nutr. 25, 59–85. doi: 10.1146/annurev.nutr.24.012003.132145
Kilberg, M. S., Shan, J., and Su, N. (2009). ATF4-dependent transcription mediates signaling of amino acid limitation. Trends Endocrin. Met. 20, 436–443. doi: 10.1016/j.tem.2009.05.008
Kim, S. K., Takeuchi, T., Yokoyama, M., Murata, Y., Kaneniwa, M., and Sakakura, Y. (2005). Effect of dietary taurine levels on growth and feeding behavior of juvenile Japanese flounder Paralichthys olivaceus. Aquaculture 250, 765–774. doi: 10.1016/j.aquaculture.2005.04.073
Kimball, S. R., and Jefferson, L. S. (2002). Control of protein synthesis by amino acid availability. Curr. Opin. Clin. Nutr. 5, 63–67. doi: 10.1097/00075197-200201000-00012
Kofuji, P. Y. M., Hosokawa, H., and Masumoto, T. (2006). Effects of dietary supplementation with feeding stimulants on yellowtail Seriola quinqueradiata (Temminck & Schlegel; Carangidae) protein digestion at low water temperatures. Aquac. Res. 37, 366–373. doi: 10.1111/j.1365-2109.2005.01435.x
Kousoulaki, K., Albrektsen, S., Langmyhr, E., Olsen, H. J., Campbell, P., and Aksnes, A. (2009). The water soluble fraction in fish meal (stickwater) stimulates growth in Atlantic salmon (Salmo salar L.) given high plant protein diets. Aquaculture 289, 74–83. doi: 10.1016/j.aquaculture.2008.12.034
Laplante, M., and Sabatini, D. M. (2012). mTOR signaling in growth control and disease. Cell 149, 274–293. doi: 10.1016/j.cell.2012.03.017
Lee, S. M. (2002). Apparent digestibility coefficients of various feed ingredients for juvenile and grower rockfish (Sebastes schlegeli). Aquaculture 207, 79–95. doi: 10.1016/S0044-8486(01)00751-7
Li, S., Sang, C., Wang, A., Zhang, J., and Chen, N. (2019). Effects of dietary carbohydrate sources on growth performance, glycogen accumulation, insulin signaling pathway and hepatic glucose metabolism in largemouth bass, Micropterus salmoides. Aquaculture 513:734391. doi: 10.1016/j.aquaculture.2019.734391
Li, Y., Ai, Q., Mai, K., Xu, W., Deng, J., and Cheng, Z. (2014). Comparison of high-protein soybean meal and commercial soybean meal partly replacing fish meal on the activities of digestive enzymes and aminotransferases in juvenile Japanese seabass. Lateolabrax japonicus (Cuvier, 1828). Aquac. Res. 45, 1051–1060. doi: 10.1111/are.12042
Li, Y., Hu, Z., Chen, B., Bu, Q., Lu, W., Deng, Y., et al. (2012). Taurine attenuates methamphetamine-induced autophagy and apoptosis in PC12 cells through mTOR signaling pathway. Toxicol. Lrtt. 215, 1–7. doi: 10.1016/j.toxlet.2012.09.019
Lim, C., and Webster, C. D. (2008). Alternative Protein Sources in Aquaculture Diets, ed. C. S. Lee (New York, NY: Haworth Press).
Lin, S., and Luo, L. (2011). Effects of different levels of soybean meal inclusion in replacement for fish meal on growth, digestive enzymes and transaminase activities in practical diets for juvenile tilapia. Oreochromis niloticus× O. aureus. Anim. Feed Sci. Tech. 168, 80–87. doi: 10.1016/j.anifeedsci.2011.03.012
Livak, K. J., and Schmittgen, T. D. (2001). Analysis of relative gene expression data using real-time quantitative PCR and the 2-ΔΔCT method. Methods 25, 402–408. doi: 10.1006/meth.2001.1262
Llames, C. R., and Fontaine, J. (1994). Determination of amino acids in feeds: collaborative study. J. AOAC Int. 77, 1362–1402. doi: 10.1093/jaoac/77.6.1362
Lu, K. L., Wang, L. N., Zhang, D. D., Liu, W. B., and Xu, W. N. (2017). Berberine attenuates oxidative stress and hepatocytes apoptosis via protecting mitochondria in blunt snout bream Megalobrama amblycephala fed high-fat diets. Fish Physiol. Biochem. 43, 65–76. doi: 10.1007/s10695-016-0268-5
Luo, Y., Ai, Q., Mai, K., Zhang, W., Xu, W., and Zhang, Y. (2012). Effects of dietary rapeseed meal on growth performance, digestion and protein metabolism in relation to gene expression of juvenile cobia (Rachycentron canadum). Aquaculture 368, 109–116. doi: 10.1016/j.aquaculture.2012.09.013
Luo, Y., Wu, X., Li, W., Jiang, S., Lu, S., and Wu, M. (2016). Effects of different corn starch levels on growth, protein input, and feed utilization of juvenile hybrid grouper (male Epinephelus lanceolatus× female E. fuscoguttatus). N Am. J. Aquacult. 78, 168–173. doi: 10.1080/15222055.2015.1129004
Ma, X. M., and Blenis, J. (2009). Molecular mechanisms of mTOR-mediated translational control. Nat. Rev. Mol. Cell Biol. 10, 307–318. doi: 10.1038/nrm2672
Men, K., Ai, Q., Mai, K., Xu, W., Zhang, Y., and Zhou, H. (2014). Effects of dietary corn gluten meal on growth, digestion and protein metabolism in relation to IGF-I gene expression of Japanese seabass. Lateolabrax japonicus. Aquaculture 428, 303–309. doi: 10.1016/j.aquaculture.2014.03.028
Moriyama, S., Ayson, F. G., and Kawauchi, H. (2000). Growth regulation by insulin-like growth factor-I in fish. Biosci. Biotech. Bioch. 64, 1553–1562. doi: 10.1271/bbb.64.1553
Reinecke, M., Björnsson, B. T., Dickhoff, W. W., McCormick, S. D., Navarro, I., Power, D. M., et al. (2005). Growth hormone and insulin-like growth factors in fish: where we are and where to go. Gen. Comp. Endocr. 142, 20–24. doi: 10.1016/j.ygcen.2005.01.016
Reitman, S., and Frankel, S. (1957). A colorimetric method for the determination of serum glutamic oxalacetic and glutamic pyruvic transaminases. Am. J. Clin. Pathol. 28, 56–63. doi: 10.1093/ajcp/28.1.56
Saurabh, S., and Sahoo, P. K. (2008). Lysozyme: an important defence molecule of fish innate immune system. Aquac. Res. 39, 223–239. doi: 10.1111/j.1365-2109.2007.01883.x
Shahidi, F. (1994). Seafood Processing By-Products. In Seafoods: Chemistry, Processing Technology and Quality. Boston, MA: Springer, 320–334. doi: 10.1007/978-1-4615-2181-5_16
Shamushaki, V. A. J., Kasumyan, A. O., Abedian, A., and Abtahi, B. (2007). Behavioural responses of the Persian sturgeon (Acipenser persicus) juveniles to free amino acid solutions. Mar. Freshw. Behav. Phys. 40, 219–224. doi: 10.1080/10236240701602184
Siddik, M. A., Howieson, J., and Fotedar, R. (2019). Beneficial effects of tuna hydrolysate in poultry by-product meal diets on growth, immune response, intestinal health and disease resistance to Vibrio harveyi in juvenile barramundi. Lates calcarifer. Fish Shellfish Immu. 89, 61–70. doi: 10.1016/j.fsi.2019.03.042
Solon, C. S., Franci, D., Ignacio-Souza, L. M., Romanatto, T., Roman, E. A., Arruda, A. P., et al. (2012). Taurine enhances the anorexigenic effects of insulin in the hypothalamus of rats. Amino Acids 42, 2403–2410. doi: 10.1007/s00726-011-1045-5
Song, F., Xu, D., Mai, K., Zhou, H., Xu, W., and He, G. (2016). Comparative study on the cellular and systemic nutrient sensing and intermediary metabolism after partial replacement of fishmeal by meat and bone meal in the diet of turbot (Scophthalmus maximus L.). PLoS One 11:e0165708. doi: 10.1371/journal.pone.0165708
Song, Z., Li, H., Wang, J., Li, P., Sun, Y., and Zhang, L. (2014). Effects of fishmeal replacement with soy protein hydrolysates on growth performance, blood biochemistry, gastrointestinal digestion and muscle composition of juvenile starry flounder (Platichthys stellatus). Aquaculture 426, 96–104. doi: 10.1016/j.aquaculture.2014.01.002
Tacon, A. G., and Metian, M. (2008). Global overview on the use of fish meal and fish oil in industrially compounded aquafeeds: trends and future prospects. Aquaculture 285, 146–158. doi: 10.1016/j.aquaculture.2008.08.015
Thissen, J. P., Ketelslegers, J. M., and Underwood, L. E. (1994). Nutritional regulation of the insulin-like growth factors. Endocr. Rev. 15, 80–101. doi: 10.1210/edrv-15-1-80
Toften, H., Arnesen, A. M., and Jobling, M. (2003). Feed intake, growth and ionoregulation in Atlantic salmon (Salmo salar L.) smolts in relation to dietary addition of a feeding stimulant and time of seawater transfer. Aquaculture 217, 647–662. doi: 10.1016/S0044-8486(02)00404-0
Wang, P., Zhu, J., Feng, J., He, J., Lou, Y., and Zhou, Q. (2017). Effects of dietary soy protein concentrate meal on growth, immunity, enzyme activity and protein metabolism in relation to gene expression in large yellow croaker Larimichthys crocea. Aquaculture 477, 15–22. doi: 10.1016/j.aquaculture.2017.04.030
Whitney, M. L., Jefferson, L. S., and Kimball, S. R. (2009). ATF4 is necessary and sufficient for ER stress-induced upregulation of REDD1 expression. Biochem. Bioph. Res. 379, 451–455. doi: 10.1016/j.bbrc.2008.12.079
Wu, D., Zhou, L., Gao, M., Wang, M., Wang, B., He, J., et al. (2018). Effects of stickwater hydrolysates on growth performance for yellow catfish (Pelteobagrus fulvidraco). Aquaculture 488, 161–173. doi: 10.1016/j.aquaculture.2018.01.031
Xu, D., He, G., Mai, K., Zhou, H., Xu, W., and Song, F. (2016). Postprandial nutrient-sensing and metabolic responses after partial dietary fishmeal replacement by soyabean meal in turbot (Scophthalmus maximus L.). Brit. J. Nutr. 115, 379–388. doi: 10.1017/S0007114515004535
Yearbook, C. F. S. (2019). China Fishery Statistics Yearbook. Bureau of Fisheries, Ministry of Agriculture. Beijing: China Agriculture Press.
Keywords: marine protein hydrolyzates, growth performance, gene expression, nutrient-sensing pathway, largemouth bass
Citation: Dai M, Li S, Fu C, Qiu H and Chen N (2020) The Potential Role of Marine Protein Hydrolyzates in Elevating Nutritive Values of Diets for Largemouth Bass, Micropterus salmoides. Front. Mar. Sci. 7:197. doi: 10.3389/fmars.2020.00197
Received: 11 February 2020; Accepted: 13 March 2020;
Published: 29 April 2020.
Edited by:
Kang-le Lu, Jimei University, ChinaReviewed by:
Xuan Wang, Ocean University of China, ChinaXiaofang Liang, Chinese Academy of Agricultural Sciences, China
Copyright © 2020 Dai, Li, Fu, Qiu and Chen. This is an open-access article distributed under the terms of the Creative Commons Attribution License (CC BY). The use, distribution or reproduction in other forums is permitted, provided the original author(s) and the copyright owner(s) are credited and that the original publication in this journal is cited, in accordance with accepted academic practice. No use, distribution or reproduction is permitted which does not comply with these terms.
*Correspondence: Songlin Li, c2xsaUBzaG91LmVkdS5jbg==; Naisong Chen, bnNjaGVuQHNob3UuZWR1LmNu