 Habacuc Pérez-Tribouillier
 Taryn L. Noble
 Ashley T. Townsend
 Andrew R. Bowie
 Zanna Chase
- 1Institute for Marine and Antarctic Studies, University of Tasmania, Hobart, TAS, Australia
- 2Antarctic Climate and Ecosystems Cooperative Research Centre, Hobart, TAS, Australia
- 3Central Science Laboratory, University of Tasmania, Hobart, TAS, Australia
Thorium (Th) isotopes were applied to quantify the supply of lithogenic inputs from the Kerguelen Plateau to the Southern Ocean. The dissolved concentrations of 232Th and 230Th were measured following a novel pre-concentration method using the Nobias resin from 10 stations above and on the slopes of the plateau. Elevated 232Th/230Th ratios in the upper 500 m of the water column confirm the input of lithogenic material from islands, glaciers and the resuspension of shelf-deposited sediments. 230Th concentrations were used to calculate a scavenging residence time for Th, which was then applied to calculate the flux of dissolved 232Th required to match the observed concentrations of dissolved 232Th. The 232Th content of the lithogenic material from the Kerguelen Plateau was used with the solubility of Th reported in the literature, to estimate a lithogenic particle flux of 7 to 810 mg m–2 day–1. This flux is comparable to fluxes obtained using sediment traps (8–777 mg m–2 day–1) in other continental-margin zones of the Southern Ocean. The flux of dissolved iron, generated by the dissolution of particles, was also calculated (4,189–6,800 nmol m–2 day–1) based on the iron/thorium ratio in the material from the Kerguelen Plateau. This is higher than previous estimates (1,342 nmol m–2 day–1), suggesting the dissolution of particles as the missing source of iron, thus closing the iron budget of the region. This study confirms the utility of long-lived Th isotopes to quantify lithogenic inputs from continental margin settings.
Introduction
The different isotopes of thorium (Th) provide important information about a variety of processes that occur in the oceans. In seawater, Th has a stable oxidation state of IV, making it highly particle reactive (Santschi et al., 2006). Thorium isotopes also have very well-constrained and limited sources to the marine environment. The very-long lived primordial isotope 232Th (t1/2 = 1.4 × 10¹⁰ years) represents ∼99.98% of all natural Th and it is supplied to the ocean almost exclusively by the dissolution of continental material transported by rivers, wind and the dissolution of continental shelf sediments (Krishnaswami and Cochran, 2011). 230Th (t1/2 = 75,400 years) is supplied to the ocean almost entirely by the decay of the highly soluble 234U, which has a uniform distribution in the ocean (Krishnaswami and Cochran, 2008). 230Th is removed at an almost constant rate to the sediments by interaction with particles (Anderson et al., 1983). The combination of particle reactivity and well-constrained sources makes Th isotopes one of the most versatile tools to study particle fluxes in the ocean and in the sedimentary record (Francois et al., 1990, 2004; Costa and McManus, 2017; Luo, 2017). In the last decade, the 232Th-230Th system has gained popularity as a tracer to quantify lithogenic sources of trace elements to the marine environment (Hsieh et al., 2011; Hayes et al., 2013, 2015, 2017; Deng et al., 2014). The long-lived Th isotopes can be used to track and quantify the input of lithogenic material to the ocean because 232Th acts as the tracer of lithogenic input, while 230Th provides information concerning residence time with respect to scavenging, which is assessed through its disequilibrium from its soluble parent nuclide 234U (Broecker et al., 1973). Finally, with knowledge about the composition and solubility of the lithogenic material it is possible to estimate the input and flux of lithogenic particles and trace elements to the ocean (Hsieh et al., 2011; Hayes et al., 2018).
Trace elements are important because they can limit primary production by phytoplankton in the photic layers of large parts of ocean. In particular, the absence of bio-available iron (Fe) has been recognized to be the main cause of low productivity in areas of the ocean’s surface with abundant macronutrients such as nitrogen and phosphorus (known as high nutrient, low chlorophyll or HNLC regions; Martin, 1990; Boyd et al., 2007; Moore et al., 2013). The HNLC regions occupy around one third of the world’s oceans, with the Southern Ocean (SO) being the largest of these regions. HNLC conditions are often relieved through the addition of Fe (Morris and Charette, 2013). Outside the SO, Fe is supplied mainly through the dissolution of continental dust transported to the oceans by the wind (Jickells, 2005). However, the SO is located far away from dust sources. Remote islands and shallow continental shelves in the SO can be a natural source of Fe enabling the proliferation of phytoplanktonic blooms (Blain et al., 2001; Tyrrell et al., 2005; Tagliabue et al., 2009, 2014), and hence influencing the oceanic carbon cycle and the sequestration of CO2 from the atmosphere (Fung et al., 2000; Sarthou et al., 2007; Mahowald et al., 2009; Boyd and Ellwood, 2010).
The Kerguelen Plateau (KP) area hosts the largest phytoplankton bloom of the SO (Blain et al., 2007). It appears in the austral summer after photosynthesis is no longer light-limited, and extends over more than 45,000 km2. A series of voyages carried out during 2005 and 2011 (KEOPS1 and 2) significantly increased the understanding of how natural Fe fertilization occurs and its important role in the global carbon cycle, and noted the importance of islands in the supply of iron to Antarctic and Subantarctic regions (Blain et al., 2007, 2008a,b; Jacquet et al., 2008; Jouandet et al., 2008; Mosseri et al., 2008; Sarthou et al., 2008). Remote-sensing and modeling were able to simulate bloom conditions over the plateau and contributed to constrain the processes that transport iron, acknowledging the importance of the bathymetry and surface advection fields (Bopp et al., 2008; Mongin et al., 2008), which was further confirmed by detailed descriptions of the region’s physical oceanography and its relation with the flow of the Antarctic Circumpolar Current (ACC; Figure 1; Park et al., 2008a, b, 2014). Particle dynamics (Venchiarutti et al., 2008, 2011) and carbon fluxes (Savoye et al., 2008; Planchon et al., 2015) were studied through the analysis of Th isotopes in the dissolved and particulate phases of seawater. Other work focused on constraining the origin of the lithogenic material that allows Fe to sustain the phytoplankton bloom (van Beek et al., 2008; Zhang et al., 2008; van der Merwe et al., 2015; Grenier et al., 2018). The dominant source of iron was found to be the dissolution of sediments deposited on the plateau and transported to the surface by vertical mixing (Zhou et al., 2014), and the lateral transport and dissolution of lithogenic material supplied by the Kerguelen Islands (van Beek et al., 2008; Sanial et al., 2015; van der Merwe et al., 2015). It was found that the bloom persisted even with Fe concentrations close to values known to be metabolically limiting for phytoplankton (Bowie et al., 2015). This highlights the importance of efficient Fe recycling in the mixed layer, as well as of other potential sources of Fe to the region, e.g., from Heard and McDonald Islands (HIMI) in the central part of the plateau (Bown et al., 2012; Bowie et al., 2015).

Figure 1. Predominant circulation pattern in the Kerguelen plateau (reproduced with permission from Park et al., 2008b). The green color represents areas where phytoplankton blooms are historically known to develop above the plateau, however high biomass areas also extend eastwards off the plateau in downstream waters. Arrows represent the main circulation patterns above the plateau.
The Heard and McDonald Earth-Ocean-Biosphere Interactions study (HEOBI; GEOTRACES process study GIpr05), undertaken during the summer of 2016, focused on sampling the central part of the KP around HIMI. The main objectives of this voyage were to increase knowledge about the contribution of HIMI and surrounding shallow areas to the biogeochemical cycle of Fe in the region. Special attention was paid to the role of particles originating from the islands as well as any possible hydrothermal contribution to the Fe inventory. Results from this expedition noted the importance of HIMI to Fe availability that influences the drawdown of nutrients above the plateau (Holmes et al., 2019), and also confirmed that glacial erosion from Heard Island and probably hydrothermal activity from McDonald Island can support the previously unaccounted biological demand (van der Merwe et al., 2019). The aim of this work was to apply dissolved 232Th and 230Th measurements in samples collected during the HEOBI voyage in order to quantify the input of lithogenic material released from the areas around HIMI. This lithogenic material has the potential to release iron and therefore, to naturally fertilize surface waters around and in the wake of the KP.
Materials and Methods
Sampling
Seawater samples and hydrographic data1 were collected in the KP region during the HEOBI voyage in January and February 2016 onboard the R/V Investigator (IN2016_V01; Figure 2). All sampling was performed following the protocols described in the GEOTRACES intercalibration for Th and Pa isotopes (Anderson et al., 2012). Samples ranging from 5 to 10 L were collected directly from Niskin bottles mounted on a standard CTD and filtered through AcroPak capsule filters (0.2 μm) into 10 L pre-weighted plastic containers. Samples were then acidified with 1 mL of 11M HCl distilled acid per liter of sample to a final pH value ∼1.7. In order to determine procedural blank concentrations, 2 L of ultra-high purity water (UPW) were collected from the onboard system and acidified in the same way as the samples. In total, 75 samples from 10 different locations (Figure 2) were preconcentrated and analyzed. Two stations (18 and 25) were sampled on the western flank of the plateau in waters located generally upstream of the plateau; the water column characteristics at sampling time support their use as reference stations. A series of samples was collected within 1 km of Heard (30 and 31) and McDonald (22 and 34) Islands in order to establish a Th signal from the islands. Station 16 was collected from the middle of the plateau and is part of a transect that includes stations 6, 9, and 12 that were collected to sample the transition from the plateau (∼450 m depth) to open water (3600 m depth) sub-Antarctic conditions.
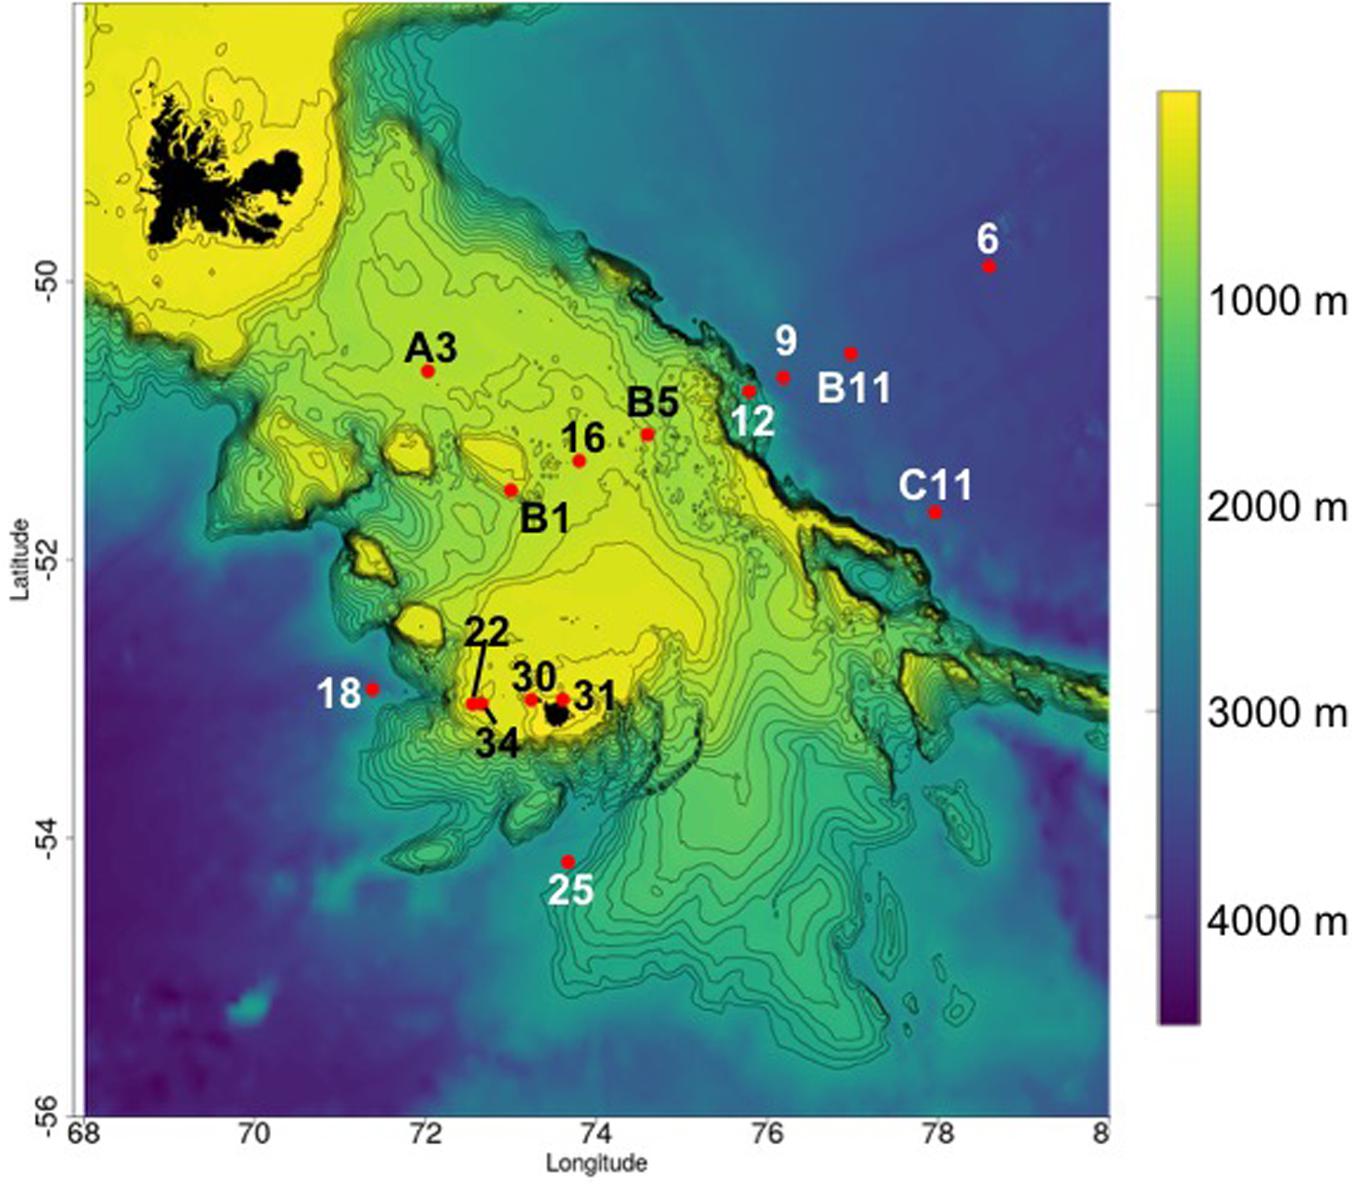
Figure 2. High resolution bathymetry of the Kerguelen plateau (Beaman and O’Brien, 2011) and location of the stations sampled for Th isotopes during the HEOBI voyage. Different colors of the station numbers have been chosen for better visualization against the background. Included are stations from previous studies used in the discussion, including Stations B1, B5, B11, and C11 (Savoye et al., 2008) sampled during the KEOPS 1 voyage and Station A3 from KEOPS 2 (Bowie et al., 2015).
Pre-concentration and Column Chemistry
The pre-concentration and chromatographic separation methodology applied in this study was part of a technique to simultaneously determine Th and neodymium (Nd) isotopes from a single seawater sample, and is described in full detail in Pérez-Tribouillier et al. (2019). Briefly, samples were amended with ∼200 μL of concentrated hydrofluoric acid (HF) and spiked with 1 pg of 229Th per kg of seawater. Samples were left to equilibrate for at least 48 h. After this period, enough 2.5M ammonium acetate buffer solution was added to reach a final concentration in the sample of 0.05M. The pH was then adjusted to 4.75 with concentrated HCl. Immediately thereafter, samples were pumped through an array of two Nobias PA1L cartridges. Once all sample passed through the cartridges, remaining salts were washed off the resin with UPW. Finally, Th and other trace elements were eluted with 5 mL of 3M HNO3.
After pre-concentration, samples were oxidized with 0.5 mL of a mixture of concentrated HNO3 and HClO4 (4:1) at 200°C in order to remove any organic substances (originating from either the sample, or from the column extraction). Thorium isotopes were chromatographically separated and purified using 1 mL Bio-Rad AG1-X8 anion exchange resin following protocols described in Anderson et al. (2012). Samples were transformed to the HCl form and loaded onto the pre-conditioned resin in order to remove transition metals as well as uranium and protactinium isotopes. The samples were oxidized again and converted into 8M HNO3 form and loaded onto the same resin (pre-conditioned with 8M HNO3) to remove the rare earth elements. Thorium isotopes were finally eluted from the resin with 11M HCl, oxidized and redissolved in 0.6 mL 2% HNO3 + 0.3% HF in preparation for analysis. Sample processing occurred in batches consisting of six samples. For each different CTD station, a 2.5 L UPW procedure blank (spiked with 229Th) and the intercalibrated reference material SW2010-2 (Anderson et al., 2012) were processed. An aliquot of ∼ 0.5 g of this reference material was diluted in 2.5 L of UPW. Both the blank and the reference material were treated in the same way as the samples, including pre-concentration and column chemistry. The measurement of Th isotopes was performed on an Element 2 SF-ICP-MS at the Central Science Laboratory (University of Tasmania), with sample introduction via an Aridius II Desolvating Nebulizer to minimize oxide/hydride formation. The pre-concentration factor of the solution introduced to the instrument is about 16,000 for a 10 L sample.
Blanks and Quality Control
In order to reduce blank contributions, all sample processing was performed inside a ducted laminar-flow hood (ISO-1 conditions) in an ISO-5 environment. The procedural blank values ranged from 2–17 pg and 0.2–1.8 fg for 232Th and 230Th, respectively. The reproducibility of the intercalibrated reference material SW2010-2 remained within 5% of the reported values over a period of 7 months (Figure 3), indicating good method reliability.
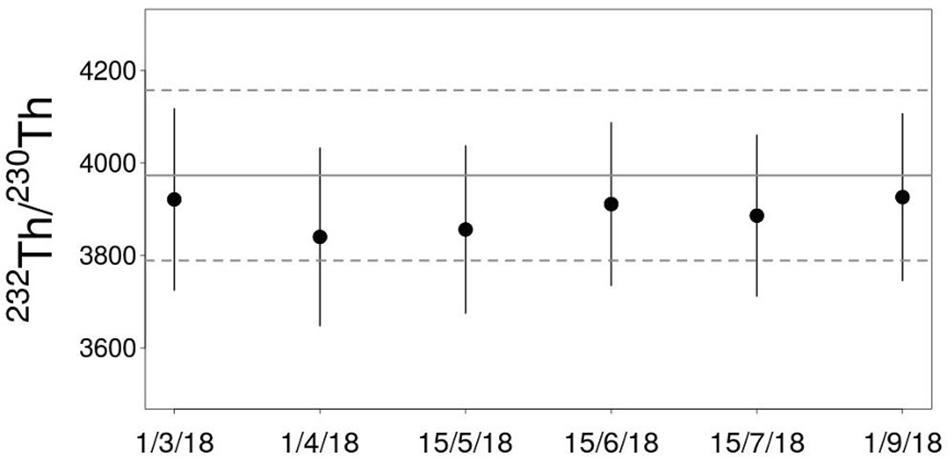
Figure 3. Measured 232Th/230Th ratios in SW2010-2 reference solution for six separate analyses performed over a 7-month period. Solid gray line represents the average value and the dashed gray lines represent 1 standard deviation of the values reported by participating laboratories of the GEOTRACES intercalibration (Anderson et al., 2012). Error bars on measurements are 1σ of the instrument error.
Data Treatment
232Th and 230Th signals were corrected for instrument blank and measurement mass bias (Pérez-Tribouillier et al., 2019). Thereafter, 232Th and 230Th concentrations were obtained using isotope dilution equations (Sargent et al., 2002). Finally, an average procedural blank, based on the blank determinations from all stations, was subtracted. For 230Th, the procedural blank represented < 5% of the total signal, however it increased toward 10% for shallower samples. For 232Th the blank contribution was generally less than 3%. The measured 230Th concentrations were corrected for ingrowth due to decay of 234U during the storage period. The initial content of 234U was calculated based on the 238U activity of each sample, obtained through the salinity relationship of Owens et al. (2011) and a δ234 = 146.8 ± 0.1‰ (Andersen et al., 2010). With this information, the ingrowth-corrected (230ThIGC) was calculated using the sample 234U activity, a λ234 of 2.8263 × 10⁻⁶ yr–1 and a sample storage time of 2 years (Eq. 1). The ingrowth correction varies from 5 to 50% and is higher toward the surface of each station because of the lower 230Th concentrations.
The contribution of lithogenic 230Th was estimated using the measured 232Th concentration of each sample and a 230Th/232Th for the lithogenic material of 4.0 × 10⁻⁶mol/mol (Roy-Barman et al., 2009). The lithogenic contribution was subtracted from the total dissolved 230Th to obtain the excess 230Th (230Thxs; Eq. 2). The contribution of lithogenic 230Th is less than 2% for most samples considered.
A 230Th residence time (230RT) was calculated for each station as shown in Eq. 3 (Hayes et al., 2013). Additionally, Eq. 4 was used to calculate a 234Th residence time (234RT).
The dissolved 230Thxs activity was defined as the measured concentration converted into activity units (dpm), the 234U activity was obtained from the measured salinity, and λ230 (9.2 × 10⁻⁶ year–1) as the radioactive decay rate of 230Th where z is the depth of integration. For the 234RT, dissolved 234Th and 238U activities reported in Savoye et al. (2008) for the KEOPS 1 voyage were used and τ234 is the mean life of 234Th (1/λ). The 230RT was then used to calculate a dissolved 232Th flux by dividing the depth-integrated 232Th inventory by the residence time (Eq. 5; Hayes et al., 2013):
The dissolved 232Th flux was then used to estimate a particulate lithogenic flux considering the content of 232Th in the basaltic lithogenic material around the KP (5.3 ppm; Duncan et al., 2016) and the fractional solubility of 232Th in lithogenic material (STh; Arraes-Mescoff et al., 2001; Roy-Barman et al., 2002) as shown in Eq. 5 (Hayes et al., 2013).
Subsequently with knowledge about the composition and solubility of metals relative to 232Th, it is possible to produce an estimation of dissolved metal fluxes originating from the dissolution of lithogenic particles as follows (Hayes et al., 2013):
Results
Water Mass Distribution During the HEOBI Voyage
The temperature-salinity diagram (Figure 4) indicates that the samples from stations located near HIMI (stations 22,30,31,34), all from depths < 200 m, have salinities (absolute salinity units) below 34.1 g kg–1 and temperature above 2°C, consistent with properties of the Antarctic Surface Water (AASW). The same is the case for surface samples (<200 m) from other stations, with the exception of Station 6. At Station 6, above 75 m the water temperature was greater than 4.5°C and density below 26.75. These characteristics might indicate transient seasonal warming of the upper water column. Below the mixed layer, at depths between 150 and 300 m, Stations 9, 16, 18, and 25 exhibited a subsurface temperature minimum (<2°C) and fresher water (<34.2 g kg–1) than deeper layers. These characteristics match the definition of Winter Water reported for the KP, centered at ∼200 m water depth (Park et al., 2008b). Below 300 m there is a transition to Upper Circumpolar Deep Water (UCDW) associated with a temperature maximum of ∼2.5°C and an oxygen minimum (180 μmol L–1). A deep salinity maximum confirms the presence of Lower Circumpolar Deep Water (LCDW). Below 2,600 m, Stations 6, 9, and 18 display properties consistent with the presence of Antarctic Bottom Water (AABW), i.e., low temperature and salinity but with a higher oxygen content towards the bottom (Park et al., 2008b). This water-column composition is typical for the austral summer (Park et al., 1998) and is consistent with the findings of other studies (Park et al., 2008b, 2014; Park and Vivier, 2011; Holmes et al., 2019).
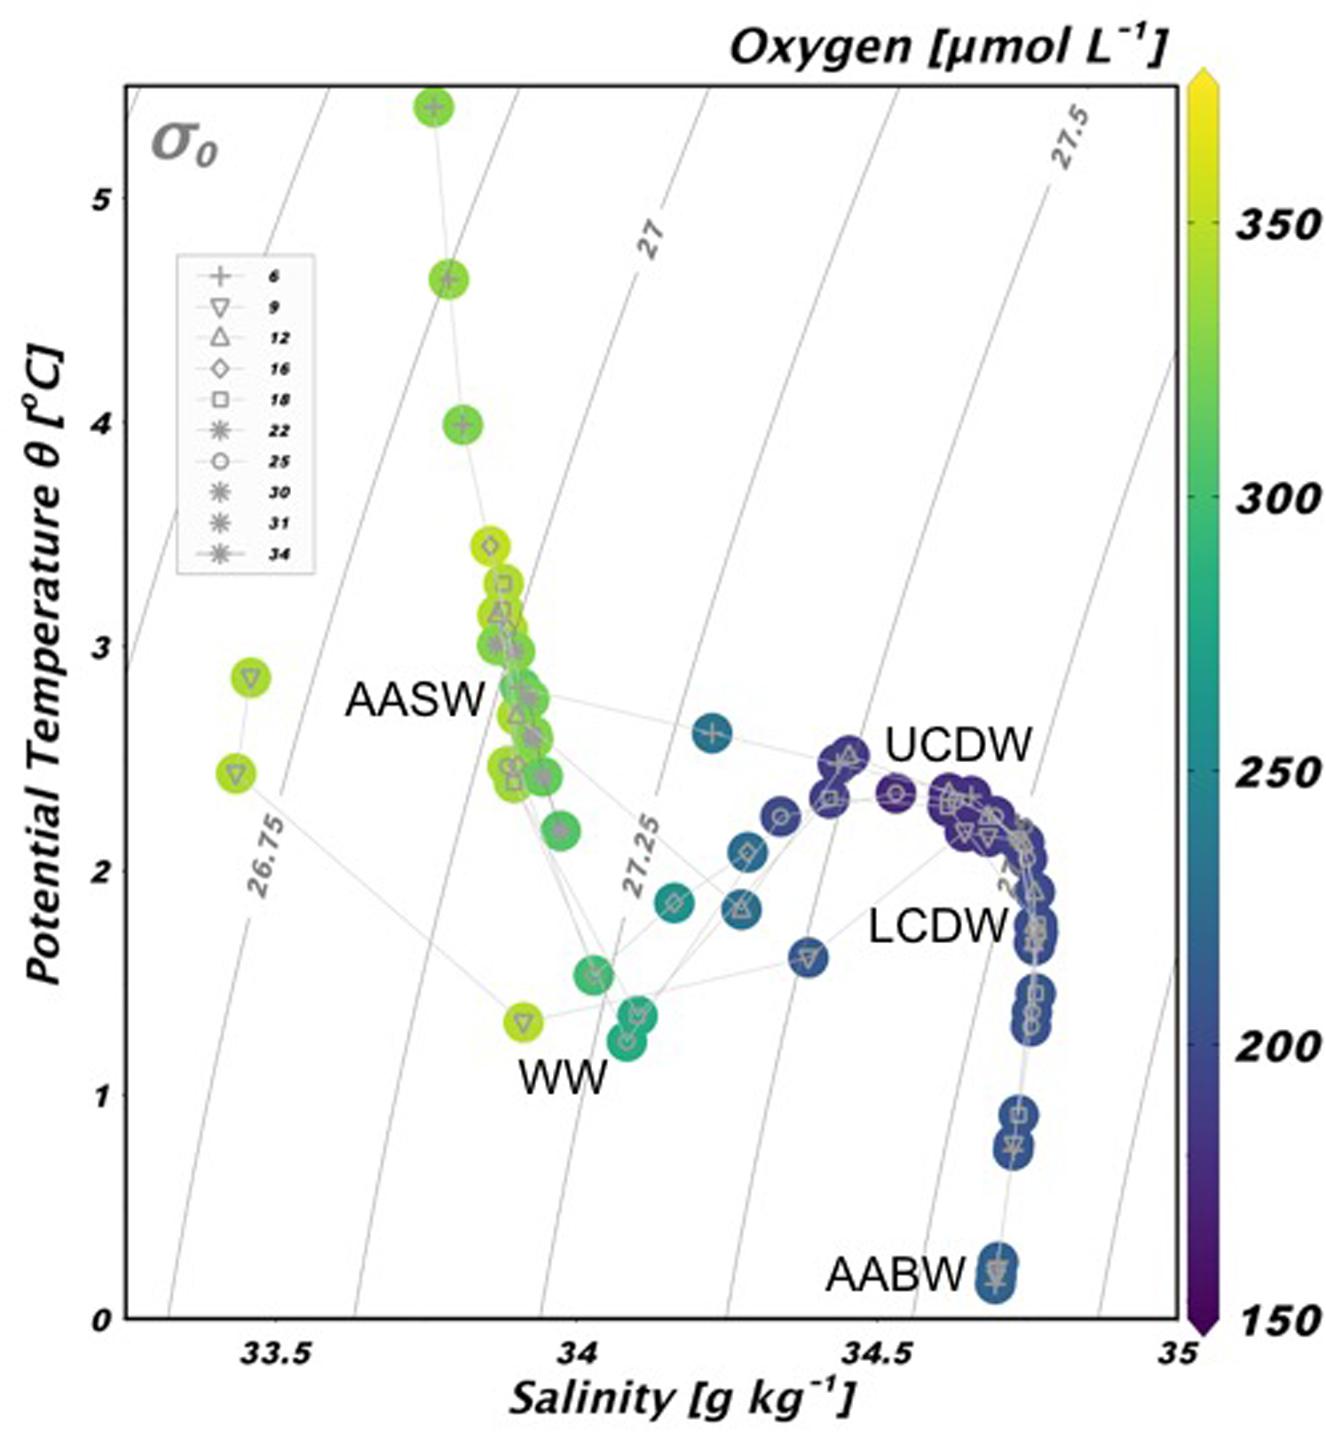
Figure 4. Temperature-salinity diagram for the samples collected during the HEOBI voyage.
232Th and 230Th Concentrations
Plateau and Off-Plateau Stations
All 230Th and 232Th concentration data can be found in Supplementary Table 1. 230Thxs concentrations in the samples range from 0.7 fg kg–1 (Station 18, 60 m) to 18.2 fg kg–1 (CTD6, 3579 m). These values are similar to other parts of the SO including the Weddell Sea (Rutgers van der Loeff and Berger, 1993), the Drake Passage (Venchiarutti et al., 2011), the Crozet Basin (Coppola et al., 2006) and particularly similar to a previous study in the KP (Venchiarutti et al., 2008).
All profiles indicate a somehow linear increase of 230Thxs concentration with depth (Figure 5). The “slope” of this increase seems to be different in the top 600 m of the water column, compared to the water column below this depth. Additionally, Stations 16 and 18 show a depletion of 230Thxs toward the bottom. Similar mixed features in 230Thxs concentration profiles have been observed in other oceanic settings in the Southern Atlantic (Moran et al., 2002; Deng et al., 2014), the Arctic (Trimble et al., 2004), and along the path of the ACC (Rutgers van der Loeff and Berger, 1993; Venchiarutti et al., 2011), including the KP (Venchiarutti et al., 2008).
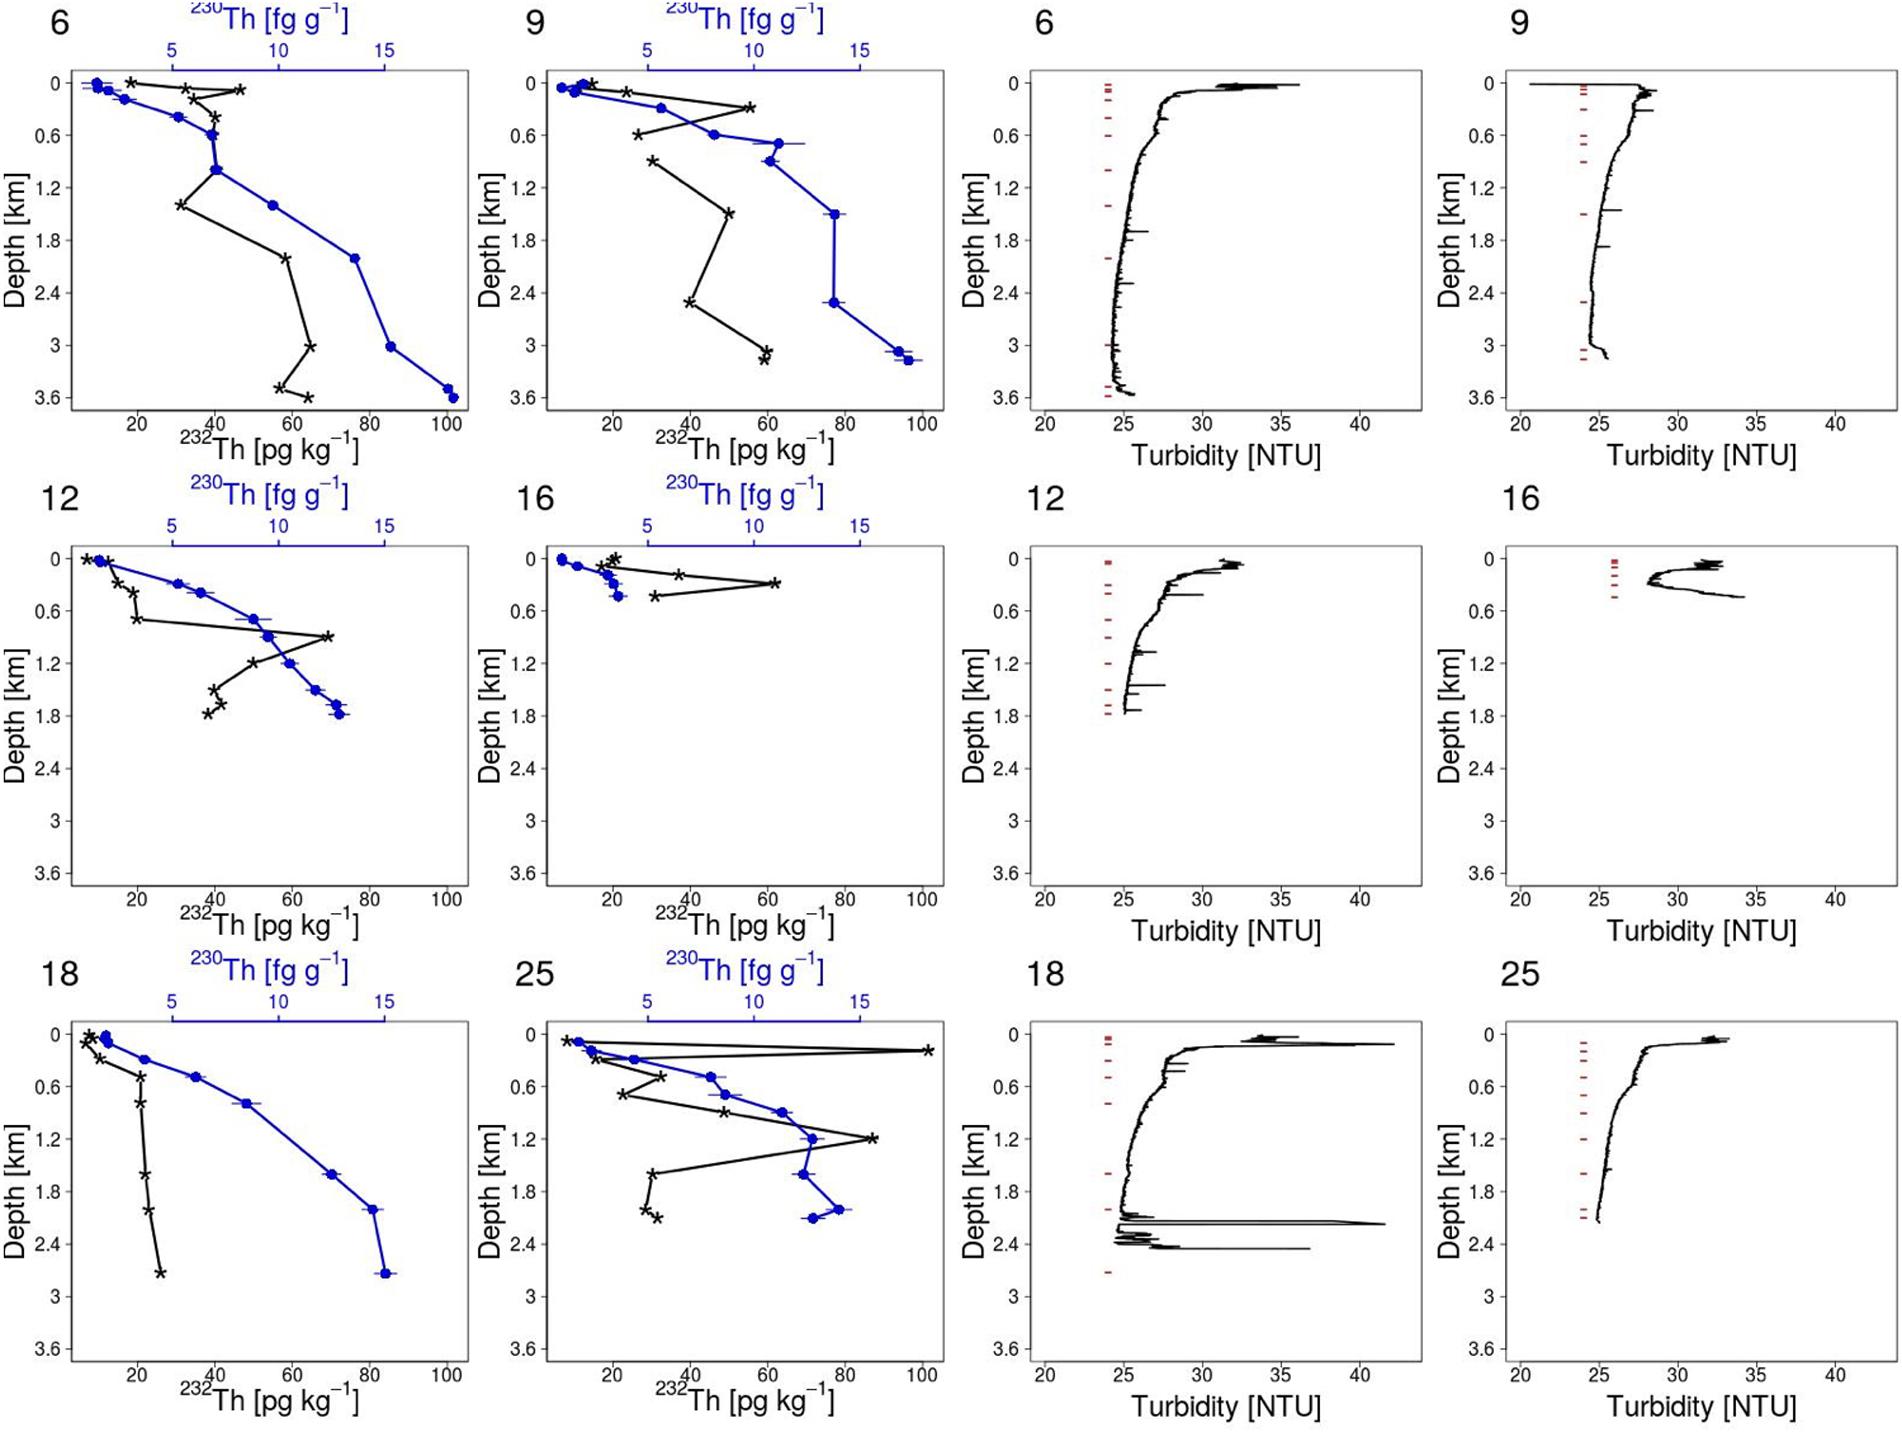
Figure 5. 232Th (stars) and 230Thxs (blue circles) concentration profiles for HEOBI stations in the left panel and on the right one the turbidity profiles at each station. Note that the deepest sample of each profile was collected ∼10 m above the bottom. Red lines on the right panel represent the depth at which Th samples were collected.
The dissolved 232Th concentrations range from 6.9 pg kg–1 (CTD12, 30 m) to 101 pg kg–1 (CTD25, 200 m). Most of our data is within the same order of magnitude of previous 232Th concentrations reported on the plateau by Venchiarutti et al. (2008). However, these authors report several samples with higher concentration that in some cases are as much as 4.5 times greater (450 pg kg–1) than the maximum values found in our study.
With the exception of Stations 18 and 12, all profiles show a spike in the 232Th concentration in the top 600 m of the water column. Below that depth, 232Th concentrations generally increase with depth, however some spikes stand out in all the stations (excepting Station 18; Figure 5). In particular, Station 25 shows two prominent peaks at 200 m (100 pg kg–1) and 1200 m (87 pg kg–1). Such concentrations could very easily be a result of contamination during sampling or analysis. However, the blank contribution at that station remained low. Therefore, and because of the higher concentrations previously reported for the plateau (Venchiarutti et al., 2008), we prefer not to exclude those measurements.
Near-Island Shallow Stations
The 232Th and 230Th concentrations in samples collected close to Heard (Stations 30, 31) and McDonald (Stations 22, 34) Islands (Figure 2) are similar regardless of location or depth [average of 87.5 ± 13 pg kg–1 (1-σ; Table 1)]. These concentrations are amongst the highest of our data set and can be compared with 232Th concentrations found near Heard Island during the KEOPS 1 expedition (84–273 pg kg–1; Venchiarutti et al., 2008). 230Thxs concentrations average 2.7 ± 1.2 fg kg–1 (1-σ) (Table 1). These concentrations are higher than those reported in the previously mentioned study around HIMI (0.5–1.35 fg kg–1). In particular, the 230Th concentration of Station 30 at 75 m (5.4 fg kg–1) is unusually high for that depth compared to previous studies in the region (Coppola et al., 2006; Venchiarutti et al., 2008).
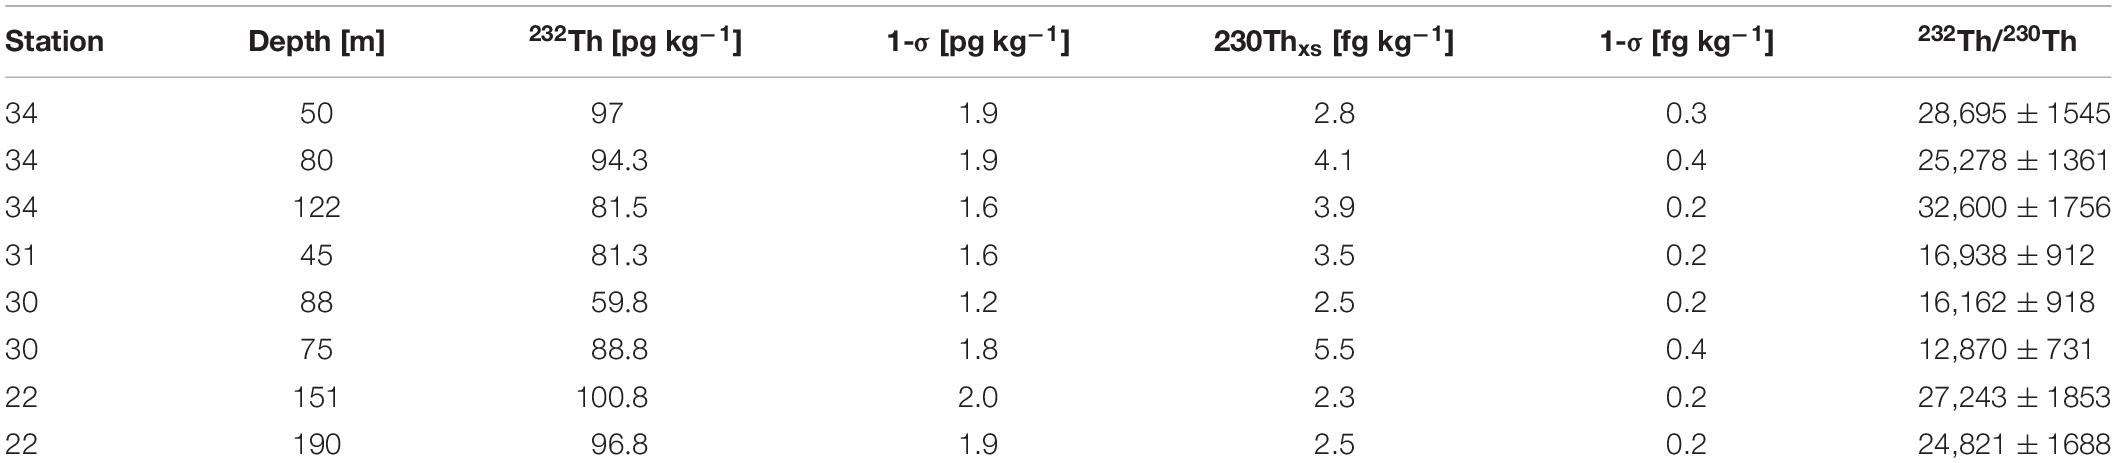
Table 1. 232Th, 230Thxs, and 232Th/230Th ratio in the near-island stations 22, 30, 31, and 34.
232Th/230Th Ratios
The highest 232Th/230Th ratios were found near HIMI (Table 1 and Figure 6), with a maximum value of 32,600 found in Station 34 at the boundary between the WW and the AASW (σθ = 27.15; 122 m depth), and the lowest value of 1,735 in the LCDW component of reference Station 18 (σθ = 27.8; 2,200 m depth). All stations show an increase of the 232Th/230Th ratio above the UCDW (σθ < 27.5; 600 m), except Station 18, which exhibits an almost uniform ratio with depth (Figure 6). In the UCDW and below, Stations 6 and 9 also display a uniform 232Th/230Th ratio. Additionally, stations 12 and 25 exhibit 232Th enrichments at 900 (σθ = 27.7) and 1,200 m (σθ = 27.8), respectively. The samples collected around McDonald Island present a higher 232Th/230Th (24,821–32,600) ratio compared to the samples collected around Heard Island (12,870–16,938).
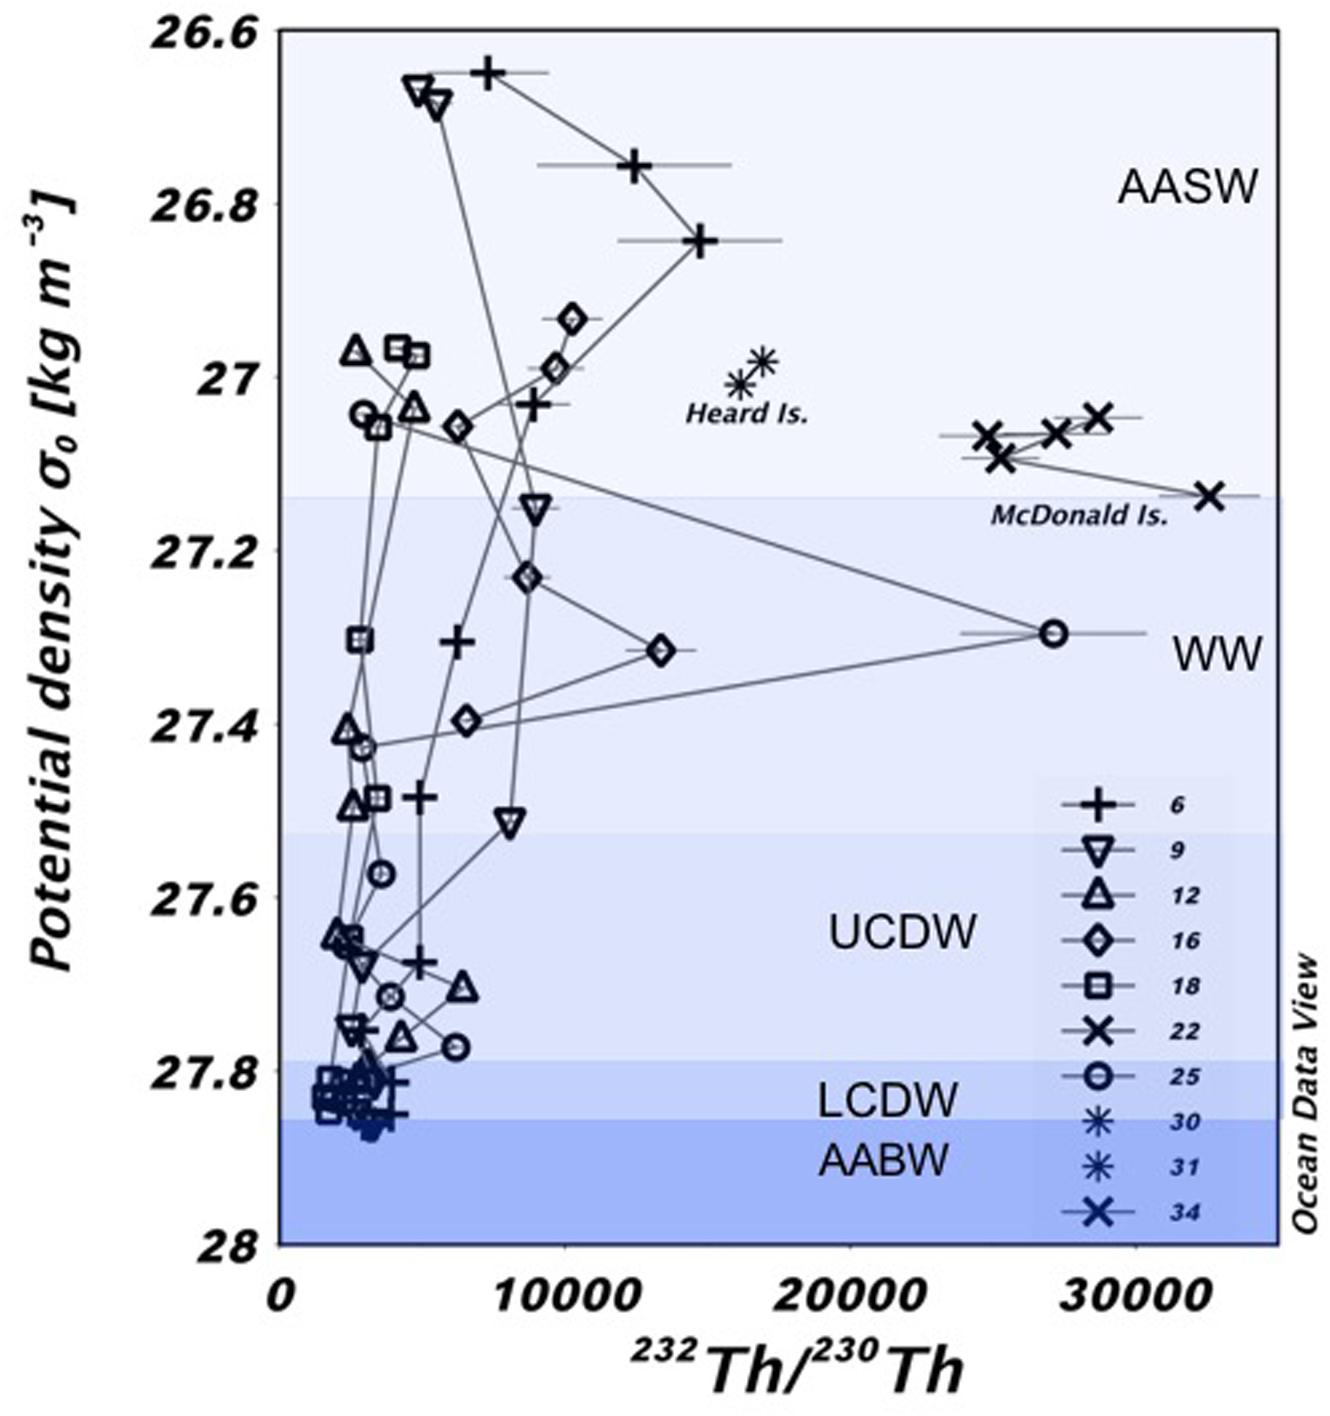
Figure 6. 232Th/230Th ratio plotted against potential density anomaly for the HEOBI samples. Different background shading indicates the different water masses present during the HEOBI sampling campaign. The analytical standard error of many of the samples are smaller than the symbol. Note that the bottom sample of each station was collected ∼10 m above the seafloor.
Discussion
232Th Enrichments Above the Plateau and the Role of Circulation
Lithogenic material from the plateau allows the development of productivity once the light is no longer limiting in the region. Supplied by the direct subaerial erosion of the islands, glacial input (subglacial and fluvial discharge) and the resuspension of continental shelf sediments, this material releases 232Th, Fe and other trace elements (Figure 7). Because 232Th is only supplied to the ocean by the dissolution of lithogenic material, an increase in the 232Th concentration can be indicative of the supply from the Kerguelen Plateau. The spikes in the 232Th concentration near the surface of Stations 6, 9, and 25 can be associated with the direct dissolution of particles, introduced in the surface and transported downward. This is somehow confirmed by the turbidity data (Figure 5, right panel) that indicate the highest particle loads toward the surface. However, in Stations 9, 12 and 25, mid-depth spikes in the 232Th concentration cannot be explained by the direct dissolution of lithogenic material because there are not increased turbidity values at those particular depths, therefore this 232Th must have been laterally advected from other parts of the plateau. Surprisingly, only Stations 16 and 18 present a nepheloid layer. This layer is reflected in a depletion in 230Th concentration in the deepest samples of those stations due to enhanced scavenging by particles resuspended from the bottom. However, these particles do not seem to be a source of dissolved 232Th, very likely because of their low reactivity.
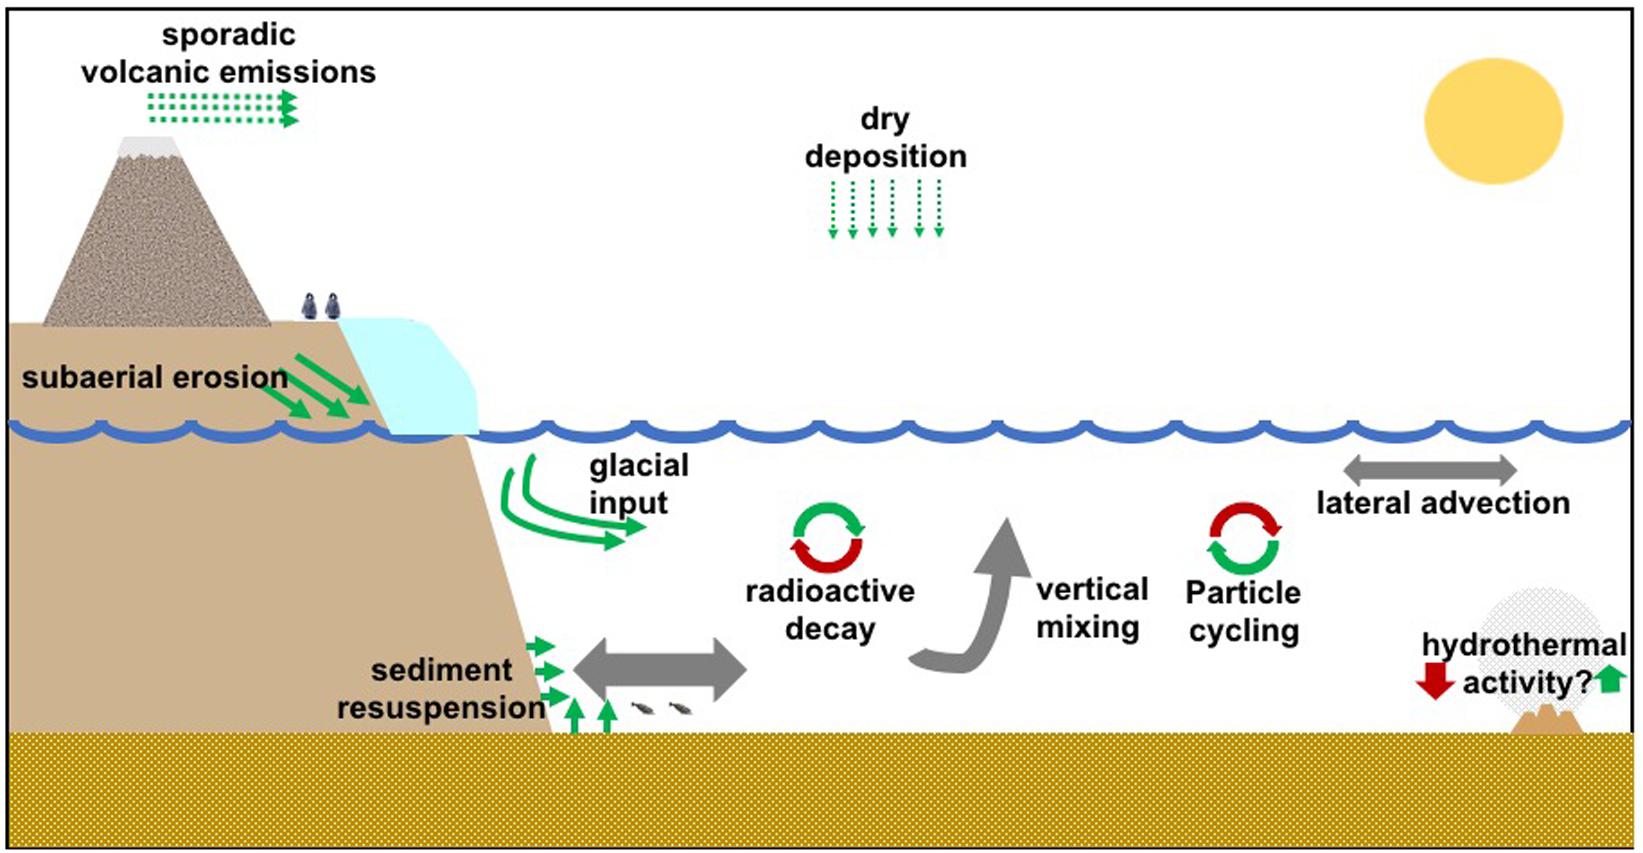
Figure 7. Possible sources (green arrows), sinks (red arrows), and transport vectors (gray arrows) of thorium isotopes and other trace elements to the waters of the Kerguelen Plateau.
The 232Th/230Th ratio can therefore be used to track supply of lithogenic material to the ocean because 232Th is released only by the dissolution of lithogenic material (in a similar way as Fe). Under open-ocean conditions, it might be expected that the 232Th/230Th ratio would decrease with increasing depth. Such behavior can be seen at Station 18 (Figure 6, squares) where the 232Th/230Th goes from 4800 ± 396 near the surface (σθ = 27; 65 m) to 1731 ± 65 near the bottom (σθ = 27.8; 2,725 m). A similar pattern can be seen in Station 6 below 100 m (σθ = 26.8), where the 232Th/230Th ratio is 14,743 ± 2876, and decreases with depth to 3,288 ± 20 (σθ = 27.9; 3,576 m). These findings, allow us to establish Station 18 as a reference site of oceanic conditions. In contrast, the rest of the stations show (to different extents) 232Th enrichments to the AASW and WW components of the water column (σθ < 27.5; depth < 300 m). These enrichments are the “fingerprint” of the lithogenic material from the KP. As expected, this imprint is more intense for the stations located near HIMI because they provide a constant input of lithogenic material which supplies 232Th but not 230Th, resulting in the highest 232Th/230Th ratios. The highest of which are found near Stations 22 (24,821–27,243) and 34 (25,278–32,600), located close to McDonald Island. Near Heard Island, Stations 30 (12,870–16,162) and 31 (16,938), also show elevated 232Th/230Th ratios, although not as high as near McDonald Island. This difference can be explained because of the different content of 232Th in basalts from McDonald (28 ± 19 ppm) and Heard (5 ± 2 ppm) islands respectively (J. Fox, personal communication).
Once the lithogenic material supplied by the islands enters the ocean, it releases dissolved 232Th, Fe and other trace elements. These dissolved elements as well as some lithogenic particles can be transported away from the islands via local circulation enabling a downstream development of productivity. In fact, the historical position of both branches of the bloom that occurs above the KP (Figure 1, green areas) match with the main trajectories of the circulation of the PF and the topography-controlled circulation in the northern and central parts of the plateau.
Considering 232Th/230Th as a fingerprint of lithogenic input and that most of the lithogenic material is supplied to surface waters, a gradient in 232Th enrichment would be expected, being stronger near the source and decreasing as the signal is transported away. Zhang et al. (2008) confirmed, through the use of rare earth elements (REE), the recent dissolution of basaltic material close to the Kerguelen Archipelago (KA) and HIMI, and suggested that this material is transported by the predominant circulation patterns in the northern and central parts of the KP, respectively (Figure 1). Neodymium isotopic composition (εNd) data further proved this transport from the KA to the stations located north of the Polar Front (Grenier et al., 2018), and our own εNd and REE data also confirms that the material supplied close to HIMI is transported northwards, all the way to the southern edge of the Polar Front (Pérez-Tribouillier et al., unpublished).
Our Th data over the plateau lacks the spatial distribution necessary to accurately track the possible pathways of surface/subsurface circulation. However, some patterns do exist in the 232Th/230Th distribution that seem to confirm the importance of the HIMI for the natural fertilization of the waters north and to the east of these islands (Figure 8). Specifically, the near-surface 232Th/230Th ratio is highest near HIMI (22,259 ± 6600, n = 8). In the middle of the plateau at Station 16 this value decreases to 10,262 ± 1042. Considering the predominant northwards circulation in this part of the plateau (Figure 1, Park et al., 2008b), this lower 232Th/230Th value at Station 16 could very well be attributed to a dilution of the HIMI signal. This hypothesis is supported by the low 232Th/230Th ratio (4141 ± 341) at Station 18. This station is located before the circulation turns west toward HIMI and therefore at this point, seawater has not yet received any lithogenic material from the plateau. After the current passes next to HIMI, it travels north toward Station 16 at a speed of ∼2.6 km day–1 (Park et al., 2008b), a component turns east and reaches Station 9 where the value decreases to 4853 ± 500. The enrichment at Station 12 is even smaller (2,683 ± 240). We hypothesize that this low value is associated with the western boundary current that flows along the eastern flank of the plateau and flushes away 232Th from Station 12. The surface enrichment at Station 6 (7,300 ± 200) is higher than at station 9, even though Station 6 is further away from the plateau. In this region however, the circulation from the central KP converges with the flow of the PF, plausibly driving an increase in surface 232Th/230Th ratios. More detailed sampling above the central part of the plateau, especially between HIMI and Station 16 would have been useful to better constrain the circulation over the plateau using the 232Th/230Th signal.
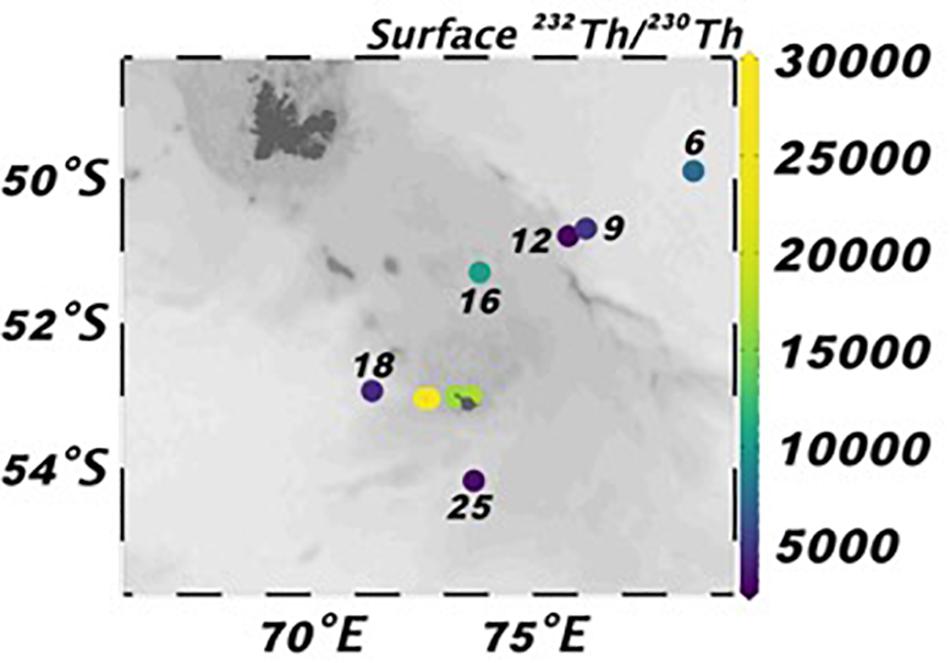
Figure 8. Spatial distribution of the surface 232Th/230Th ratio over the plateau.
Th-Scavenging Removal Residence Time in Surface Waters of the Kerguelen Plateau
The calculation of 232Th fluxes requires information about its removal rate from the dissolved fraction of seawater. This residence time can be obtained from the less abundant isotopes 228Th, 230Th, and 234Th and the disequilibria from their parent nuclides, making two assumptions: (1) considering a steady state, and (2) by neglecting physical transport.
The short lived 234Th isotope (t1/2 = 24.1 days) is routinely used to estimate the export of particulate organic carbon from the surface of the ocean (Buesseler et al., 1992; Cochran et al., 2000). 230Th has also been used to calculate surface residence times (Luo et al., 1995; Hsieh et al., 2011; Hayes et al., 2013; Deng et al., 2014; Lopez et al., 2015). However, differences have been found in the surface scavenging residence times obtained through the use of both isotopes. In the Equatorial Pacific, Luo et al. (1995) found significantly higher 230Th residence times (RT230) in the euphotic zone, compared to the ones obtained with 234Th and 228Th data. This was attributed to the longer half-life of 230Th, which allows for “pre-formed” 230Th to be transported from deeper waters to the surface through water mixing processes, thereby violating one of the basic assumptions of this method, and producing an over-estimation of its scavenging residence time. Hayes et al. (2013) also emphasize the possible impact of vertical mixing to surface scavenging residence times calculated with 230Th data in the Pacific, however, these authors did not have 234Th data available for comparison. In the tropical and subtropical regions of the Atlantic Ocean, 234Th and 230Th residence time estimates for the top 25 m of the water column seem to be in more agreement (Hsieh et al., 2011). However, some discrepancies remain in the equator and higher latitudes, that again, could be very well-explained by the upwelling of 230Th.
In several sectors of the Southern Ocean, including the Kerguelen Plateau, the assumption of no vertical transport could be severely violated, as upwelling of Circumpolar Deep Waters, with high 230Th content, has been previously observed (Rutgers van der Loeff and Berger, 1993; Walter et al., 2000; Chase et al., 2003; Venchiarutti et al., 2008, 2011; Rutgers van der Loeff et al., 2016; Roy-Barman et al., 2019). Therefore, it is necessary to investigate the extent to which vertical mixing can produce an overestimation in the 230Th-estimated surface residence time over the KP. Rosso et al. (2014) noted that over the shallow areas of the KP, vertical velocities are weak and that the water-motion is dominated mainly by the horizontal component, and it is only on the eastern flank of the plateau where the vertical motion becomes very strong.
As a starting point to constrain the vertical input of 230Th, we estimate the vertical advective supply of 230Th by multiplying its concentration at 100 m (or the nearest sample available) by the upwelling velocities reported over (0.5 m day–1) and on the eastern (5 m day–1) flank of the plateau respectively (Rosso et al., 2014). Additionally, we calculate the supply of 230Th through vertical diffusive mixing by multiplying the dissolved 230Th concentration gradient at ∼100 m by the vertical mixing coefficient for the plateau (Kv = 35 m2 day–1; Park et al., 2008a). Using these parameters, we estimate that at Station 16 vertical mixing and upwelling above 100 m could supply an amount of 230Th equivalent to up 50% of the production rate of 230Th, which could lead to an overestimation of 230RT by a factor of 1.5. In Stations 6, 9 and 12, located on the eastern flank of the plateau, and in an area that Rosso et al. (2014) suggests having strong vertical velocities, upwelling itself can produce an overestimation of 230RT by a factor of 4 to 10 times.
Another way of investigating the effect of upwelling on the 230RT is by comparing it with the residence time obtained with 234Th (234RT), as its shorter half-life makes it less susceptible to the impact of deep upwelling (Luo et al., 1995). To do so, we have applied Equation 4 to the 234Th data obtained during the KEOPS 1 voyage (Savoye et al., 2008). Although the samples were not collected in the same year or from exactly the same location, we consider that both datasets were collected close enough and during the same season making a comparison valid (Figure 2). For a comparison of the residence time in the shallow areas of the plateau (<500 m) we compare Station 16 (HEOBI) to Stations B1 and B5 (KEOPS 1). To compare the residence time on the eastern flank of the plateau, Stations 6, 9, and 12 (HEOBI) are compared to Stations B11 and C11 (KEOPS 1).
The residence time at 100 m obtained with both Th isotopes is almost identical over shallow areas of the plateau (Table 2), confirming the almost neglectable effect of vertical mixing in this area as suggested by Rosso et al. (2014). Surprisingly, in Stations 6, 9 and 12 the 230RT is, at most, 1.5 times higher than 234RT. This minor difference between the Th isotopes can be attributed to upwelling, although it is clear that it is not nearly as intense as the 10 times overestimation predicted for this area using the advection parameters. Alternatively, the difference in 230RT and 234RT in this area could also reflect different conditions at the time of sampling given that the data are from different years and locations. The use of multiple Th tracers, coupled with an accurate understanding of the physical oceanographic setting of the area, is necessary to fully constrain the scavenging residence time of Th in regions susceptible to deep upwelling.
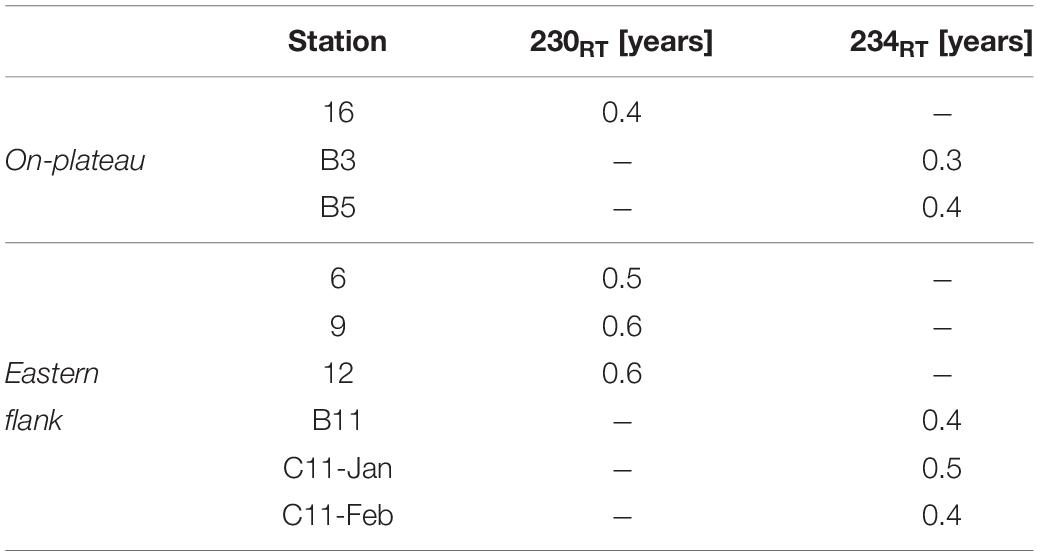
Table 2. Comparison between residence times obtained above 100 m using 230Th (this study) and 234Th (Savoye et al., 2008) data from stations located on-plateau and on the eastern flank of the Kerguelen Plateau.
With increasing depth, the 230RT increases gradually reflecting the long-term process of 230Th adsorption and desorption from particles through its path down the water column (Figure 9A; Nozaki et al., 1981; Anderson et al., 1983; Nozaki and Nakanishi, 1985). In particular, 230RT in the mixed layer is less than a year at all stations (Table 3). At 500 m the 230RT reaches more than a year for all stations with the exception of Station 16 at 430 m where it is slightly lower (0.9 years) due to enhanced scavenging of 230Th by sediments resuspended from the bottom (Figure 5, right panel).
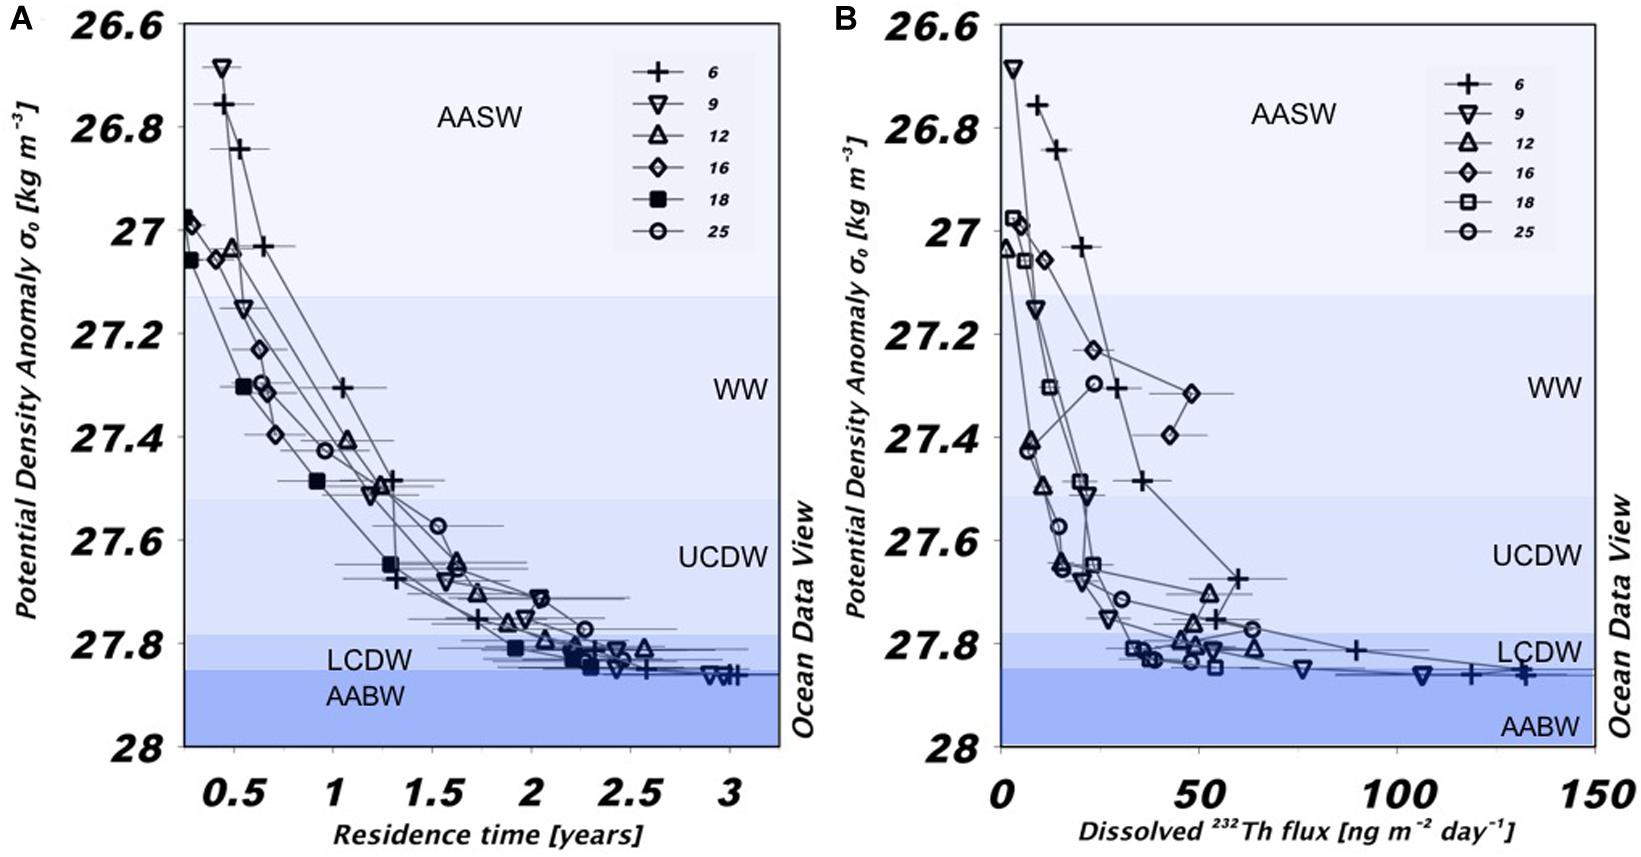
Figure 9. Estimated scavenging residence time (A) and 232Th flux (B) for the HEOBI stations. Error was propagated considering all parameters used for the calculation and represents around 25%. The deepest sample of each station was collected ∼10 m above the seafloor.
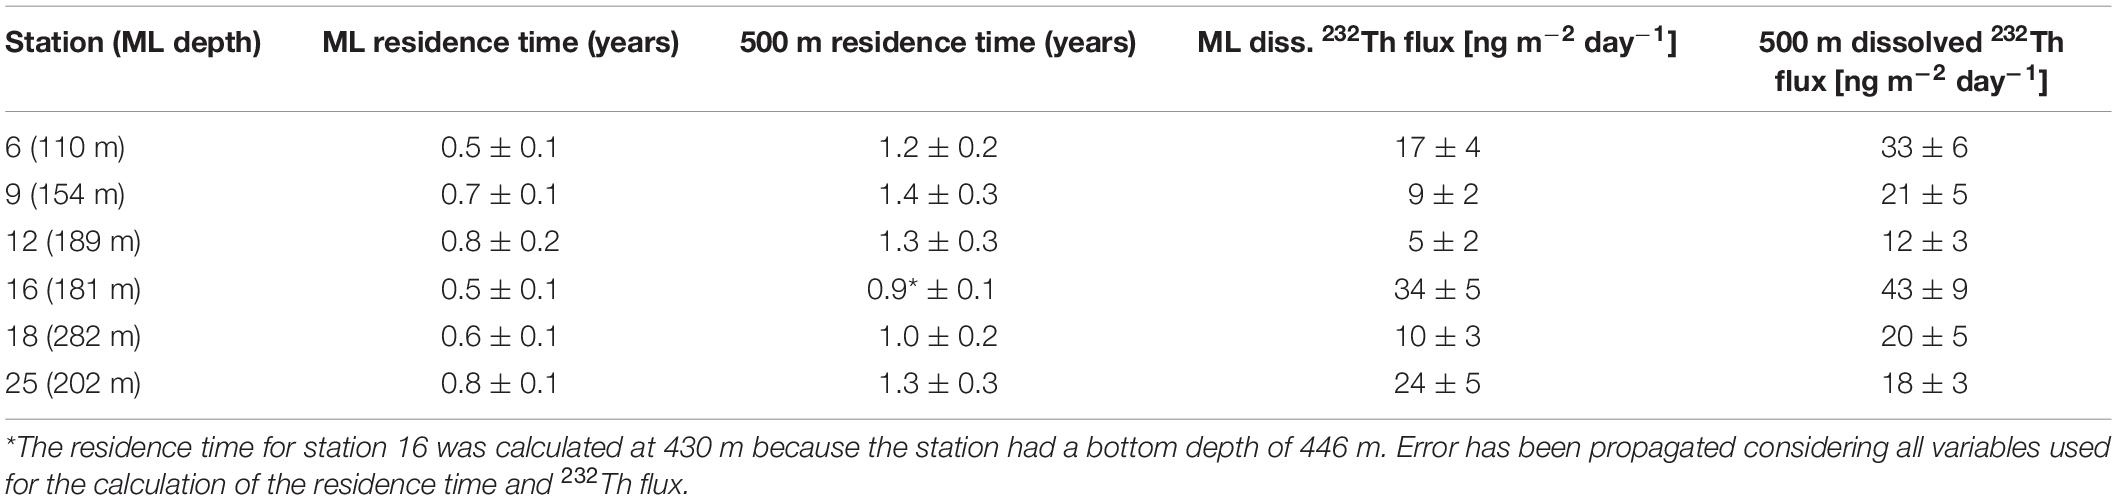
Table 3. Comparison between residence time and 232Th fluxes in the mixed layer (ML) depth and at 500 m during the HEOBI voyage.
The mixed layer 230RT values are comparable to those found in the North Pacific (0.7–1.2 years; Hayes et al., 2013), but shorter than residence times calculated from samples collected from the Atlantic Ocean (1.2–2.5 years; Hsieh et al., 2011; Deng et al., 2014). This difference is expected because the Atlantic studies were conducted in a more open oceanic environment with low biological productivity and away from direct sources of particles other than the deposition of aeolian dust. In contrast, the sampled areas of the North Pacific and the KP are closer to particle sources including a larger supply of lithogenic particles to the water column, increasing scavenging rates and shortening 230RT. However, at 500 m the 230RT for the KP is considerably shorter than for the Pacific at the same depth (3.3–6.4 years; Hayes et al., 2013) and the Atlantic at 250 m (3.5–6.4 years; Deng et al., 2014). This difference arises very likely because of the shallow bathymetry over the plateau (<500 m) and its interaction with the ACC that generates a dynamic coastal environment, with a continuous supply and resuspension of particles. This larger particle load over the plateau increases scavenging rates, thus shortening residence times.
Thorium-Derived Lithogenic Fluxes to the Kerguelen Plateau
To obtain an estimation of the flux of lithogenic material using dissolved Th-isotopes it is first necessary to convert 232Th concentrations into a dissolved flux using the residence time calculated in the previous section. For this, dissolved 232Th concentrations were integrated from the surface to an integration depth and divided by the corresponding 230RT (Figure 9B; Eq. 5). Selecting an integration depth at which the lithogenic inputs can be effectively quantified has been a subject of discussion. Previous studies aimed mostly to quantify the flux of trace metals originating from the dissolution of mineral dust, therefore Hsieh et al. (2011) integrated only to 25 m, where most of the dust dissolution is expected to occur. However, Hayes et al. (2017) suggests that integration should be done at least to the base of the euphotic zone (50–200 m) in order to capture the effect of Th cycling in the upper layers of the ocean, which is a complex process regulated by particle aggregation, passive sinking and active transport by zooplankton. Furthermore, integrating even deeper (250–500 m), might also account for dissolved Th regeneration below the euphotic zone (Hayes et al., 2017).
In the KP, we expect a source of 232Th (and Fe) at the ocean surface, from glacial and fluvial runoff. However, given the KP is a “shallow” area (<500 m), plateau-deposited sediments might become an extra source. If 232Th is supplied to the surface, it would be expected for the 232Th flux to be higher at the surface, and if no sub-surface source exists, this flux should remain constant with deeper integration. However, in all stations sampled on the KP (except Station 25), we observe an increase in the 232Th flux from the mixed layer toward 500 m (Table 3), and in general all the way to the bottom. Such an increase in the 232Th flux with depth has been observed in all of the previous studies where this technique has been applied (Hsieh et al., 2011; Hayes et al., 2013, 2015, 2017; Deng et al., 2014; Lopez et al., 2015; Anderson et al., 2016), and its cause is still not completely understood. Two main hypotheses have been suggested: (1) different chemical speciation between 230Th and 232Th that lead to difference in their scavenging rates (Hayes et al., 2013), and (2) irreversible scavenging of both isotopes in the euphotic zone that causes a downward export of Th out of this zone (Hayes et al., 2017). These authors made an important contribution toward explaining the reason for the increase of the 232Th flux with depth, as they were able to reject the first theory for the Atlantic and the North Pacific and pointed at the second hypothesis as the most likely cause. Therefore, we opt to use an integration depth of 500 m to estimate the lithogenic flux to the plateau, in order to capture all the sub-surface Th cycling and concentration spikes observed in most of the stations. In Station 25, the flux at the base of the mixed layer (202 m; 23 ng m–2 day–1) is higher than at 100 m (12 ng m–2 day–1) and 500 m (18 ng m–2 day–1). This elevated value is due to the spike in the 232Th concentration at this depth (Figure 5), which as we mentioned in the results section could be due to sample contamination, or possibly a shelf-derived sub-surface source of lithogenic material, although turbidity data suggests it’s not a local source (Figure 5).
The 232Th fluxes (Figure 9B) can now be converted to lithogenic-material fluxes with knowledge about the composition of the material and its Th fractional solubility (Eq. 5). In other words, this flux of lithogenic material is required to sustain the calculated dissolved 232Th fluxes and therefore measured concentrations of 232Th. Previous studies dedicated to quantifying the input of dust to the ocean have used the average 232Th concentration for the upper continental crust that can range from 10.5 to 14.6 ppm (Taylor and McLennan, 1985; Rudnick and Gao, 2013; Serno et al., 2014). The lithogenic material from the volcanic KP province has a lower 232Th content than average continental crust (5.4 ± 1.5 ppm; Duncan et al., 2016; Fox, 2019, personal communication). Therefore, we use this value for the calculations of the lithogenic flux in our area of study.
The largest source of uncertainty in the calculation of lithogenic fluxes is the solubility of 232Th from particles, which is a highly unconstrained parameter, especially for volcanic-derived material. From the few studies that report 232Th solubility in marine particles, highly variable values were found, ranging from 1 to 23%, depending on the particle size and depth (Arraes-Mescoff et al., 2001; Roy-Barman et al., 2002). When using a Th solubility of 1% we obtain fluxes of lithogenic material that range from 144 to 810 mg m–2 day–1 in the top 500 m of the water column, while the values range from 7 to 39 mg m–2 day–1 when using a Th solubility from particles of 20% (Table 4).
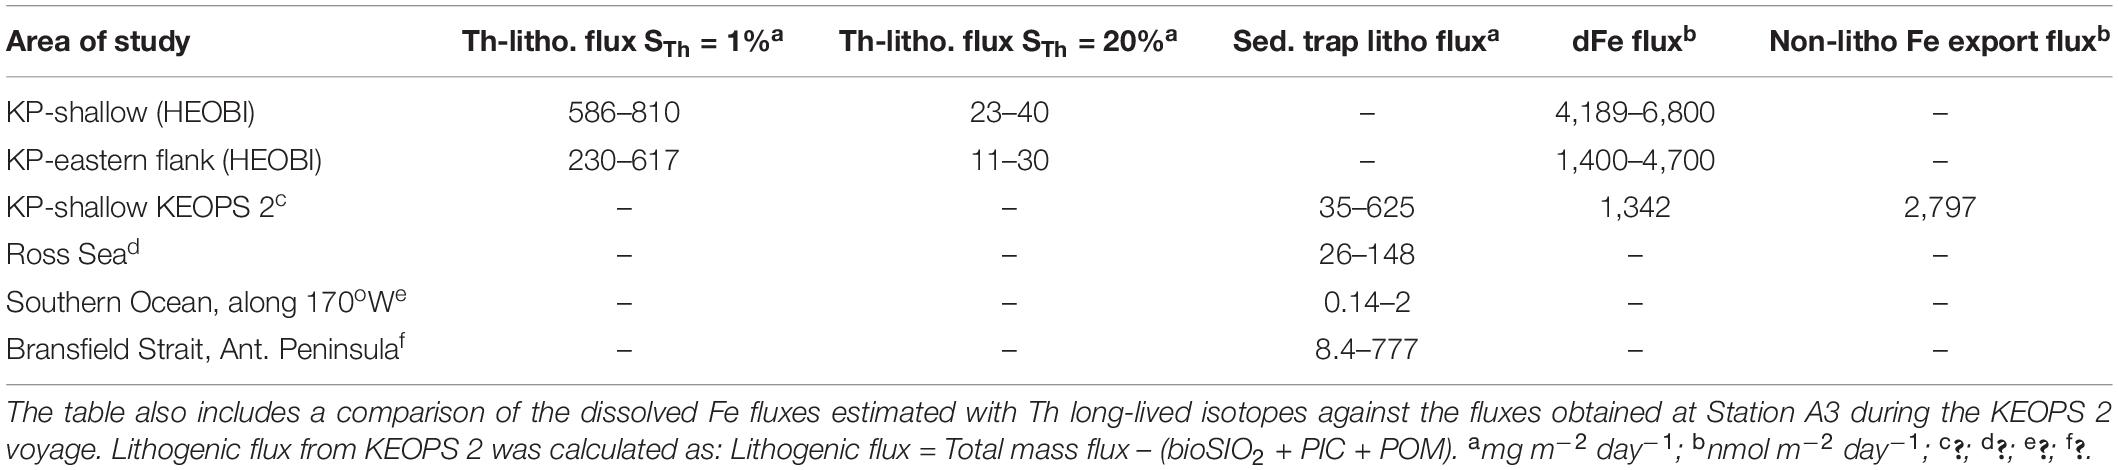
Table 4. Comparison of the Th-derived lithogenic and dissolved Fe fluxes to those reported in the literature.
The dissolved thorium based lithogenic flux estimates for the KP are much higher than sediment-trap based estimates reported in a transect along the Southwest sector of the Pacific Ocean (Honjo et al., 2000). This difference is consistent with the oceanic setting of the transect in the Pacific Ocean at 170 W, distant from any significant lithogenic source. Our calculated lithogenic fluxes are however comparable to sediment-trap obtained fluxes reported for more “coastal” parts of the Southern Ocean like the Ross Sea (Chiarini et al., 2019) and the Bransfield Strait (Wefer et al., 1988). Furthermore, all of our Th-derived lithogenic fluxes fall within the range reported for the KP using drifting sediment traps (Table 4; Bowie et al., 2015). Lithogenic material flux calculation using thorium isotopes for coastal areas seems to be promising and once the Th solubility in the plateau is better constrained, the uncertainties will be reduced.
Quantification of Fe Fluxes to the Plateau
In a similar manner to the previous section, 232Th fluxes can be used to derive fluxes of dissolved Fe and other trace elements from lithogenic material. For this, information about the metal concentration in lithogenic particles and their solubility relative to that of 232Th is required (Eq. 7). Unfortunately, the solubility of trace elements with respect to 232Th has so far not been reported. However, it has been suggested that over time, relatively insoluble elements (such as Th and Fe) tend to present a similar solubility (Hayes et al., 2013). Therefore, we can expect that Fe and 232Th should have similar solubilities (Fe/232Th ≈ 1), however it’s necessary to mention that the residence time of Fe in the region is still not completely constrained. Making this assumption and considering an average Fe/232Th ratio of lithogenic material over the shallow areas of the plateau of 16,400 g g–1 (Duncan et al., 2016; Fox, 2019, personal communication), we obtain dissolved Fe fluxes at the base of the mixed layer at stations located over the KP that range from 4,200 to 6,800 nmol m–2 day–1. Such amount of Fe is higher than the estimates produced from the dissolution of natural mineral dust in the Northern Pacific Ocean (245–736 nmol m–2 day–1; Hayes et al., 2013). This is because of the higher flux of lithogenic particles in our area of study, and increased content of Fe in the basalts from the KP.
This dissolved Fe supply from the dissolution of lithogenic material can be compared to Bowie et al. (2015)’s estimate of the dissolved Fe supply to the mixed layer at station A3 (Figure 1), sampled during the KEOPS 2 voyage (Table 4). They estimate a dissolved Fe supply of 1,342 nmol m–2 day–1, from total vertical and lateral advective supply (1,292 nmol m–2 day–1), and atmospheric soluble deposition (50 nmol m–2 day–1). It becomes evident that the estimates of our study are more than three times larger than the previously estimated supply of dissolved Fe above the plateau. Furthermore, Bowie et al. (2015) noted that at station A3, on the plateau (relatively close to our station 16), the export of particulate non-lithogenic Fe from the mixed layer (2,797 nmol m–2 day–1) exceeded the estimated supply of dissolved Fe (1,342 nmol m–2 day–1). This suggests the scavenging and biological removal of Fe from the mixed layer is greater than the rate of supply of dissolved Fe. Hence, there must be at least one source of Fe that has not been taken into account. The same authors and Chever et al. (2010) noted that this extra source is very likely from lithogenic particulate Fe, derived from either the Kerguelen plateau or the HIMI region, that might be converted into dissolved and bio-available Fe. This hypothesis is supported by recent findings of van der Merwe et al. (2019), who claimed that high-lability Fe particles sourced from glacial erosion from Heard Island might be this missing source of iron. Our dissolved Fe estimations, obtained independently through the use of Th isotopes, support this claim as our larger estimate is very likely reflecting the dissolution of Fe from these highly labile particles. Furthermore, our dissolved Fe supply flux estimates are very similar to the total downward particulate Fe export flux (5,746 nmol m–2 day–1) reported by Bowie et al. (2015). Although both terms are not directly comparable, our estimates might help to close the iron budget of the KP, implicating the dissolution of lithogenic particles from HIMI as a major source of dissolved Fe to this region.
Conclusion
The spatial distribution of 232Th concentrations near the surface of the plateau clearly indicate that Heard and McDonald Islands contribute to the supply of lithogenic material that fuels the phytoplankton bloom in the central KP during the summer. We applied long-lived Th isotopes to produce an estimation of the fluxes of lithogenic material and Fe in the KP. We demonstrate the potential of long-lived Th isotopes to produce this type of information not only from the dissolution of aeolian dust to the open ocean, like other studies have shown, but also from the input of lithogenic sources to coastal areas. The similarity of our results with those obtained using sediment traps in the SO suggests that measuring Th isotopes can be an alternative approach to obtain this type of information, and can also provide greater spatial detail than sediment traps. However, some limitations arise due to the lack of information about the solubility of Th. Systematic studies about these parameters in particles of different origin and composition will improve the results produced by this approach. Nevertheless, our results help to close the iron budget in this region, and confirm that the release of iron from the dissolution of lithogenic particles is a key source of soluble iron to support biological activity on the KP.
Data Availability Statement
All datasets generated for this study are included in the article/Supplementary Material.
Author Contributions
HP-T and ZC collected the samples. HP-T processed and analyzed the samples, interpreted the results and prepared the first version of the manuscript. ZC and TN contributed to the data interpretation and provided comments for the manuscript. AT and AB provided suggestions to the final version of the manuscript. AT supported the analysis on the SF-ICP-MS.
Funding
This work was supported by the following grants: Australian Research Council Discovery (DP150100345 and DP180102357), Australian Research Council LIEF (LF0989539), the Australian Antarctic Science Program (AAS4338) and the Australian Research Council Special Research Initiative for Antarctic Gateway Partnership (Project ID SR140300001). This research was supported by the Science and Industry Endowment Fund.
Conflict of Interest
The authors declare that the research was conducted in the absence of any commercial or financial relationships that could be construed as a potential conflict of interest.
Acknowledgments
We are very grateful for the invaluable contributions from the reviewers which helped to greatly improve this article. We also thank the CSIRO Marine National Facility (MNF) for ship time support on the RV Investigator voyage IN2016_V01 (HEOBI). We thank the captain, crew, support personnel, data managers, and chief scientist Mike Coffin for their excellent help. We also thank Tom Trull, Pier van Der Merwe, and Jodi Fox for their comments and ideas during the HEOBI discussion meetings, and to IMAS trace metal lab manager Pam Quayle for her logistic support.
Supplementary Material
The Supplementary Material for this article can be found online at: https://www.frontiersin.org/articles/10.3389/fmars.2020.00207/full#supplementary-material
Footnotes
References
Andersen, M. B., Stirling, C. H., Zimmermann, B., and Halliday, A. N. (2010). Precise determination of the open ocean 234 U/238 U composition. Geochem. Geophys. Geosyst. 11. doi: 10.1029/2010GC003318
Anderson, R. F., Bacon, M. P., and Brewer, P. G. (1983). Removal of 230Th and 231Pa from the open ocean. Earth Planet. Sci. Lett. 62, 7–23. doi: 10.1016/0012-821X(83)90067-5
Anderson, R. F., Cheng, H., Edwards, R. L., Fleisher, M. Q., Hayes, C. T., Huang, K.-F., et al. (2016). How well can we quantify dust deposition to the ocean? Philos. Trans. R. Soc. A Math. Phys. Eng. Sci. 374:20150285. doi: 10.1098/rsta.2015.0285
Anderson, R. F., Fleisher, M. Q., Robinson, L. F., Edwards, R. L., Hoff, J. A., Moran, S. B., et al. (2012). GEOTRACES intercalibration of 230Th, 232Th, 231Pa, and prospects for 10Be. Limnol. Oceanogr. Methods 10, 179–213. doi: 10.4319/lom.2012.10.179
Arraes-Mescoff, R., Roy-Barman, M., Coppola, L., Souhaut, M., Tachikawa, K., Jeandel, C., et al. (2001). The behavior of Al, Mn, Ba, Sr, REE and Th isotopes during in vitro degradation of large marine particles. Mar. Chem. 73, 1–19. doi: 10.1016/S0304-4203(00)00065-7
Beaman, R. J., and O’Brien, P. E. (2011). Kerguelen Plateau Bathymetric Grid, November 2010. Record 2011/22. Geosci. Aust. Canberra Aust. 18.
Blain, S., Quéguiner, B., Armand, L., Belviso, S., Bombled, B., Bopp, L., et al. (2007). Effect of natural iron fertilization on carbon sequestration in the Southern Ocean. Nature 446, 1070–1074. doi: 10.1038/nature05700
Blain, S., Quéguiner, B., and Trull, T. (2008a). The natural iron fertilization experiment KEOPS (KErguelen Ocean and Plateau compared Study): an overview. Deep Sea Res. Part II Top. Stud. Oceanogr. 55, 559–565. doi: 10.1016/j.dsr2.2008.01.002
Blain, S., Sarthou, G., and Laan, P. (2008b). Distribution of dissolved iron during the natural iron-fertilization experiment KEOPS (Kerguelen Plateau, Southern Ocean). Deep Sea Res. Part II Top. Stud. Oceanogr. 55, 594–605. doi: 10.1016/j.dsr2.2007.12.028
Blain, S., Tréguer, P., Belviso, S., Bucciarelli, E., Denis, M., Desabre, S., et al. (2001). A biogeochemical study of the island mass effect in the context of the iron hypothesis: Kerguelen Islands, Southern Ocean. Deep Sea Res. Part I Oceanogr. Res. Pap. 48, 163–187. doi: 10.1016/S0967-0637(00)00047-9
Bopp, L., Aumont, O., Belviso, S., and Blain, S. (2008). Modelling the effect of iron fertilization on dimethylsulphide emissions in the Southern Ocean. Deep Sea Res. Part II Top. Stud. Oceanogr. 55, 901–912. doi: 10.1016/j.dsr2.2007.12.002
Bowie, A. R., van der Merwe, P., Quéroué, F., Trull, T., Fourquez, M., Planchon, F., et al. (2015). Iron budgets for three distinct biogeochemical sites around the Kerguelen Archipelago (Southern Ocean) during the natural fertilisation study, KEOPS-2. Biogeosciences 12, 4421–4445. doi: 10.5194/bg-12-4421-2015
Bown, J., Boye, M., Laan, P., Bowie, A. R., Park, Y.-H., Jeandel, C., et al. (2012). Imprint of a dissolved cobalt basaltic source on the Kerguelen Plateau. Biogeosciences 9, 5279–5290. doi: 10.5194/bg-9-5279-2012
Boyd, P. W., and Ellwood, M. J. (2010). The biogeochemical cycle of iron in the ocean. Nat. Geosci. 3, 675–682. doi: 10.1038/ngeo964
Boyd, P. W., Jickells, T., Law, C. S., Blain, S., Boyle, E. A., Buesseler, K. O., et al. (2007). Mesoscale iron enrichment experiments 1993-2005: synthesis and future directions. Science 315, 612–617. doi: 10.1126/science.1131669
Broecker, W. S., Kaufman, A., and Trier, R. M. (1973). The residence time of thorium in surface sea water and its implications regarding the rate of reactive pollutants. Earth Planet. Sci. Lett. 20, 35–44. doi: 10.1016/0012-821X(73)90137-4
Buesseler, K. O., Bacon, M. P., Kirk Cochran, J., and Livingston, H. D. (1992). Carbon and nitrogen export during the JGOFS North Atlantic bloom experiment estimated from 234Th: 238U disequilibria. Deep Sea Res. Part A. Oceanogr. Res. Pap. 39, 1115–1137. doi: 10.1016/0198-0149(92)90060-7
Chase, Z., Anderson, R. F., Fleisher, M. Q., and Kubik, P. W. (2003). Scavenging of 230Th, 231Pa and 10Be in the Southern Ocean (SW Pacific sector): the importance of particle flux, particle composition and advection. Deep Res. Part II Top. Stud. Oceanogr. 50, 739–768. doi: 10.1016/S0967-0645(02)00593-3
Chever, F., Sarthou, G., Bucciarelli, E., Blain, S., and Bowie, A. R. (2010). An iron budget during the natural iron fertilisation experiment KEOPS (Kerguelen Islands, Southern Ocean). Biogeosciences 7, 455–468. doi: 10.5194/bg-7-455-2010
Chiarini, F., Ravaioli, M., and Capotondi, L. (2019). Interannual variability of vertical particle fluxes in the Ross Sea (Antarctica). Nat. Conserv. 34, 417–440. doi: 10.3897/natureconservation.34.30732
Cochran, J. K., Buesseler, K. O., Bacon, M. P., Wang, H. W., Hirschberg, D. J., Ball, L., et al. (2000). Short-lived thorium isotopes (234Th, 228Th) as indicators of POC export and particle cycling in the Ross Sea, Southern Ocean. Deep Sea Res. Part II Top. Stud. Oceanogr. 47, 3451–3490. doi: 10.1016/S0967-0645(00)00075-8
Coppola, L., Roy-Barman, M., Mulsow, S., Povinec, P., and Jeandel, C. (2006). Thorium isotopes as tracers of particles dynamics and deep water circulation in the Indian sector of the Southern Ocean (ANTARES IV). Mar. Chem. 100, 299–313. doi: 10.1016/j.marchem.2005.10.019
Costa, K., and McManus, J. (2017). Efficacy of 230Th normalization in sediments from the Juan de Fuca Ridge, northeast Pacific Ocean. Geochim. Cosmochim. Acta 197, 215–225. doi: 10.1016/j.gca.2016.10.034
Deng, F., Thomas, A. L., Rijkenberg, M. J. A., and Henderson, G. M. (2014). Controls on seawater 231Pa, 230Th and 232Th concentrations along the flow paths of deep waters in the Southwest Atlantic. Earth Planet. Sci. Lett. 390, 93–102. doi: 10.1016/j.epsl.2013.12.038
Duncan, R. A., Falloon, T. J., Quilty, P. G., and Coffin, M. F. (2016). Widespread Neogene volcanism on Central Kerguelen Plateau, Southern Indian Ocean. Aust. J. Earth Sci. 63, 379–392. doi: 10.1080/08120099.2016.1221857
Francois, R., Bacon, M. P., and Suman, D. O. (1990). Thorium 230 profiling in deep-sea sediments: high-resolution records of flux and dissolution of carbonate in the equatorial Atlantic during the last 24,000 years. Paleoceanography 5, 761–787. doi: 10.1029/PA005i005p00761
Francois, R., Frank, M., Rutgers van der Loeff, M. M., and Bacon, M. P. (2004). 230Th normalization: an essential tool for interpreting sedimentary fluxes during the late Quaternary. Paleoceanography 19. doi: 10.1029/2003PA000939
Fung, I. Y., Meyn, S. K., Tegen, I., Doney, S. C., John, J. G., and Bishop, J. K. B. (2000). Iron supply and demand in the upper ocean. Glob. Biogeochem. Cycles 14, 281–295. doi: 10.1029/1999GB900059
Grenier, M., Garcia-Solsona, E., Lemaitre, N., Trull, T. W., Bouvier, V., Nonnotte, P., et al. (2018). Differentiating lithogenic supplies, water mass transport, and biological processes on and off the kerguelen plateau using rare earth element concentrations and neodymium isotopic compositions. Front. Mar. Sci. 5:426. doi: 10.3389/fmars.2018.00426
Hayes, C. T., Anderson, R. F., Fleisher, M. Q., Serno, S., Winckler, G., and Gersonde, R. (2013). Quantifying lithogenic inputs to the North Pacific Ocean using the long-lived thorium isotopes. Earth Planet. Sci. Lett. 383, 16–25. doi: 10.1016/j.epsl.2013.09.025
Hayes, C. T., Black, E. E., Anderson, R. F., Baskaran, M., Buesseler, K. O., Charette, M. A., et al. (2018). Flux of particulate elements in the north atlantic ocean constrained by multiple radionuclides. Glob. Biogeochem. Cycles 32, 1738–1758. doi: 10.1029/2018GB005994
Hayes, C. T., Fitzsimmons, J. N., Boyle, E. A., McGee, D., Anderson, R. F., Weisend, R., et al. (2015). Thorium isotopes tracing the iron cycle at the Hawaii Ocean time-series station ALOHA. Geochim. Cosmochim. Acta 169, 1–16. doi: 10.1016/j.gca.2015.07.019
Hayes, C. T., Rosen, J., McGee, D., and Boyle, E. A. (2017). Thorium distributions in high- and low-dust regions and the significance for iron supply. Glob. Biogeochem. Cycles 31, 1–20. doi: 10.1002/2016GB005511
Holmes, T. M., Wuttig, K., Chase, Z., van der Merwe, P., Townsend, A. T., Schallenberg, C., et al. (2019). Iron availability influences nutrient drawdown in the Heard and McDonald Islands region, Southern Ocean. Mar. Chem. 211, 1–14. doi: 10.1016/j.marchem.2019.03.002
Honjo, S., Francois, R., Manganini, S., Dymond, J., and Collier, R. (2000). Particle fluxes to the interior of the Southern Ocean in the Western Pacific sector along 170°W. Deep Sea Res. Part II Top. Stud. Oceanogr. 47, 3521–3548. doi: 10.1016/S0967-0645(00)00077-1
Hsieh, Y., Henderson, G. M., and Thomas, A. L. (2011). Combining seawater 232Th and 230Th concentrations to determine dust fluxes to the surface ocean. Earth Planet. Sci. Lett. 312, 280–290. doi: 10.1016/j.epsl.2011.10.022
Jacquet, S. H. M., Dehairs, F., Savoye, N., Obernosterer, I., Christaki, U., Monnin, C., et al. (2008). Mesopelagic organic carbon remineralization in the Kerguelen Plateau region tracked by biogenic particulate Ba. Deep Sea Res. Part II Top. Stud. Oceanogr. 55, 868–879. doi: 10.1016/j.dsr2.2007.12.038
Jickells, T. D. (2005). Global iron connections between desert dust, ocean biogeochemistry, and climate. Science 308, 67–71. doi: 10.1126/science.1105959
Jouandet, M. P., Blain, S., Metzl, N., Brunet, C., Trull, T. W., and Obernosterer, I. (2008). A seasonal carbon budget for a naturally iron-fertilized bloom over the Kerguelen Plateau in the Southern Ocean. Deep Sea Res. Part II Top. Stud. Oceanogr. 55, 856–867. doi: 10.1016/j.dsr2.2007.12.037
Krishnaswami, S., and Cochran, J. K. (2011). U-Th Series Nuclides in Aquatic Systems. Amsterdam: Elsevier.
Krishnaswami, S., and Cochran, J. K. (2008). Radioactivity in the Environment. Amsterdam: Elsevier, 1–10.
Lopez, G. I., Marcantonio, F., Lyle, M., and Lynch-Stieglitz, J. (2015). Dissolved and particulate 230Th-232Th in the Central Equatorial Pacific Ocean: evidence for far-field transport of the East Pacific Rise hydrothermal plume. Earth Planet. Sci. Lett. 431, 87–95. doi: 10.1016/j.epsl.2015.09.019
Luo, S., Ku, T. L., Kusakabe, M., Bishop, J. K. B., and Yang, Y. L. (1995). Tracing particle cycling in the upper ocean with 230Th and 228Th: an investigation in the equatorial Pacific along 140°W. Deep Res. Part II 42, 805–829. doi: 10.1016/0967-0645(95)00019-M
Luo, Y. (2017). Reinterpretation of oceanic 230Th profiles based on decadal export productivity (2003–2010). Sci. Rep. 7:505. doi: 10.1038/s41598-017-00604-y
Mahowald, N., Engelstaedter, S., and Luo, C. (2009). Atmospheric iron deposition: global distribution, variability, and human perturbations. Annu. Rev. Mar. Sci. 1, 245–278. doi: 10.1146/annurev.marine.010908.163727
Martin, J. H. (1990). Glacial-interglacial CO2 change: the iron hypothesis. Paleoceanography 5, 1–13. doi: 10.1029/PA005i001p00001
Mongin, M., Molina, E., and Trull, T. W. (2008). Seasonality and scale of the Kerguelen plateau phytoplankton bloom: a remote sensing and modeling analysis of the influence of natural iron fertilization in the Southern Ocean. Deep Sea Res. Part II Top. Stud. Oceanogr. 55, 880–892. doi: 10.1016/j.dsr2.2007.12.039
Moore, C. M., Mills, M. M., Arrigo, K. R., Berman-Frank, I., Bopp, L., Boyd, P. W., et al. (2013). Processes and patterns of oceanic nutrient limitation. Nat. Geosci. 6, 701–710. doi: 10.1038/ngeo1765
Moran, S. B., Shen, C.-C., Edmonds, H. N., Weinstein, S. E., Smith, J. N., and Edwards, R. L. (2002). Dissolved and particulate 231Pa and 230Th in the Atlantic Ocean: constraints on intermediate/deep water age, boundary scavenging, and 231Pa/230Th fractionation. Earth Planet. Sci. Lett. 203, 999–1014. doi: 10.1016/S0012-821X(02)00928-7
Morris, P. J., and Charette, M. A. (2013). A synthesis of upper ocean carbon and dissolved iron budgets for Southern Ocean natural iron fertilisation studies. Deep Res. Part II Top. Stud. Oceanogr. 90, 147–157. doi: 10.1016/j.dsr2.2013.02.001
Mosseri, J., Quéguiner, B., Armand, L., and Cornet-Barthaux, V. (2008). Impact of iron on silicon utilization by diatoms in the Southern Ocean: a case study of Si/N cycle decoupling in a naturally iron-enriched area. Deep Sea Res. Part II Top. Stud. Oceanogr. 55, 801–819. doi: 10.1016/j.dsr2.2007.12.003
Nozaki, Y., Horibe, Y., and Tsubota, H. (1981). The water column distributions of thorium isotopes in the western North Pacific. Earth Planet. Sci. Lett. 54, 203–216. doi: 10.1016/0012-821X(81)90004-2
Nozaki, Y., and Nakanishi, T. (1985). 231Pa and 230Th profiles in the open ocean water column. Deep Sea Res. Part A. Oceanogr. Res. Pap. 32, 1209–1220. doi: 10.1016/0198-0149(85)90004-4
Owens, S. A., Buesseler, K. O., and Sims, K. W. W. (2011). Re-evaluating the 238U-salinity relationship in seawater: implications for the 238U-234Th disequilibrium method. Mar. Chem. 127, 31–39. doi: 10.1016/j.marchem.2011.07.005
Park, Y., and Vivier, F. (2011). Circulation and hydrography over the Kerguelen Plateau. Kerguelen Plateau Mar. Ecosyst. Fish. 35, 43–55.
Park, Y.-H., Charriaud, E., and Fieux, M. (1998). Thermohaline structure of the Antarctic surface water/winter water in the Indian sector of the Southern Ocean. J. Mar. Syst. 17, 5–23. doi: 10.1016/S0924-7963(98)00026-8
Park, Y.-H., Durand, I., Kestenare, E., Rougier, G., Zhou, M., D’Ovidio, F., et al. (2014). Polar front around the Kerguelen Islands: an up-to-date determination and associated circulation of surface/subsurface waters. J. Geophys. Res. Ocean. 119, 6575–6592. doi: 10.1002/2014JC010061
Park, Y.-H., Fuda, J.-L., Durand, I., and Naveira Garabato, A. C. (2008a). Internal tides and vertical mixing over the Kerguelen Plateau. Deep Sea Res. Part II Top. Stud. Oceanogr. 55, 582–593. doi: 10.1016/j.dsr2.2007.12.027
Park, Y.-H., Roquet, F., Durand, I., and Fuda, J.-L. (2008b). Large-scale circulation over and around the Northern Kerguelen Plateau. Deep Sea Res. Part II Top. Stud. Oceanogr. 55, 566–581. doi: 10.1016/j.dsr2.2007.12.030
Pérez-Tribouillier, H., Noble, T. L., Townsend, A. T., Bowie, A. R., and Chase, Z. (2019). Pre-concentration of thorium and neodymium isotopes using Nobias chelating resin: method development and application to chromatographic separation. Talanta 202, 600–609. doi: 10.1016/j.talanta.2019.03.086
Planchon, F., Ballas, D., Cavagna, A.-J., Bowie, A. R., Davies, D., Trull, T., et al. (2015). Carbon export in the naturally iron-fertilized Kerguelen area of the Southern Ocean based on the 234 Th approach. Biogeosciences 12, 3831–3848. doi: 10.5194/bg-12-3831-2015
Rosso, I., Hogg, A. M. C., Strutton, P. G., Kiss, A. E., Matear, R., Klocker, A., et al. (2014). Vertical transport in the ocean due to sub-mesoscale structures: impacts in the Kerguelen region. Ocean Model. 80, 10–23. doi: 10.1016/j.ocemod.2014.05.001
Roy-Barman, M., Coppola, L., and Souhaut, M. (2002). Thorium isotopes in the western Mediterranean Sea: an insight into the marine particle dynamics. Earth Planet. Sci. Lett. 196, 161–174. doi: 10.1016/S0012-821X(01)00606-9
Roy-Barman, M., Lemaître, C., Ayrault, S., Jeandel, C., Souhaut, M., and Miquel, J. C. (2009). The influence of particle composition on Thorium scavenging in the Mediterranean Sea. Earth Planet. Sci. Lett. 286, 526–534. doi: 10.1016/j.epsl.2009.07.018
Roy-Barman, M., Thil, F., Bordier, L., Dapoigny, A., Foliot, L., Ayrault, S., et al. (2019). Thorium isotopes in the Southeast Atlantic Ocean: tracking scavenging during water mass mixing along neutral density surfaces. Deep Res. Part I Oceanogr. Res. Pap. 149:103042. doi: 10.1016/j.dsr.2019.05.002
Rudnick, R., and Gao, S. (2013). Composition of the continental crust. Treatise Geochem. Second Ed. 4, 1–51. doi: 10.1016/B978-0-08-095975-7.00301-6
Rutgers van der Loeff, M., Venchiarutti, C., Stimac, I., van Ooijen, J., Huhn, O., Rohardt, G., et al. (2016). Meridional circulation across the Antarctic Circumpolar Current serves as a double 231Pa and 230Th trap. Earth Planet. Sci. Lett. 455, 73–84. doi: 10.1016/j.epsl.2016.07.027
Rutgers van der Loeff, M. M., and Berger, G. W. (1993). Scavenging of 230Th and 231Pa near the antarctic polar front in the South Atlantic. Deep Sea Res. Part I Oceanogr. Res. Pap. 40, 339–357. doi: 10.1016/0967-0637(93)90007-P
Sanial, V., van Beek, P., Lansard, B., Souhaut, M., Kestenare, E., Ovidio, F., et al. (2015). Use of Ra isotopes to deduce rapid transfer of sediment-derived inputs off Kerguelen. Biogeosciences 12, 1415–1430. doi: 10.5194/bg-12-1415-2015
Santschi, P. H., Murray, J. W., Baskaran, M., Benitez-Nelson, C. R., Guo, L. D., Hung, C.-C., et al. (2006). Thorium speciation in seawater. Mar. Chem. 100, 250–268. doi: 10.1016/j.marchem.2005.10.024
Sargent, M., Harte, R., and Harrington, C. (2002). Guidelines for Achieving High Accuracy in Isotope Dilution Mass Spectrometry (IDMS). Available online at: https://books.google.com/books?hl=es&lr=&id=9wwLS5pcD9sC&oi=fnd&pg=PA1&dq=guidelines+for+achieving+high+accuracy+in+isotope+dilution&ots=TI80X664yI&sig=-NVdYoYJtnc_SarNw4UVRm1L2jo
Sarthou, G., Baker, A. R., Kramer, J., Laan, P., Laës, A., Ussher, S., et al. (2007). Influence of atmospheric inputs on the iron distribution in the subtropical North-East Atlantic Ocean. Mar. Chem. 104, 186–202. doi: 10.1016/j.marchem.2006.11.004
Sarthou, G., Vincent, D., Christaki, U., Obernosterer, I., Timmermans, K. R., and Brussaard, C. P. D. (2008). The fate of biogenic iron during a phytoplankton bloom induced by natural fertilisation: impact of copepod grazing. Deep Sea Res. Part II Top. Stud. Oceanogr. 55, 734–751. doi: 10.1016/j.dsr2.2007.12.033
Savoye, N., Trull, T. W., Jacquet, S. H. M., Navez, J., and Dehairs, F. (2008). 234Th-based export fluxes during a natural iron fertilization experiment in the Southern Ocean (KEOPS). Deep Sea Res. Part II Top. Stud. Oceanogr. 55, 841–855. doi: 10.1016/j.dsr2.2007.12.036
Serno, S., Winckler, G., Anderson, R. F., Hayes, C. T., McGee, D., Machalett, B., et al. (2014). Eolian dust input to the Subarctic North Pacific. Earth Planet. Sci. Lett. 387, 252–263. doi: 10.1016/j.epsl.2013.11.008
Tagliabue, A., Bopp, L., and Aumont, O. (2009). Evaluating the importance of atmospheric and sedimentary iron sources to Southern Ocean biogeochemistry. Geophys. Res. Lett. 36:L13601. doi: 10.1029/2009GL038914
Tagliabue, A., Sallée, J.-B., Bowie, A. R., Lévy, M., Swart, S., and Boyd, P. W. (2014). Surface-water iron supplies in the Southern Ocean sustained by deep winter mixing. Nat. Geosci. 7, 314–320. doi: 10.1038/ngeo2101
Taylor, S. R., and McLennan, S. M. (1985). The Continental Crust: Its Composition and Evolution. Hoboken, NJ: Blackwell Scientific Publications.
Trimble, S. M., Baskaran, M., and Porcelli, D. (2004). Scavenging of thorium isotopes in the Canada Basin of the Arctic Ocean? Earth Planet. Sci. Lett. 222, 915–932. doi: 10.1016/j.epsl.2004.03.027
Tyrrell, T., Merico, A., Waniek, J. J., Wong, C. S., Metzl, N., and Whitney, F. (2005). Effect of seafloor depth on phytoplankton blooms in high-nitrate, low-chlorophyll (HNLC) regions. J. Geophys. Res. Biogeosci. 110. doi: 10.1029/2005JG000041
van Beek, P., Bourquin, M., Reyss, J.-L., Souhaut, M., Charette, M. A., and Jeandel, C. (2008). Radium isotopes to investigate the water mass pathways on the Kerguelen Plateau (Southern Ocean). Deep Sea Res. Part II Top. Stud. Oceanogr. 55, 622–637. doi: 10.1016/j.dsr2.2007.12.025
van der Merwe, P., Bowie, A. R., Quéroué, F., Armand, L., Blain, S., Chever, F., et al. (2015). Sourcing the iron in the naturally fertilised bloom around the Kerguelen Plateau: particulate trace metal dynamics. Biogeosciences 12, 739–755. doi: 10.5194/bg-12-739-2015
van der Merwe, P., Wuttig, K., Holmes, T., Trull, T. W., Chase, Z., Townsend, A. T., et al. (2019). High lability Fe particles sourced from glacial erosion can meet previously unaccounted biological demand: Heard Island, Southern Ocean. Front. Mar. Sci. 6:332. doi: 10.3389/fmars.2019.00332
Venchiarutti, C., Jeandel, C., and Roy-Barman, M. (2008). Particle dynamics study in the wake of Kerguelen Island using thorium isotopes. Deep Sea Res. Part I Oceanogr. Res. Pap. 55, 1343–1363. doi: 10.1016/j.dsr.2008.05.015
Venchiarutti, C., van der Loeff, M. R., and Stimac, I. (2011). Scavenging of 231Pa and thorium isotopes based on dissolved and size-fractionated particulate distributions at Drake Passage (ANTXXIV-3). Deep Res. Part II Top. Stud. Oceanogr. 58, 2767–2784. doi: 10.1016/j.dsr2.2010.10.040
Walter, H. J., Rutgers van der Loeff, M. M., Höltzen, H., and Bathmann, U. (2000). Reduced scavenging of 230Th in the Weddell Sea: implications for paleoceanographic reconstructions in the South Atlantic. Deep Sea Res. Part I Oceanogr. Res. Pap. 47, 1369–1387. doi: 10.1016/S0967-0637(99)00094-1
Wefer, G., Fischer, G., Füetterer, D., and Gersonde, R. (1988). Seasonal particle flux in the Bransfield Strait, Antartica. Deep Sea Res. Part A. Oceanogr. Res. Pap. 35, 891–898. doi: 10.1016/0198-0149(88)90066-0
Zhang, Y., Lacan, F., and Jeandel, C. (2008). Dissolved rare earth elements tracing lithogenic inputs over the Kerguelen Plateau (Southern Ocean). Deep Sea Res. Part II Top. Stud. Oceanogr. 55, 638–652. doi: 10.1016/j.dsr2.2007.12.029
Keywords: thorium, Southern Ocean, Kerguelen Plateau, lithogenic, natural fertilization, GEOTRACES
Citation: Pérez-Tribouillier H, Noble TL, Townsend AT, Bowie AR and Chase Z (2020) Quantifying Lithogenic Inputs to the Southern Ocean Using Long-Lived Thorium Isotopes. Front. Mar. Sci. 7:207. doi: 10.3389/fmars.2020.00207
Received: 28 November 2019; Accepted: 16 March 2020;
Published: 22 April 2020.
Edited by:
Benoit Thibodeau, The University of Hong Kong, Hong KongReviewed by:
Martin Frank, GEOMAR Helmholtz Center for Ocean Research Kiel, GermanyFrank Pavia, California Institute of Technology, United States
Copyright © 2020 Pérez-Tribouillier, Noble, Townsend, Bowie and Chase. This is an open-access article distributed under the terms of the Creative Commons Attribution License (CC BY). The use, distribution or reproduction in other forums is permitted, provided the original author(s) and the copyright owner(s) are credited and that the original publication in this journal is cited, in accordance with accepted academic practice. No use, distribution or reproduction is permitted which does not comply with these terms.
*Correspondence: Habacuc Pérez-Tribouillier, SGFiYWN1Yy5wZXJlenRyaWJvdWlsbGllckB1dGFzLmVkdS5hdQ==