 Loes J. A. Gerringa1
 Anne-Carlijn Alderkamp2,3
 Gert van Dijken2
 Patrick Laan1
 Rob Middag1*
 Kevin R. Arrigo2
- 1Royal Netherlands Institute for Sea Research (NIOZ), Department of Ocean Systems, Utrecht University, Texel, Netherlands
- 2Department of Earth System Science, Stanford University, Stanford, CA, United States
- 3Biology Department, Foothill College, Los Altos Hills, CA, United States
The dissolved (D) trace metals zinc (Zn), cadmium (Cd), cobalt (Co), copper (Cu), iron (Fe), manganese (Mn), nickel (Ni), titanium (Ti), lanthanum (La), yttrium (Y), and lead (Pb) were analyzed via ICPMS in samples from the Ross Sea obtained during a cruise between 20 December 2013 and 5 January 2014. The concentrations of DZn, DCd, DCo, DCu, DFe, DMn, DNi, and DTi were significantly lower in the Antarctic surface Water (AASW) compared to the other deeper water masses, indicating biological uptake and possibly scavenging. In the AASW, DLa and DY were higher than in Winter Water (WW). This can be explained by a spring source from ice melt followed by loss during summer and autumn, probably due to passive adsorption. Dissolved Pb was low (16 pM) and no distinction between water masses was possible. Akin to the macro-nutrients nitrate and silicate, the modified Circumpolar Deep Water (mCDW) shows elevated DCd compared to the shelf water masses. Sea ice melt and ice sheet melt released DZn, DFe, DMn, DNi, DY, DLa, and probably DPb into the Ross Sea. However, only DFe, DMn, DY and DLa are transported into the Antarctic Circumpolar Current with the outflowing High Salinity Shelf Water (HSSW). The bottom nepheloid layer (BNL) released DFe, as well as DMn and DCu, into the HSSW whereas lateral transport from land formed a source of DMn and DFe. One station in the Ross Sea Polynya was resampled after two weeks, during which time the thickness of the BNL increased, with accompanying increases in DFe and DMn near the seafloor. In the surface layer nutrients (including micro-nutrients) were depleted further. The uptake slopes/stoichiometric ratios of DZn, DCd and DCo versus phosphate indicated that the distribution of these metals is related to uptake as well as the composition of the phytoplankton community. Estimated stoichiometric ratios of Zn and Cd relative to P were higher at a station dominated by Phaeocystis antarctica than at diatom-dominated stations, implying a higher utilization of these metals by P. antarctica.
Introduction
The growth of Southern Ocean phytoplankton is primarily limited by low dissolved Fe (DFe) concentrations and availability of light, making the Southern Ocean the largest of the world’s high nutrient low chlorophyll areas (de Baar et al., 1990; Martin et al., 1990; Boyd et al., 2012). Polynyas, open waters amidst an ice-covered sea, are essential components of the Antarctic ecosystem since these are hotspots for primary productivity (Arrigo et al., 2015). Since phytoplankton comprises the base of the marine food web, the higher trophic levels depend on primary productivity within coastal polynyas. For example, in western Antarctica, 91% of all Adélie penguins are associated with productive coastal polynyas (Arrigo and Van Dijken, 2003). The Ross Sea Polynya is the most productive of the 46 Antarctic coastal polynyas that have been identified (Arrigo and Van Dijken, 2003; Arrigo et al., 2008, 2015) and is also a site of deep-water formation, resulting in significant CO2 drawdown and sequestration of carbon (Dunbar et al., 1998; Arrigo et al., 2008). In the Ross Sea Polynya, DFe is often the primary nutrient that is limiting to phytoplankton growth (Sedwick et al., 2000, 2015; Marsay et al., 2014; McGillicuddy et al., 2015; Hatta et al., 2017), even in early spring due to “early season depletion” (Sedwick et al., 2011). This early depletion was confirmed by additional shipboard DFe measurements made in the spring of 2013, with DFe in the upper mixed layer as low as 0.02–0.08 nM (Gerringa et al., 2015) when the polynya was still forming. Thus, phytoplankton depended on Fe from either internal cycling through remineralization of organic matter or from external sources. It has been established that apart from local sea ice melt at the margins of the polynya and lateral transport from land, upward fluxes from the sediment are the most important DFe source to surface waters of the Ross Sea (Marsay et al., 2014; Gerringa et al., 2015; Hatta et al., 2017).
Because Fe is the main limiting nutrient in the Ross Sea, this element has been studied extensively. However, other trace elements may play an important role in regulating rates of primary production as well as determining community composition (Bruland et al., 1991; Sunda and Huntsman, 2000; Arrigo et al., 2003; Bertrand et al., 2007; Hoppema et al., 2007; Twining and Baines, 2013; Saito et al., 2017; Alderkamp et al., 2019). For example, Wu et al. (2019) demonstrated that Mn was co-limiting with Fe in cultures of Phaeocystis antarctica from McMurdo Sound, a key member of the phytoplankton community in the Southern Ocean, indicating late-season Mn stress to be important for primary production in the Ross Sea, warranting further investigation.
The stoichiometric relationships between dissolved (D) metals [e.g., zinc (Zn), cadmium (Cd), cobalt (Co), copper (Cu) and nickel (Ni)] and macro-nutrients {e.g., nitrate (NO3–), silicate (Si(OH)4), and phosphate (PO43–)} indicate that their concentrations are regulated by phytoplankton uptake (de Baar, 1994; Löscher et al., 1998; Cullen and Sherrell, 2005; Cullen, 2006; Lai et al., 2008; Bruland et al., 2014; Dulaquais et al., 2014a; Wyatt et al., 2014; Saito et al., 2017; Till et al., 2017; Middag et al., 2018, 2019, 2020). For example, Zn is used for protein repair, in the enzyme alkaline phosphatase, and for the uptake of CO2 via the enzyme carbonic anhydrase (Morel et al., 1994; Buitenhuis et al., 1999; Hu et al., 2003; Shaked et al., 2006; Montsant et al., 2007). Low dissolved Zn concentrations can influence phytoplankton growth as illustrated by deformities in the shells of Emiliania huxleyi under Zn limitation (Crawford et al., 2003; Schulz et al., 2004). Cd also has a nutrient-type concentration profile and a tight relationship with the macro-nutrient PO43–, but Cd is not considered an essential element for phytoplankton growth. However, it can replace Zn in carbonic anhydrase for some, but not all, phytoplankton species (de Baar et al., 1994; Lee and Morel, 1995; Sunda and Huntsman, 2000; Timmermans et al., 2001; Hendry et al., 2008). Although Cu, Co, and manganese (Mn) do not show typical nutrient-type profiles, they are essential micro-nutrients for phytoplankton growth. Enzymes based on the metal pairs Fe-Mn and Cu-Zn are required to protect the cell interior from damage by reactive oxygen species (De Baar and La Roche, 2003). Diatoms are known to be limited by low DCu, although as far as we know, this has not been encountered outside culture experiments (Morel and Price, 2003; Guo et al., 2012; Morel et al., 2014). Co is necessary for the biosynthesis of vitamin B12 by cyanobacteria and can, like Cd, substitute for Zn in carbonic anhydrase (Sunda and Huntsman, 1995; Rodionov et al., 2003; Zheng et al., 2019). The Ross Sea is prone to B12 limitation because there are no cyanobacterial populations (Caron et al., 2000; Marchant, 2005), although Bertrand et al. (2007) have shown that heterotrophic bacteria in the Ross Sea are able to produce B12. Thus, it is possible that low DCo limits the production of vitamin B12 (Gordon and Sullivan, 2008). The micro-nutrient Ni is usually not depleted in the surface ocean (Butler et al., 2013; Middag et al., 2020) and Morel et al. (2014) suggested this could be caused by slow uptake mechanisms.
Little is known in Antarctic waters about effects of trace metals other than DFe (Arrigo et al., 2003; Alderkamp et al., 2019) on phytoplankton species distribution (Saito and Goepfert, 2008). However, in temperate and warmer waters, Zn addition stimulates growth of the coccolithophore E. huxleyi and Co and Ni stimulate Synechococcus and other cyanobacteria (Crawford et al., 2003; Saito et al., 2005; Dupont et al., 2008; Sunda, 2012). Despite the difference between temperate and high latitude systems, trace metals are likely to impact species composition in a similar way in Antarctic environments.
The metals Cu, Co, Fe, and Mn have a so-called hybrid type depth distribution, since the concentrations in the upper water column often increase with depth and, depending on their susceptibility to scavenging, decrease with depth deeper in the water column (Bruland et al., 2014). Oxidation and precipitation or co-precipitation can play a role in regulating trace metal concentrations here too, notably for Co and Mn (Middag et al., 2012; Sherrell et al., 2015; Noble et al., 2017; Saito et al., 2017).
Surface sources of these metals to the Southern Ocean consist of atmospheric input (Landing and Bruland, 1980; Baker et al., 2006; de Jong et al., 2013), ice and glacial melt (Frache et al., 2001; Lannuzel et al., 2014), while remineralization of organic matter, such as fecal pellets, can be an important process of retaining metals in the surface layer (Hendry et al., 2008; Saito et al., 2010; Croot et al., 2011; Wyatt et al., 2014; Laglera et al., 2017; Vance et al., 2017). Gerringa et al. (2012) concluded that the Pine Island Glacier formed the most important supply of DFe for the phytoplankton blooms in the Pine Island Polynya. However, the contribution of the glacial melt was overestimated due to an error in the computation of the horizontal flux gradient contributing to the biological uptake (Gerringa et al., 2020). Taking the distance over which the flux gradients were calculated into account, the contribution of the glacial melt is of the same order of magnitude as upwelling, sea ice melt and vertical transport from the sediment, which counted for approximately 10% of the assumed phytoplankton consumption. In retrospect, it appears that regeneration of Fe is vital to sustain the phytoplankton bloom within the Pine Island Polynya.
The deeper sources include lateral fluxes from continental shelves and coasts (Fitzwater et al., 2000; de Jong et al., 2012; Sherrell et al., 2015; Noble et al., 2017), vertical fluxes from the sediment, especially for Fe, Mn, Cu, and Co (Fitzwater et al., 2000; Blain et al., 2007; Dulaquais et al., 2014b; Sherrell et al., 2015), and hydrothermal input for Fe and Mn (Klunder et al., 2011; Middag et al., 2012). In contrast to other oceans, DMn concentrations are relatively low and especially depleted at the surface in the Southern Ocean (Martin et al., 1990; Westerlund and Öhman, 1991; Sedwick et al., 1997; Middag et al., 2013) and there are indications that Mn can be a (co-limiting) factor for phytoplankton growth in the Southern Ocean (e.g., Middag et al., 2013; Browning et al., 2014; Wu et al., 2019).
The metals titanium (Ti), lanthanum (La), yttrium (Y), and lead (Pb) have, as far as we know, no function in phytoplankton metabolism (Nozaki, 2001; De Baar and La Roche, 2003; Dammshäuser et al., 2011; Parker et al., 2016), but nevertheless, the dissolved concentrations are low in the surface layer and increase with depth, with the exception of Pb. Ti can enter the ocean by dust or lateral transport from terrestrial input and is used as a tracer for Patagonian dust input in Antarctic waters, as it is particle reactive and has a relatively short ocean residence time (Skabral, 2006; Dammshäuser et al., 2011). Over much of the global ocean, Pb concentrations used to be high in the surface oceans due to leaded automobile fuel emissions. In Antarctic waters, the decrease in Pb pollution resulting from use of lead-free fuels is not as noticeable due to residual Pb stored in glacial ice and released upon melt (McConnell et al., 2014; Ndungu et al., 2016). Dissolved Y and La have nutrient-type depth profiles (De Baar et al., 1985; Parker et al., 2016) although DLa hardly increases with depth since it is probably more susceptible to scavenging (Parker et al., 2016). This difference might be due to the smaller size of Y, probably causing it to be more strongly complexed with organic ligands and therefore less susceptible to scavenging compared to La (Shannon, 1976; Nozaki, 2001; Parker et al., 2016). Rivers and dust are known sources for both elements (Till et al., 2017), however, these sources play a minor role in the Southern Ocean.
Here we present the first densely sampled transects for a suite of trace metals (Zn, Cd, Co, Cu, Fe, Mn, Ni, Ti, La, Y, and Pb) from the surface to the bottom in the central Ross Sea. Data were collected during NBP13-10 (Phantastic 1) between 20 December 2013 and 5 January 2014, from two north-south transects and one east-west transect (Figure 1), mostly within the Ross Sea Polynya. Data for DFe concentrations from the present cruise have already been published, although analyzed with a different technique (Flow Injection Analysis, Gerringa et al., 2015) than discussed in this paper. Therefore, DFe is treated here briefly, only focusing on similarities and differences with other metals. We show relationships of trace metals with macro-nutrients and discuss sources and sinks of the metals to unravel the interactions between the marine ecosystem and metal cycling.
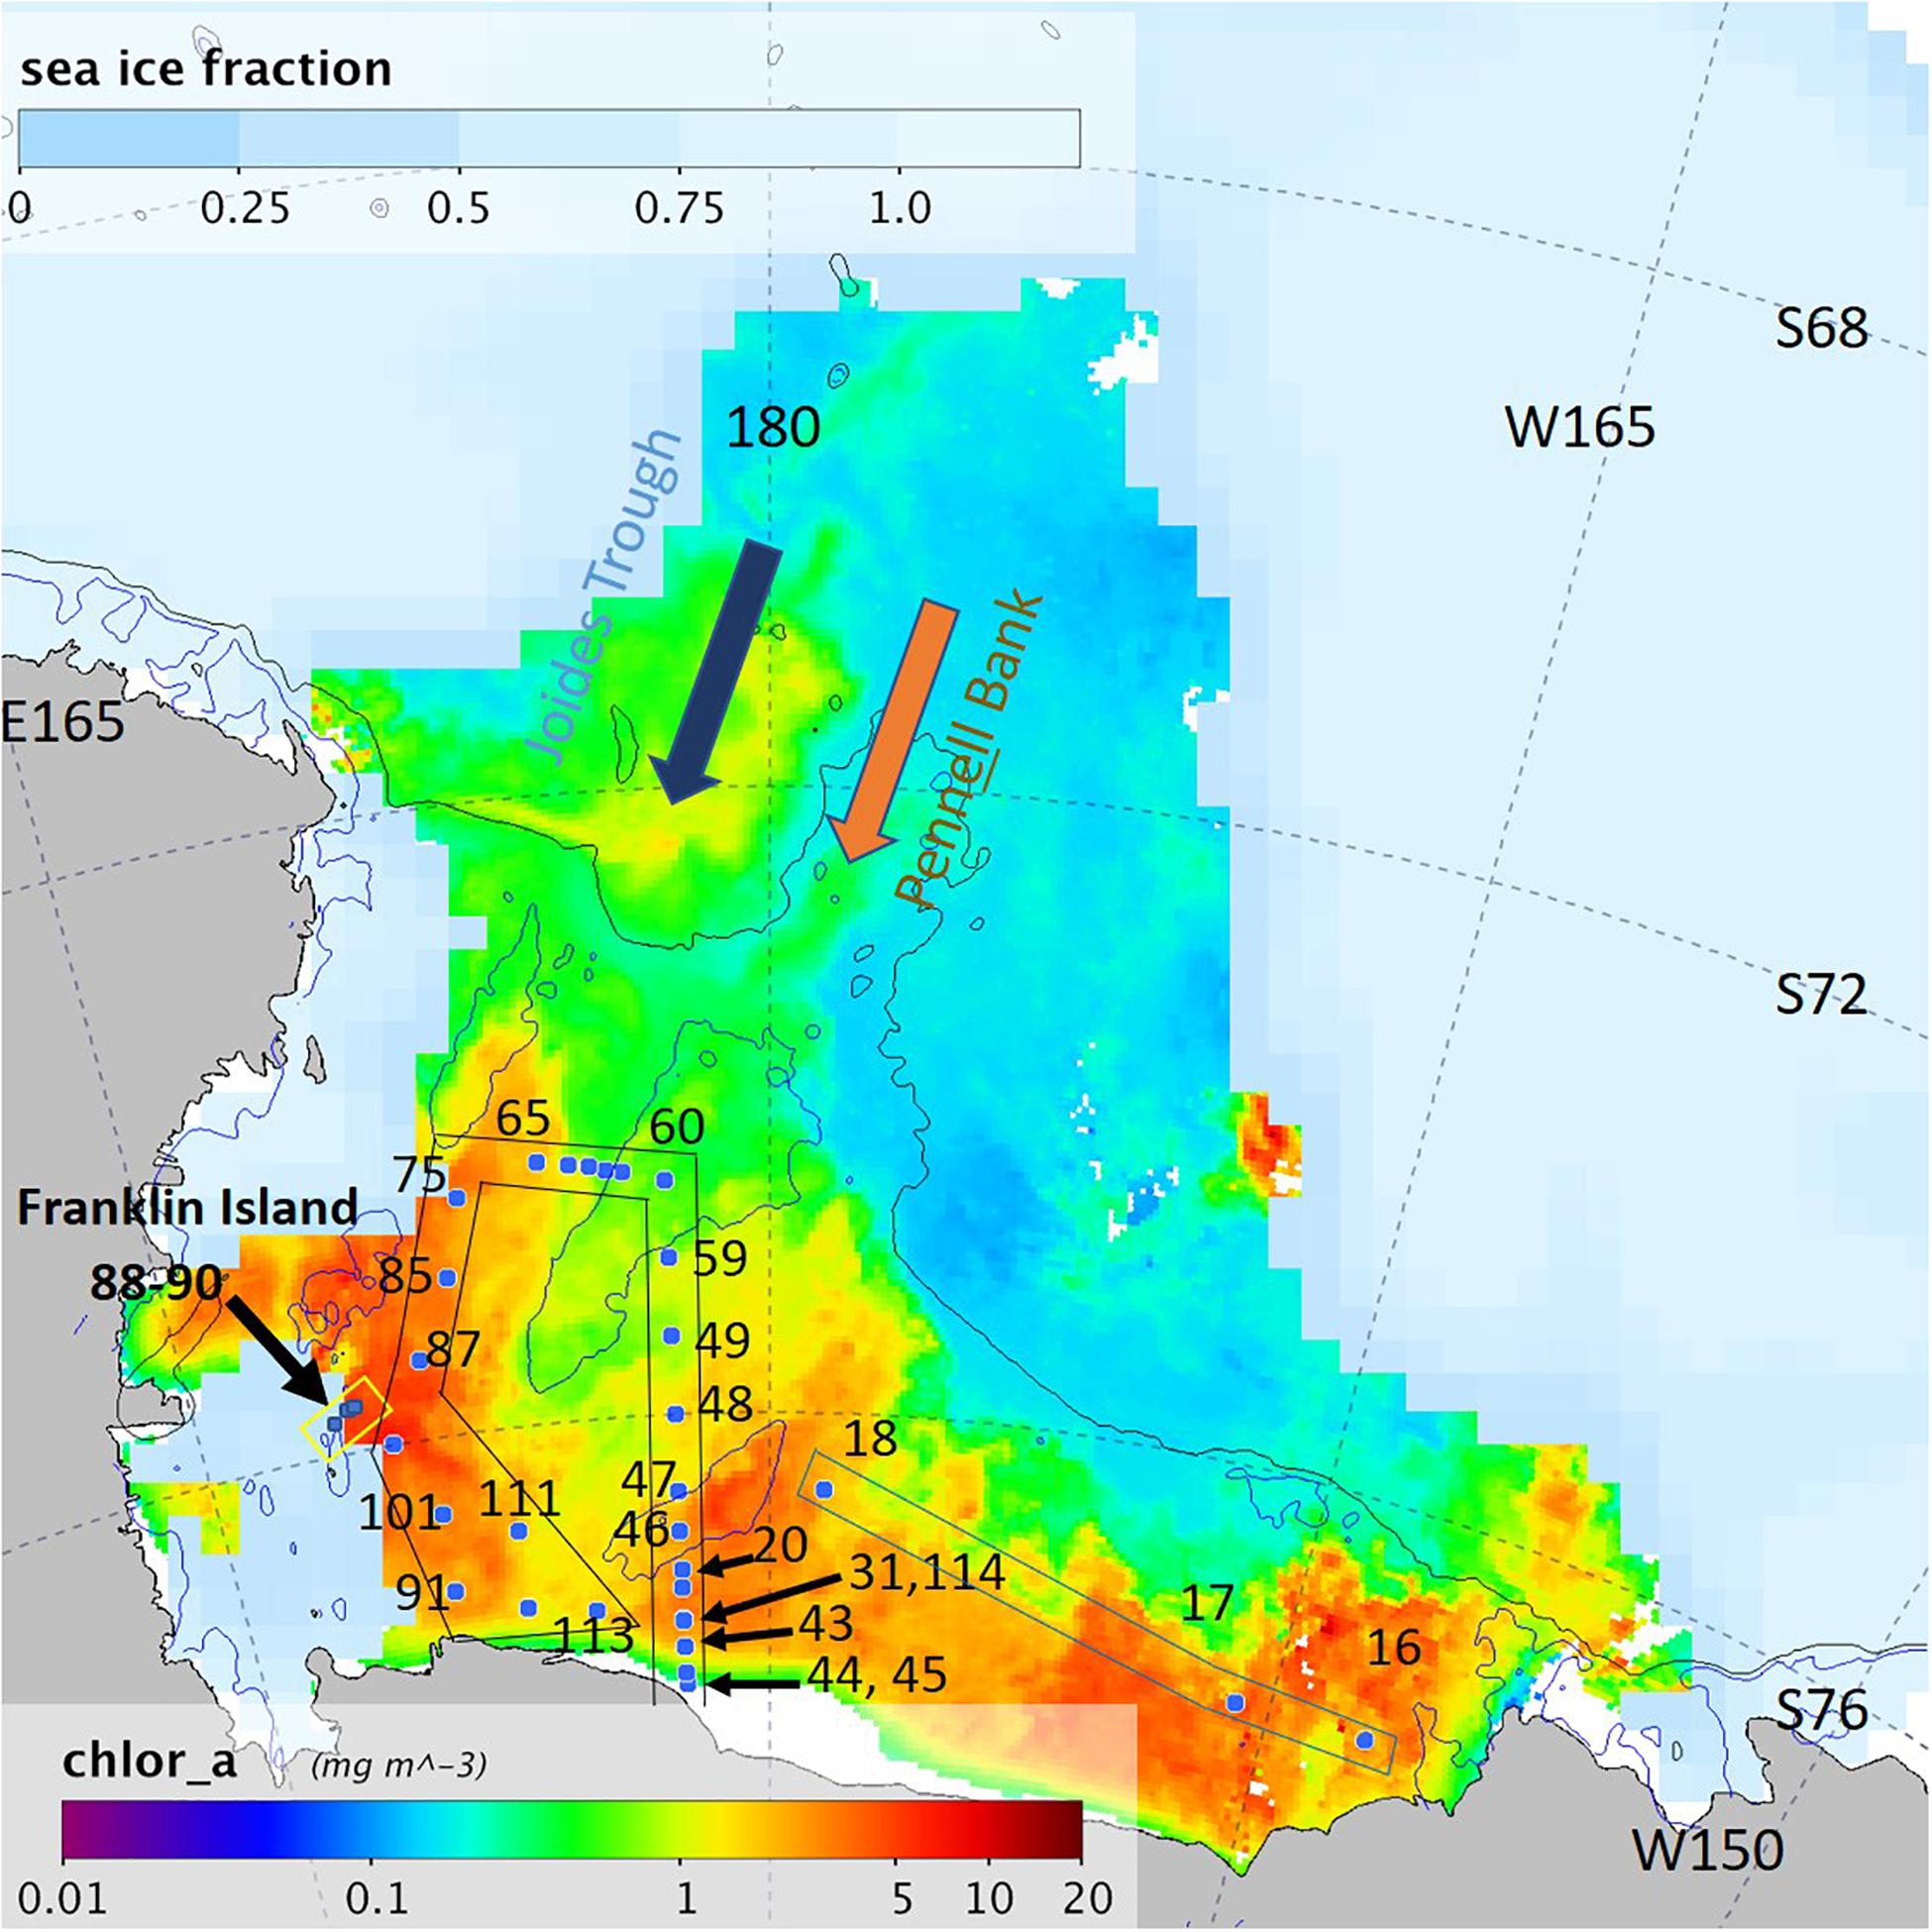
Figure 1. The Ross Sea study area with the eastern Ross Sea (St. 16–18, indicated with a blue box) and a circle transect in the center of the Ross Sea Polynya (RSP) (St. 20–114, indicated with a black box), the east RSP transect was sampled from south to north (St. 20–60), the west RSP transect was sampled from north to south (St. 75–113). The Franklin Island transect (St. 88–90) is indicated with a yellow box. Chlorophyll composite image from 20 December 2013 to 5 January 2014 (MODIS/Aqua). Sea ice fraction from Dec 28, 2013 (SSMIS). Black line denotes 1000 m isobath and blue line 350 m isobath.
Materials and Methods
Sampling
Samples were taken during expedition NBP13-10 on the RVIB Nathaniel B. Palmer in the Ross Sea, entering from the northeast on 20 December 2013 and leaving to the northwest on 5 January 2014 (Figure 1) (for full details, see Gerringa et al., 2015, 2019; Alderkamp et al., 2019).
A total of 350 samples were taken at 33 stations at depths between 2 and 714 m along three transects. The first transect was located in the eastern Ross Sea (St. 16–18). A second longer transect formed a circle in the Ross Sea Polynya, starting 10 km from the Ross Ice Shelf along the 177.5°E meridian going north, crossing troughs between the Ross and the Pennell Banks (St. 20–60), turning west from the Pennell Bank to the Joides Trough (St. 61–65), and bending south-west to south-east (via St. 75, 85–87, 91,101, 111–114, with station 114 revisiting station 31) (Figure 2). A third short transect was sampled from 9.5 km east of Franklin Island going eastwards (St. 88–90); these stations were covered by sea ice for 30–50% of the surface.
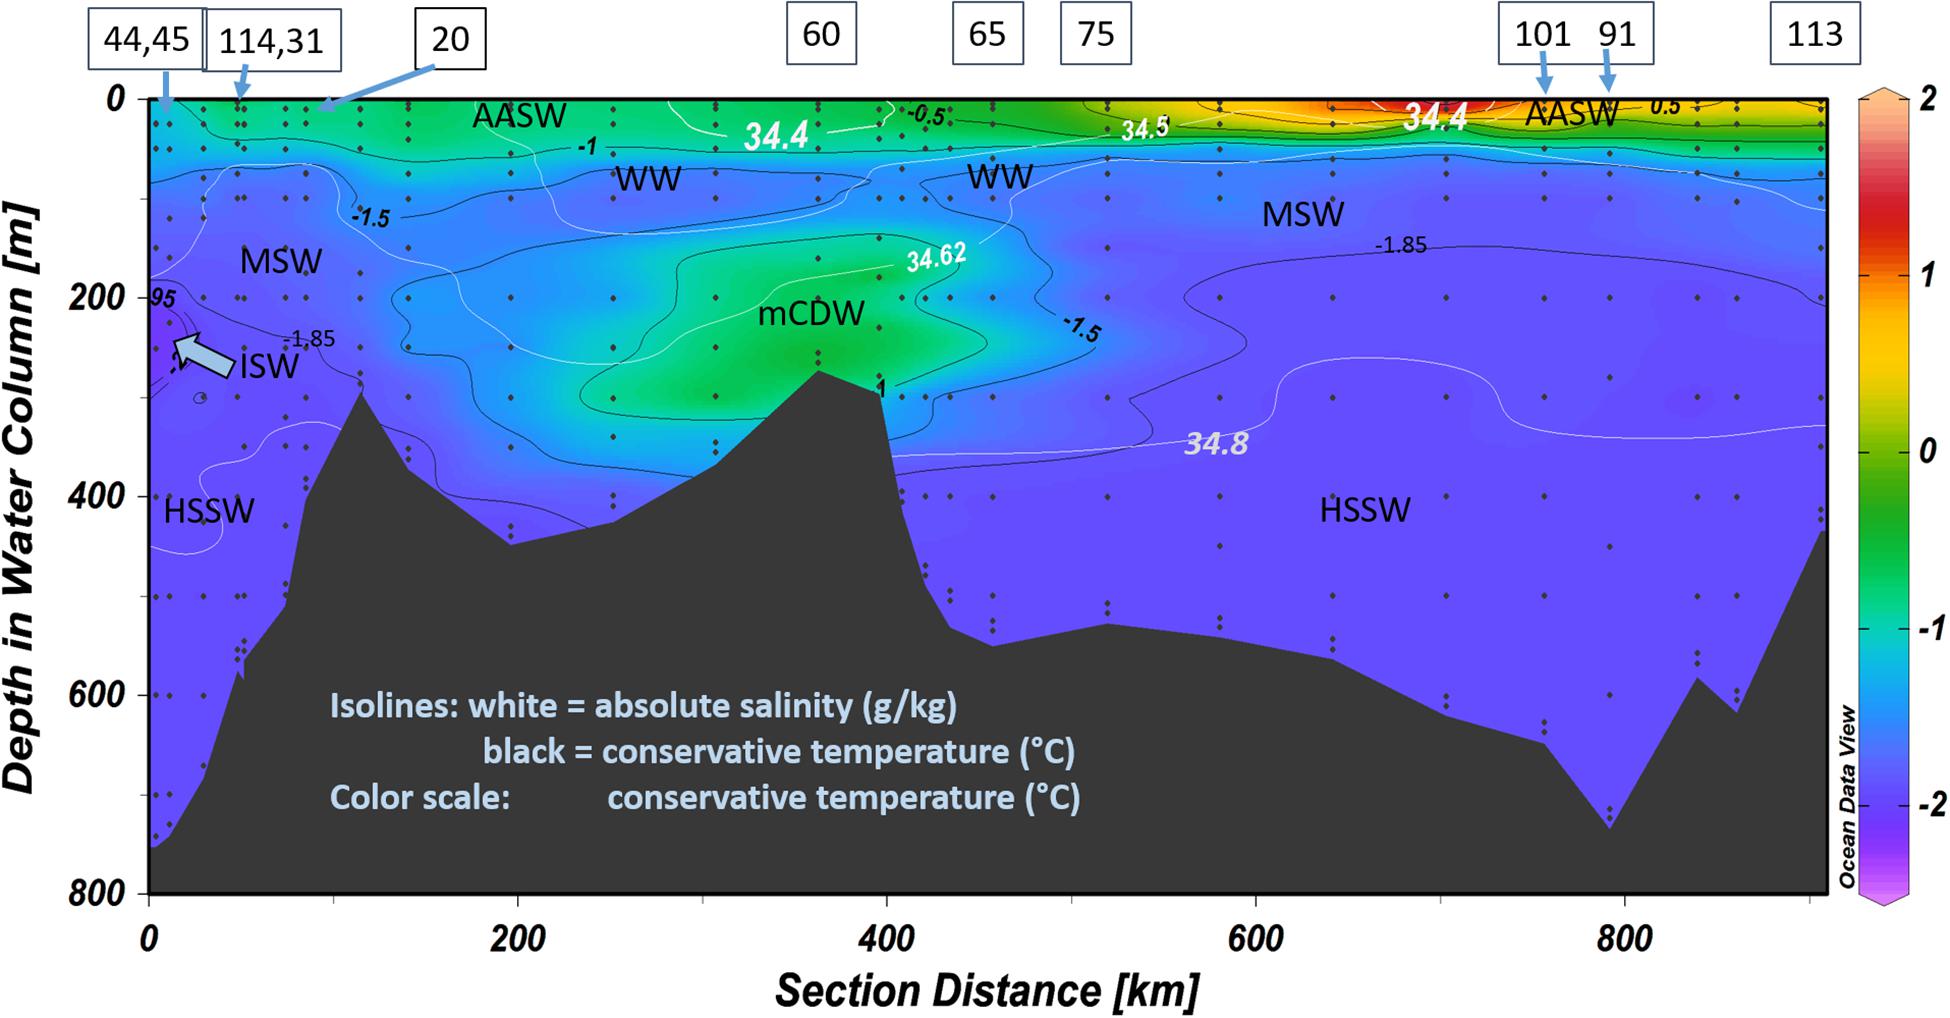
Figure 2. Conservative temperature (°C) in the circle transect (Figure 1). Black isolines indicate temperatures used for defining the water masses. White isolines show absolute salinity (g kg–1), with values used also for defining water masses. Some station numbers are given on top of the figure. The sequence of stations where trace metals were sampled and analyzed from right to left is: 44, 45, 43, 114, 31, 30, 20, 46, 47, 48, 49, 59, 60, 61, 62, 63, 64, 65, 75, 85, 86, 87, 101, 91, 111, 112, and 113. Stations 16–18 and 88–90 are outside this transect (see Figure 1 for their positions). AASW = Antarctic Surface Water, WW = Winter Water, mCDW = modified Circumpolar Deep Water, MSW = Modified Shelf Water, HSSW = High Salinity Shelf Water, ISW = Ice Shelf Water. Figure made using ODV (Schlitzer, 2018).
Modified 12 L Go-Flo (General Oceanics) samplers from the Royal NIOZ (the Netherlands) were attached to a trace metal clean frame from the United States Antarctic Program on a Kevlar cable. Temperature, depth, and salinity were measured with an SBE 9/11plus conductivity-temperature-depth (CTD) system (SeaBird Electronics). Transmission was obtained with a C-star transmissometer (WET Labs) and chlorophyll a (chl a) was estimated by fluorescence with a fluorometer (WET Labs). CTD data are expressed as conservative temperature (Θ in °C) and absolute salinity (SA in g kg–1) (transformed according to McDougall et al., 2009), as described in Gerringa et al. (2015).
After recovery of the trace metal clean frame, water was subsampled and filtered (Sartorius®, 0.2 μm; Sartobran 300) inside a trace metal clean van directly from the Go-Flo bottles. Samples were acidified with HCl (Seastar© baseline hydrochloric acid) to a final concentration of 0.024 M (pH 1.7–1.8) in a laminar flow bench in a plastic bubble with overpressure achieved by inflow of air through a HEPA filter. Before use, the sample bottles were rigorously cleaned in three steps according to GEOTRACES protocols.
Analysis of Dissolved Trace Metals by ICPMS
Trace metals were analyzed with a Thermo Finnigan HR-ICPMS element 2. A 30 mL sample was pipetted into an acid cleaned FEP vial. Peroxide (final concentration 10 μM) and an internal standard (indium and lutetium) was added at a final concentration of 5 nM prior to UV digestion after Middag et al. (2015). The samples were digested for 4 h in a custom-made UV box after which they were pre-concentrated using a seaFAST pre-concentration system, using Nobias PA1 resin in the pre-concentration column (Lagerström et al., 2013; Bown et al., 2017). Using two loops of 10 mL each, a total of 20 mL sample was pre-concentrated into 500 μL elution acid, which gives a pre-concentration factor of 40. Samples were eluted using 1.5 M teflon distilled HNO3 that contained rhodium as a standard to easily identify any sample introduction issues in a run (Middag et al., 2015).
The system was calibrated via standard additions using a mixed stock solution made of 1000 ppm single spike standards. A typical calibration line consisted of seven standard additions where the maximum standard additions are comparable to maximum concentrations in the marine environment. The recovery was verified in each analytical run by comparing the slope of the seawater calibration curve (multi-element standard added to seawater) and the eluent calibration curve (multi-element standard added directly to the elution acid) after Biller and Bruland (2012). Blank contributions from sample handling, pre-concentration, and analyses steps were determined by analyzing acidified Milli-Q water (∼1.8 pH) as a sample and exposing the sample to similar procedures. The accuracy and precision of the measurements were determined by measuring GEOTRACES community consensus reference materials SAFE D1 and S, as well as in-house reference seawater samples (Table 1).

Table 1. The values of SAFe reference sample D1 for trace metals measured by ICPMS and the 2013 consensus values for some metals, in nM/kg.
Data can be found at https://dataportal.nioz.nl/doi/10.25850/nioz/7b.b.r.
Data Treatment of Trace Metals
Outliers were classified as described by Middag et al. (2015), where a linear regression was determined between the data deeper and shallower than a suspect data point; however, we used a rejection criterion of >20% deviation from the predicted value instead of 10%.
For Pb, contamination was evident for early stations (St. 16–18), where the concentrations decreased and profiles became less irregular per station. The Pb data of these stations were removed from this study. It is possible that the Pb concentration decreased from east to west in the eastern Ross Sea between stations 16 and 18, although a reduction of Pb contamination in the sampling system seems more likely. Ti and Pb data at St. 65 were eliminated because the concentrations were substantially higher than elsewhere and the vertical profiles consisted of more outliers than normal data.
The software package R (R Development Core Team, 2011) was used for statistical calculations, to calculate Pearson and Tukey correlations. The median values with the variance in metal and nutrient concentrations are shown as boxplots (Figure 3). The actual dissolved metal concentrations in the circle transect (Figure 4) were presented using Ocean Data View (ODV, Schlitzer, 2018).
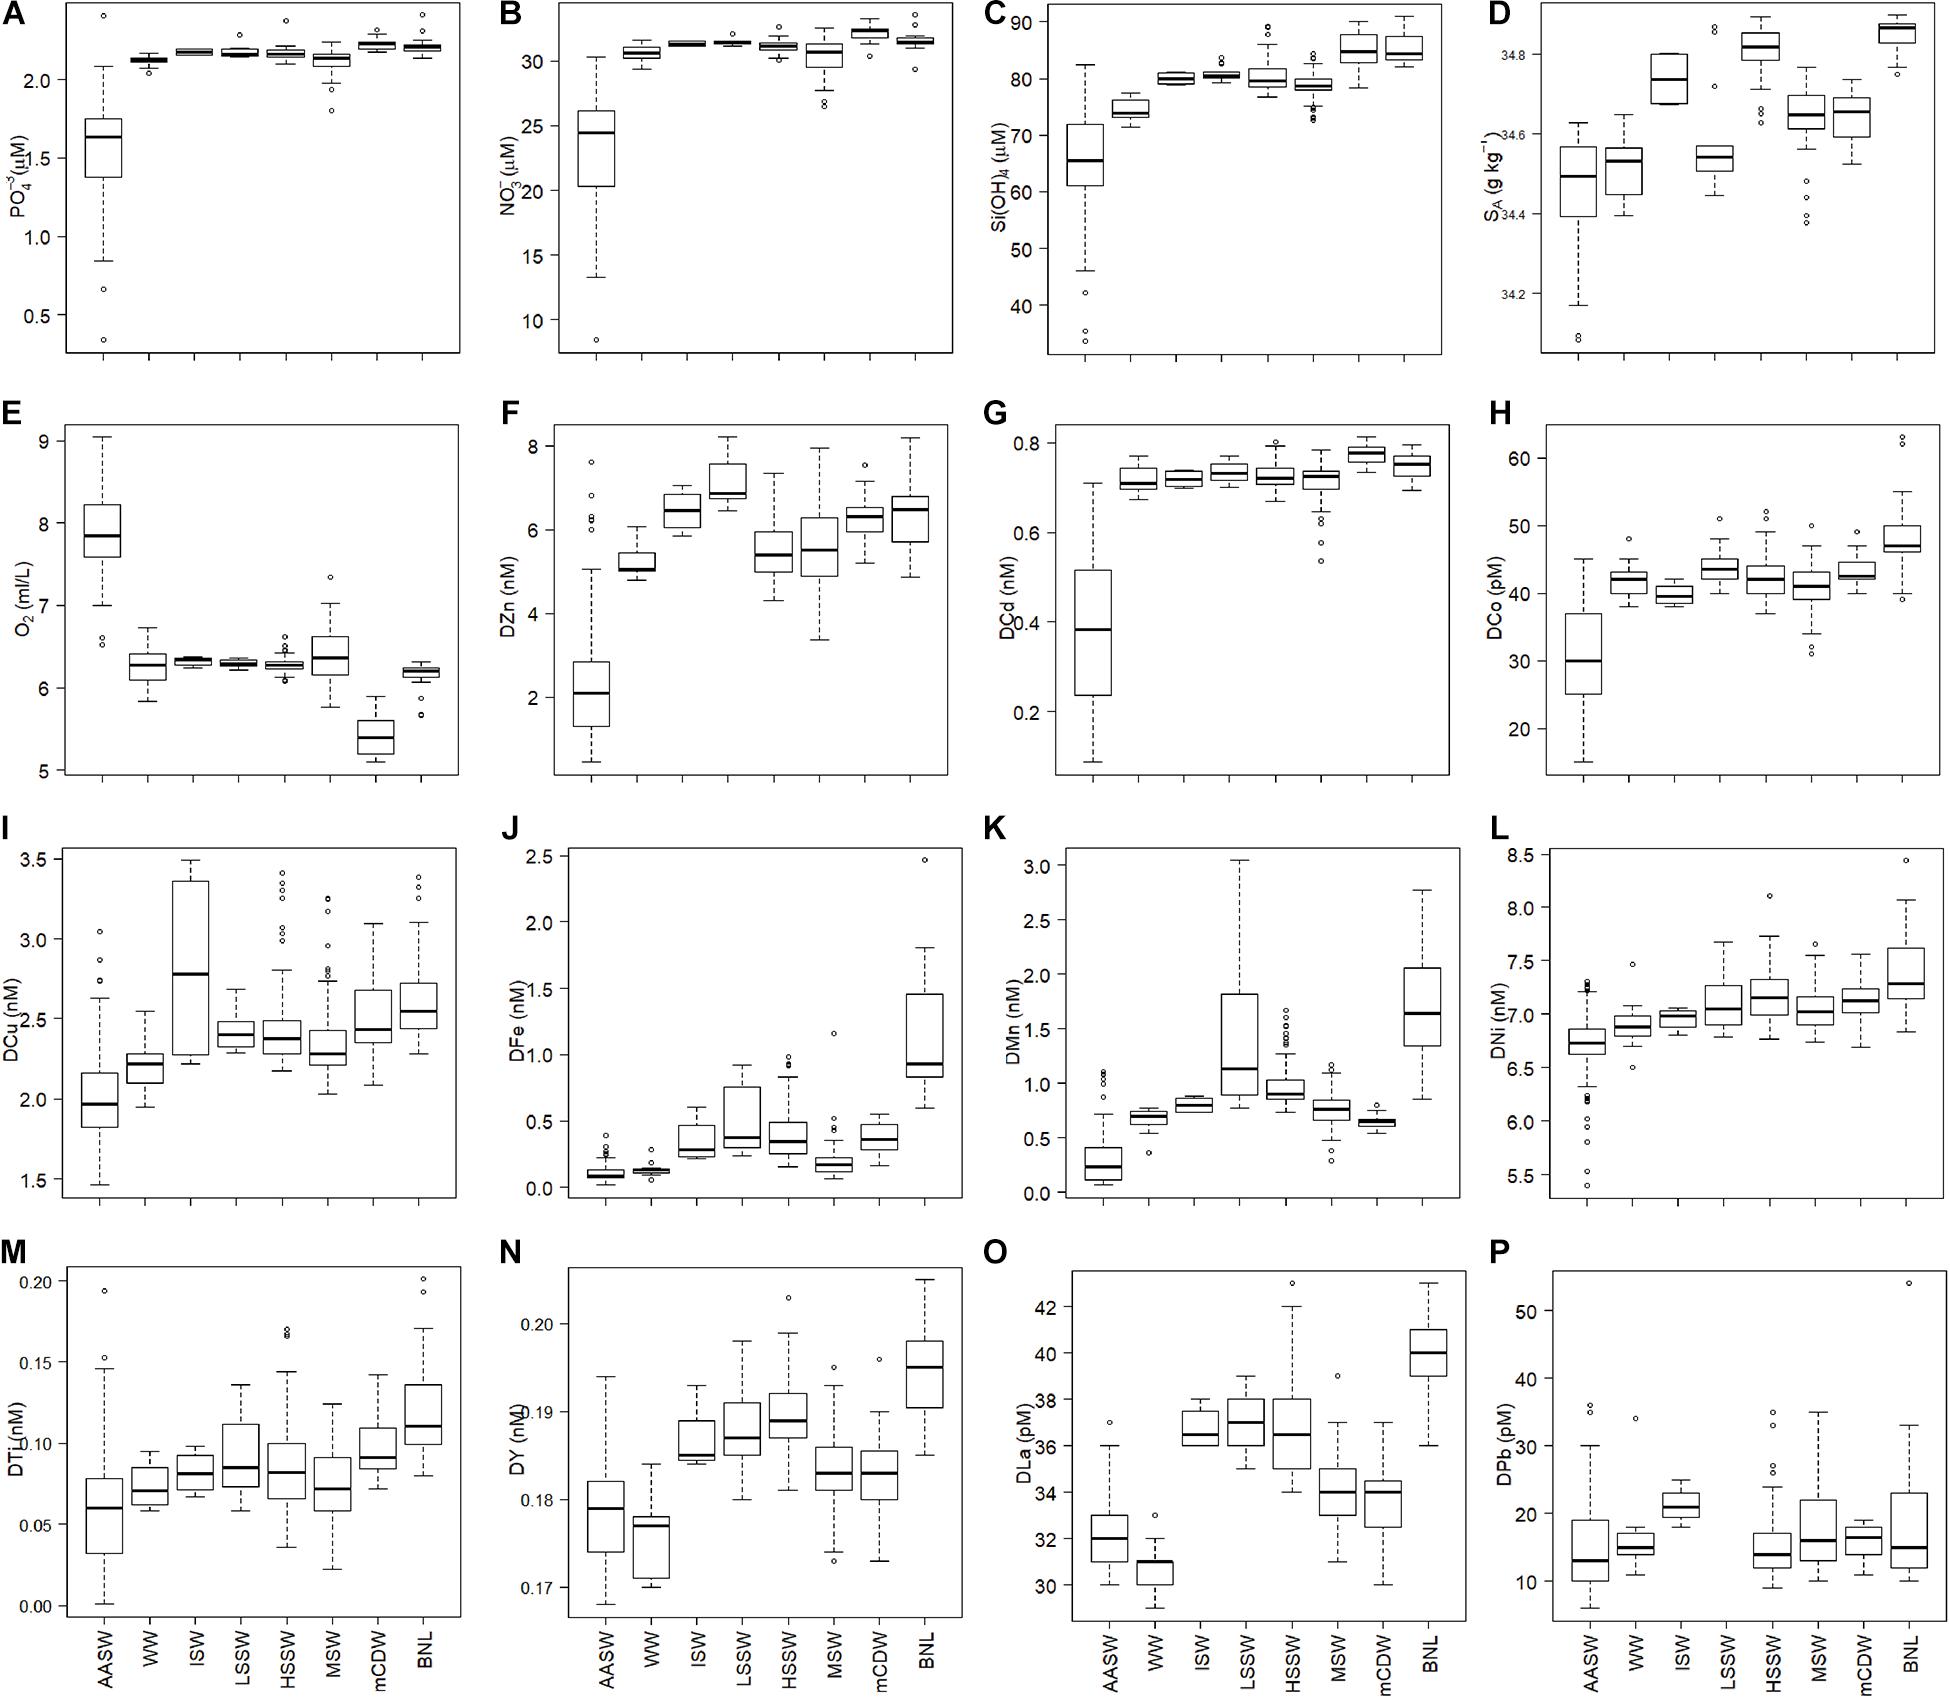
Figure 3. Boxplots of the dissolved concentrations of macro-nutrients, oxygen, and trace metals of all stations per water mass as defined by Tomczak and Godfrey (2001) and Orsi and Wiederwohl (2009) (see text). (A–C) are in μM, (D) is in g kg–1, (E) is in ml/L, dissolved metals are in nM, with the exception of DCo, DLa, and DPb which are in pM (H,O,P). (A:) PO43–, (B) NO3–, (C) Si(OH)4, (D) absolute salinity, (E) oxygen, (F) DZn, (G) DCd, (H) DCo, (I) DCu, (J) DFe, (K) DMn, (L) DNi, (M) DTi, (N) DY, (O) DLa, (P) DPb. The median values are indicated by the thick horizontal line in the boxes, which contain the first and third quartiles, whereas the whiskers indicate the range excluding outliers. Circles are outliers (>1.5 interquartile range from the box, Teetor, 2011). The figures are made using the software package R.
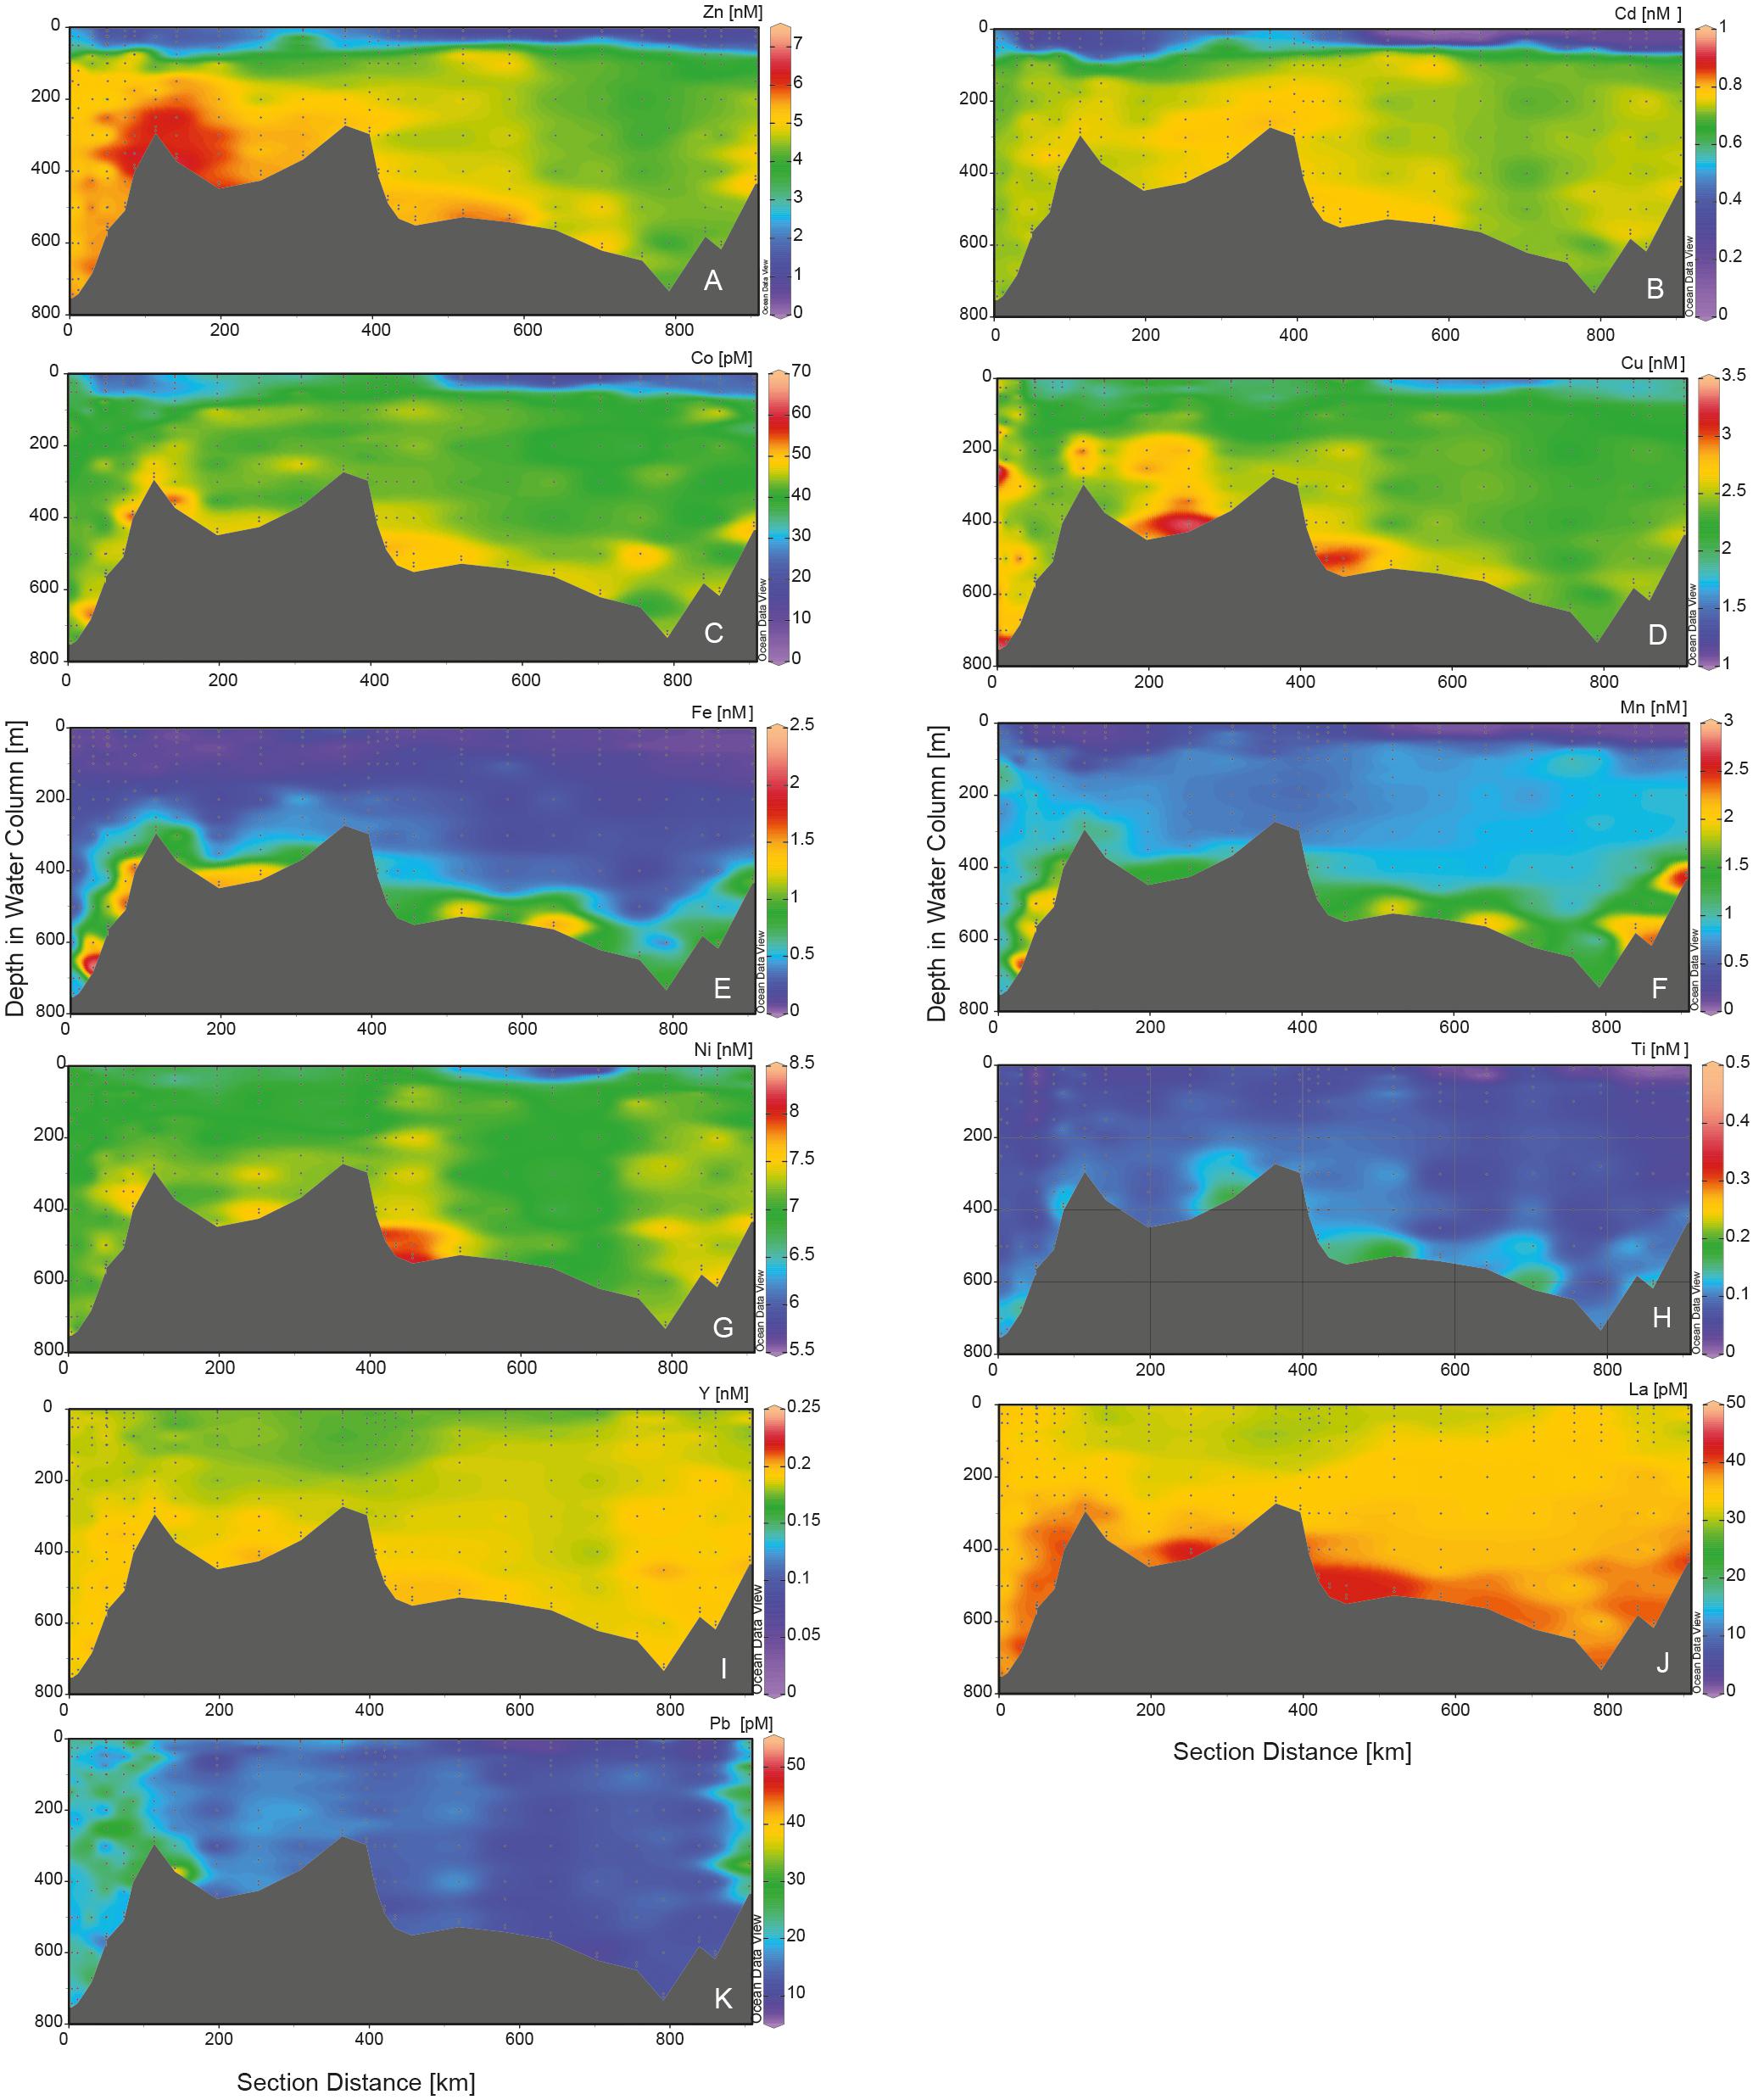
Figure 4. Transects of dissolved trace metals along the circle in the Ross Sea Polynya. Metals are in nM, with the exception of DCo, DLa, and DPb which are in pM. Stations 16–18 and the stations 88–90 near Franklin Island are omitted. (A) DZn, (B) DCd, (C) DCo, (D) DCu, (E) DFe, (F) DMn, (G) DNi, (H) DTi, (I) DY, (J) DLa, and (K) DPb. Figure made using ODV (Schlitzer, 2018).
The bottom nepheloid layer (BNL) was defined at a water depth of > 200 m by a reduction in transmission to below 98.5% where the DFe concentration was >0.5 nM, or by a reduction in transmission to between 99% and 98.5% where DFe was >1 nM (N = 44). The mixed layer depth (MLD) was defined as the depth where neutral density was 0.02 kg.m–3 greater that at the surface.
Other Analyses
Samples were filtered on board as described above for metals; separate samples were taken for Si(OH)4, which were stored at 4°C and for NO3–, nitrite (NO2–) and PO43–, which were stored frozen at −20°C. They were analyzed colorimetrically on a Bran and Luebbe trAAcs 800 Autoanalyzer in the NIOZ nutrient laboratory post cruise (Murphy and Riley, 1962; Strickland and Parsons, 1968; Grasshoff, 1983). Measurements were made on four channels: PO43–, Si(OH)4, NO3– and NO2– combined, and NO2– separately. For details, see Gerringa et al. (2015, 2019). The data can be found at https://doi.org/10.25850/nioz/7b.b.g.
To test for significant differences in nutrient concentrations between water masses, a t-test and an ANOVA-Tukey test were applied using R, with a 95% confidence interval.
The notation metal/P (e.g., Zn/P) is used for dissolved ratios and metal:P (e.g., Zn:P) for stoichiometric ratios derived from a slope of a linear regression.
Unless otherwise noted, data are expressed as the mean ± the standard deviation.
The datasets of FIA and ICPMS generally compare well, show the same trends (Supplementary Information (SI) Supplementary Figures S1, S2I,J) but differ slightly in absolute concentrations. The average offset for low DFe concentrations is 0.055 ± 0.021 nM higher when analyzed by ICPMS after the cruise (averaged for FIA DFe < 0.1, N = 146, the offset is 0.075 ± 0.026 nM averaged for FIA DFe < 0.5, N = 278).
Results
Hydrography, Nutrients and Chlorophyll a
As described in previous papers on data from the same cruise (Gerringa et al., 2015, 2019), four main water masses were present in the study area, based on definitions of Tomczak and Godfrey (2001) and Orsi and Wiederwohl (2009). Antarctic Surface Water (AASW, potential temperatures (Θ) > −1.85°C and neutral density < 28 kg m–3) covered the surface, below which, in the center of the polynya, remnants of cold Winter Water (WW) were present north of 76° S (St. 48) (Figure 2). From the north, warm mCDW (34 < S < 35) flowed onto the shelf into the Ross Sea, whereas in the south, cold Shelf Water (SW) was formed near the Ross Ice Shelf (Θ < −1.85°C) with variable salinity depending on salt rejection. The following subdivisions can be distinguished in SW: Ice Shelf Water (ISW), low salinity SW (LSSW), high salinity SW (HSSW), and modified SW (MSW) (Figure 2). The very cold ISW was only present close to the ice shelf (Θ < −1.95°C, at St. 18, St. 43–45). The difference between LSSW and HSSW depends on the extent of salt rejection in the sea ice (for LSSW and HSSW, S < and > 34.62, respectively), where LSSW was only present at the stations in the eastern Ross Sea (St. 16, 17 and 18). MSW is formed through mixing of northward flowing SW with southward flowing AASW and mCDW, and has a broad range of salinities and temperatures (S > 34.5 and Θ > −1.85°C, Orsi and Wiederwohl, 2009). A BNL was observed above the bottom in the Ross Sea Polynya in HSSW and at two stations in MSW (Gerringa et al., 2015, 2019).
Relative to deeper water, mean macro-nutrient concentrations were relatively low in the mixed layer (ML), which varied between 8 and 99 m, averaging 36 ± 21 m, but were not low enough to limit phytoplankton growth (Alderkamp et al., 2019; Figures 3A–C, 5A–C, 6A–C), averaging 23.33 ± 4.10, 1.52 ± 0.33, and 64.46 ± 9.36 μM, for NO3–, PO43–, and Si(OH)4, respectively. The concentrations along the eastern Ross Sea transect were higher than these averages, especially at St. 17 (Figures 5A–C; data can be found at https://doi.org/10.25850/nioz/7b.b.g). The concentrations of NO3– and Si(OH)4 in mCDW were significantly higher and the oxygen content significantly lower than in MSW (Tukey test: p = 0.03, p = 0.0018, respectively) [mCDW: NO3– = 32.15 ± 0.63 μM, Si(OH)4 = 84.84 ± 3.55 μM; Figures 3A–C]. In the BNL, Si(OH)4 concentrations were similar to those in mCDW. However, the Si(OH)4 concentrations showed more variance than NO3– and PO43– in deeper water masses, notably in HSSW and in the BNL (Figures 3A–C). In HSSW, NO3– and PO43– concentrations became almost constant with depth after a steep increase with depth in AASW, but Si(OH)4 kept increasing slightly with depth.
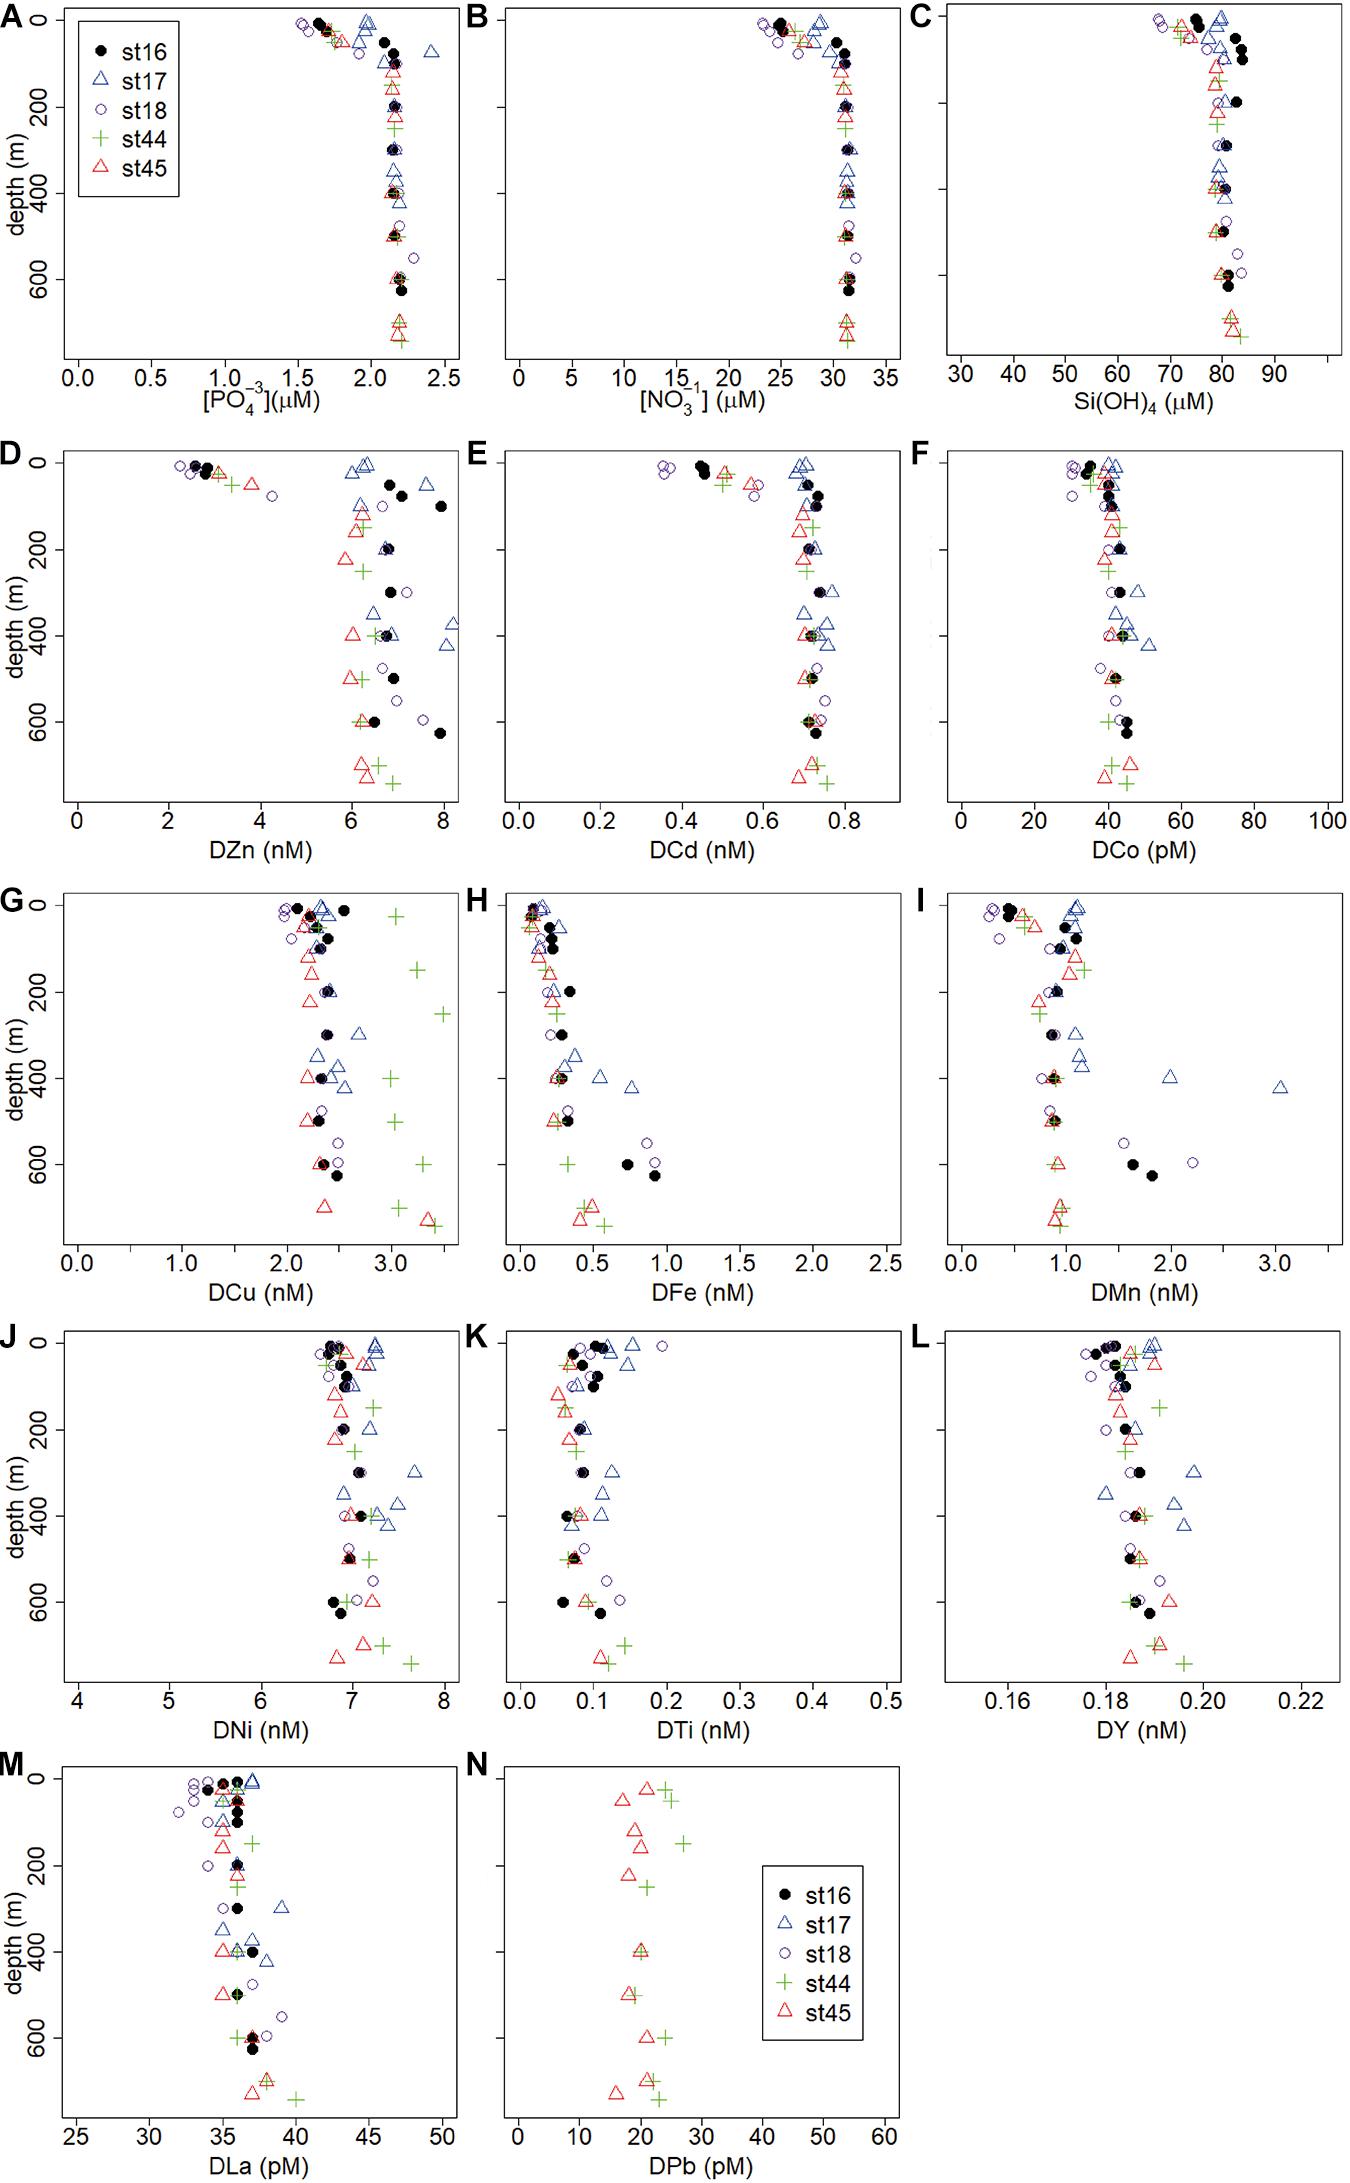
Figure 5. Depth profiles of macro-nutrients (μM) and trace metals (nM or pM) of the eastern Ross Sea transect, stations 16–18 and those close to the Ross Ice Sheet stations 44 and 45. (A) PO43–, (B) NO3–, (C) Si(OH)4, (D) DZn, (E) DCd, (F) DCo, (G) DCu, (H) DFe, (I) DMn, (J) DNi, (K) DTi, (L) DY, (M) DLa, (N) DPb.
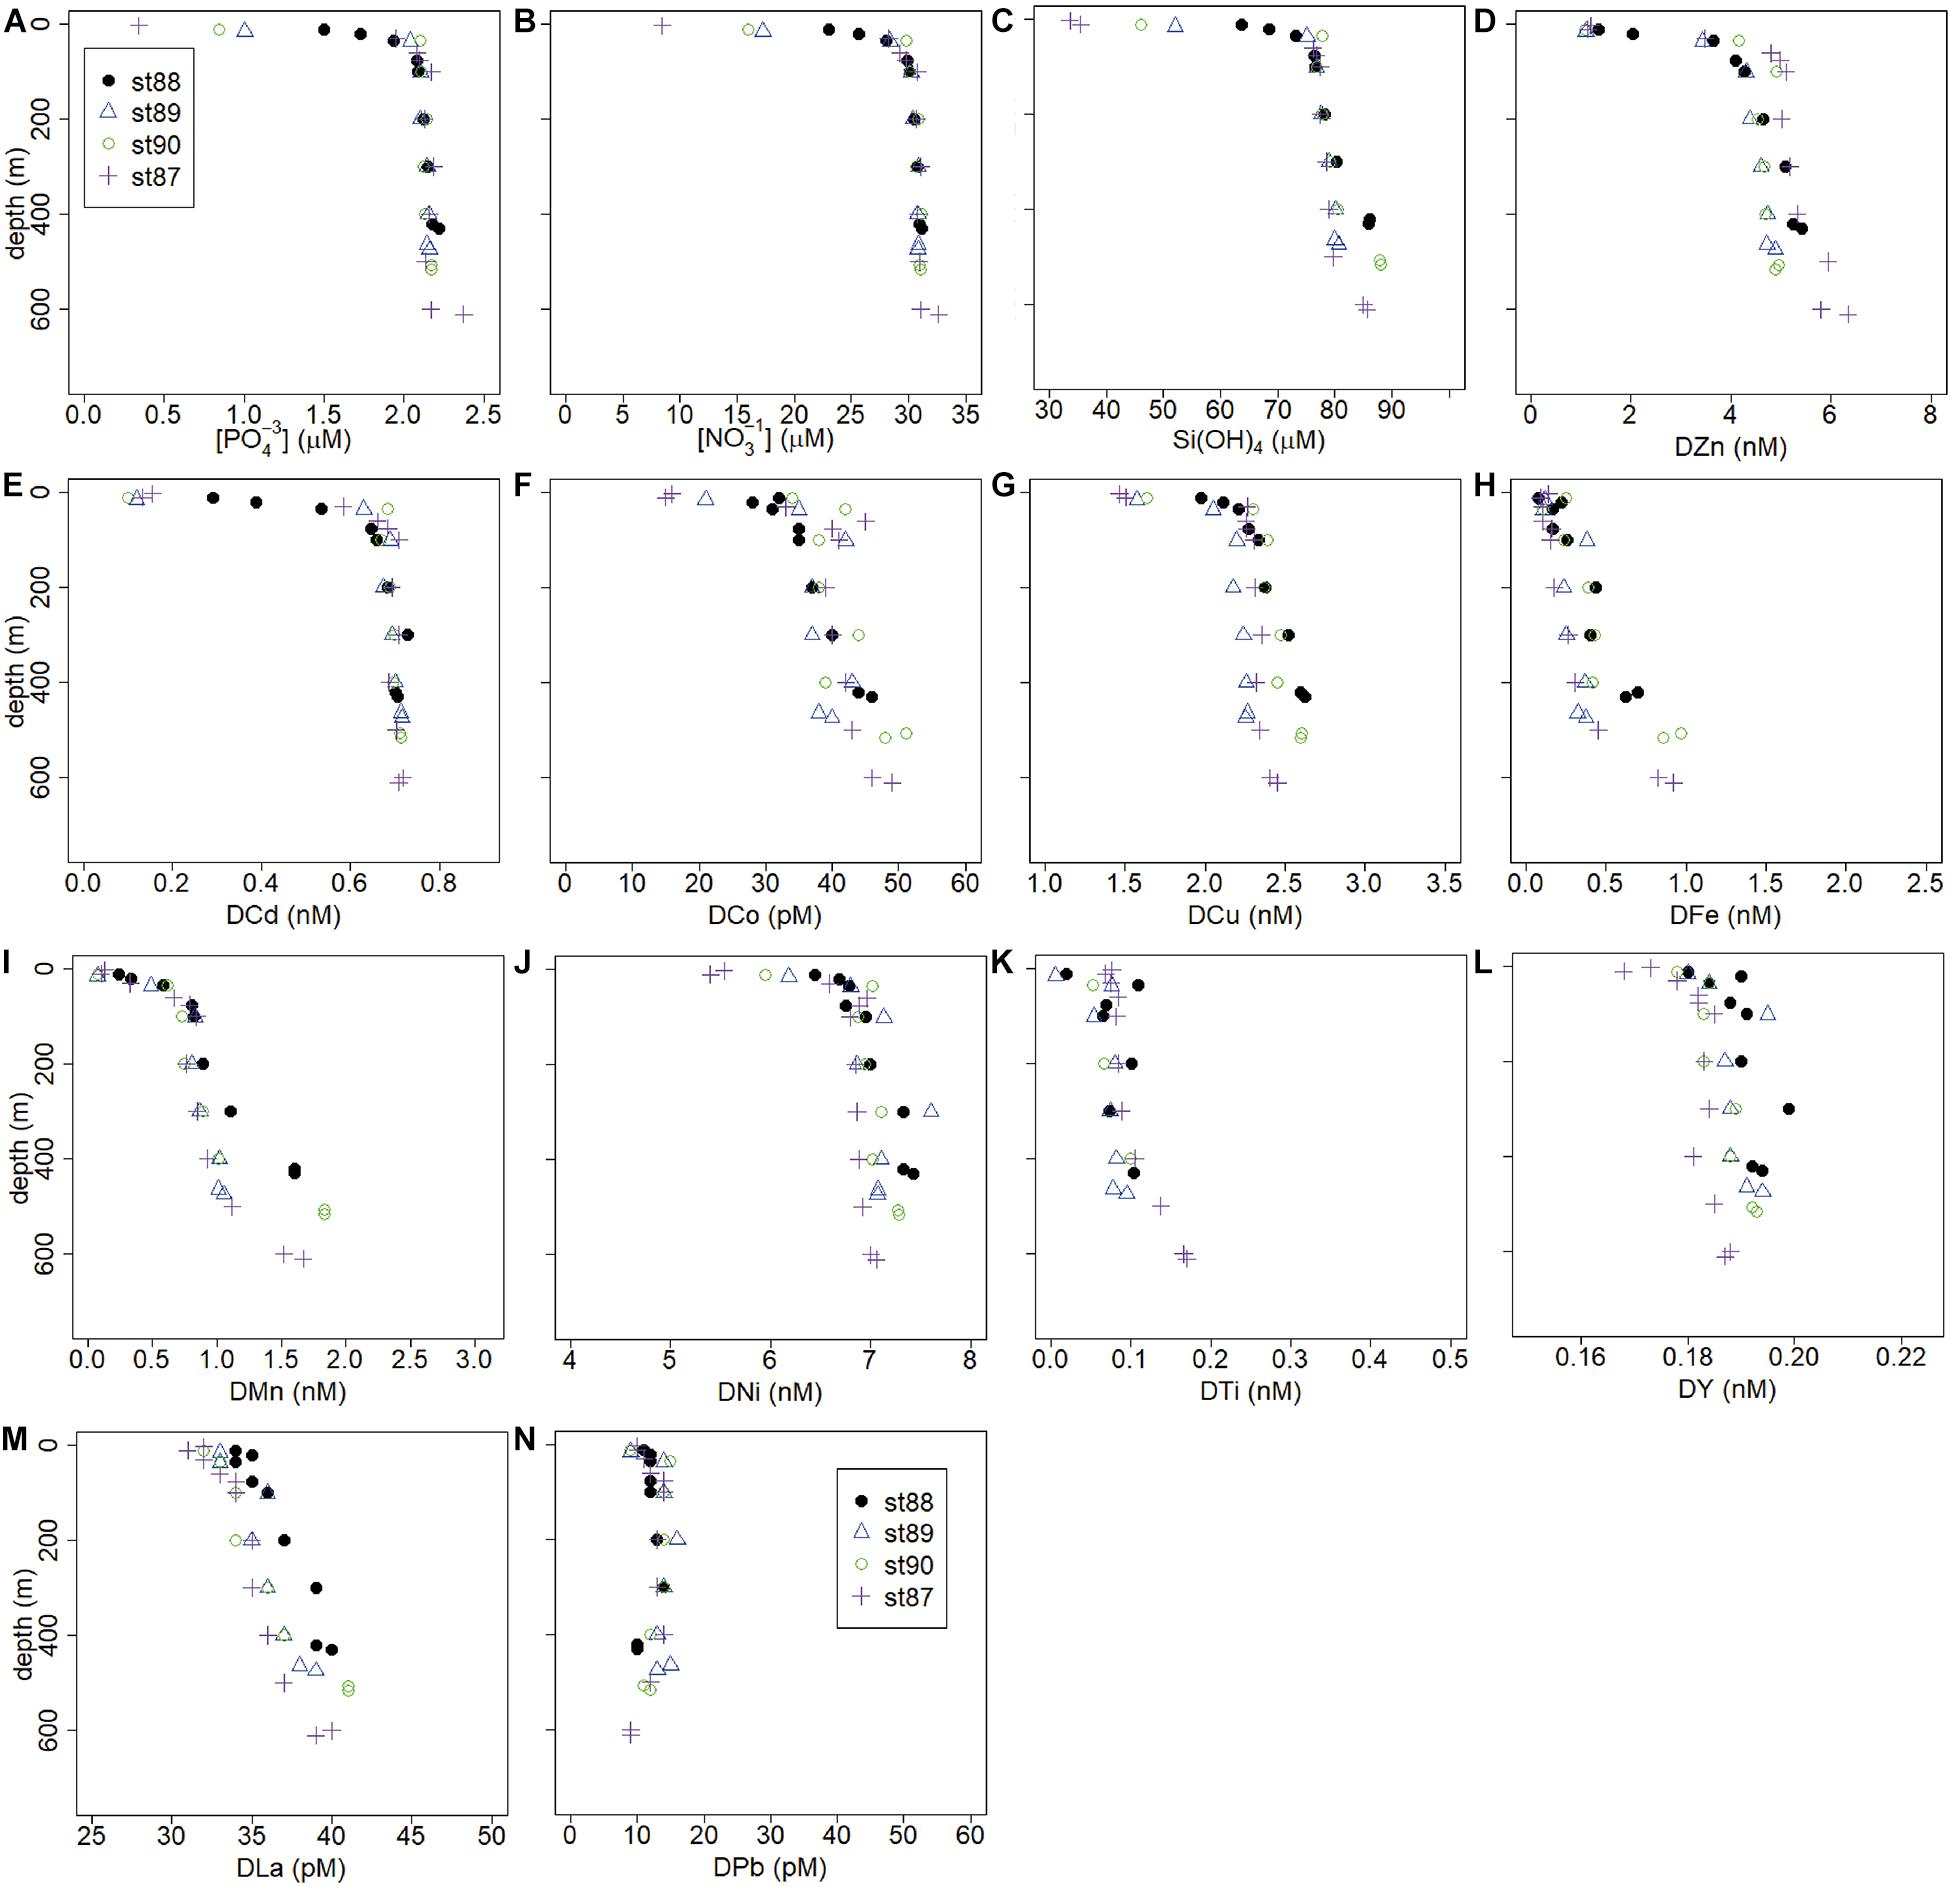
Figure 6. Depth profiles of macro-nutrients (μM) and trace metals (nM or pM) of the Franklin Island transect, stations 88–90. (A) PO43–, (B) NO3–, (C) Si(OH)4, (D) DZn, (E) DCd, (F) DCo, (G) DCu, (H) DFe, (I) DMn, (J) DNi, (K) DTi, (L) DY, (M) DLa, (N) DPb.
Figure 1 shows that the distribution of satellite obtained chl a has a distinct pattern, known to be reoccurring yearly with only slight variations in horizontal distribution. This was explained by Reddy and Arrigo (2006) to be due the interaction of the bathymetry and the currents, like the incoming mCDW in the Joides Trough.
Metals per Water Mass
In the following sections, the results are described per water mass from surface to bottom with a focus on the Ross Sea Polynya transect (Figures 3F–P, 4A–K, 5D–N, 6D–N) and with an additional focus on those metals that are correlated with macro-nutrient concentrations. The metals DZn, DCd, and DCo typically displayed a surface minimum and a steep increase with depth followed by more or less constant deep concentrations. The concentrations of DCu, DFe, and DMn also had a surface minimum and an increase with depth, but also a distinct increase toward the sediment. Last, the details for metals that often also featured a surface minimum, but with less distinct depth profiles, like DTi, DNi, DLa and DY will be presented. For DPb, there was no significant difference between water masses (average concentrations 17 ± 7 pM in the ML, elsewhere 16–19 ± 7pM, Tables 2, 3).
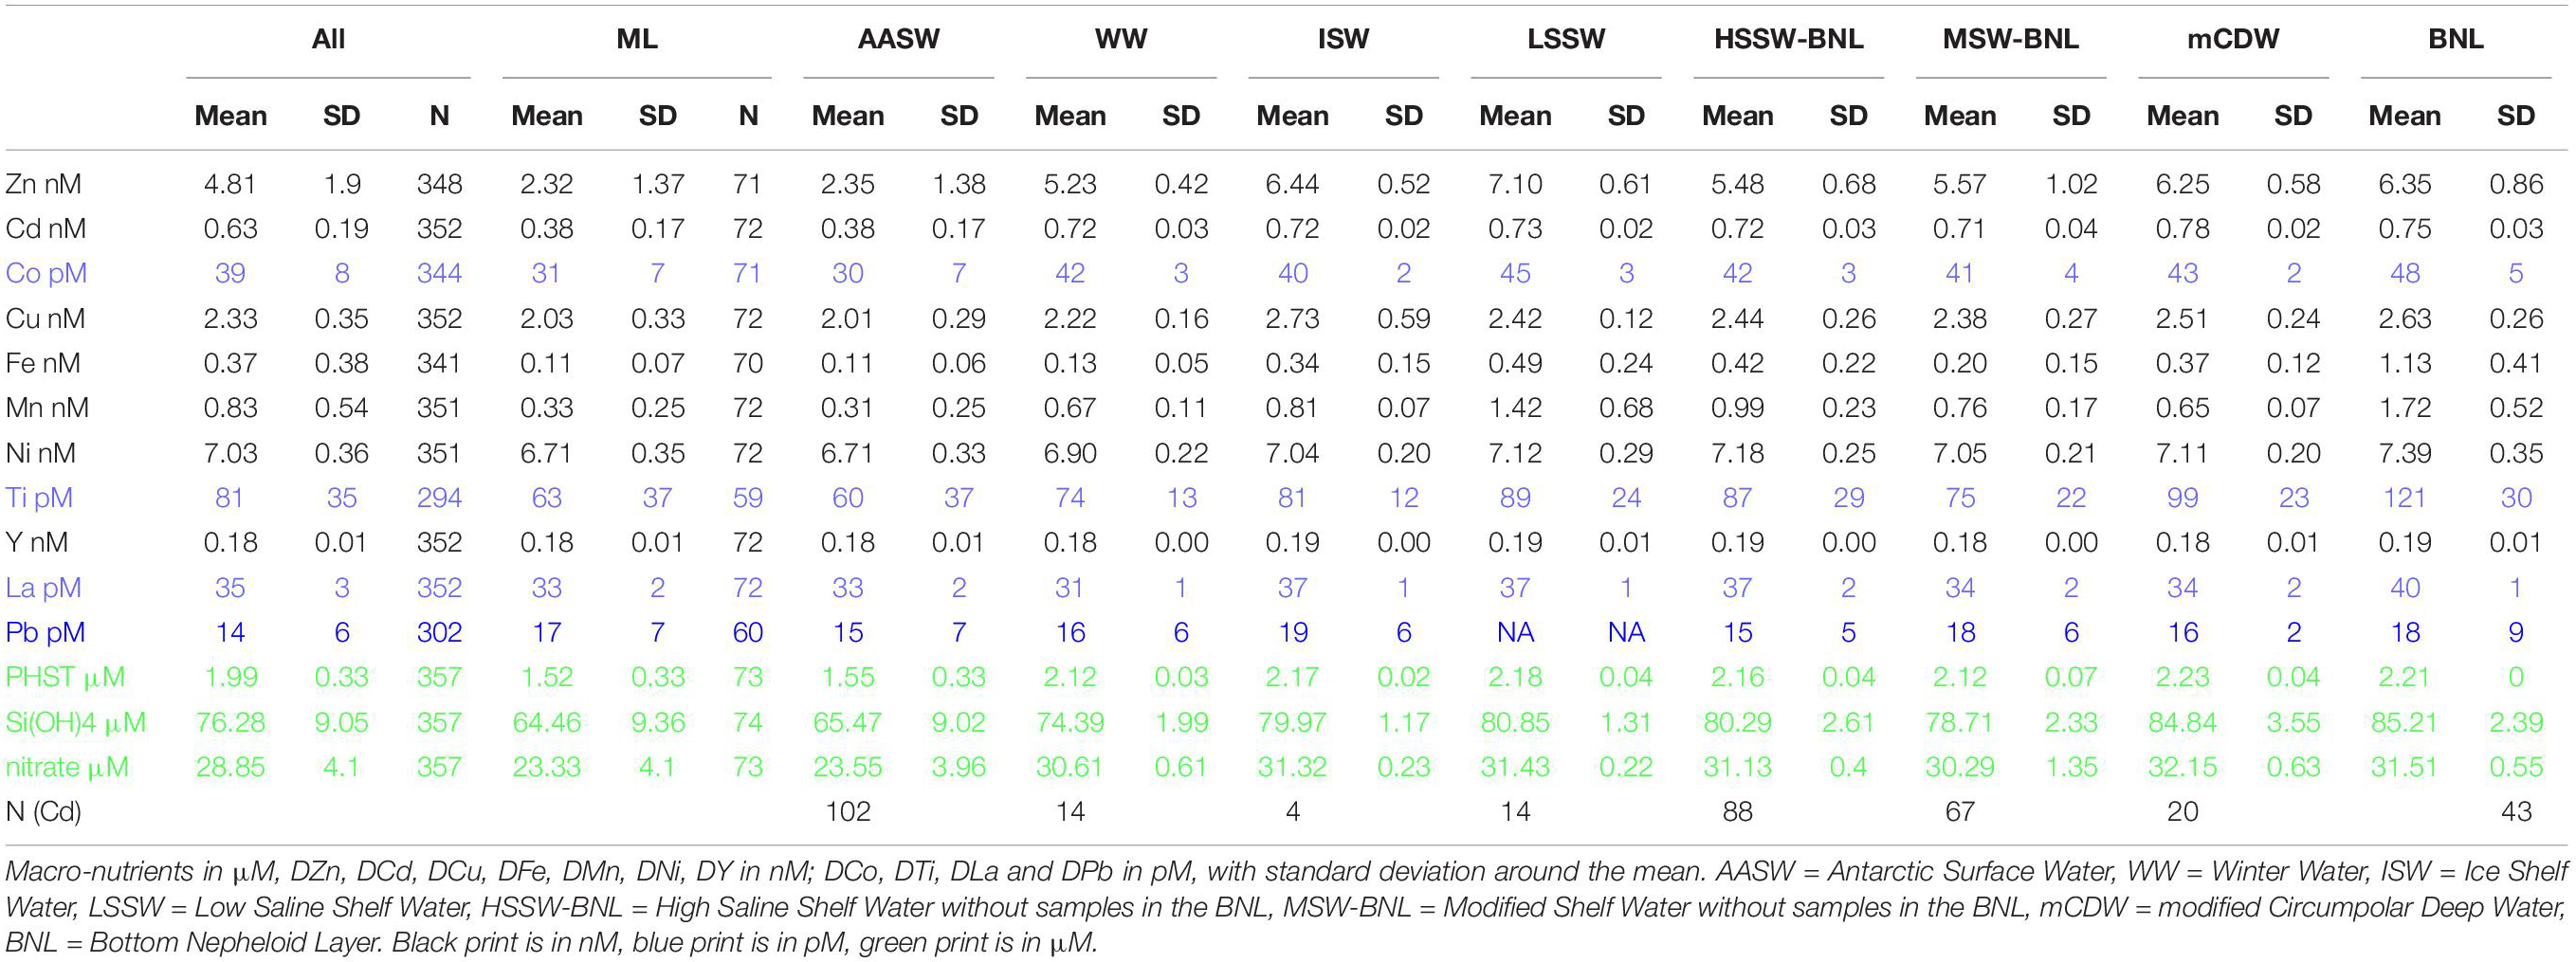
Table 2. Average dissolved metal concentrations and nutrient concentrations, for all, in the mixed layer (ML), per water mass and bottom nepheloid layer (Figure 3).
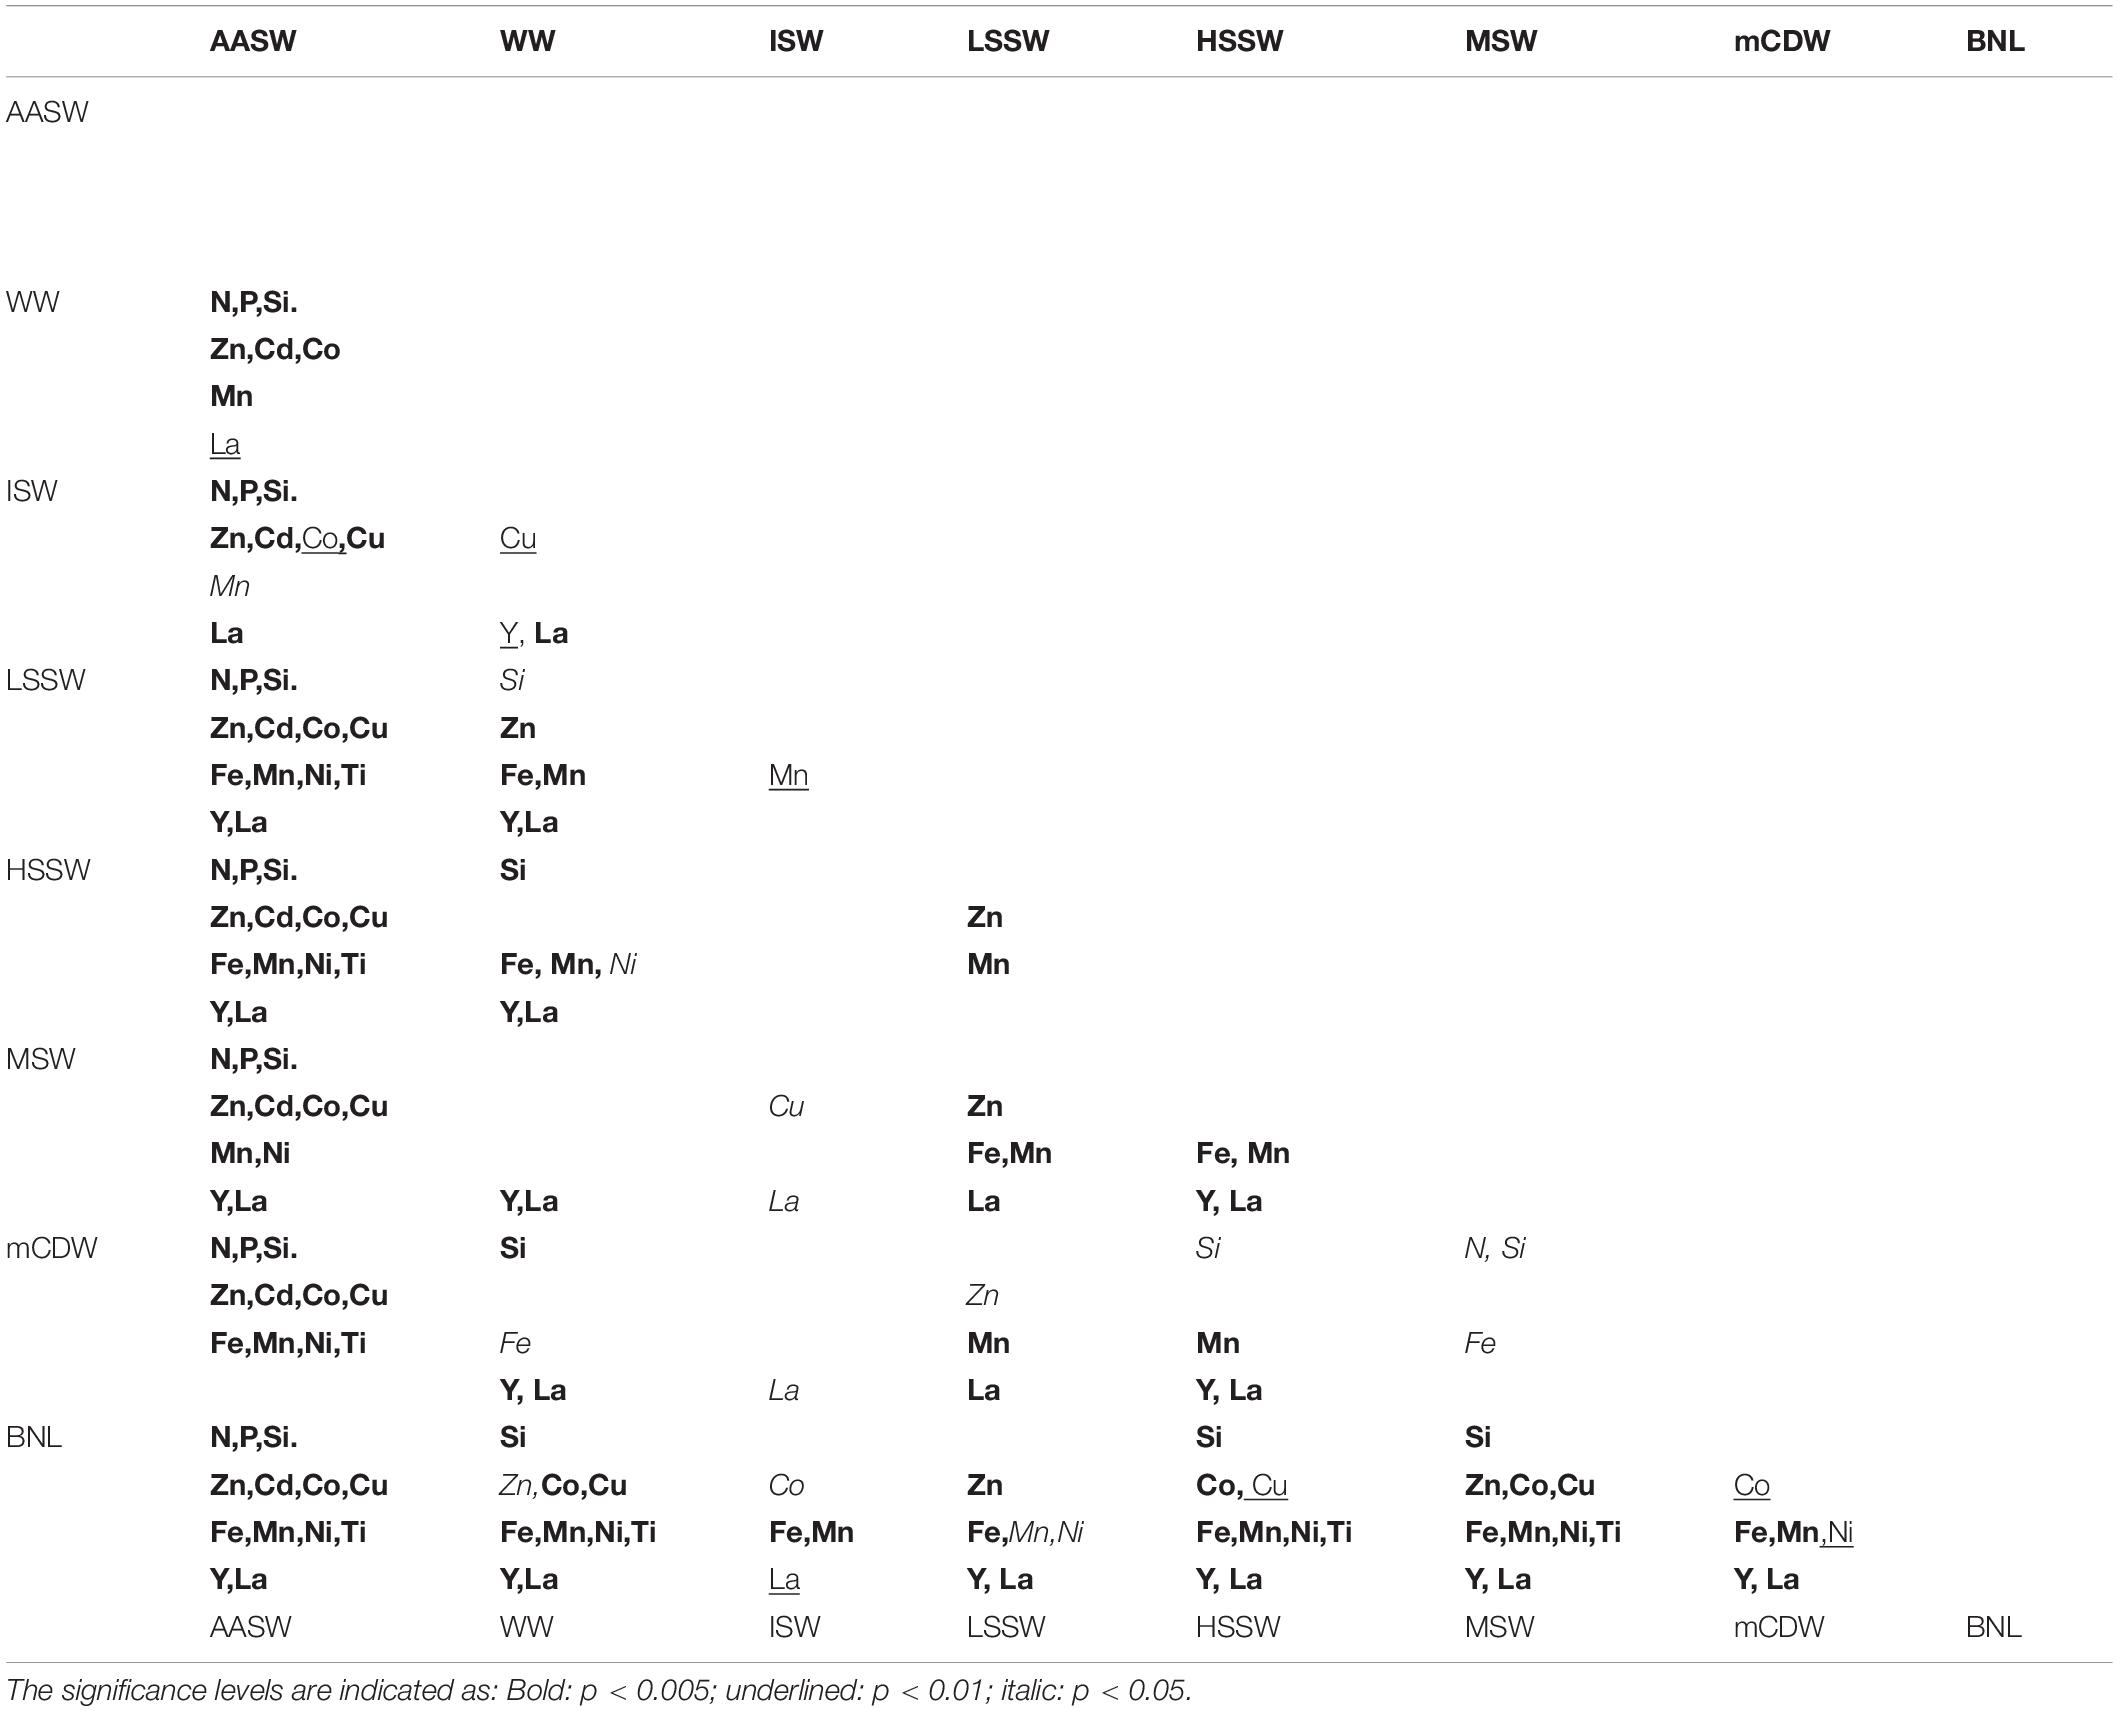
Table 3. Correlation significance levels of differences of macro-nutrients and dissolved metals between the water masses.
ML and AASW
All dissolved metals, except DPb, had significantly lower concentrations in the AASW and ML compared to deep water masses, similar to the macro-nutrients (Figure 3, Tables 2, 3). No differences existed between average dissolved metal concentrations in the ML and the overall AASW that includes the ML (Tables 2, 3). For DFe, the concentrations were not only extremely low in the AASW but in the whole upper 200 m (Figures 3J, 4E). For DCu, DNi, DTi, DY and DLa, the difference between surface and deeper water masses was relatively small (Tables 2, 3, Figures 3, 4, 6).
Stations sampled earlier in the season, in the eastern Ross Sea and stations close to the Ross Ice Shelf (St. 44, 45), had less pronounced surface minima for most metals, whereas even surface maxima existed here for DNi, DY and DLa. St.17 in the eastern Ross Sea exhibited constant DZn, DCd, and DCo concentrations with depth (Figures 4, 5).
WW
During the cruise, WW was present only in the center of the polynya (St. 48–65, 75, 85 and 113). Like the macro-nutrients, DZn, DCd, and DCo increased steeply with depth in WW, with DZn increasing from 2.32 (±1.37) in ML to 5.23 ± 0.42 in WW (Table 2, Figures 3–6). Other metals, such as DCu, DMn, DNi, and DTi, also increased, but not as steeply, resulting in non-significant differences in concentration between WW and AASW. However, DFe had equal concentrations and DY and DLa appear to have lower concentrations in WW compared to AASW (Figures 3N,O; DY: 0.18 nM in AASW and 0.176 nM in WW; DLa:33 pM vs. 31 pM in AASW and WW, respectively). For DFe, this is most probably due to severe depletion by phytoplankton uptake, continuing into WW whereas for DY and DLa the apparent WW minimum is related to spatial trends. The WW was present only in the center of the polynya (St. 48–65, 75, 85, and 113), and here, average concentrations in AASW and WW were the same for both metals whereas concentrations outside the center of the polynya, where no WW was present, concentrations where relatively high in AASW. However, the concentrations of DY and DLa in AASW and WW together were significantly lower than in the deeper water masses.
Shelf Waters ISW, LSSW, HSSW, and MSW
A BNL was present predominantly in the HSSW, as shown by the salinity (Figure 3D), and only at two stations (St. 49 and 59) in MSW. Because of the high metal concentrations in the BNL, especially for DFe and DMn, the BNL samples were treated as a separate “water type” in order to distinguish the specific BNL metal source. Dissolved metal concentrations in ISW were not significantly different from those in other water masses with the exception of the BNL, which is probably due to the large variation within this water mass and the fact that it was sampled only four times.
DZn, DCu, DFe, DMn, DNi, DTi, DLa, and DY had elevated concentrations in the shelf water masses, with generally lower concentrations in MSW relative to the other shelf water masses, probably due to mixing with overlying AASW and WW. DZn showed higher concentrations in ISW and LSSW compared to the other shelf water masses; notably, DZn was significantly higher in LSSW than in HSSW, but it must be noted that this trend is based only on 14 samples in LSSW vs. 127 samples in HSSW (Figure 3F, Table 3). Moreover, the DZn concentrations were higher and the variation was larger in the eastern north-south part of the Ross Sea circle transect (St. 20–60) compared to the western north-south transect (St. 75–113) (Figure 4A at 0–500 km). Akin to DZn, variation in DCu along the eastern part of the transect was larger than along the western part of the transect. The variations within a water mass for DCu and DZn, were relatively large when compared to DCo or DCd (Figures 3F–I).
Concentrations of DFe, DMn, DLa, and DY were relatively high in LSSW (St. 16–18) and HSSW (mean DMn 1.40 ± 0.78 and 1.24 ± 0.50, respectively) (Table 2, Figures 3J,K,M,N) compared to MSW and, except for DFe, to mCDW. High DFe (>1.5 nM) probably showed influence of the BNL (Figure 3J), akin to the elevations in DCu and DZn. As already discussed for DFe (Gerringa et al., 2015), DMn decreased with increasing distance from the island along the Franklin Island transect at depths greater than AASW, indicating the island was a source of DMn that was laterally transported away from it. For DNi and DTi, the influence of shallow banks and a BNL as a source is less clear.
mCDW and BNL
The inflow of mCDW onto the shelf, characterized by higher temperatures and low oxygen (Figures 2, 3D), is seen in elevated Si(OH)4 and in relatively low DMn, DY, and DLa concentrations (Figures 3C,K,N,O; Tables 2, 3) when compared with HSSW. A slight increase in the DCd concentrations with depth is visible in Figure 4B at St. 46–64, where the mCDW was encountered, up to 0.78 ± 0.02 nM in the otherwise constant DCd in HSSW and MSW (0.72 nM, Table 2). DZn is slightly higher in mCDW than in HSSW, but DCo, DCu, DNi, and DTi have concentrations comparable to those in HSSW (Figures 3, 4).
The highest DCo, DCu, DFe, DMn, DNi, DTi, DY, and DLa concentrations were observed near the sediments in the BNL (Figures 3, 4). At most BNL stations, DCo increased toward the sediment, but only in samples taken closest to the sediment. For DFe and DMn, elevated concentrations were found near the bottom as well as further above the sediments, but always connected to the presence of a BNL.
Revisiting St. 31
The location of St. 31 was revisited again after 14 days as St. 114. During these 14 days, the temperature at a depth of 25 m (AASW) increased from −1.11 to −0.18°C and macro-nutrient concentrations decreased (NO3– from 24.2 to 17.5 μM), showing the progressive warming and associated nutrient uptake by phytoplankton. In AASW, the decrease in NO3–, PO43–, and Si(OH)4 was associated with a decrease in DZn, DCd, DCo, DCu, DMn, and DNi (Supplementary Figure S2). In the bottom layer of this particular station, the transmission decreased from 98.8% to 98.3% and the accompanying increase in thickness of the BNL was associated with elevated DFe, DMn, and DCu. For most metals, the concentration at mid depths was very similar between the two occupations, with the exception of DPb. This could indicate contamination for Pb, complicating interpretation of the Pb data.
Discussion
The Importance of Organic Complexation
Apart from direct sources and sinks, the competition between complexation by dissolved organic ligands and scavenging can be important in determining dissolved metal concentrations, notably DFe concentrations. When the Fe-binding dissolved organic ligands are saturated, the excess DFe concentration is not stable due to the low solubility product of Fe-oxyhydroxides (Liu and Millero, 2002) and Fe will be scavenged or precipitated, as has been demonstrated in the Ross Sea for this cruise data (Gerringa et al., 2019).
Although it is known that DZn, DNi, DCo and DCu form organic complexes (Bruland, 1989; Achterberg and Van Den Berg, 1997; Saito et al., 2004, 2010) no organic complexation data is available for the samples of this cruise. The concentrations and solubilities of DZn and DNi are probably not depending on organic complexation (Nimmo et al., 1989; Ellwood and Van den Berg, 2000; Saito et al., 2004; Baars and Croot, 2011) because the concentration and the strength of the ligand is relatively low. Saito et al. (2010) studied organic speciation of Co in the Ross Sea during spring and concluded that both the strong Co(III) and weaker, more labile, Co(II) organic complexes were present over the whole water column. These complexes were present in more or less constant ratios and did not change with depth, indicating that scavenging is probably not important in the Ross Sea, explaining the more or less constant deep DCo concentrations in our research, as also observed by Saito et al. (2010).
Although we have no information on the organic speciation of Cu in our samples, the relatively large variation in DCu in the shelf waters in our research might be explained by changes in organic complexation. Frache et al. (2001) observed a release of particulate Cu from melting pack ice in the Ross Sea, which was followed by an increase in the dissolved phase 10 days later. The production of Cu binding organic ligands like thiols by algal blooms contribute to seasonal differences in DCu and might increase the solubility (Whitby et al., 2018) and thus aid in the partitioning from the particulate to the dissolved phase. It seems plausible that after opening up of the Ross Sea Polynya, the partitioning of Cu between the dissolved and particulate phase released from sea ice and the Ross Ice shelf face, was not yet at a steady state since primary productivity and thus ligand production were still increasing. Given that the eastern south-north part of our Ross Sea Polynya transect was sampled early, it can be assumed that steady state had not yet been reached. The western north-south part of the Ross Sea Polynya was sampled later and these data showed considerably less variation and smooth mixed-type profiles, i.e., low concentrations at the surface and an increase near the bottom (Figures 4D, 5G, 6G), implying steady state had been reached by the time of sampling.
Sources and Sinks Related to Primary Productivity
All metals except DPb, had their lowest concentrations in AASW and concentrations increased with depth. Remineralization of organic material was probably an important source responsible for the increase (Orians et al., 1990; Bau et al., 1995; Hendry et al., 2008; Bown et al., 2011; Croot et al., 2011; Middag et al., 2013, 2020; Bruland et al., 2014). The highest concentrations for all nutrients in the AASW and ML, both macro and micro, were measured at the stations sampled earlier in the season (St. 16–18) and those close to the Ross Ice shelf (St. 44, 45) where primary productivity was low and indeed was just starting. Specifically, at these stations the nutrient-type trace metals Zn, Cd, and Co failed to show the classic nutrient type distribution, although DFe showed a slight surface minimum at these stations from early season depletion (Sedwick et al., 2011; Gerringa et al., 2015; Figure 5H). Our second visit to the position of St. 31 two weeks later (St. 114 for second occupation) showed the development of a nutrient type profile, with relatively depleted surface concentrations. The revisit also showed a surface water decrease for DTi, suggesting that Ti was most likely passively adsorbed onto settling organic particles (Dammshäuser et al., 2011). Although DY and DLa showed a nutrient type depth distribution (Figures 3N,O, 6L,M), they are not known to be micro-nutrients for primary producers and the nutrient type profile shape has been explained by passive adsorption (Nozaki et al., 1997; Nozaki, 2001). Also at St. 31, a nutrient type profile was observed in DLa and the surface DLa concentration was further depleted at the time of the revisit, indicating that adsorption onto organic matter indeed plays an important role in the cycling of La. In contrast, the revisit showed almost no change in DY, which is less susceptible to scavenging due to its smaller size compared to La (Shannon, 1976; Nozaki, 2001).
In addition to being limited by light, primary production in the Ross Sea is limited by DFe and possibly DMn availability (Wu et al., 2019). Most bio-active metals are not fully depleted in the Ross Sea, but notably, Ni is relatively high in AASW (average 6.71 nM vs. 7.19 in HSSW), consistent with other observations in the global oceans (Morel et al., 2014; Middag et al., 2020). However, macro-nutrients and other trace elements such as Zn, Co, Cd and Cu can play a role in influencing phytoplankton growth or determining phytoplankton community composition (Sunda and Huntsman, 2000; Arrigo et al., 2003; Bertrand et al., 2007; Hoppema et al., 2007; Alderkamp et al., 2019). We observed significant relationships between the three macro-nutrients and DZn, DCo, DCd and DCu in the Ross Sea (Supplementary Table S1). The relationships in Table 4 are restricted to these four trace metals because their biogeochemistry is not strongly influenced by environmental processes other than uptake and release upon mineralization. Indeed DZn, DCd, DCu, and DCo, show linear relationships with the macro-nutrients, reflecting most probably phytoplankton uptake (Supplementary Table S1, Figure 8). Even though the role of Cd in biological processes is still unclear (Lane and Morel, 2000; Xu and Morel, 2013), this element strongly correlates with the macro-nutrients. For example, DCd decreased in experiments containing natural phytoplankton while this did not occur in the same setup with only the dissolved seawater (Mellett et al., 2018). In our study, good correlations existed between Cd and both NO3– and PO43–.
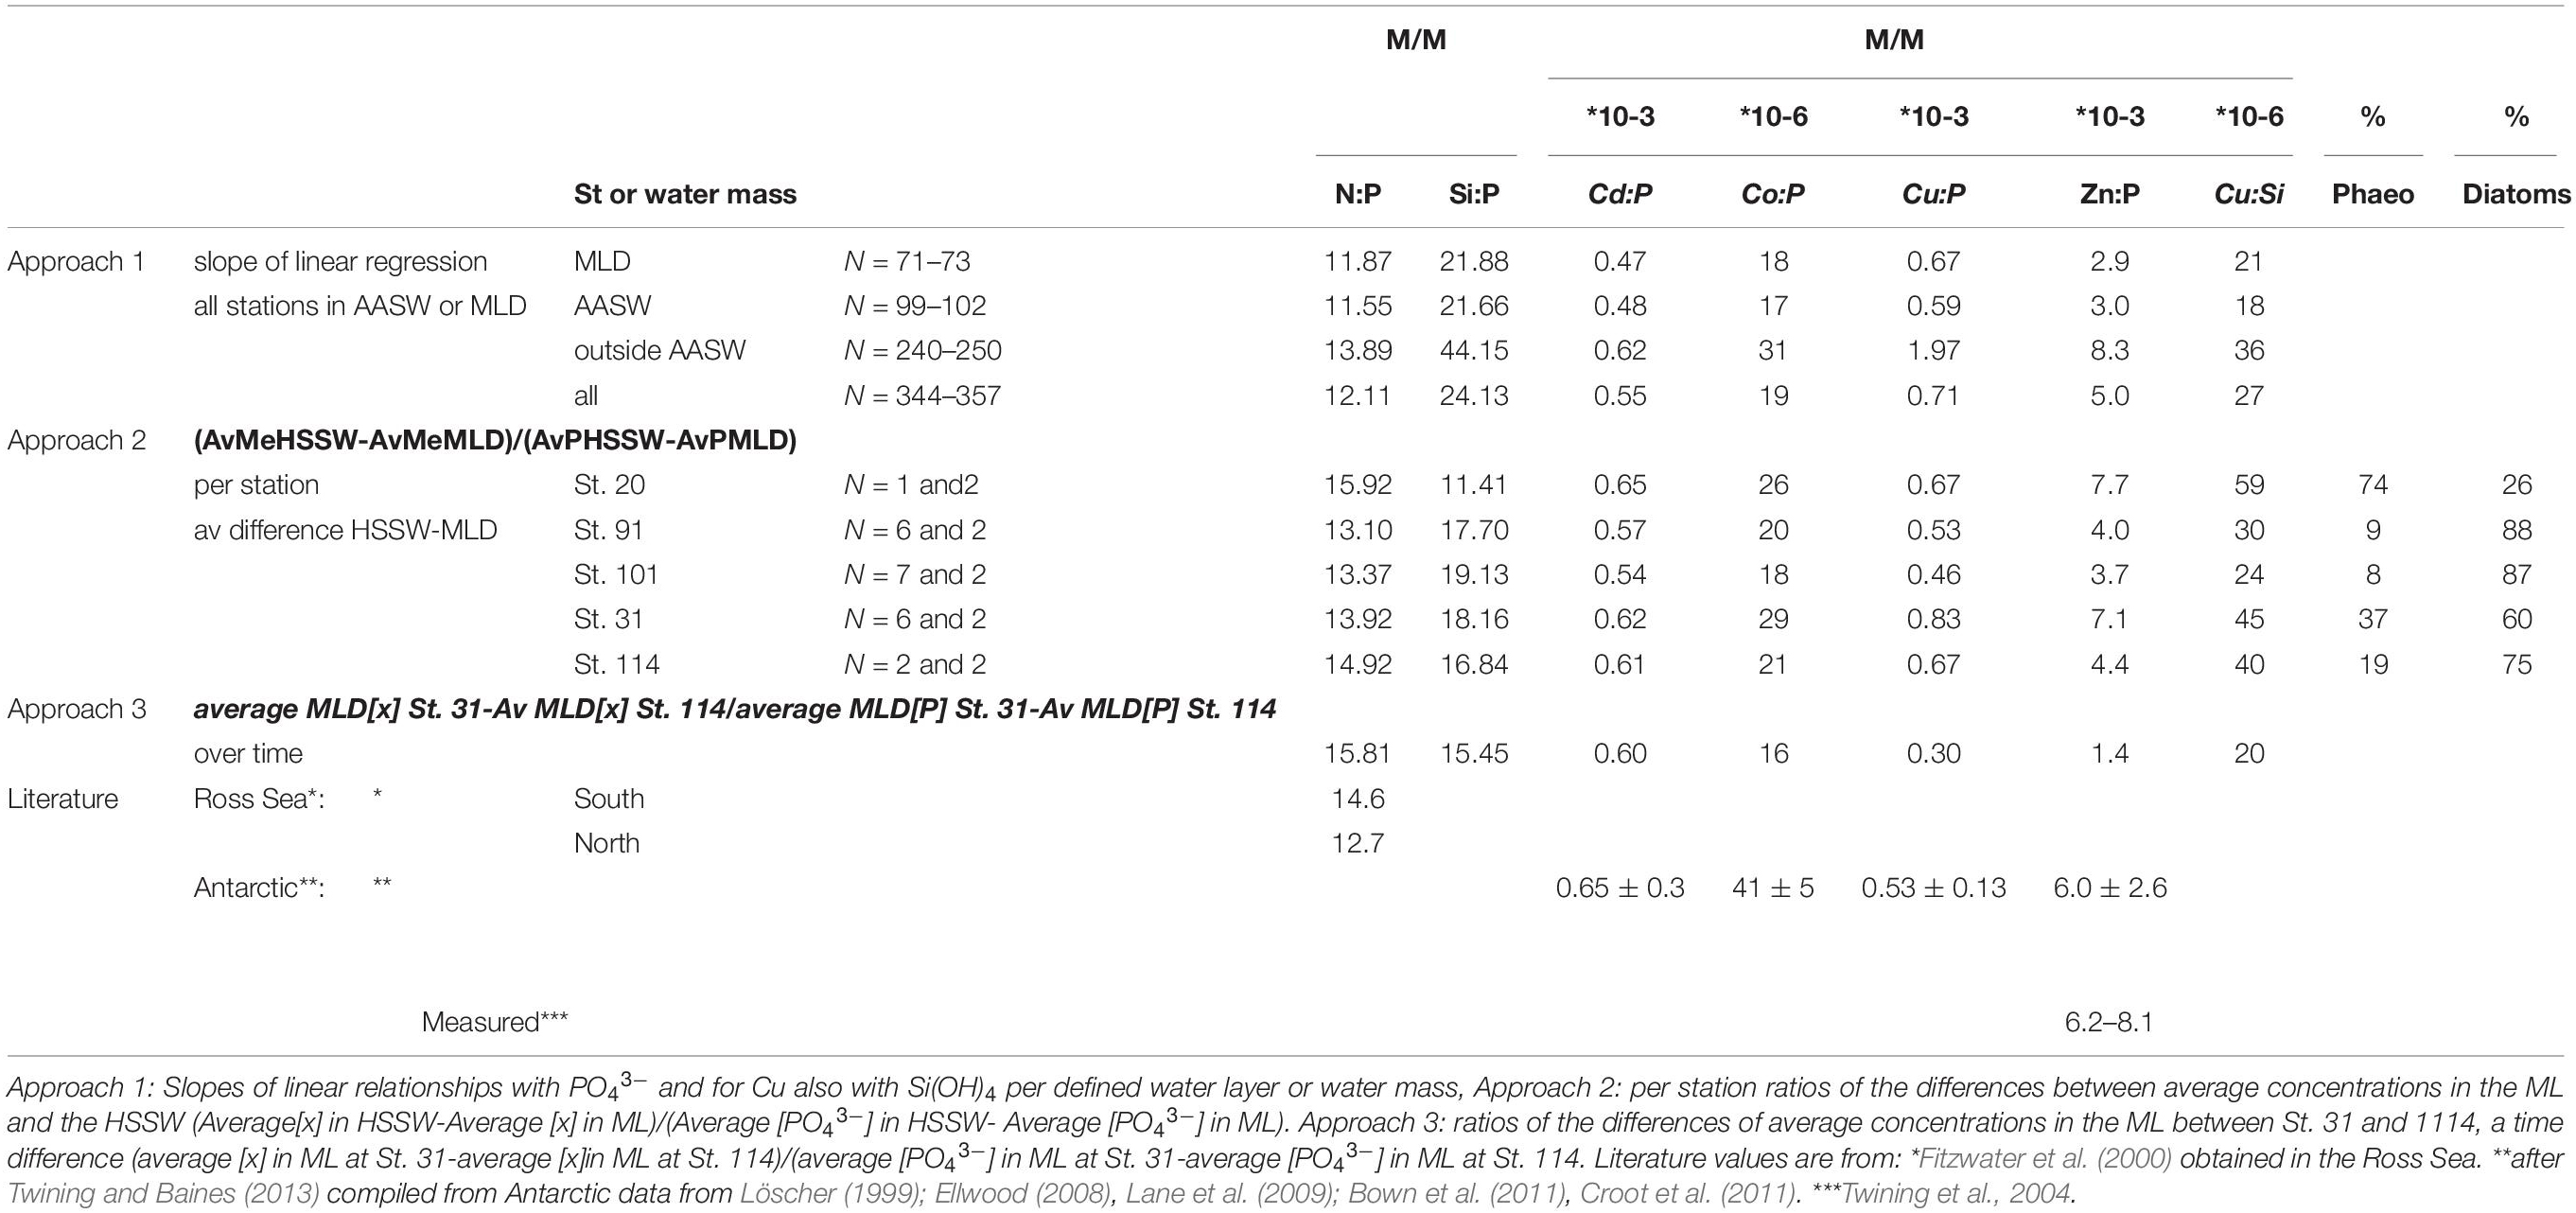
Table 4. Three approaches to determine uptake ratios of NO3– and Si(OH)4 (both in μM) and trace metals (in nM except Co, which is in pM, giving mM M–1 and μM M–1, respectively) with respect to PO43– (in μM) and for Cu also with respect to Si(OH)4.
When nutrient concentrations are influenced by phytoplankton growth, we expect the changes in concentrations to reflect phytoplankton elemental stoichiometry (Redfield et al., 1963; Sunda and Huntsman, 2000; Saito et al., 2010; Twining and Baines, 2013). However, mixing is also known to lead to relationships between nutrients that can be linear (Middag et al., 2018, 2019, 2020). As observed in other ocean basins, the macro-nutrients NO3– and PO43– in the Ross Sea correlate better with each other than with Si(OH)4 (Supplementary Table S1, Figure 7). All macro-nutrient-relationships showed a discontinuity at approximately 100 m, at the bottom of AASW or in WW [at approximately 75 μM Si(OH)4, 30 μM NO3–, and 2 μM PO43–; Figure 7]. Discontinuities were also present in the relationships between the four trace metals, DZn, DCo, DCd and DCu, and PO43– (Figure 8), Si(OH)4, and NO3– (Supplementary Table S1), although the change in slope in the Cd-P relationship was small (Figure 8B). All slopes, except in the Cd-P relationship, increased from AASW to deeper water masses, indicating processes affecting nutrient concentrations in the AASW, most probably biological uptake and release by decomposition, are different from those that affect the concentrations in the deeper water masses (Frew and Hunter, 1992; Xie et al., 2015; Saito et al., 2017; Middag et al., 2018, 2019; Vance et al., 2019).
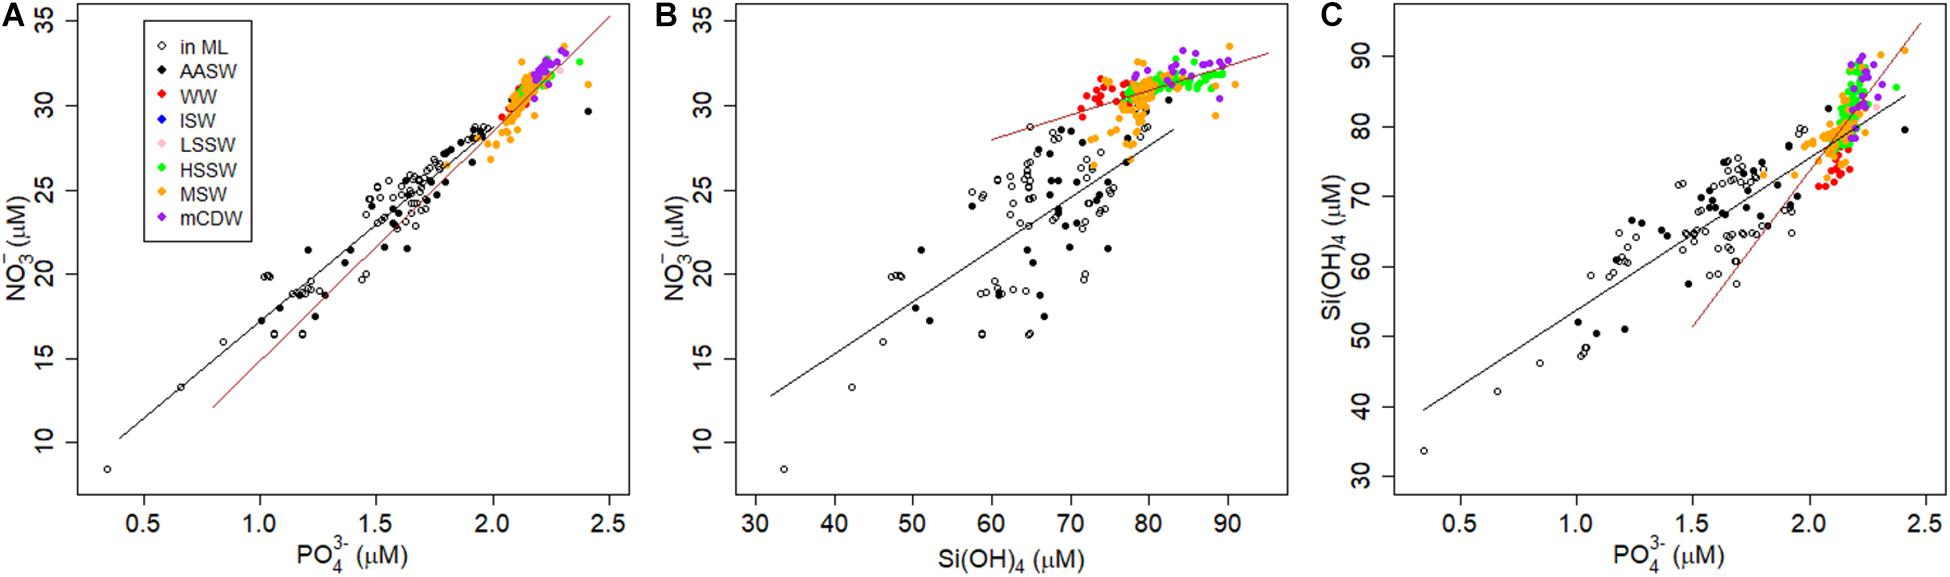
Figure 7. Macro-nutrient property-property plots in μM of all stations. (A) NO3– vs. PO43–, (B) NO3– vs. Si(OH)4, (C) Si(OH)4 vs. PO43–. Colors indicate water mass, open symbols are samples in AASW from within the ML, filled symbols in AASW are from below the MLD. Lines depict the linear regressions inside (black lines) and outside AASW (brown lines) (Supplementary Table S1).
In our results, DZn correlated best with PO43– and NO3–, and although still significant, less so with Si(OH)4 (Pearson correlations r = 0.88, 0.87, and 0.83; linear regressions R2 = 0.75, 0.76, and 0.69, respectively) (Supplementary Table S1, Figure 8A). Also, in the relationships of Zn with the macro-nutrients, a clearly visible discontinuity at DZn concentrations above ∼4 nM exists, where the macro-nutrients remain relatively constant (between AASW and other water masses, at 3–4 nM DZn, see also above) but DZn and Si(OH)4 increased. The discontinuity in the DZn and Si(OH)4 relationship is less obvious (Supplementary Table S1). The upper part of the nutrient like profile of DZn is thus caused by biological uptake and release by degradation taking place in the AASW, deeper DZn in influenced by other processes.
Samples in the ML were assessed separately from the overall AASW as well (N = 73 for ML, N = 102 for AASW, Table 2 and Supplementary Table S1). DCo, DCd and DZn correlated well with all macro-nutrients, but best with PO43–, with only DCu correlating best with Si(OH)4 (Supplementary Table S1, Figure 8E). That is why for the relation with primary productivity in the following paragraphs, in both the overall AASW as well as the ML, we focus on uptake ratios relative to phosphorus, but for DCu also with respect to Si(OH)4 (Supplementary Table S1).
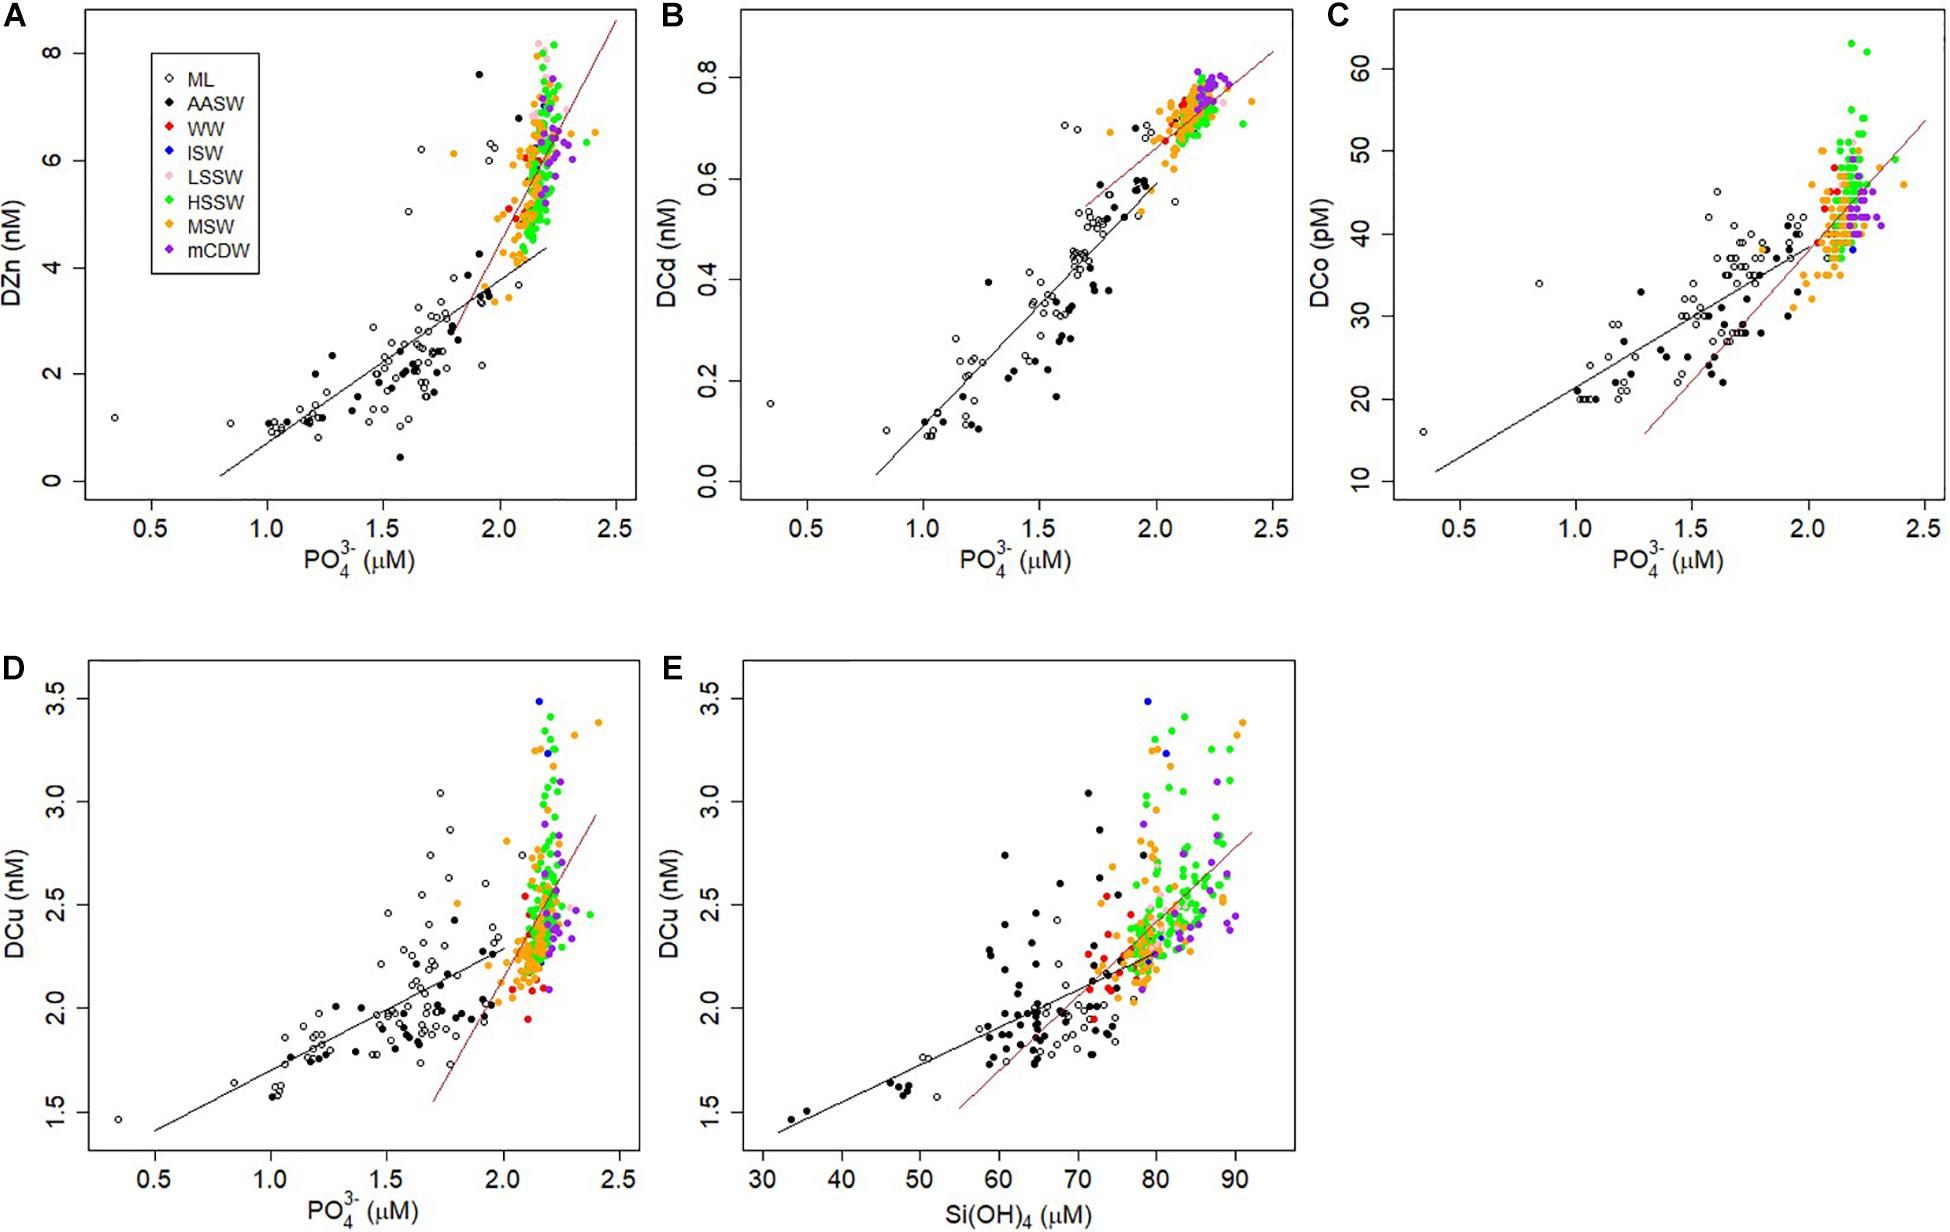
Figure 8. Plots of the distributions of trace metals (nM or pM) vs. PO43– (A–D) or Si(OH)4 (E) (μM) of all stations. (A) DZn, (B) DCd, (C) DCo, (D) DCu. Colors indicate water mass, open symbols are samples within the ML, filled symbols in AASW are from below the ML. Lines reflect the linear regressions Supplementary Table S1) between the parameters, in black for samples from AASW, in brown for samples outside AASW.
Overall, the presence of discontinuities in the relationships between macro-nutrients and trace metals implies that local uptake and remineralization are not the only processes, determining the slopes of the relationships in the ML and AASW. Therefore, we used three approaches to assess the stoichiometry of phytoplankton uptake:
(1) The slope of the linear regression in the ML and AASW for all stations.
(2) For the stations from which we have information on phytoplankton community composition (St. 20, 91, 101, and 114), we calculated deficits for each nutrient by subtracting the average ML concentrations from deep water average concentrations (Alderkamp et al., 2019). For the latter, we used the average concentrations in HSSW, the deep water present at these stations (Table 2) and assumed that the deficits were due to consumption. We divided deficits for each micro-nutrient by the deficit calculated for PO43–, or in case of DCu, also by the deficit in Si(OH)4. Station 31 was added to this approach for a better comparison with approach 3, even though the phytoplankton composition was not known.
(3) For the re-occupied station (St. 31 and 114), by calculating the decrease in average nutrient concentrations within the ML over the two weeks between the successive occupations, and dividing the change in metal concentrations by the change in PO43– or Si(OH)4 concentration.
With the exception of DCo, the derived uptake ratios of the first two approaches compared relatively well with P-normalized stoichiometries reported previously (Saito et al., 2010; Bown et al., 2011); indicating that the approaches mostly give representative results (Table 4). The correlations and average values in the ML did not differ significantly from those in the AASW. With the exception of St. 20, the second approach for specific stations resulted in uptake ratios that compare reasonably well with the results of approach 1 (based on all stations), only Zn:P was higher at St. 31 (approximately 7 mM M–1 close to 7.7 mM M–1 at St. 20 versus 2.9–4.4 mM M–1 of approach 1 and St. 91, 101, and 114, Table 4). The uptake ratios at St. 20, where the community consisted of only 26% diatoms, are distinctly different from the other stations and approach 1. Station 20 was sampled in an earlier stage of the bloom compared to the other stations, in date of sampling but also in days after being ice free, and had lower POC (maximum POC concentrations = 47 μM at St. 20 versus 47, 58, and 52 μM at the other stations 31–114). Uptake ratios should not be affected by changes in biomass unless there is a coinciding change in community composition. Uptake ratios compensate for changes in biomass. For St. 20, the lower Si:P uptake ratio together with the higher Cu:Si, correspond with little Si(OH)4 consumption due to the low contribution of diatoms to the overall community. In the Ross Sea, the N:P uptake ratio of diatoms is 9.52, whereas for P. antarctica the ratio is 19 (Arrigo et al., 2000, 2003), illustrating the influence of the phytoplankton population on macro-nutrients and this influence is now also evident for trace metal uptake ratios in the study region.
The results of the third approach, using the change over time at the position of St. 31 and 114, compared less favorably with those of approaches 1 and 2. Except for Cd, the uptake ratios were lower when using approach 3 compared to both the other approaches and the literature values. Possibly, a local surface source of Zn, Co, and Cu contributed to the surface concentrations in between visits, with sea ice melting being the most probable source, since sea ice melting is not a Cd source (see section 4.2.3) or lateral transport.
Nevertheless, overall all three approaches compared reasonably well within the variation known from other studies and these current results provide an opportunity for additional insight into uptake ratios related to the phytoplankton community composition. According to Hendry et al. (2008), the plankton community influences the Cd:P ratio. Indeed, we do see that our Cd:P uptake ratio decreased significantly (Pearson correlation, p < 0.05) from 0.65 to 0.54 mM M–1 with increasing % diatoms (Table 4). Saito et al. (2010) suggested that diatoms take up more Co than P. antarctica, but in contrast, we find that the derived Co:P uptake ratio was higher at P. antarctica-dominated St. 20 and lower at the diatom dominated St. 101. This discrepancy might be explained by differences in Fe stress that also influence metal:P uptake (Sunda and Huntsman, 2000; Cullen et al., 2003; Lane et al., 2009). Additionally, there is a large range in Co:P uptake ratios reported for various regions ranging between 23 μM M–1 from subantarctic waters reported by Dulaquais et al. (2014a), 38 μM M–1 in the Ross Sea, (Saito et al., 2010) to 44–49 μM M–1 north of the polar front (Bown et al., 2011) Our Co:P uptake ratio was 18 μM M–1 in the ML using approach 1 and 18–29 μM M–1 using approach 2, with generally lower ratios in diatom dominated stations (St. 91 and 101) consistent with the conclusion that diatoms need less Co to grow (Sunda and Huntsman, 1995), but no significant relationship between Co:P and the % diatoms existed.
As well established in other ocean regions (Bruland et al., 1991; Morel et al., 1994; Arrigo et al., 2000; Sunda and Huntsman, 2000; Hendry et al., 2008; Bown et al., 2017; Saito et al., 2017) and also in the Ross Sea, the Zn, Co and Cu cycles are influenced by phytoplankton. This is apparent from changes in the slopes and uptake ratios, which were possibly influenced by the phytoplankton composition, as shown by the significant relationship between the Cd:P uptake ratio and the % of diatoms present in the Ross Sea Polynya and the results from St. 20, the station with mostly P. antarctica. In AASW, Fe or Zn limitation is known to influence relative uptake ratios between the macro- and micro-nutrients (Sunda and Huntsman, 2000; Cullen et al., 2003; Cullen, 2006; Lane et al., 2009). DFe was shown to be limiting in the Ross Sea during our cruise (Alderkamp et al., 2019), but DZn concentrations of 2.32 ± 1.37 nM in AASW (N = 100, DZn < 1 nM for N = 7) were probably not limiting phytoplankton growth. It is likely that the influence of Fe limitation on uptake ratios is different between P. antarctica and diatoms and that Fe limitation is more severe later in the season.
Ice Melt
In our data, indications for sea ice melt as a possible source were present for all metals, even for DPb, although it was not always apparent. The water column was well mixed at the stations sampled earlier in the season in the eastern Ross Sea and at stations near the Ross Ice Shelf, especially at St. 17, 44, and 45, obscuring whether sources were ice melt or the sediment. Salinity and dissolved metal concentrations did not co-vary, except for DCu, DY and DLa. These latter metals showed non-significant, positive relationships (data not shown), similar to salinity versus the macro-nutrients. If melt were a significant source, a negative relationship with salinity would exist, indicating that any evidence of sea ice melt release is probably hidden by processes of phytoplankton growth and mixing of surface and deep water masses.
For both DY and DLa, a higher concentration was observed in AASW outside the center of the polynya, where no WW was present (Figure 3). Since DY and DLa are not used by phytoplankton, a release from melting sea ice and/or the Ross Ice Shelf could explain the small surface maxima in AASW compared to the lower WW concentrations, as release from melt would occur predominantly in spring and early summer, our sampling period. Thereafter, the concentrations would decrease during summer and early fall by passive adsorption and sedimentation, thus causing the lower concentrations conserved in WW, as the WW concentrations should be more representative of concentrations in those seasons.
We do see indications for the melting Ross Ice Shelf as a source of Pb, as higher concentrations occurred at the southern end of the two transects. However, given that the concentrations were only slightly elevated and concentrations overall were close to the detection limit, no estimates of the magnitude of this source were attempted. Moreover, the DPb data from the first stations had to be discarded due to suspected Pb contamination as a decrease in concentrations was observed with every station sampled and no probable biogeochemical process for such a decrease could be identified. Most likely the Go-Flo samplers became cleaner with every deployment. However, since at the final stations of the expedition in the Ross Sea Polynya, concentrations increased again with decreasing distance from the ice shelf, we decided to incorporate the Pb data in this paper and suggest that in the Ross Sea, ice shelf melt indeed is a source for DPb. This source would be a combination of both naturally sourced Pb as well as anthropogenic Pb deposited on the ice sheet. Although concentrations of DPb were relatively low, this does not automatically mean that the DPb was solely derived from natural sources. Flegal et al. (1993) concluded, based on the isotopic composition of DPb, that DPb near the Antarctic Peninsula was for a significant part derived from industrial sources despite decreases in contamination of Antarctic ice over the last decades. According to Ndungu et al. (2016), 60–95% of Pb in the Amundsen Sea has a natural source. As far as we know, no information exists on the origin of DPb in the Ross Sea, but it seems reasonable to assume a similar contribution of a natural source for the Ross Sea.
The identification of sources of metals into AASW and quantification of such fluxes, for example the opening of the polynya, the timing of brine release, melting of the Ross Ice Shelf, or dust input, can be difficult because of immediate uptake by micro-organisms or sorption onto (biogenic) particles. An indirect indication of input from ice melt can be the disturbance or deviation from the relationship between metals with other nutrients, as shown schematically by Noble et al. (2008); their Figure 8), assuming the ice melt source supplies the nutrients in a different ratio than the biological stoichiometry. The correlations of DZn, DCd, and DCo with PO43– (Figures 8A–C), reveal data points in AASW deviating from the regression where DZn, DCd, and DCo were high relative to PO43–, and these were all from the stations 16–18 with very low phytoplankton growth. The highly deviating metal concentrations were probably due to input from melting ice (Figure 8A as example: DZn > 4 nM where PO43– = 1.5–2 μM). Additionally, samples from St. 59 in the polynya also deviated from the general regressions. Here, an explanation is not directly apparent, but the elevated concentrations might be due to release from detached floating sea ice. Deviations in the DCu:PO43– correlation occurred also in St. 43 to 45, near the Ross Ice Shelf probably due to slow reaction kinetics of Cu. Frache et al. (2001) showed the importance of melting pack ice on DCu concentrations. As discussed above (section 4.2.1), the lack of steady state or equilibrium between release of Cu and Cu-binding by organic ligands or scavenging probably explains variation in DCu.
Another indication of ice melt as a source of metals are elevated concentrations in shelf water masses. DFe, DMn, DZn, DCo, DY, and DLa concentrations were elevated in LSSW and DCu, DY, and DLa concentrations were relatively elevated in ISW. But as noted earlier, the number of samples in these water masses was low with a rather large variability in concentrations, and therefore the concentration differences from other water masses were not significant (Table 3). Concentrations of DFe, DMn, DNi, DY, and DLa were higher in HSSW. Increased concentrations in HSSW may be influenced by the sediment. Overall, ice melt is a likely source of dissolved metals in the Ross Sea Polynya and isotopic compositions or other proxies would be a great help in future studies to constrain meteoric input.
Lateral and Vertical Input and Losses Due to Scavenging
Along the Ross Sea Polynya transect, St. 60–65 were sampled from the top of Pennell Bank (St. 60) and into Joides Trough (St. 61–65) to study lateral fluxes from banks as shown by Sherrell et al. (2015) for DMn (Supplementary Figure S3). We did not detect trends in concentrations that suggested lateral input from banks. However, DMn did decrease from 0.7 to 0.13 nM over a distance of 50 km from Franklin Island at depths between 100 and 400 m (Figure 6I), indicating lateral transport of elevated concentrations of Mn from a point source. Here also lateral transport of DFe was estimated (Figure 6H and Gerringa et al., 2015). Assuming lateral diffusion and subsequent dilution from a point source, as done for DFe, the decrease should be exponential. An exponential decrease occurred in the depth layer around 400 m (0.7 nM/50 km), although the fit was modest (R2 = 0.36). For DFe, the exponential equation with distance best fit the data at approximately 300 m, whereas for DMn, an exponential decrease best fit the data at 400 m depth, where the scale length, a measure to express the influence of a point source, was 132 km. This implies that DMn decreased to 37% of the source concentration at 132 km distance from the source (Okubo, 1971). This results in an estimated flux at 100 km from Franklin Island of 2.3∗10–4 mol DMn per m2 per day, compared to 3.4∗10–5 mol DFe per m2 per day at the same depth (the best fit of the exponential decrease in DFe at 300 m attributed to a flux of 2.6∗10–5 mol DFe per m2 per day; Gerringa et al., 2015). Apparently, the flux of Mn was about ten times higher than for Fe, but note that this is a coarse estimate as the assumptions are apparently not completely fulfilled as shown by the modest fit. Probably other processes disturbed the assumption of dilution from a point source, such as losses through scavenging, vertical fluxes from the sediment, or the BNL in deep waters and phytoplankton uptake in the surface layer.
In the relatively shallow waters of the Ross Sea, we saw no indications of scavenging given that depth profiles of dissolved metals below the MLD and/or AASW were either constant or increased with depth, as was also observed by Saito et al. (2010) for DCo. Scavenging determines the decreasing depth profiles of DMn in the deep oceans (Bruland et al., 2014), but here in the relatively shallow Ross Sea, DMn increased with depth (Figures 4F, 6I). Even DTi, which is very reactive and sensitive to scavenging, and therefore has a short residence time in seawater (Orians et al., 1990; Skabral, 2006; Dammshäuser et al., 2011), increased slightly with increasing depth with a slope of about 10 pM/100 m (Figures 4H, 6K). This increase was small and not always visible in depth profiles for individual stations. Moreover, there is little grazing in the Ross Sea and thus relatively few fecal pellets (Caron et al., 2000; Smith et al., 2000; Tagliabue and Arrigo, 2003). Probably the low scavenging is due to a combination of the shallow depth, few fecal pellets and rapid recycling (Martin et al., 2013; Rijkenberg et al., 2014; Laglera et al., 2017, 2019), whereas the sediment source further obscures evidence of scavenging by increasing deep dissolved metal concentrations.
The sediment as a source for metals is most evident in the BNL, where especially DFe and DMn, but also DCu, DCo, DNi, DTi, DY, DLa and the macro-nutrient Si(OH)4 had significantly higher concentrations compared to HSSW and other deep water masses (Tables 2, 3, Figures 3, 4). Even a particle reactive element like Ti (Skabral, 2006; Dammshäuser et al., 2011) had higher dissolved concentrations in the BNL, although DTi remained the same in the BNL of St. 31 and 114 (Supplementary Figure S2). For DFe, the main supply to the ML proved to be the flux from the sediment, especially at shallow water depths with a BNL (Gerringa et al., 2015). Gerringa et al. (2015) calculated average vertical diffusive fluxes of 3.3 10–8 mol m–2 day–1 for DFe, being positively correlated to DFe in the BNL and negatively correlated with the water depth. Since the average absolute difference in nM for DMn between ML and BNL and ML and HSSW is slightly higher (1.4 nM DMn vs. 1 nM DFe and 0.6 nM DMn vs. 0.3 nM DFe, respectively), the average upward flux of DMn will amount an average of 5 to 6.6 10–8 mol m–2 day–1. A rough estimate of the Fe flux necessary to sustain the bloom was 4–91 10–8 mol m–2 day–1 (Gerringa et al., 2015) and since phytoplankton need less Mn per cell than Fe (approximately 20% according to Twining and Baines, 2013), the upward vertical diffusive flux of DMn would approximately meet the demand of the phytoplankton bloom observed during the cruise.
Relatively high concentrations of the macro-nutrients NO3–, PO43–, and Si(OH)4, as well as DCd indicate the incoming mCDW as a source in the Ross Sea, but for most the concentrations are not significantly higher than in the shelf water masses (Figure 3, Table 3). It is possible that winter mixing of the water masses over the Ross Ice Shelf obscures the input of other metals by the mCDW. However, the CTD oxygen content, DMn, DY, and DLa were significantly lower in mCDW than in the LSSW and HSSW and thus mCDW was probably not a source for these metals. The position of our cruise track with only a few stations crossing the inflow of mCDW, together with the small differences in concentrations of most metals between mCDW and the shelf water masses, hardly allows an interpretation of the consequences of the interplay between the currents and bathymetry (Reddy and Arrigo, 2006) for the distribution of dissolved trace metals.
Conclusion
In the Ross Sea Polynya, the cycles of Zn, Co, and Cu are shaped by phytoplankton demand, as shown by depth-dependent changes in correlation slopes and nutrient uptake ratios, which are probably influenced by phytoplankton community composition. Although the stoichiometric ratios of Zn, Cd, and Co relative to P were higher at a station dominated by P. antarctica, it is only for Cd, the element without a clear biological function, where a significant correlation between nutrient stoichiometry and the percentage of diatoms was observed.
The incoming mCDW had slightly higher concentrations of macro-nutrients and DCd compared to the shelf water masses and forms a source of these nutrients for the Ross Sea.
The stations sampled earlier in the season in the eastern Ross Sea, as well as some stations very close to the edge of the Ross Ice Shelf, were completely mixed from surface to bottom and did not show nutrient type profiles of the macro- and micro-nutrients. The input of Zn, Cd, Co, and Cu from ice melting was visible in elevated dissolved metal concentrations that deviated from correlations with the macro-nutrients. Sea ice melt is also a source of DLa and DY, possibly via dust deposition on the ice. Most likely, DLa and DY concentrations slowly decreased during summer due to passive adsorption, as reflected by the lower concentration in WW compared to AASW in spring and early summer.
Variable DCu concentrations near the Ross Ice Shelf point to a lack of steady state or equilibrium between release of DCu from melting sea ice and scavenging or binding by organic ligands. In the Ross Sea Polynya, however, scavenging does not influence dissolved metal concentrations noticeably, since no decrease with depth was observed for even the most scavenging-prone elements Mn and Ti.
As for DFe, sea ice melt releases DMn as can be concluded from elevated concentrations in shelf water masses compared to the mCDW, but the sediments are an additional important source for both. Concentrations of DFe and DMn, as well as DCo, DNi, DTi, DY and DLa were elevated in the BNL demonstrating the influence of the sediments. This led to elevated metal concentrations in HSSW that may be transported over the shelf into the circumpolar current, making the Ross Sea a source of these metals to the open ocean.
Data Availability Statement
The datasets presented in this study can be found in online repositories. The names of the repositories and accession numbers can be found below: https://dataportal.nioz.nl/doi/10.25850/nioz/7b.b.r and https://doi.org/10.25850/nioz/7b.b.g.
Author Contributions
PL and RM analyzed trace metals. All authors contributed to the text.
Funding
The US component of this research was sponsored by the National Science Foundation Office of Polar Programs (Phantastic ANT-1063592 to KA).
Conflict of Interest
The authors declare that the research was conducted in the absence of any commercial or financial relationships that could be construed as a potential conflict of interest.
Acknowledgments
The authors are most grateful to Captain John Souza and crew of R.V.I.B. Nathaniel B. Palmer, all Phantastic participants, as well as the excellent support by the Antarctic Support Contract (ASC) technicians. Nelleke Krijgsman (NIOZ) is acknowledged for making and re-making the composed figures.
Supplementary Material
The Supplementary Material for this article can be found online at: https://www.frontiersin.org/articles/10.3389/fmars.2020.577098/full#supplementary-material
References
Achterberg, E. P., and Van Den Berg, C. M. G. (1997). Chemical speciation of chromium and nickel in the western Mediterranean. Deep Sea Res. I 44, 693–720.
Alderkamp, A.-C., Van Dijken, G. L., Lowry, K. E., Lewis, K. M., Joy-Warren, H., van de Poll, W., et al. (2019). Effects of iron and light availability on phytoplankton photosynthetic properties in the Ross Sea. MEPS 621, 33–50. doi: 10.3354/meps13000
Arrigo, K. R., DiTullio, G. R., Dunbar, R. B., Robinson, D. H., Van Woert, M., Worthen, D. L., et al. (2000). Phytoplankton taxonomic variability in nutrient utilization and primary production in the Ross Sea. J. Geophys. Res. Oceans 105, 8827–8845.
Arrigo, K. R., and Van Dijken, G. L. (2003). Phytoplankton dynamics within 37 Antarctic coastal polynya systems. J. Geophys. Res 108:3271. doi: 10.1029/2002JC001739
Arrigo, K. R., Van Dijken, G. L., and Bushinsky, S. (2008). Primary production in the Southern Ocean, 1997–2006. J. Geophys. Res. 113:C08004.
Arrigo, K. R., Van Dijken, G. L., and Strong, A. L. (2015). Environmental controls of marine productivity hot spots around Antarctica. J. Geophys. Res. Oceans 120, 5545–5565. doi: 10.1002/2015JC010888
Arrigo, K. R., Worthen, D. L., and Robinson, D. H. (2003). A coupled ocean-ecosystem model of the Ross Sea:2. Iron regulation of phytoplankton taxonomic variability and primary production. J. Geophys. Res 108:3231.
Baars, O., and Croot, P. L. (2011). The speciation of dissolved zinc in the Atlantic sector of the Southern Ocean. Deep Sea Res. II 58, 2720–2732.
Baker, A. R., Jickells, T. D., Witt, M., and Linge, K. L. (2006). Trends in the solubility of iron, aluminum, manganese and phosphorus in aerosol collected over the Atlantic Ocean. Mar. Chem 98, 43–58. doi: 10.1016/j.marchem.2005.06.004
Bau, M., Dulski, P., and Möller, P. (1995). Yttrium and holmium in south pacific sewater: vertical distribution and possible fractionation mechanisms. Chem. Erde 55, 1–15.
Bertrand, E. M., Rose, J. M., Riesselman, C. R., Lohan, M. C., Noble, A. E., Lee, P. A., et al. (2007). Vitamin B12 and iron colimitation of phytoplankton growth in the Ross Sea. Limnol. Oceanogr. 52, 1079–1093.
Biller, D. V., and Bruland, K. W. (2012). Analysis of Mn, Fe, Co, Ni, Cu, Zn, Cd, and Pb in seawater using the Nobias-chelate PA1 resin and magnetic sector inductively coupled plasma mass spectrometry (ICP-MS). Mar. Chem. 130, 12–20. doi: 10.1016/j.marchem.2011.12.001
Blain, S., Quéguigiener, B., Armand, L., Belviso, S., Bombled, B., Bopp, L., et al. (2007). The effect of natural iron fertilization on carbon sequestration in the Southern Ocean. Nature 446, 1070–1075. doi: 10.1038/nature05700
Bown, J., Boye, M., Baker, A., Duvieilbourg, E., Lacan, F., Le Moigne, F., et al. (2011). The biogeochemical cycle of dissolved cobalt in the Atlantic and the Southern Ocean south off the coast of South Africa. Mar. Chem. 126, 193–206.
Bown, J., Laan, P., Ossebaar, S., Bakker, K., Rozema, P., and de Baar, H. J. W. (2017). Bioactive trace metal time series during Austral summer in Ryder Bay, Western Antarctic Peninsula. Deep Sea Res. II 139, 103–119.
Boyd, P. W., Arrigo, K. R., Strepzek, R., and van Dijken, G. L. (2012). Mapping phytoplankton iron utilization: insights into Southern Ocean supply mechanisms. J. Geophys. Res 117:C06009. doi: 10.1029/2011JC007726
Browning, T. J., Bouman, H. A., Henderson, G. M., Mather, T. A., Pyle, D. M., Schlosser, C., et al. (2014). Strong responses of Southern Ocean phytoplankton communities to volcanic ash, Geophys. Res. Lett 41, 2851-2857. doi: 10.1002/2014GL059364
Bruland, K. W. (1989). Complexation of zinc by natural organic ligands in the central North Pacific. Limnol. Oceanogr. 34, 269–285.
Bruland, K. W., Donat, J. R., and Hutchins, D. A. (1991). Interactive influences of bioactive trace metals on biological production in oceanic waters. Limnol. Oceanogr. 36, 1555–1577.
Bruland, K. W., Middag, R., and Lohan, M. C. (2014). “Controls of Trace Metals in Seawater,” in Treatise on Geochemistry 2nd Edn, Vol. 8, eds H. D. Holland and K. K. Turekian (Oxford: Elsevier), 19–51.
Buitenhuis, E. T., Timmermans, K. R., and de Baar, H. J. W. (1999). “Zinc-bicarbonate co-limitation of Emiliania huxleyi (Prymnesiophyceae),” in Interactions Between Emiliania Huxleyi And The Dissolved Inorganic Carbon System, ed. E. T. Buitenhuis (Groningen: University of Groningen), 42–49.
Butler, E. C. V., O’Sullivan, J. E., Watson, R. J., Bowie, A. R., Remenyi, T. A., and Lannuzel, D. (2013). Trace metals Cd, Co, Cu, Ni, and Zn in waters of the subantarctic and Polar Frontal Zones south of Tasmania during the ‘SAZ-Sense’ project. Mar. Chem. 148, 63–76.
Caron, D. A., Dennett, M. R., Lonsdale, D. J., Moran, D. M., and Shalapyonok, L. (2000). Microzooplankton herbivory in the Ross Sea, Antarctica. Deep Sea Res. II 47, 3249–3272.
Crawford, D. W., Lipsen, M. S., Purdie, D. A., Lohan, M. C., Statham, P. J., Whitney, F. A., et al. (2003). Influence of zinc and iron enrichments on phytoplankton growth in the northeastern subArctic Pacific. Limnol. Oceanogr. 48, 1583–1600.
Croot, P. L., Baars, O., and Streu, P. (2011). The distribution of dissolved zinc in the Atlantic sector of the Southern Ocean DSR II. Deep Sea Res. II 58, 2707–2719.
Cullen, J. T. (2006). On the nonlinear relationship between dissolved cadmium and phosphate in the modern global ocean: could chronic iron limitation of phytoplankton cause the kink. Limnol. Oceanogr. 51, 1369–1380.
Cullen, J. T., Chase, Z., Coale, K. H., Fitzwater, S., and Sherrell, R. M. (2003). Effect of iron limitation on the cadmium to phosphorus ratio of natural phytoplankton assemblages from the Southern Ocean. Limnol. Oceanogr. 48, 1079–1087.
Cullen, J. T., and Sherrell, R. M. (2005). Effects of dissolved carbon dioxide, zinc, and manganese on the cadmium to phosphorus ratio in natural phytoplankton. assemblages. Limnol. Ocea- nogr. 50, 193–1204
Dammshäuser, A., Wagener, T., and Croot, P. L. (2011). Surface water dissolved aluminum and titanium: tracers for specific time scales of dust deposition to the Atlantic? Geophys. Res. Lett 38, L24601. doi: 10.1029/2011GL049847
de Baar, H. J. W. (1994). von Liebig’s Law of the minimum and plankton ecology (1899–1991). Prog Oceanogr. 33, 347–386.
De Baar, H. J. W., Bacon, M. P., Brewer, P. G., and Bruland, K. W. (1985). Rare earth elements in the Pacific and Atlantic Oceans, Geochim. Cosmochim. Acta 49, 1943–1959. doi: 10.1016/0016-7037(85)90089-4
de Baar, H. J. W., Buma, A. G. J., Nolting, R. F., Cadée, G., Jacques, G., and Tréguer, P. (1990). On iron limitation of the Southern Ocean: experimental observations in the Weddell and Scotia Seas Mar. Ecol. Prog. Ser. 65, 105–122.
De Baar, H. J. W., and La Roche, J. (2003). “Metals in the oceans: Evolution, 1497 biology and global change,” in in Marine Scientific Frontiers for Europe, 1498, eds F. Lamy and G. Wefer (New York, NY: Springer), 79–105.
de Baar, H. J. W., Saager, P. M., Nolting, R. F., and van der Meer, J. (1994). Cadmium versus phosphate in the world ocean. Mar. Chem. 46, 261–281.
de Jong, J., Schoemann, V., Lannuzel, D., Croot, P., De Baar, H., and Tison, J.-L. (2012). Natural iron fertilization of the Atlantic sector of the Southern Ocean by continental shelf sources of the Antarctic Peninsula. J. Geophys. Res. 117:G01029. doi: 10.1029/2011JG001679
de Jong, J., Schoemann, V., Maricq, N., Mattielli, N., Langhorne, P., Haskell, T., et al. (2013). Iron in land-fast sea ice of McMurdo Sound derived from sediment resuspension and wind-blown dust attributes to primary productivity in the Ross Sea. Antarctica. Mar. Chem. 157, 24–40.
Dulaquais, G., Boye, M., Middag, R., Owens, S., Puigcorbe, V., Buesseler, K., et al. (2014a). Contrasting biogeochemical cycles of cobalt in the surface western Atlantic Ocean, Global Biogeochem. Glob. Biogeochem. Cycl. 28, 1387–1412.
Dulaquais, G., Boye, M., Rijkenberg, M. J. A., and Carton, X. (2014b). Physical and remineralization processes govern the cobalt distribution in the deep western Atlantic Ocean. Biogeosciences 11, 1561–1580. doi: 10.5194/bg-11-1561-2014
Dunbar, R. B., Leventer, A. R., and Mucciarone, D. A. (1998). Water column sediment fluxes in the Ross sea, Antarctica: atmospheric and sea ice forcing. J. Geophys. Res. 103, 30741-30759.
Dupont, C. L., Barbeau, K., and Palenik, B. (2008). Ni uptake and limitation in marine Synechococcus strains. Appl. Environ. Microbiol. 75, 23–31.
Ellwood, M. J. (2008). Wintertime trace metal (Zn, Cu, Ni, Cd, Pb and Co) and nutrient distributions in the Subantarctic Zone between 40–52?S; 155–160?E. Mar. Chem. 112, 7–17. doi: 10.1016/j.marchem.2008.07.008
Ellwood, M. J., and Van den Berg, C. M. G. (2000). Zinc speciation in the Northeastern Atlantic Ocean. Mar. Chem. 68, 295–306. doi: 10.1016/S0304-4203(99)00085-7
Fitzwater, S. E., Johnson, K. S., Gordon, R. M., Coale, K. H., and Smith, Jr. W. O (2000). Trace metal concentrations in the Ross Sea and their relationship with nutrients and phytoplankton growth. Deep Sea Res. II 47, 3159–3179. doi: 10.1016/S0967-0645(00)00063-1
Flegal, A. R., Maring, H., and Niemyer, S. (1993). Anthropogenic lead in Antarctic sea water. Nature 365, 242–244. doi: 10.1038/365242a0
Frache, R., Abelmoschi, M. L., Grotti, M., Ianni, C., Magi, E., Soggia, F., et al. (2001). Effects of Ice Melting on Cu, Cd and Pb Profiles in Ross Sea Waters (Antarctica), Intern. J. Environ. Anal. Chem. 79, 4301–4313. doi: 10.1080/03067310108044391
Frew, R. D., and Hunter, K. A. (1992). Influence of Southern Ocean waters on the cadmium–phosphate properties of the global ocean. Nature 360, 144–146. doi: 10.1038/360144a0
Gerringa, L. J. A., Alderkamp, A.-C., Laan, P., Thuróczy, C.-E., de Baar, H. J. W., Mills, M. M., et al. (2012). Iron from melting glaciers fuels the phytoplankton blooms in Amundsen Sea (Southern Ocean): iron biogeochemistry. Deep Sea Res. II 7, 16–31. doi: 10.1016/j.dsr2.2012.03.007
Gerringa, L. J. A., Alderkamp, A.-C., Laan, P., Thuróczy, C.-E., de Baar, H. J. W., Mills, M. M., et al. (2020). Corrigendum to “Iron from melting glaciers fuels the phytoplankton blooms in Amundsen Sea (Southern Ocean); iron biogeochemistry”. Deep Sea Res. II 170:104843. doi: 10.1016/j.dsr2.2020.104843
Gerringa, L. J. A., Laan, P., Arrigo, K. R., Van Dijken, G. L., and Alderkamp, A.-C. (2019). Fe-binding dissolved organic ligands in the Ross Sea. Mar. Chem. 215:103672. doi: 10.1016/j.marchem.2019.103672
Gerringa, L. J. A., Laan, P., Van Dijken, G. L., van Haren, H., De Baar, H. J. W., Arrigo, K. R., et al. (2015). Sources of iron in the Ross Sea polynya in early summer. Mar. Chem. 177, 447–459. doi: 10.1016/j.marchem.2015.06.002
Gordon, G. T., and Sullivan, C. W. (2008). Vitamin B12 and cobalt cycling among diatoms and bacteria in Antarctica sea ice microbial communities. Limnol. Oceanogr. 53, 1862–1877. doi: 10.4319/lo.2008.53.5.1862
Grasshoff, K. (1983). “Determination of nitrate,” in Methods of Seawater Analysis, eds K. Grasshoff, M. Erhardt, and K. Kremling (Weinheim: Verlag Chemie), 143–187.
Guo, J., Lapi, S., Ruth, T. J., and Maldonado, M. T. (2012). The effects of iron and copper availability on the copper stoichiometry of marine phytoplankton. J. Phycol. 48, 312–325. doi: 10.1111/j.1529-8817.2012.01133.x
Hatta, M., Measures, C. I., Lam, P. J., Ohnemus, D. C., Auro, M. E., Grand, M. M., et al. (2017). The relative roles of modified circumpolar deep water and benthic sources in supplying iron to the recurrent phytoplankton blooms above Pennell and Mawson banks, Ross sea, Antarctica. J. Mar. Syst. 166, 61–72. doi: 10.1016/j.jmarsys.2016.07.009
Hendry, K. R., Rickaby, R. E. M., de Hoog, J. C. M., Weston, K., and Rehkämper, M. (2008). Cadmium and phosphate in coastal Antarctic seawater: implications for Southern Ocean nutrient cycling Marine Chemistry. Mar. Chem. 112, 149–157. doi: 10.1016/j.marchem.2008.09.004
Hoppema, M., Middag, R., de Baar, H. J. W., Fahrbach, E., van Weerlee, E. M., and Thomas, H. (2007). Whole season net community production in the Weddell Sea. Polar Biol. 31, 101–111. doi: 10.1007/s00300-007-0336-5
Hu, H., Shi, Y., Cong, W., and Cai, Z. (2003). Growth and photosynthesis limitation of marine red tide alga Skeletonema costatum by low concentrations of Zn2+. Biotechnol. Lett. 25:1881. doi: 10.1023/B:BILE.0000003976.18970.cd
Klunder, M. B., Laan, P., Middag, R., de Baar, H. J. W., and van Ooijen, J. C. (2011). Dissolved iron in the Southern Ocean (Atlantic sector). Top. Stud. Oceanogr. 58, 2678–2694. doi: 10.1016/j.dsr2.2010.10.042
Laglera, L. M., Tovar-Sánchez, A., Iversen, M. H., González, H. E., Naik, H., Mangesh, G., et al. (2017). Iron partitioning during LOHAFEX: copepod grazing as a major driver for iron recycling in the Southern Ocean. Mar. Chem. 196, 148–161. doi: 10.1016/j.marchem.2017.08.011
Laglera, L. M., Tovar-Sánchez, A., Sukekava, C. F., Naik, H., Naqvi, S. W. A., and Wolf-Gladrow, D. A. (2019). Iron organic speciation during the LOHAFEX experiment: iron ligands release under biomass control by copepod grazing. J. Mar. Syst. 207:103151. doi: 10.1016/j.jmarsys.2019.02.002
Lagerström, M. E., Field, M. P., Séguret, M., Fischer, L., Hann, S., and Sherrell, R. M. (2013). Automated on-line flow-injection ICP-MS determination of trace metals (Mn, Fe, Co, Ni, Cu and Zn) in open ocean seawater: application to the GEOTRACES program. Mar. Chem. 155, 71–80. doi: 10.1016/j.marchem.2013.06.001
Lai, X., Norisuye, K., Mikata, M., Minami, T., Bowie, A. R., and Sohrin, Y. (2008). Spatial and temporal distribution of Fe, Ni, Cu and Pb along 140°E in the Southern Ocean during austral summer 2001/02. Mar. Chem. 111, 171–183. doi: 10.1016/j.marchem.2008.05.001
Landing, W. M., and Bruland, K. W. (1980). Manganese in the north pacific, earth planet. Sci. Lett 49, 45–56. doi: 10.1016/0012-821X(80)90149-1
Lane, E. S., Semeniuk, D. M., Strzepek, R. F., Cullen, J. T., and Maldonado, M. T. (2009). Effects of iron limitation on intracellular cadmium of cultured phytoplankton: Implications for surface dissolved cadmium to phosphate ratios. Mar. Chem. 115, 155–162. doi: 10.1016/j.marchem.2009.07.008
Lane, T. W., and Morel, F. M. M. (2000). Regulation of carbonic anhydrase expression by zinc, cobalt, and carbon dioxide in the marine diatom Thalassiosira weissflogii. Plant Physiol. 123, 1–8. doi: 10.1104/pp.123.1.345
Lannuzel, D., van der Merwe, P. C., Townsend, A. T., and Bowie, A. R. (2014). Size fractionation of iron, manganese and aluminium in Antarctic fast ice reveals a lithogenic origin and low iron solubility. Mar. Chem. 161, 47–56. doi: 10.1016/j.marchem.2014.02.006
Lee, J. G., and Morel, F. M. M. (1995). Replacement of zinc by cadmium in marine-phytoplankton. Mar. Ecol. Prog. Ser. 127, 305–309. doi: 10.3354/Meps127305
Liu, X., and Millero, F. J. (2002). The solubility of iron in seawater. Mar. Chem. 77:43. doi: 10.1016/S0304-4203(01)00074-3
Löscher, B. M. (1999). Relationships among Ni, Cu, Zn, and major nutrients in the Southern Ocean. Mar. Chem. 67, 67–102.
Löscher, B. M., de Jong, J. T. M., and de Baar, H. J. W. (1998). The distribution and preferential biological uptake of cadmium at 68W in the Southern Ocean. Mar. Chem. 62, 259–286. doi: 10.1016/S0304-4203(98)00045-0
Marchant, H. J. (2005). “Cyanophytes,” in Antarctic Marine Protists, eds F. J. Scott and H. J. Marchant (Canberra: Australian Biological Resources Study), 324–325.
Marsay, C. M., Sedwick, P. N., Dinniman, M. S., Barrett, P. M., Mack, S. L., and McGillicuddy, D. J. (2014). Estimating the benthic efflux of dissolved iron on the Ross Sea continental shelf. Geophys. Res. Lett. 41, 7576–7583. doi: 10.1002/2014GL061684
Martin, J. H., Fitzwater, S. E., and Gordon, R. M. (1990). Iron deficiency limits phytoplankton growth in Antarctic waters. Glob. Biogeochem. Cycles 4, 5–12. doi: 10.1029/GB004i001p00005
Martin, P., Van Der Loeff, M. R., Cassar, N., Vandromme, P., D’Ovidio, F., Stemmann, L., et al. (2013). Iron fertilization enhanced net community production but not downward particle flux during the Southern Ocean iron fertilization experiment LOHAFEX. Glob. Biogeochem. Cycles 27, 871–881. doi: 10.1002/gbc.20077
McConnell, J. R., Maselli, O. J., Sigl, M., Vallelonga, P., Neumann, T., Anschütz, H., et al. (2014). Antarctic-wide array of high-resolution ice core records reveals pervasive lead pollution began in 1889 and persists today. Sci. Rep. 4:5848. doi: 10.1038/srep05848
McDougall, T. J., Feistel, R., Millero, F. J., Jackett, D. R., Wright, D. G., King, B. A., et al. (2009). Calculation of The Thermodynamic Properties Of Seawater, Global Ship-Based Repeat Hydrography Manualin. IOCCP Report No 14, Paris: U.N.E.S.C.O.
McGillicuddy, D. J. Jr., Sedwick, P. N., Dinniman, M. S., Arrigo, K. R., Bibby, T. S., Greenan, B. J. W., et al. (2015). Iron supply and demand in an Antarctic shelf ecosystem, Geophys. Res. Lett 42, 8088–8097. doi: 10.1002/2015GL065727
Mellett, T., Brown, M. T., Chappell, P. D., Duckham, C., Fitzsimmons, J. N., Till, C. P., et al. (2018). The biogeochemical cycling of iron, copper, nickel, cadmium, manganese, cobalt, lead, and scandium in a California Current experimental study. Limnol. Oceanogr. 63, S425–S447. doi: 10.1002/lno.10751
Middag, R., de Baar, H. J. W., and Bruland, K. W. (2019). The relationships between dissolved zinc and major nutrients phosphate and silicate Along the GEOTRACES GA02 Transect in the West Atlantic Ocean. Glob. Biogeochem. Cycles 33, 63–84. doi: 10.1029/2018GB006034
Middag, R., de Baar, H. J. W., Bruland, K. W., and van Heuven, S. M. A. C. (2020). The distribution of nickel in the West-Atlantic Ocean, its relationship with phosphate and a comparison to cadmium and zinc. Front. Mar. Sci. 7:105. doi: 10.3389/fmars.2020.00105
Middag, R., de Baar, H. J. W., Klunder, M. B., and Laan, P. (2013). Fluxes of dissolved aluminum and manganese to the Weddell Sea and indications for manganese co-limitation. Limnol. Oceanogr. 58, 287–300. doi: 10.4319/lo.2013.58.1.0287
Middag, R., de Baar, H. J. W., Laan, P., and Huhn, O. (2012). The effects of continental margins and water mass circulation on the distribution of dissolved aluminum and manganese in Drake Passage. Geophys. Res. 117, doi: 10.1029/2011JC007434
Middag, R., Séférian, R., Conway, T. M., John, S. G., Bruland, K. W., and de Baar, H. J. W. (2015). Intercomparison of dissolved trace elements at the Bermuda Atlantic Time Series station. Marine Chemistry, 177, 476–489. doi: 10.1016/j.marchem.2015.06.014
Middag, R., van Heuven, S. M. A. C., Bruland, K. W., and de Baar, H. J. W. (2018). The relationship between cadmium and phosphate in the Atlantic Ocean unravelled. Earth Plane. Sci. Lett. 492, 79–88. doi: 10.1016/j.epsl.2018.03.046
Montsant, A., Allen, A. E., Coesel, S., Martino, A. D., Falciatore, A., Mangogna, M., et al. (2007). Identification and comparative genomic analysis of signaling and regulatory components in the diatom Thalassiosira Psuedonana. J. Phycol. 43, 585–604. doi: 10.1111/j.1529-8817.2007.00342.x
Morel, F. M. M., Milligan, A. J., and Saito, M. A. (2014). “8.5 - Marine Bioinorganic Chemistry: The Role of Trace Metals in the Oceanic Cycles of Major Nutrients,” in Treatise on Geochemistry (Second Edition), eds H. D. Holland and K. K. Turekian (Oxford: Elsevier), 123–150. doi: 10.1016/B978-0-08-095975-7.00605-7
Morel, F. M. M., and Price, N. M. (2003). The biogeochemical cycles of trace metals in the oceans. Science 300, 944–947. doi: 10.1126/science.1083545
Morel, F. M. M., Reinfelder, J. R., Roberts, S. B., Chamberlain, C. P., Lee, J. G., and Yee, D. (1994). Zinc and carbon co-limitation of marine phytoplankton. Nature 369, 740–742. doi: 10.1038/369740a0
Murphy, J., and Riley, J. P. (1962). A modified single solution method for the determination of phosphate in natural waters. Anal. Chim. Acta 27, 31–36. doi: 10.1016/S0003-2670(00)88444-5
Ndungu, K., Zurbrick, C. M., Stammerjohn, S., Severmann, S., Sherrell, R. M., and Flegal, A. R. (2016). Lead Sources to the Amundsen Sea. West Antarctica. Environ. Sci. Technol. 50, 6233–6239. doi: 10.1021/acs.est.5b05151
Nimmo, M., van den Berg, C. M. G., and Brown, J. (1989). The chemical speciation of dissolved nickel, copper, vanadium and iron in Liverpool Bay. Irish Sea. Estuar. Coast. Shelf Sci. 29, 57–74. doi: 10.1016/0272-7714(89)90073-5
Noble, A. E., Ohnemus, D. C., Hawco, N. J., Lam, P. J., and Saito, M. A. (2017). Coastal sources, sinks and strong organic complexation of dissolved Cobalt within the US North Atlantic Geotraces transect GA03. Biogeosciences 14, 2715–2739. doi: 10.5194/bg-14-2715-2017
Noble, A. E., Saito, M. A., Maiti, K., and Benitez-Nelson, C. (2008). Cobalt, manganese, and iron near the Hawaiian Islands: a potential concentrating mechanism for cobalt within a cyclonic eddy and implications for the hybrid-type trace metals. Deep Sea Res. II 55, 1473–1490. doi: 10.1016/j.dsr2.2008.02.010
Nozaki, Y. (2001). “Rare earth elements and their isotopes,” in Encyclopedia of Ocean Sciences, Vol. 4, eds J. Steele, S. Thorpe, and K. K. Turekian (London: Academic Press), 2354–2366. doi: 10.1006/rwos.2001.0284
Nozaki, Y., Zhang, J., and Amakawa, H. (1997). The fractionation between Y and Ho in the marine environment. Earth Planet.? Sci. Lett. 148, 329–340. doi: 10.1016/S0012-821X(97)00034-4
Okubo, A. (1971). Oceanic diffusion diagrams. Deep Sea Res. 18, 798–802. doi: 10.1016/0011-7471(71)90046-5
Orians, K. J., Boyle, E. A., and Bruland, K. W. (1990). Dissolved Ti in the open ocean. Nature 348, 322–325. doi: 10.1038/348322a0
Orsi, A. H., and Wiederwohl, C. L. (2009). A recount of Ross sea waters. Deep-Sea Res. II 56, 778–795. doi: 10.1016/j.dsr2.2008.10.033
Parker, C. E., Brown, M. T., and Bruland, K. W. (2016). Scandium in the open ocean: a comparison with other group 3 trivalent metals, Geophys. Res. Lett. 43, 2758–2764. doi: 10.1002/2016GL067827
R Development Core Team (2011). R: A Language and Environment for Statistical Computing. R foundation for statistical computing, Vienna.
Reddy, T. E., and Arrigo, K. R. (2006). Constraints on the extent of the Ross Sea phytoplankton bloom. J. Geophys. Res. 111:C07005. doi: 10.1029/2005JC003339
Redfield, A. C., Ketchum, B. H., and Richards, F. A. (1963). “The influence of organisms on the composition of seawater,” in The Composition of Seawater, Vol. 2, ed. M. N. Hill (New York, NY: Wiley), 26–77.
Rijkenberg, M. J. A., Middag, R., Laan, P., Gerringa, L. J. A., van Aken, H., Schoemann, V., et al. (2014). The distribution of dissolved iron in the West Atlantic Ocean. PLoS One 9:e101323. doi: 10.1371/journal.pone.0101323
Rodionov, D. A., Vitreschak, A. G., Mironov, A. A., and Gelfand, M. S. (2003). Comparative genomics of the vitamin B12Metabolism and Regulation in Prokaryotes. J. Biol. Chem. 278, No. 42, 41148–41159. doi: 10.1074/jbc.M305837200
Saito, M. A., and Goepfert, T. J. (2008). Zin-cobalt colimitation in Phaeocystics antarctica. Limnol. Oceanogr. 42, 266–275. doi: 10.4319/lo.2008.53.1.0266
Saito, M. A., Goepfert, T. J., Noble, A. E., Bertrand, E. M., Sedwick, P. N., and DiTullio, G. R. (2010). A seasonal study of dissolved cobalt in the Ross Sea, Antarctica: micronutrient behavior, absence of scavenging, and relationships with Zn, Cd, and P. Biogeosciences 7, 4059–4082. doi: 10.5194/bg-7-4059-2010
Saito, M. A., Moffett, J. W., and DiTullio, G. R. (2004). Cobalt and nickel in the Peru upwelling region: a major flux of labile cobalt utilized as a micronutrient. Glob. BiogeoChem. Cycles 18, GB4030. doi: 10.1029/2003GB002216
Saito, M. A., Noble, A. E., Hawco, N., Twining, B. S., Ohnemus, D. C., John, S. G., et al. (2017). The acceleration of dissolved cobalt’s ecological stoichiometry due to biological uptake, remineralization, and scavenging in the Atlantic Ocean. Biogeosciences 14, 4637–4662. doi: 10.5194/bg-14-4637-2017
Saito, M. A., Rocap, G., and Moffett, J. W. (2005). Production of cobalt binding ligands in a Synechococcus feature in the Costa Rica upwelling dome. Limnol. Oceanogr. 50, 279–290. doi: 10.4319/lo.2005.50.1.0279
Schlitzer, R. (2018). Ocean Data View. Available online at: https://odv.awi.de (accessed December, 2018).
Schulz, K. G., Zondervan, I., Gerringa, L. J. A., Timmermans, K. R., Veldhuis, M. J. W., and Riesebell, U. (2004). Effect of trace metal availability on coccolithophorid calcification. Nature 430, 673–676. doi: 10.1038/nature02631
Sedwick, P. N., DiTullio, G. R., and Mackey, D. J. (2000). Iron and manganese in the Ross sea, Antarctica: seasonal iron limitation in Antarctic shelf waters. J. Geophys. Res. 105, 321–336. doi: 10.1029/2000JC000256
Sedwick, P. N., Edwards, P. R., Mackey, D. J., Griffithst, F. B., and Parslow, J. S. (1997). Iron and manganese in surface waters of the Australian subantarctic Region. Deep Sea Res. I 44, 123S–1253S. doi: 10.1016/S0967-0637(97)00021-6
Sedwick, P. N., Marsay, C. M., Sohst, B. M., Aguilar-Islas, A. M., Lohan, M. C., Long, M. C., et al. (2011). Early season depletion of dissolved iron in the Ross Sea polynya: implications for iron dynamics on the Antarctic continental shelf. J. Geophys. Res. 116:C12019. doi: 10.1029/2010JC006553
Sedwick, P. N., Sohst, B. M., Ussher, S. J., and Bowie, A. R. (2015). A zonal picture of the water column distribution of dissolved iron(II) during the U.S. GEOTRACES North Atlantic transect cruise (GEOTRACES GA03). Deep Sea Res. II 116, 66–175. doi: 10.1016/j.dsr2.2014.11.004
Shaked, Y., Xu, Y., Leblanc, K., and Morel, F. M. M. (2006). Zinc availability and alkaline phosphatase activity in Emiliania huxleyi: implications for Zn–Pco-limitation in the ocean. Limnol. Oceanogr. 51, 299–309. doi: 10.4319/lo.2006.51.1.0299
Shannon, R. D. (1976). Revised effective ionic radii and systematic studies of interatomic distances in halides and chalcogenides. Acta Crystallogr. A 32, 751–767. doi: 10.1107/S0567739476001551
Sherrell, R. M., Lagerstrom, M. E., Forsch, K. O., Stammerjohn, S. E., and Yager, P. L. (2015). Dynamics of dissolved Iron and other Bioactive Trace Metals (Mn, Ni, cu, Zn) in the Amundsen Sea Polynya, Antarctica. Elementa 3:000071. doi: 10.12952/journal.elementa.000071
Skabral, S. A. (2006). Dissolved titanium distributions in the Mid-Atlantic Bight. Mar.Chem. 102, 218–229. doi: 10.1016/j.marchem.2006.03.009
Smith, W. O. Jr., Marra, J., Hiscock, M. R., and Barber, R. T. (2000). The seasonal cycle of phytoplankton biomass and primary productivity in the Ross Sea. Antarctica Deep Sea Res. II 47, 3119–3140. doi: 10.1016/S0967-0645(00)00061-8
Strickland, J. D. H., and Parsons, T. R. (1968). A practical handbook of seawater analysis. Fish. Res. Board Can. 167:65.
Sunda, W. G. (2012). Feedback interactions between trace metal nutrients and phytoplankton in te ocean. Front.. Microbiol. 3:204. doi: 10.3389/fmicb.2012.00204
Sunda, W. G., and Huntsman, S. A. (1995). Cobalt and zinc inter replacement in marine phytoplankton: biological and geochemical implications. Limnol Oceanogr. 40, 1404–1417. doi: 10.4319/lo.1995.40.8.1404
Sunda, W. G., and Huntsman, S. A. (2000). Effect of Zn. Mn, and Fe on Cd accumulation in phytoplankton: implications for oceanic Cd cycling. Limnol. Oceanogr. 45, 1501–1516. doi: 10.4319/lo.2000.45.7.1501
Tagliabue, A., and Arrigo, K. R. (2003). Anomalously low zooplankton abundance in the Ross sea: an alternative explanation. Limnol. Oceanogr. 48, 686–699. doi: 10.4319/lo.2003.48.2.0686
Till, C. P., Shelley, R. U., Landing, W. M., and Bruland, K. W. (2017). Dissolved scandium, yttrium, and lanthanum in the surface waters of the North Atlantic: potential use as an indicator of scavenging intensity. J. Geophys. Res. Oceans 122, 6684–6697. doi: 10.1002/2017JC012696
Timmermans, K. R., Snoek, R. J., Gerringa, L. J. A., and de Baar, H. J. W. (2001). Not all eukaryotic algea can inter replace cobalt and zinc: Chaetoceros calcitrans (Bacillariophyceaea) versus Emiliania huxleyi (Haptophyceae). Limnol. Oceanogr. 46, 699–704. doi: 10.4319/lo.2001.46.3.0699
Twining, B. S., and Baines, S. B. (2013). The trace metal composition of marine phytoplankton. Annu. Rev. Mar. Sci. 5, 191–215. doi: 10.1146/annurev-marine-121211-172322
Twining, B. S., Baines, S. B., and Fisher, N. S. (2004). Element stoichiometries of individual plankton cells collected during the Southern Ocean Iron Experiment (SOFeX). Limnol. Oceanogr. 49, 2115–2128. doi: 10.4319/lo.2004.49.6.2115
Vance, D., de Souza, G. F., Zhao, Y., Cullen, J. T., and Lohan, M. C. (2019). The relationship between zinc, its isotopes, and the major nutrients in the North-East Pacific. Earth Planet. Sci. Lett. 525:115748. doi: 10.1016/j.epsl.2019.115748
Vance, D., Little, S. H., de Souza, G., Khatiwala, S., Lohan, M. C., and Middag, R. (2017). Silicon and zinc biogeochemical cycles coupled through the Southern Ocean. Nature Geosci. 10, 202–206. doi: 10.1038/ngeo2890
Westerlund, S., and Öhman, P. (1991). Cadmium, copper, cobalt, nickel, lead, and zinc in of the Weddell Sea. Antarctica. Geochim. Cosmochim. Acta 55, 2127–2146. doi: 10.1016/0016-7037(91)90092-J
Whitby, H., Posacka, A. M., Maldonado, M. T., and van den Berg, C. M. G. (2018). Copper-binding ligands in the NE Pacific. Mar. Chem. 204, 36–48. doi: 10.1016/j.marchem.2018.05.008
Wu, M., McCain, J. S. P., Rowland, E., Middag, R., Sandgren, M., Allen, A. E., et al. (2019). Manganese and iron deficiency in Southern Ocean Phaeocystis antarctica populations revealed through taxon-specific protein indicators. Nat. Commun. 10:3582. doi: 10.1038/s41467-019-11426-z
Wyatt, N. J., Milne, A., Woodward, E. M. S., Rees, A. P., Browning, T. J., Bouman, H. A., et al. (2014). Biogeochemical cycling of dissolved zinc along the GEOTRACES South Atlantic transect GA10 at 40°S, Global Biogeochem. Cycles 28, 44–56. doi: 10.1002/2013GB004637
Xie, R. C., Galer, S. J. G., Abouchami, W., Rijkenberg, M. J. A., De Jong, J., de Baar, H. J. W., et al. (2015). The cadmium–phosphate relationship in the western South Atlantic — the importance of mode and intermediate waters on the global systematics. Mar. Chem 177(Pt. 1), 110–123. doi: 10.1016/j.marchem.2015.06.011
Xu, Y., and Morel, F. M. (2013). “Cadmium in marine phytoplankton,” in Cadmium: From Toxicity To Essentiality, eds A. Sigel, H. Sigel, and R. K. O. Sigel (New York, NY: Springer), 509–528. doi: 10.1007/978-94-007-5179-8_16
Keywords: Antarctica, dissolved trace metals, Ross Sea Polynya, bottom nepheloid layer, sea ice melt
Citation: Gerringa LJA, Alderkamp A-C, van Dijken G, Laan P, Middag R and Arrigo KR (2020) Dissolved Trace Metals in the Ross Sea. Front. Mar. Sci. 7:577098. doi: 10.3389/fmars.2020.577098
Received: 28 June 2020; Accepted: 28 September 2020;
Published: 27 October 2020.
Edited by:
Jianfang Chen, Second Institute of Oceanography, Ministry of Natural Resources, ChinaReviewed by:
Ji Hu, Second Institute of Oceanography, Ministry of Natural Resources, ChinaLi Li, First Institute of Oceanography, Ministry of Natural Resources, China
Ruifeng Zhang, Shanghai Jiao Tong University, China
Copyright © 2020 Gerringa, Alderkamp, van Dijken, Laan, Middag and Arrigo. This is an open-access article distributed under the terms of the Creative Commons Attribution License (CC BY). The use, distribution or reproduction in other forums is permitted, provided the original author(s) and the copyright owner(s) are credited and that the original publication in this journal is cited, in accordance with accepted academic practice. No use, distribution or reproduction is permitted which does not comply with these terms.
*Correspondence: Rob Middag, cm9iLm1pZGRhZ0BuaW96Lm5s