 Iury T. Simoes-Sousa1,2*
 Ilson Carlos A. Silveira2
 Amit Tandon1
 Glenn R. Flierl3
 Cesar H. A. Ribeiro4Renato P. Martins5
- 1College of Engineering, University of Massachusetts Dartmouth (UMassD), Dartmouth, MA, United States
- 2Instituto Oceanográfico, Universidade de São Paulo (USP), São Paulo, Brazil
- 3Department of Earth, Atmospheric, and Planetary Sciences, Massachusetts Institute of Technology (MIT), Cambridge, MA, United States
- 4Exploration Department, Petroleo Brasileiro S.A—PETROBRAS, Rio de Janeiro, Brazil
- 5Centro de Pesquisas e Desenvolvimento Leopoldo Americo Miguez de Mello (CENPES), Rio de Janeiro, Brazil
We explore the Barreirinhas Eddies, submesoscale vortices generated by the North Brazil Current (NBC) off the Barreirinhas Bight (Brazil, centered at 1.75°S), using vessel-mounted and moored ADCP data, and a Global HYCOM reanalysis. These double-stacked anticyclones with incredibly high Rossby Number [(10)] occur independently at different depths (high Burger number). Anticyclones with Rossby number greater than unity are unstable according to inviscid linear theory, and hence these submesoscale features are not easily observable at mid latitudes. At these low latitudes, they last about a week, allowing characterization by oceanographic surveys. Our analyses suggest this increased stability is due to the joint effect of strong winds, stratification, proximity to the equator, and topography. Heretofore hypothesized via analytical studies and seen in numerical models, our study confirms this stabilization process in observations, and is also a starting point for the description of the submesoscale dynamics in the NBC domain.
1. Introduction
The North Brazil Current (NBC) starts as a subsurface-intensified jet called the North Brazil Undercurrent (NBUC; Silveira et al., 1994; Stramma et al., 1995). The NBUC arises from the contribution of the northward branch of the South Equatorial Current (SEC) pycnocline-level bifurcation (~20°S; Soutelino et al., 2013) to the Intermediate Western Boundary Current (IWBC; Boebel et al., 1999). Ranging from intermediate levels to the surface, the NBUC—fully formed north of 15°S—transports 25 Sv (Schott et al., 1995). From this latitude toward the equator, this current receives contributions from shallower SEC branches and undergoes a series of pycnoclinic and subpycnoclinic retroflections. Hence, the NBUC changes from a subsurface-intensified current to a parabolic-shaped surface jet throughout its domain: the NBC (Stramma et al., 1995), which crosses the equator transporting more than 32 Sv (Schott et al., 1993).
The temporal variability of the NBC close to the equator undergoes a limited annual cycle, with the annual harmonic amplitude representing only 12.5% of the mean volume transport (Schott et al., 1993). The NBC's intraseasonal variability is mainly associated with waves trapped within the equatorial waveguide (Schott et al., 1993; Johns et al., 1998; Von Schuckmann et al., 2008). In particular, marked periodicity of 40–60 days arises as dispersive Rossby waves, whereas 25- to 35-day waves arise as Yanai waves (Johns et al., 1998). The estimated wavelength for the Rossby waves at 6°N is 520 km (Johns et al., 1990); the wavelength of the Yanai waves is ~800 km at 4°N. Since the first baroclinic deformation radius1 is ~380 km at the equator (Houry et al., 1987) and 125 km at 5°N, these are mesoscale phenomena.
North of Cape São Roque (6°S), the northeast Brazilian continental margin changes its orientation, forming a system of two adjacent bights separated by Cape Acaraú (Figure 1). The southernmost bight—the Potiguar Bight—is centered at 4°S; and the northernmost one, the Barreirinhas Bight, is centered at 1.75°S. The latter is approximately 400 km long, and both coastline and shelf break change orientation within the bight from E-W to SE-NW moving downstream. The steepness of the continental slope in the region is around 1:8, which helps to constrain the main flow of the NBC to follow the shelf break orientation. The present study of vortical activity within the Barreirinhas Bight is motivated by the description of near-equatorial, coastally-trapped eddies in the Gulf of Guinea at 4°N (Djakouré et al., 2014), which identified two shallow, eastward-propagating cyclonic eddies per year, with an average radius of 60 km and a lifetime of ~60 days. The eddies are formed by a quasi-zonal eastward jet (the Guinea Current, GC) interacting with two bights on the continental margin. In our case, south of the equator, a quasi-zonal westward jet (the NBC) interacts with two geometrically similar bights. Surprisingly, the two regions are also connected by the same current system (the Atlantic Equatorial Gyre; Bub and Brown, 1996), as the GC is formed by the North Equatorial Counter Current (NECC; Djakouré et al., 2014), which in turn is formed by the NBC retroflection north of 4°N (Bub and Brown, 1996; Johns et al., 1998).
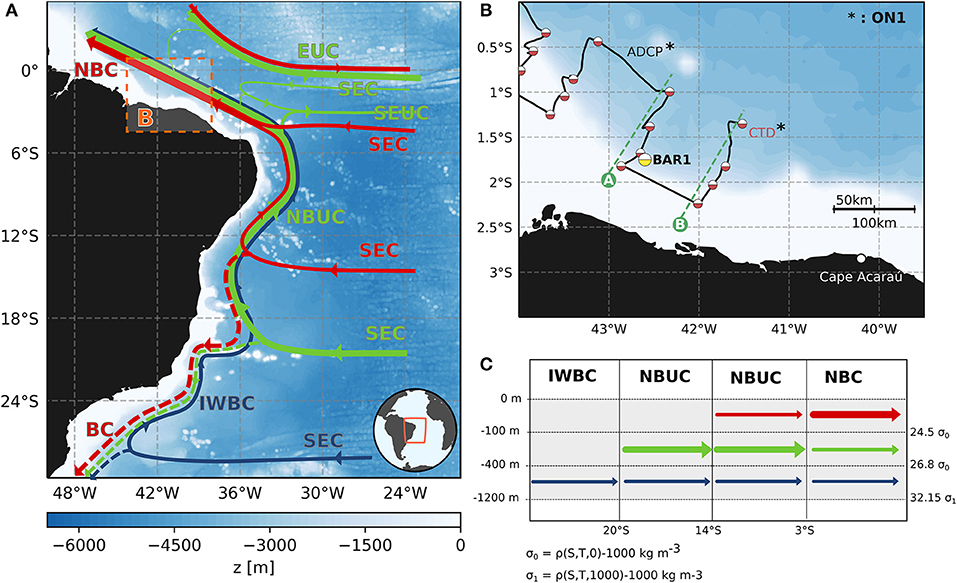
Figure 1. (A) Schematic representation of the NBC organization in three different water mass domains. In red: Tropical Water (TW) from the 0m to σ0=24.5 kg m−3 surface. In green: South Atlantic Central Water (SACW) from the σ0=24.5 to the σ0=26.8 kg m−3 surfaces. In blue: Antarctic Intermediate Water (AAIW) from the σ0=26.8 to the σ1=32.15 kg m−3 surfaces (Silveira et al., 1994; Schott et al., 1998; Soutelino et al., 2013). (B) The in situ data sets. The black line is the Brazilian Navy's Oceano Norte I (ON1) cruise route, representing the ADCP data. The white/yellow circle represents the PETROBRAS current meter mooring location. The white/red circles depict the CTD sampling stations. The green dashed lines represent the two vertical transects analyzed in this work. (C) Vertical extent diagram of NBC formation. The arrow thickness is proportional to the volume transport.
Considering that our study area is somewhat “equator-mirrored” by the Gulf of Guinea, (i.e., the GC generates cyclones and the NBC anticyclones, while interacting with the topography), we particularly seek topographically driven anticlockwise (anticyclonic) eddies. At low latitudes, the anticyclonic vorticity easily overwhelms the planetary vorticity. The resulting unbalanced pressure gradient force should lead to the development of inertial instability to restore the balance by homogenizing the angular momentum in an inviscid regime (Harvey and Knox, 2019). Despite some similarities, the Coriolis parameter in our study region is one order of magnitude smaller than in the Gulf of Guinea, which may hinder the comparisons between the dynamics in the two regions.
Usually, high-Ro [(1)] anticyclones are quite difficult to sample because of the mismatch between the timescale of classical hydrographic surveys and the short life cycle of the eddies, constrained by the inertial instability; only a few studies describe them using observational data (e.g., D'Asaro, 1988; Chavanne et al., 2010; Bosse et al., 2016). Prior to these observations, no information regarding the submesoscale variability has been reported for the NBC domain or for any western-boundary current in the equatorial region.
In this study, we gather all the available in situ data to first describe the Barreirinhas eddies, and to investigate whether and how frequently anticyclones are formed in this region; we also employ a global ocean model reanalysis to place our analyses in context, spatially and temporally as well as to address its zeroth-order dynamics.
2. Datasets
We analyze hydrographic and vessel-mounted Acoustic Doppler Current Profile (ADCP) data measured during the June 2001 expedition Operação Norte 1 (hereafter, ON1) by the Brazilian Navy (Figure 1). We also use current-meter mooring data made available by Petróleo Brasileiro S.A. (PETROBRAS) through the Project “The Brazilian Equatorial Margin Circulation.” The current meter deployment (hereafter, BAR1) time series is fourteen months long, from 26 August 2006 to 04 October 2007, located at 1.75°S–42.6°W. Instrument depths on the mooring line are: 3.5, 10, 20, 30, 40, 113, 313, 765, 1,165, 1,565, and 1,850 m. The gaps in 3.5, 10, and 113 m sensors were filled using the empirical orthogonal functions (EOF) of the velocity anomaly time series. We choose this method because it does not change the data statistics (Beckers and Rixen, 2003; Rocha et al., 2014).
The observational dataset is space-time limited. To address the issue of possible topographically-constrained eddy activity, we explore the velocity outputs from the 19.1 HYCOM Experiment Reanalysis (hereafter, HR19.1) available from 1995 to 2012. In particular, we compare and analyze the outputs from 2001 to 2007, which overlap both the synoptic dataset ON1 and the BAR1 mooring, to establish confidence in the ability of the HR19.1 to represent the Barreirinhas Eddies. But we use the whole simulated time range for computing the long-term averages. See Supplementary Material for a detailed description about the model and experiment.
3. Analysis of the Observational Data
3.1. Inferences From ADCP Data
We select two ON1 sections for our analysis: transect A at ~43°W and transect B at ~42°W. The vertical structure of along-slope velocity for transect A is shown in Figure 2A. An intense counterflow to the NBC jet within the Tropical Water (TW) is seen, with a horizontal extension of 30 km and a maximum velocity of 0.6 m s−1 at 45 m; this counterflow transports 1.0 Sv. There is almost no counterflow observed in the South Atlantic Central Water (SACW) domain for transect A, but we can observe a pattern similar to transect B (Figure 2B), reaching 0.2ms−1.
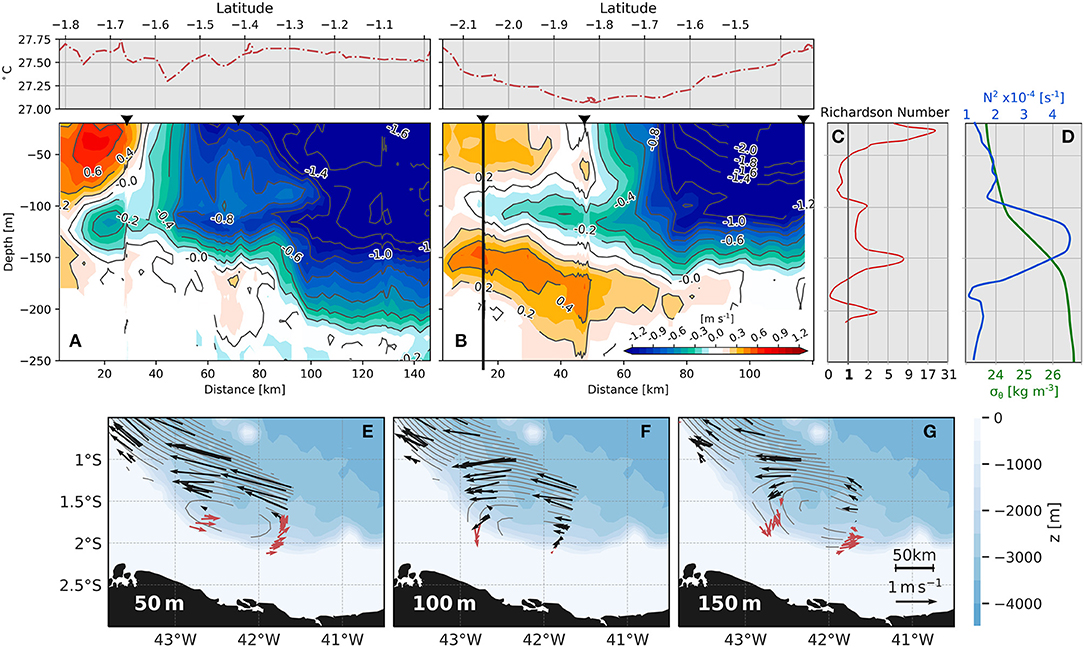
Figure 2. ON1 transect A (A) and B (B) along-slope velocity section. Eastward velocities are positive. The ADCP temperature sensor data is shown in the upper panels (A,B). The vertical straight line in panel B shows the location of the CTD cast used to estimate the Richardson number (C) and stratification (D). The velocity field (vector plots) and its mapped stream function (contours obtained by Vectorial Objective Analysis) of the ADCP data from the ON1 cruise at 50 m (E) 100 m (F) and 150 m (G). All plots are set to the same vector scale. Red arrows mark the flow related to the eddies. Each transect takes about half a day and hence they are quasi-synoptic.
The vertical structure of the along-slope velocity for transect B shows two inshore counterflows relative to the NBC current: one located in the Tropical Water (TW) domain and the other in the South Atlantic Central Water (SACW) domain. The TW lobe extends for 50 km horizontally and has a maximum speed of 0.39ms−1 at around 50m depth (from 20 to 65m), transporting 0.3Sv. Within the SACW, a stronger and larger flow can be seen, entirely separate from the shallower core. The deeper core has a horizontal extent of 90 km, and a maximum speed of 0.5ms−1, transporting 1.1Sv between 120 and 250m. We estimate the coarse-resolution Richardson number (Ri; Figure 2C) from the shear and local stratification (Figure 2D). We employ smoothed shear and density profiles (from the ADCP profile and CTD cast in the center of the 2 eddy cores) to compute Ri. The coarse-resolution Ri profile show some peaks of (10), but the average for both layers (TW and SACW) is (1).
To verify that these zonal-flow reversals are indeed the signatures of eddies, we present in Figures 2E–G the ADCP velocity plots and the mapped streamfunction at different depths obtained by Objective Analysis, with a 45 km correlation length (Silveira et al., 2000; Biló et al., 2014). We only show streamfunction values that account for <40% of interpolation error. Based on Figure 2B, we choose the depth of the TW core velocity (50m, Figure 2E), the local minimum between the two cores (100m, Figure 2F), and the SACW core (150m, Figure 2G). Figures 2E,G clearly depict eddy-like patterns; they are not vertically aligned, and they display an along-slope radius of ~100 km. On the other hand, Figure 2D presents only the NBC velocity structure, indicating that the two anticyclones are vertically separated. Interestingly, Figure 2 west of 43°W only shows the NBC (but not the eddies), which might suggest that in this scenario the vortical structures are confined to the Barreirinhas Bight.
From the CTD data, we find that the pycnoclinic eddy has a warmer center (~20 °C), ~2 °C warmer than its edges (~18 °C). In contrast, the ADCP surface temperature sensor (Figures 2A,B) indicates that the center of the near-surface eddy is more than 0.5 °C colder than its edges.
Cold-core anticyclones may occur due to divergent Ekman transport, resulting from eddy-wind interactions (Dewar and Flierl, 1987; McGillicuddy, 2015). This is even more prominent with strong constant winds, such as the trade winds over Barreirinhas Eddies. We add the caveat, however, that the Ekman theory does not apply at the equator, and eddy-wind interactions may occur differently from the examples in the literature. As described by Pegliasco et al. (2015), the eddies' T-S vertical structure also depend on other factors and these anticyclones could be trapping coastal waters from the formation region that are slightly colder than the adjacent ocean. However, no upwelling processes has been described in this region so far, and this calls for investigation beyond the scope of this study.
Based on the morphometric analysis of ADCP data, we estimate dimensionless numbers as a first assessment of the Barreirinhas Eddies dynamics. Aspect ratios (δ) of (10−3) show that the motions are unequivocally hydrostatic. The (1) Rossby number [Rob = U/(f L) = U/(β L2)], where the latter makes the β-plane approximation) and the (1) mean Richardson Number for both structures reveal that the flow is not geostrophic, as expected for a feature centered at 1.75°S. The characteristic submesoscale length scales for mid-latitudes are ~1–10 km (Lévy et al., 2012; Mahadevan, 2016), typically 0.1–0.33 times the deformation radius Rd (where Rd ~30 km). In the equatorial region, the Rd is an order of magnitude larger, as are the submesoscale motions (see Marchesiello et al., 2011). Since their Ro and Ri are (1)—we classify the Barreirinhas Eddies as near-equatorial submesoscale features. We also estimate the local Ro using only the along-slope velocity component of transect B. These two eddies are strongly anticyclonic, reaching maximum values of (10) in the center. Compared to midlatitude eddies (e.g., Garzoli et al., 1999; Wei et al., 2008), the nonlinear acceleration term in the momentum balance is relatively more important for Barreirinhas Eddies because of the proximity to the equator and high Rossby Number. Therefore, despite having a similar aspect ratio and azimuthal velocity magnitude, their high Ro near-equator dynamics are very different from low Ro mid-latitude mesoscale eddies.
In order to estimate the Burger number (Bu), defined as the squared ratio between the first Rossby deformation radius and the length scale of the eddies, we obtain the equatorial deformation radii from the CTD-derived density profile (Philander et al., 1989). For a first deformation radius of 304 km, the Bu varies from 10 (pycnoclinic eddy) to 30 (near-surface eddy).
Inshore velocity profiles show a minimum at ~100 m and present two local maxima associated with the TW near-surface eddy (~50 m) and the SACW pycnoclinic eddy (~150 m). An initial explanation would be that the inshore lobes mimic the NBC-NBUC vertical structure, changing from an undercurrent to a surface current before crossing the equator. Indeed, there are two separated cores in Figure 2A at around 120 km. Although a second possibility could have been eddy-tilting leading to a baroclinic dipole, this is negated by the velocity pattern depicted in the data consisting of two stacked vortical features. Also, the Bu for the two maxima is (10), which indicates that the intense stratification in the region is sufficient to decouple the density layers, resulting in a vortical regime dominated by the relative vorticity (Cushman-Roisin and Beckers, 2011). Hence, each layer moves independently, and eddies may occur at different core depths within the Barreirinhas Bight, leading to the misalignment observed in Figure 2.
3.2. Inferences From Current Meter Mooring Data
BAR1 was moored at the 1,850 m isobath, capturing the inshore lobe of the Barreirinhas Eddies, where the zonal flow reverses. Moreover, though six years apart, the BAR1 location falls on the ON1 transect A. Figure 3A displays the mean along-slope velocity profile, which presents maximum velocities of ~0.35 m s−1 at the surface. The current is clearly surface-intensified and extends down to 1,000 m.
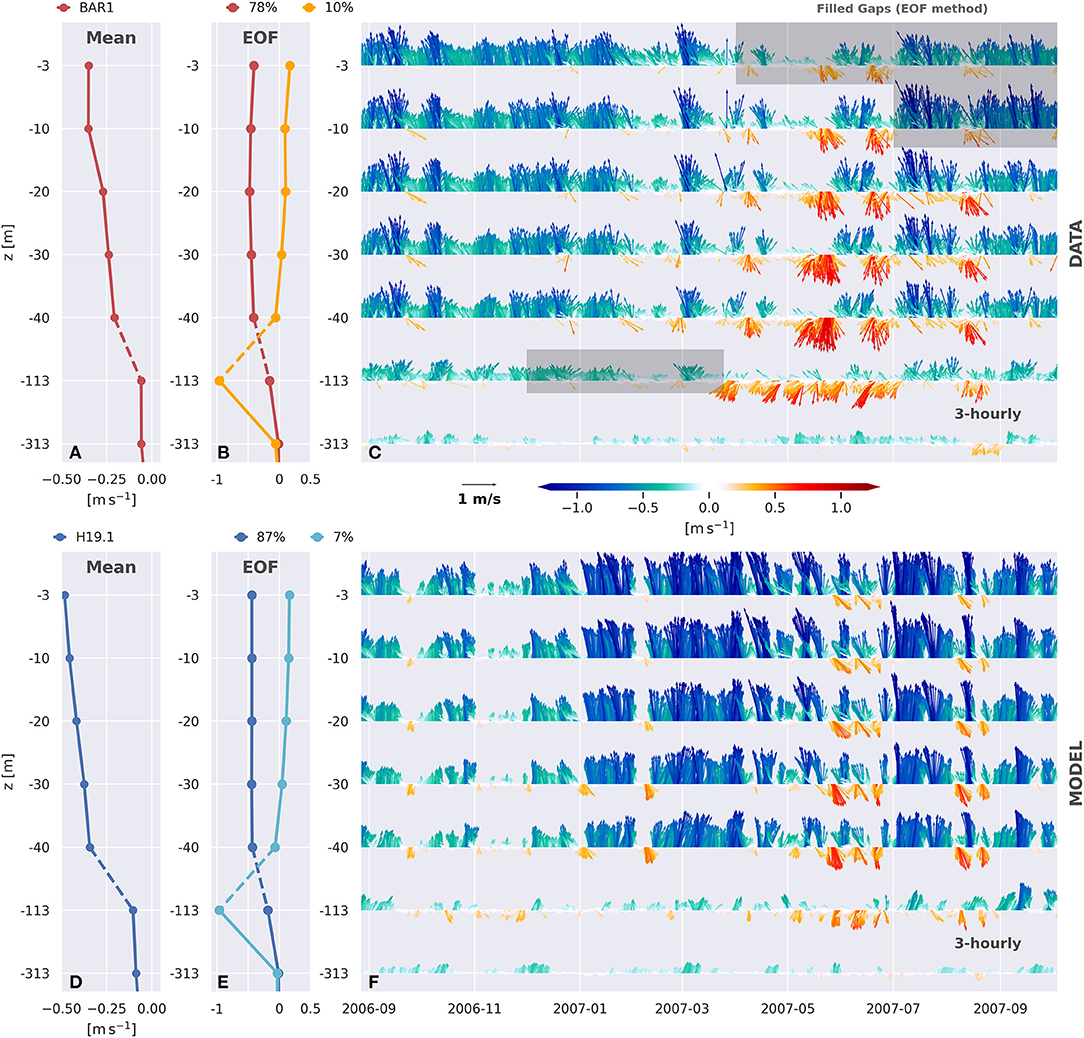
Figure 3. (A) BAR1 along-slope velocity mean profile. (B) BAR1 EOF analysis for the along-slope velocity. (C) BAR1 velocity stick plot rotated by 90°. (D) HR19.1 along-slope velocity mean profile. (E) HR19.1 EOF analysis for the along-slope velocity. (F) HR19.1 velocity stick plot rotated by 90°; y-axis represents along-slope velocity component. The percentages in the legend represent the total variance contained for each EOF. HR19.1 velocities are interpolated at the current meter depths. The vertical grid is stretched below 40 m.
Figure 3A shows the vertical structure of the mean along-slope velocity, with characteristics of the NBC jet. Since the mean profile does not capture the eddy structure, we infer that the Barreirinhas Eddies events are either sporadic or non-stationary. Indeed, we show that the zonal-flow reversals occur from late March to September (Figure 3C). During these months, the eddies, consistent with their large Bu occur with different vertical extents. For instance, we observe only the near-surface eddy at times and only the pycnoclinic eddy at others. More commonly, the Barreirinhas Eddies core depth alternates between the TW and SACW layers (compare the zonal-flow reversals at 50 and 113 m, Figure 3C).
The analysis of the eddy events (Supplementary Text S2) suggests that zonal-flow reversals within the Barreirinhas Bight occur weekly from April to late August. The stronger Barreirinhas Eddies events occur in May; also, this month shows more events in both the TW and the SACW. We can also verify that the events are more sparse both at the onset and end of the eddy season (Figure 3C, Supplementary Figure 2). Moreover, pycnoclinic Barreirinhas Eddies are present continuously (or recurrently formed) in May–June. The near-surface eddy formation in July seems less frequent, with practically no event in the BAR1 time series.
We compute EOFs (see Figure 3B) to identify the vertical variability patterns (Preisendorfer and Mobley, 1988; Emery and Thomson, 2001) and their relation to the zonal-flow reversals. We obtain a first dominant mode, which contains 87% of the series variance, indicating that this vertical pattern governs both the zonal-flow reversals throughout the TW and SACW layers, and therefore the NBC variability itself. The second mode contains only 8% of the series variance, but it has maximum (absolute) values in the pycnocline, presenting non-null amplitudes solely during the eddy season. The second mode's amplitude within the TW presents an opposite sign to SACW. Hence, it is the second mode that sets the variability of the core intensity and vertical extent of the vortical structures in the two different layers.
Previous laboratory experiments investigating flow past capes show that at large Bu—i.e., for highly stratified fluids—eddies tend to be shed and propagate downstream of the cape (Boyer and Tao, 1987). This eddy-shedding does not happen for very small Ro. Though our observational Bu and Ro are distinct from the experimental range, for Bu > 1, any experiment with Ro> 0.04 is classified in this study as belonging to the “anticyclonic eddy shedding regime.” Thus, the short-term variability observed in the mooring data is expected to occur due to recurrent eddy-shedding and propagation within the Barreirinhas Bight.
4. Inferences From a Numerical Simulation
The data analyses show energetic anticyclonic Barreirinhas Eddies, but only the very basics of their dynamics and time variability. Since the observations are sparse and severely limited in temporal and spatial coverage, we use a numerical simulation hereafter to explain the occurrence of the eddy season, as well as the high-frequency variability depicted during the eddy season.
We compare the HR19.1 output with the previously described observational data. For the quasi-synoptic velocity field, the vertical section of the along-slope velocity component in the model events compares well with the pattern observed in ADCP data in terms of volume transport and morphometric measurements (core velocity, horizontal, and vertical extent, etc.). The mean profile and the two first EOFs from the model (Figures 3D,E) also represent essentially the same vertical structure from BAR1. This suggests that the vertical pattern of variability from the model is comparable to the one presented using BAR1. The eddy-events in the model are more sparse and less intense, but stronger events occur about the same time as in the data (Figures 3C–F, Supplementary Figure 2).
4.1. HR19.1's NBC Annual Cycle
The analysis of the in situ data suggests a seasonal modulation in the eddy occurrence within Barreirinhas bight and we here investigate how the NBC annual cycle relates to the generation of the eddies. We calculate the NBC mean volume transport and its annual cycle for the model at a cross-stream transect upstream of the Barreirinhas Bight (east of Cape Acaraú). The transect location is represented in Figure 4A by the straight red line.
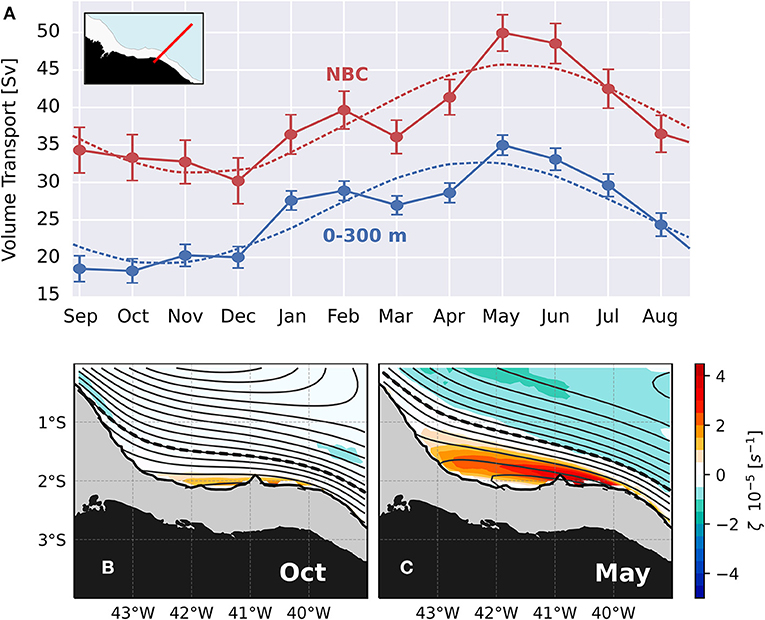
Figure 4. (A) HR19.1 long-term mean volume transport and annual cycle (dashed) for the NBC upstream of the Barreirinhas Bight. October (B) and May (C) streamlines and vorticity mean fields for the first 300 m. The dashed black line shows the NBC axis.
Most of the NBC transport is confined to the upper 300 m (Schott et al., 1993), which coincides with the lower limb of the Barreirinhas Eddies. The annual variability in the model shows a good agreement between the period of the eddy season in BAR1 (April–August) and the period of a more intense NBC.
The maximum values of the NBC volume transport in the model arise in May (Figure 4A), and the minimum volume transport occurs in October for the upper 300 m. For the mean fields, we observe that when the current is more intense in the model (May, Figure 4C), the NBC remains offshore and does not enter the Barreirinhas Bight. This seems to favor the formation of the Barreirinhas Eddies, which we identify from a positive relative vorticity (anticyclone) patch associated with eastward velocities near the boundary of the Barreirinhas Bight. In contrast, when the NBC is less intense in the model (October, Figure 4B), the jet enters and exits the Barreirinhas Bight following the isobaths, closer to the shelf break and without forming the Barreirinhas Eddies.
A well-studied “eddy season” example is the NBC eddy-shedding in the near-equatorial North Atlantic, which typically occurs between 4°N and 6°N from late June to February (there is no shedding during March-May; Johns et al., 1998; Silveira et al., 2000; Wilson et al., 2002). This eddy-shedding is associated with the NBC retroflection, as it closes the equatorial gyre while separating from the continental margin. Large mesoscale anticyclones (with a radius ~180–250 km) are shed from this necking-off process of the current. After being shed, they propagate, bordering the shelf break toward the Caribbean; the shedding is modulated by 50-day Rossby waves and 30-day Yanai waves (Johns et al., 1998). This process occurs further downstream, and we do not see any relation between the variability we observed for the Barreirinhas Eddies and the variability of the NBC retroflection.
While the time range of the available in-situ observations is too short to confirm if there is any eddy seasonality, this analysis is the first step addressing a mechanistic relation between the annual cycle of the NBC volume transport and the generation of the Barreirinhas eddies.
4.2. The Barreirinhas Eddies Life Cycle
The HR19.1 output analysis reveals that the Barreirinhas Eddies are always anticyclonic propagating westward, just as expected through the in-situ data analysis. In the model, the Barreirinhas Eddies are generated immediately west of Cape Acaraú (~40°W–~3°S) and are destroyed as they reach São Marcos Bay (~43°W–~1.5°S). These eddies propagate following shelfbreak orientation, stay deeper than the 50-m isobath and, therefore, do not reach the inner shelf. The propagation speed is 0.55 ± 0.4 m s−1 for the near-surface eddy and 0.38 ± 0.22 m s−1 for the pycnoclinic eddy. The model NBC generates about ten events per year concentrated within a 6-month period (March–August), with a short lifespan of about 1 week—the same life-cycle observed from the BAR1 time series (see video animation in the Supplementary Material).
The Barreirinhas Eddies are somewhat similar to the coastally trapped eddies occurring in the Gulf of Guinea (Djakouré et al., 2014), reported as propagating cyclones (average radius of 60 km) formed by the current contouring geomorphological features (two bights). Compared to a 130-km local Rd, both Ro and Bu are (1). The Guinea Eddies also present important and distinct characteristics relative to the Barreirinhas: they are cyclonic features, and the (1) Bu suggests that relative and stretching vorticities compete in the vorticity balance, resulting in a coupling between different layers. We stress that the distance to the equator bears a crucial difference between the dynamics of the Guinea and Barreirinhas Eddies, as the Coriolis parameter in Barreirinhas bight is an order of magnitude smaller than in the Guinea bight. Nevertheless, in both hemispheres, the role of capes and changes in continental margin orientation lead to current meandering in an analogous fashion.
5. Dynamical Summary
As depicted by the dimensionless numbers, the Barreirinhas Eddies can be formed independently within the TW and the SACW. From the model output, we observe that the TW and SACW eddies occur alone and as double-stacked events.
In Figure 5, we show a double-stacked eddy event from the model. The mid panels show three meridional transects crossing the Barreirinhas Bight: one at the west end showing only the near-surface eddy (left panel), one at the east end showing two separated cores (right panel), and one in the center, showing the transition between the eddies. We see in the mid panels that the near-surface eddy has a cold core (outcropping isopycnals) and the pycnoclinic eddy has a warm core, just as we find in quasi-synoptic data. We also see good agreement between the mid left and right panels and the ON1 A and B transects. The lower panels show that local Ro () can reach the value of (10) at the centers of the eddies. For such a case, inertial instabilities should easily develop. Surprisingly, we find that these eddies usually last for a week in the model.
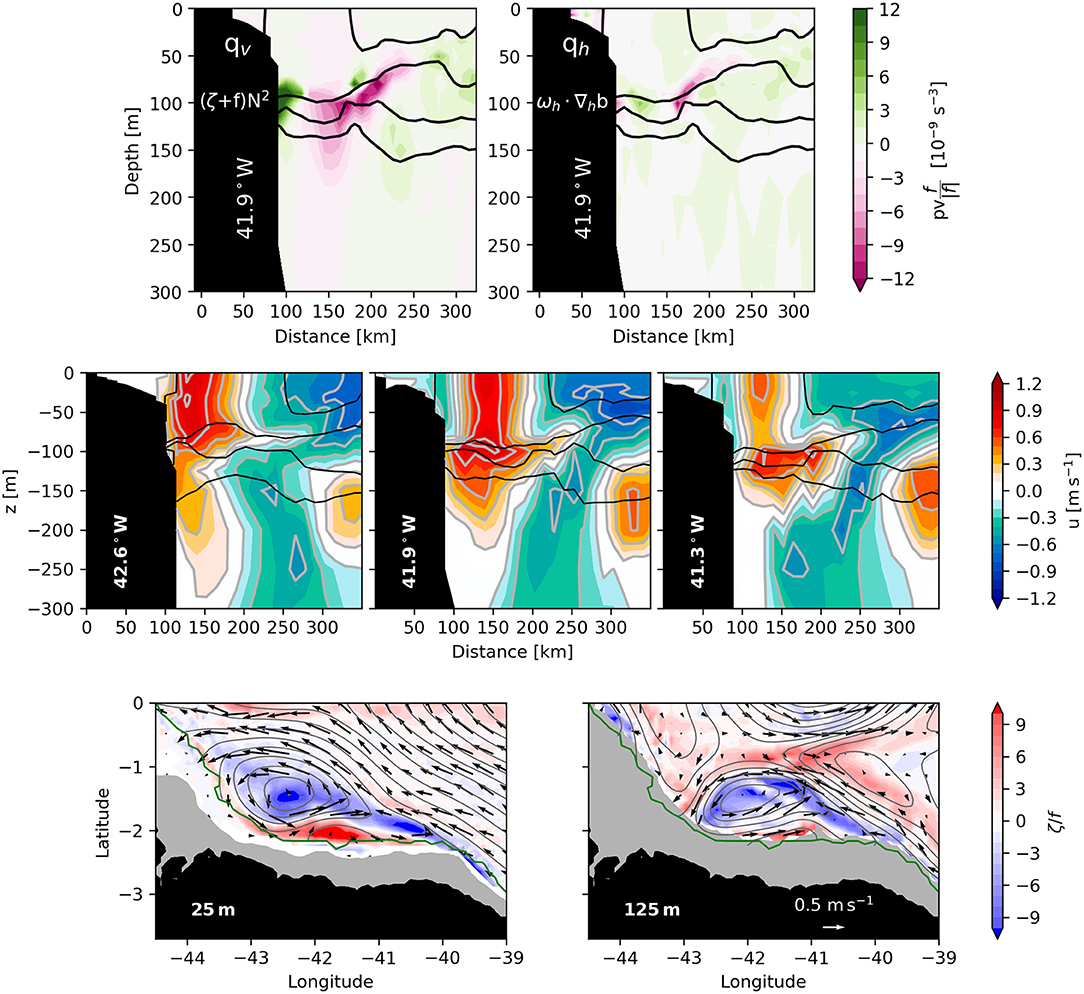
Figure 5. (Top) The vertical section for vertical (left) and horizontal (right) components of potential vorticity and density lines (black) at 41.9°W. ωh includes the meridional component of Coriolis parameter. (Middle) The vertical section for along-slope velocity and density lines (black) at 42.6°W (left), 41.9°W (center), and 41.3°W (right). Eastward velocities are positive. (Bottom) The local Rossby number (ζ/f), objective mapped stream function, and velocity field anomaly for 25 m (left), and 125 m (right). The green line in the plots represents the 50m isobath. All the plots are for HR19.1 in June 9, 2007.
While high-Bu anticyclones can be stable if they have |Ro| ≤ 1 (Charney, 1973), the Barreirinhas Eddies do not satisfy this criterion since they have a high negative Ro. Therefore, if inviscid, the Barreirinhas Eddies would be intrinsically unstable.
At the equator, the beta effect reaches its maximum and is even more relevant zonalizing the potential vorticity and suppressing the curvature needed for the formation of the eddies. Using the morphometric analysis from the vessel-mounted ADCP data, we estimate that the maximum growth rate for an equatorial inertial instability is, at least, 5 × 10⁻⁶s−1. This growth rate for inertial instabilities was estimated using Equation (2.27) of Kloosterziel et al. (2017) (includes full Coriolis term but disregards the stratification) and Equation (4.2) of Stevens (1983) (includes stratification). Both expressions make the β-plane approximation and are valid for zonal flows near the Equator. Thus based on linear theory, these anticyclones should not be observable as symmetric perturbations should grow twentyfold during the eddies' life cycle.
Lazar et al. (2013) examined the roles of friction (expressed by the Ekman number Ek) and stratification (expressed by Bu) in stabilizing high-Ro anticyclones. The QuikScat-derived wind stress within the Barreirinhas Bight reaches 0.128 N m−2. Taking , where estimating and , Ek is ~10−1 for the near-surface eddy. Using the CTD data, we find that the mixed-layer depth reaches 85m within the Barreirinhas Bight under the criterion of 0.125 kg m−3 density change (Lukas and Lindstrom, 1991). If we use the criterion of 0.2 kg m−3 density change (Maneesha et al., 2012), the mixed-layer depth can reach 90 m. For both criteria, most of the near-surface eddy is within the mixed-layer depth and, hence, under the influence of the momentum contributed by the strong winds in the region. Hence, the observed and modeled near-surface Barreirinhas Eddies, with Ek ~0.1 and Bu ~10, lie in the stable domain (see Figure 9 of Lazar et al., 2013), which indicates that friction may have a stabilizing influence.
In addition, the recent complementary work done by Yim et al. (2019) confirms that the criterion presented by Lazar et al. (2013) is also valid for surface-intensified baroclinic eddies, and they propose a general criterion for the stability of high-Ro anticyclones. In our case, for the near-surface eddy, , and . Therefore, using their criterion, and the eddy lie in the stable domain.
Away from the mixed layer, we do not expect the wind to stabilize the pycnocline eddy, though the lateral friction likely plays a role. Pursuing this would require simultaneous high-horizontal-resolution hydrographic and current sections, as well as high resolution regional modeling which will be pursued in a future study.
Recent studies by Buckingham et al. (2021a,b) have investigated the role of the curvature in stabilizing anticyclones. In addition to friction due to wind-driven turbulence and topography, and strong stratification discussed before, the curvature of these intense anticyclones may also have a stabilizing influence.
Regarding the formation of the eddies, from Equation (4.25) of Stone (1966), or Equation (11) from Boccaletti et al. (2007), we find for Ri = (2-10) that the linear instability growth rates are (0.1-0.2)f. Therefore, it would take (160 days) to develop into eddies at these near-equatorial latitudes. Since the timescales of the eddies are smaller than this, we postulate that the eddies are formed by the interaction of the NBC flow past the cape (as we estimated from Boyer and Tao, 1987), rather than the ageostrophic instability of a straight baroclinic current.
6. Conclusions
The NBC vortical activity occurs within the Barreirinhas Bight as strongly anticyclonic westward-propagating eddies with seasonal occurrence. The eddies are indeed meanders of the NBC and happens in two types: the near-surface eddy (in the TW domain) and the pycnoclinic eddy (in the SACW domain). The near-surface eddy has a vertical extent of 100 m and a cross-shore radius of ~30 km. The pycnoclinic eddy has a vertical extent of 150 m and a cross-shore radius of 90 km. Both eddies occur mainly from March to August, typically as 1-week recurrent events with greater numbers of events in May. They are hydrostatic, high Rossby number submesoscale features dominated by strongly anticyclonic relative vorticity.
The numerical simulation shows that the eddy season is likely related to the annual cycle of the NBC jet, leading to a current separation from the continental margin and formation of the Barreirinhas Eddies when the jet is more intense (May). Both data and model eddies are stable energetic anticyclones. Unlike the previous descriptions of high-Ro anticyclones, the Barreirinhas Eddies last long enough to be observed by traditional oceanographic surveys. A simple dynamic analysis of the data and model suggests that the stabilization process may occur due to the stratification (expressed by Bu), vertical friction (expressed by Ek), and topographic effects. Although the latter was not addressed in this study, we guess that the lateral friction may play an important role for the stabilization of the pycnocline eddy.
Since HR19.1 assumes hydrostatic pressure in the vertical, we stress that the model may develop inertial instabilities differently from the real ocean. In addition, the available data is limited in temporal and spatial coverage. Thus, further investigations are required to explain which and how Barreirinhas Eddies are stabilized.
Marchesiello et al. (2011) shows a shift of the submesocale dynamics to larger scales in the equatorial region, which is expected as the Coriolis parameter is orders of magnitude smaller than in mid-latitudes. Until now, the description of the submesoscale dynamics in the equatorial region has been restricted to the tropical instability waves (TIW). We believe that the Barreirinhas Eddies are distinct from TIW because they are an order of magnitude smaller and are recurrently formed by the interaction between the NBC and topography at Cape Acaraú, in contrast to TIWs which originate much farther east in the tropical Atlantic. We also mapped Ertel's potential vorticity (upper panels of Figure 5) and the baroclinic component seem to be negligible (compared to the vertical component) for the Barreirinhas Eddies due to weak horizontal density gradients, which also suggests that they are distinct from the TIWs (see Equation 1 of Holmes et al., 2014). In fact, the vertical stratification (N2) of the eddies is at the scale of 10−4 (i.e., N = 10−2), and = 2Ωcos(θ) = 10−5 at the central latitude of 1.5°S, which implies that the stratification dominates over the rotation as is (103) >> 4 (de Verdiere, 2012). This result suggest that the meridional component of Coriolis is not important for the stabilizing process of the eddies.
The Barreirinhas Eddies also present another distinct characteristic when compared to TIWs, they are non-linear (U/c > 1). Their non-linearity implies that there is trapped fluid within the eddy interior (Chelton et al., 2011), which may have a crucial role for the transport of shelf waters offshore, an important mechanism of supplying nutrients (e.g., nitrate) to the oligotrophic offshore regions.
In contrast to their subpolar submesoscale counterparts, the Barreirinhas Eddies are formed by the interaction of the boundary current with topography, and not by mixed-layer wintertime frontal dynamics. However, as we show, there is a submesoscale character to these eddies in terms of their non-dimensional numbers. Submesoscale eddies may contribute to the flux of mass, buoyancy and nutrients. The occurrence of the Barrerinhas Eddies may change the upper-ocean stratification and transport shelf waters to the open ocean on a timescale of days, playing an important role in phytoplankton communities and local ecological processes.
We are just beginning to address the task of describing submesoscale eddies generated by a boundary current in the equatorial region and there are still many issues that have not been explored in the present paper. Nevertheless, we believe our work could be a starting point for future studies regarding equatorial submesoscale eddies and the submesoscale dynamics in the region of the NBC.
Data Availability Statement
The 1/12-deg global HYCOM+NCODA Ocean Reanalysis is publicly available at www.hycom.org. The data sets used in this work are available at the National Oceanographic Data Center (Banco Nacional de Dados Oceanográficos), and can be accessed upon request to Y2htLmJuZG9AbWFyaW5oYS5taWwuYnI=. The data from the BAR1 mooring are not publicly available due to PETROBRAS proprietary data restrictions, but are available upon request to the authors.
Author Contributions
IS-S did the processing, analysis, and was the lead writer. IS provided overall guidance as IS-S thesis advisor, contributing to the study formulation, interpretation of results, and writing of the paper. AT provided insight into the stability process of the eddies, contributed to the interpretation and presentation of the results, and helped with the writing. GF proposed analysis methods, contributed to the interpretation and presentation of the results, and revised the text. CR revised and helped with the writing. RM and CR provided the current meter data, are part of the PETROBRAS oceanography group responsible for designing, deploying, and recovering the BAR1 mooring. All authors contributed to the article and approved the submitted version.
Funding
The research developed was funded by São Paulo Research Foundation (FAPESP), process 2015/01373-0. AT thanks NSF-OCE-1755313, ONR N00014-17-1-2355, and N00014-18-1-2799 for their support.
Conflict of Interest
The authors declare that the research was conducted in the absence of any commercial or financial relationships that could be construed as a potential conflict of interest.
Acknowledgments
We thank the Brazilian Navy for the ADCP and hydrographic data from the Oceano Norte I experiment. The 1/12-deg global HYCOM+NCODA Ocean Reanalysis was funded by the U.S. Navy and the Modeling and Simulation Coordination Office. Computer time was made available by the DoD High Performance Computing Modernization Program. We thank Petróleo Brasileiro S.A. (PETROBRAS) for their permission to use and display the proprietary data from BAR1 mooring current meter set for this paper. We also thank Frank Chico Smith for copy editing and proofreading this manuscript and Prof. Carlos Teixeira for the first discussions about the existence of such features. We thank the reviewers for their valuable comments and suggestions.
Supplementary Material
The Supplementary Material for this article can be found online at: https://www.frontiersin.org/articles/10.3389/fmars.2021.617011/full#supplementary-material
Footnote
1. ^Length scale at which the geostrophic balance becomes important.
References
Beckers, J.-M., and Rixen, M. (2003). Eof calculations and data filling from incomplete oceanographic datasets. J. Atmos. Ocean. Technol. 20, 1839–1856. doi: 10.1175/1520-0426(2003)020<1839:ECADFF>2.0.CO;2
Biló, T. C., Silveira, I. C. A., Belo, W. C., de Castro, B. M., and Piola, A. R. (2014). Methods for estimating the velocities of the brazil current in the pre-salt reservoir area off southeast brazil (23 s–26 s). Ocean Dyn. 1–16.
Boccaletti, G., Ferrari, R., and Fox-Kemper, B. (2007). Mixed layer instabilities and restratification. J. Phys. Oceanogr. 37, 2228–2250. doi: 10.1175/JPO3101.1
Boebel, O., Davis, R., Ollitrault, M., Peterson, R., Richardson, P., Schmid, C., et al. (1999). The intermediate depth circulation of the western south Atlantic. Geophys. Res. Lett. 26, 3329–3332. doi: 10.1029/1999GL002355
Bosse, A., Testor, P., Houpert, L., Damien, P., Prieur, L., Hayes, D., et al. (2016). Scales and dynamics of submesoscale coherent vortices formed by deep convection in the northwestern Mediterranean sea. J. Geophys. Res. 121, 7716–7742. doi: 10.1002/2016JC012144
Boyer, D. L., and Tao, L. (1987). On the motion of linearly stratified rotating fluids past capes. J. Fluid Mech. 180, 429–449. doi: 10.1017/S0022112087001885
Bub, F. L., and Brown, W. S. (1996). Intermediate layer water masses in the western tropical Atlantic ocean. J. Geophys. Res. 101, 11903–11922. doi: 10.1029/95JC03372
Buckingham, C. E., Gula, J., and Carton, X. (2021a). The role of curvature in modifying frontal instabilities. Part I: review of theory and presentation of a nondimensional instability criterion. J. Phys. Oceanogr. 51, 299–315.
Buckingham, C. E., Gula, J., and Carton, X. (2021b). The role of curvature in modifying frontal instabilities. Part II: application of the criterion to curved density fronts at low richardson numbers. J. Phys. Oceanogr. 51, 317–341.
Charney, J. G. (1973). Planetary Fluid Dynamics. Dordrecht: Springer Netherlands. doi: 10.1007/978-94-010-2599-7_2
Chavanne, C., Flament, P., and Gurgel, K.-W. (2010). Interactions between a submesoscale anticyclonic vortex and a front. J. Phys. Oceanogr. 40, 1802–1818. doi: 10.1175/2010JPO4055.1
Chelton, D. B., Schlax, M. G., and Samelson, R. M. (2011). Global observations of nonlinear mesoscale eddies. Prog. Oceanogr. 91, 167–216. doi: 10.1016/j.pocean.2011.01.002
Cushman-Roisin, B., and Beckers, J. (2011). Introduction to Geophysical Fluid Dynamics: Physical and Numerical Aspects. Waltham, MA: Academic Press. doi: 10.1016/B978-0-12-088759-0.00001-8
D'Asaro, E. A. (1988). Generation of submesoscale vortices: a new mechanism. J. Geophys. Res. 93, 6685–6693. doi: 10.1029/JC093iC06p06685
de Verdiere, A. C. (2012). The stability of short symmetric internal waves on sloping fronts: beyond the traditional approximation. J. Phys. Oceanogr. 42, 459–475. doi: 10.1175/JPO-D-11-067.1
Dewar, W. K., and Flierl, G. R. (1987). Some effects of the wind on rings. J. Phys. Oceanogr. 17, 1653–1667. doi: 10.1175/1520-0485(1987)017<1653:SEOTWO>2.0.CO;2
Djakouré, S., Penven, P., Bourlés, B., Veitch, J., and Koné, V. (2014). Coastally trapped eddies in the north of the gulf of guinea. J. Geophys. Res. 119, 6805–6819. doi: 10.1002/2014JC010243
Emery, W. J., and Thomson, R. E. (2001). Data Analysis Methods in Physical Oceanography, 2nd Edn. Amsterdam, NY: Elsevier Science.
Garzoli, S. L., Richardson, P. L., Duncombe Rae, C. M., Fratantoni, D. M., Go ni, G. J., and Roubicek, A. J. (1999). Three agulhas rings observed during the benguela current experiment. J. Geophys. Res. 104, 20971–20985. doi: 10.1029/1999JC900060
Harvey, V. L., and Knox, J. A. (2019). Beware of inertial instability masquerading as gravity waves in stratospheric temperature perturbations. Geophys. Res. Lett. 46, 1740–1745. doi: 10.1029/2018GL081142
Holmes, R. M., Thomas, L. N., Thompson, L., and Darr, D. (2014). Potential vorticity dynamics of tropical instability vortices. J. Phys. Oceanogr. 44, 995–1011. doi: 10.1175/JPO-D-13-0157.1
Houry, S., Dombrowsky, E., De Mey, P., and Minster, J. (1987). Brunt-vaisala frequency and rossby radii in the south Atlantic. J. Phys. Oceanogr. 17, 1619–1626. doi: 10.1175/1520-0485(1987)017<1619:BVFARR>2.0.CO;2
Johns, W., Lee, T., Beardsley, R., Candela, J., Limeburner, R., and Castro, B. (1998). Annual cycle and variability of the North Brazil Current. J. Phys. Oceanogr. 28, 103–128. doi: 10.1175/1520-0485(1998)028<0103:ACAVOT>2.0.CO;2
Johns, W. E., Lee, T. N., Schott, F. A., Zantopp, R. J., and Evans, R. H. (1990). The north Brazil current retroflection: seasonal structure and eddy variability. J. Geophys. Res. 95, 22103–22120. doi: 10.1029/JC095iC12p22103
Kloosterziel, R. C., Carnevale, G. F., and Orlandi, P. (2017). Equatorial inertial instability with full coriolis force. J. Fluid Mech. 825, 69–108. doi: 10.1017/jfm.2017.377
Lazar, A., Stegner, A., and Heifetz, E. (2013). Inertial instability of intense stratified anticyclones. Part 1. generalized stability criterion. J. Fluid Mech. 732, 457–484. doi: 10.1017/jfm.2013.412
Lévy, M., Ferrari, R., Franks, P. J., Martin, A. P., and Riviére, P. (2012). Bringing physics to life at the submesoscale. Geophys. Res. Lett. 39. doi: 10.1029/2012GL052756
Lukas, R., and Lindstrom, E. (1991). The mixed layer of the western equatorial pacific ocean. J. Geophys. Res. 96, 3343–3357. doi: 10.1029/90JC01951
Mahadevan, A. (2016). The impact of submesoscale physics on primary productivity of plankton. Annu. Rev. Mar. Sci. 8, 161–184. doi: 10.1146/annurev-marine-010814-015912
Maneesha, K., Murty, V., Ravichandran, M., Lee, T., Yu, W., and McPhaden, M. (2012). Upper ocean variability in the Bay of Bengal during the tropical cyclones Nargis and Laila. Prog. Oceanogr. 106, 49–61. doi: 10.1016/j.pocean.2012.06.006
Marchesiello, P., Capet, X., Menkes, C., and Kennan, S. C. (2011). Submesoscale dynamics in tropical instability waves. Ocean Model. 39, 31–46. doi: 10.1016/j.ocemod.2011.04.011
McGillicuddy, D. J. (2015). Formation of intrathermocline lenses by eddy-wind interaction. J. Phys. Oceanogr. 45, 606–612. doi: 10.1175/JPO-D-14-0221.1
Pegliasco, C., Chaigneau, A., and Morrow, R. (2015). Main eddy vertical structures observed in the four major eastern boundary upwelling systems. J. Geophys. Res. 120, 6008–6033. doi: 10.1002/2015JC010950
Philander, S., Holton, J., and Dmowska, R. (1989). El Nino, La Nina, and the Southern Oscillation. International Geophysics. San Diego, CA: Elsevier Science.
Preisendorfer, R., and Mobley, C. (1988). “Principal component analysis in meteorology and oceanography,” in Developments in Atmospheric Science (Amsterdam; New York, NY: Elsevier Distributors for the U.S. and Canada, Elsevier Science Pub. Co).
Rocha, C. B., Silveira, I. C. A., Castro, B. M., and Lima, J. A. M. (2014). Vertical structure, energetics, and dynamics of the Brazil current system at 22 s-28 s. J. Geophys. Res. 119, 52–69. doi: 10.1002/2013JC009143
Schott, F., Fischer, J., Reppin, J., and Send, U. (1993). On mean and seasonal currents and transports at the western boundary of the equatorial Atlantic. J. Geophys. Res. 98, 14353–14368. doi: 10.1029/93JC01287
Schott, F., Fischer, J., and Stramma, L. (1998). Transports and pathways of the upper-layer circulation in the western tropical Atlantic. J. Phys. Ooceanogr. 28, 1904–1928. doi: 10.1175/1520-0485(1998)028<1904:TAPOTU>2.0.CO;2
Schott, F. A., Stramma, L., and Fischer, J. (1995). The warm water inflow into the western tropical Atlantic boundary regime, spring 1994. J. Geophys. Res. 100, 24745–24760. doi: 10.1029/95JC02803
Silveira, I. C. A., Brown, W. S., and Flierl, G. R. (2000). Dynamics of the north Brazil current retroflection region from the western tropical Atlantic experiment observations. J. Geophys. Res. 105, 28559–28583. doi: 10.1029/2000JC900129
Silveira, I. C. A., Miranda, L. B., and Brown, W. S. (1994). On the origins of the north Brazil current. J. Geophys. Res. 99, 22501–22512. doi: 10.1029/94JC01776
Soutelino, R., Gangopadhyay, A., and Silveira, I. C. A. (2013). The roles of vertical shear and topography on the eddy formation near the site of origin of the Brazil current. Contin. Shelf Res. 70, 46–60. doi: 10.1016/j.csr.2013.10.001
Stevens, D. E. (1983). On symmetric stability and instability of zonal mean flows near the equator. J. Atmos. Sci. 40, 882–893. doi: 10.1175/1520-0469(1983)040<0882:OSSAIO>2.0.CO;2
Stone, P. H. (1966). On non-geostrophic baroclinic stability. J. Atmos. Sci. 23, 390–400. doi: 10.1175/1520-0469(1966)023<0390:ONGBS>2.0.CO;2
Stramma, L., Fischer, J., and Reppin, J. (1995). The north Brazil undercurrent. Deep Sea Res. Part I 42, 773–795. doi: 10.1016/0967-0637(95)00014-W
Von Schuckmann, K., Brandt, P., and Eden, C. (2008). Generation of tropical instability waves in the Atlantic ocean. J. Geophys. Res. 113:C08034. doi: 10.1029/2007JC004712
Wei, J., Wang, D.-P., and Flagg, C. N. (2008). Mapping gulf stream warm core rings from shipboard ADCP transects of the oleander project. J. Geophys. Res. 113:C10021. doi: 10.1029/2007JC004694
Wilson, W. D., Johns, W. E., and Garzoli, S. L. (2002). Velocity structure of north Brazil current rings. Geophys. Res. Lett. 29, 114-1–114-4. doi: 10.1029/2001GL013869
Keywords: equatorial dynamics, submesoscale, North Brazil Current, anticyclonic eddies, symmetrical instability
Citation: Simoes-Sousa IT, Silveira ICA, Tandon A, Flierl GR, Ribeiro CHA and Martins RP (2021) The Barreirinhas Eddies: Stable Energetic Anticyclones in the Near-Equatorial South Atlantic. Front. Mar. Sci. 8:617011. doi: 10.3389/fmars.2021.617011
Received: 13 October 2020; Accepted: 08 January 2021;
Published: 11 February 2021.
Edited by:
Phil Hosegood, University of Plymouth, United KingdomReviewed by:
Xavier Carton, Université de Bretagne Occidentale, FranceChristian E. Buckingham, Université de Bretagne Occidentale, France
Copyright © 2021 Simoes-Sousa, Silveira, Tandon, Flierl, Ribeiro and Martins. This is an open-access article distributed under the terms of the Creative Commons Attribution License (CC BY). The use, distribution or reproduction in other forums is permitted, provided the original author(s) and the copyright owner(s) are credited and that the original publication in this journal is cited, in accordance with accepted academic practice. No use, distribution or reproduction is permitted which does not comply with these terms.
*Correspondence: Iury T. Simoes-Sousa, aXNpbW9lc2Rlc291c2FAdW1hc3NkLmVkdQ==