 Hanna Dumała
 Michał Łuszczuk
 Joanna Piwowarczyk
 Tymon Zieliński
- 1Department of International Relations, Institute of Political Science and Administration, Maria Curie-Skłodowska University, Lublin, Poland
- 2Department of Social and Economic Geography, Institute of Socio-Economic Geography and Spatial Management, Maria Curie-Skłodowska University, Lublin, Poland
- 3Institute of Oceanology, Polish Academy of Sciences, Sopot, Poland
Many municipalities undertake actions individually and/or collectively, in cooperation with central administrations, regional authorities, the private sector, and other municipalities (both nationally and internationally). This paper aims to examine how they use transnational municipal networks (TMNs) as a tool for cooperation that supports marine governance in the context of climate change adaptation and mitigation. The analysis is carried out at two dimensions: spatial range (global or regional) and spatial identity (coastal or inland). Three case studies of TMNs are examined in detail: the C40 Cities Climate Leadership Group (C40); Connecting Delta Cities (CDC) and the Union of Baltic Cities (UBC). As research has shown, due to their organizational and normative limitations and a lack of maturity in ocean literacy, TMNs are not able to fully engage in all the activities related to climate change adaptation and mitigation as suggested by the UNEP. The TMNs implement both mitigation and adaptation measures, although ‘soft’ mitigation actions seem to be the most common. While the scale and innovativeness of a networks’ operation are determined by their specificity resulting from their spatial identity, the effectiveness of jointly developed strategies and actions depend heavily on the allocation of human resources and the level of commitment of the involved cities toward becoming leaders.
Introduction
Climate change has severe consequences worldwide. These consequences – such as a temperature rise or violent weather phenomena – are deepening. This means that they occur more frequently, with greater intensity and on an increasing scale (UNEP, 2019a; NASA, 2020; Pakszys et al., 2020). Cities are particularly sensitive areas, especially coastal ones. In cities with a high population density, the adverse effects of climate change are even more compounded (Heikkinen et al., 2020). The intensification of urban heat islands, a rise in sea-levels, heavy rainfalls causing flooding, strong winds, associated changes in storm patterns, and erosion- are a threat to coastal ecosystems as well as to local economies and human life (Hallegatte et al., 2013; Wong et al., 2014).
Actions undertaken by city authorities should be carried out in two ways: as an adaptation to climate change, and in the form of mitigation (Shi et al., 2016). Implementation of mitigation and adaptation actions is a process that requires the involvement of many actors and institutions on a local, regional, national, and international level (Dupuis and Biesbroek, 2013; Busch et al., 2018; Donatti et al., 2020; Kotynska-Zielinska et al., 2020). Cities undertake actions individually and/or collectively, in cooperation with central administrations, regional authorities, the private sector, and other cities [both nationally and internationally] (Woodruff and Stults, 2016; Heikkinen et al., 2020).
From our point of view, it is particularly interesting to explore international city-networking which is understood here to be a form of bottom-up governance. This paper, therefore, aims to examine how cities (primarily coastal) use networks as a tool of cooperation that supports marine governance in the context of climate change adaptation and mitigation. The analysis is carried out at two dimensions: the spatial range (global or regional) and spatial identity (coastal or inland). Three case studies are examined in detail: C40 Cities Climate Leadership Group (C40), Connecting Delta Cities (CDC), and the Union of Baltic Cities (UBC). The goals of this analysis are to empirically examine (i) what kind of actions prevail in climate-change related cooperation, and (ii) how effective networking is in addressing the challenges of global warming. In other words, within the scope of the first goal we investigate whether networks of cities focus on adaptation or mitigation, and how visible (or how important) the marine environment appears to be in terms of their actions. Within the scope of the second goal, we explore if networks of cities have progressed from soft cooperation instruments (mainly focused on the exchange of knowledge and best practices; e.g., Mansard et al., 2017; Heikkinen et al., 2020) toward more innovative and concrete actions, and whether they have introduced any monitoring activities that would allow to assess the uptake and effectiveness of jointly developed strategies and actions.
Climate Change – Scope of Change and Consequences (Particularly for Coastal Cities)
The land surface air temperature has increased almost twice as much as the global average temperature in less than 250 years. The International Panel on Climate Change (IPCC) reported that economic losses related to weather and climate-related problems in 2017 in conjunction with extreme temperatures, heatwaves and a vast number of wildfires in 2018 were at a record high (Wong et al., 2014; UNEP, 2019a). Climate change severely impacts marine and terrestrial ecosystems. It impacts every aspect of our lives by influencing both social and ecological systems and their interactions. It is obvious that climate change also poses a serious threat to coastal communities, and this is particularly associated with rising sea levels (Hay et al., 2015). Clearly humanity needs to understand that adaptation to climate change is not an option anymore, it is a real need (IPCC, 2014, 2019; Donatti et al., 2020).
The observed climate pattern changes, including both natural and anthropogenic forcing factors are very clearly manifested as a rise in sea level, which has become one of the key indicators of global climate variability (UNEP, 2019a). The sea level rise is a result of water input from melting glaciers and ice sheets as well as an increase in ocean water volume due to its warming.
By 2100, the sea level rise may reach or, in extreme cases, even exceed 2 m if we do not reduce and/or increase atmospheric pollution (greenhouse gases) emissions (Kopp et al., 2017; Kulp and Strauss, 2019).
Humans have ever since settled by the sea. Such a choice relates to a number of factors, such as the prevalence of natural resources, good transportation means, and thereby the facilitation of trade and defense. Maritime transport provides the main means of global import and export of goods. In the European Union, it has been estimated that around 40% of the EU’s external freight trade relies on maritime transport (Collet and Engelbert, 2013).
Today it is estimated that some two-thirds of the world’s population inhabits coastal areas (defined as a region within 60 km of the coast), and therefore these areas exhibit much higher population densities than other regions of the world (Un Atlas of the Oceans, 2020). As a result, the UN Atlas of the Oceans also reports that close to 50% of the world’s large cities (with populations exceeding one million) are located in these areas (Un Atlas of the Oceans, 2020).
A rise in sea level endangers coastal infrastructures around the world, including ports, shipyards and recreational facilities, which are crucial for local job markets and industries. Understanding how a sea level rise may impact coastal areas and their populations is critical for coastal planning and the assessment of potential benefits and costs of climate mitigation, as well as the costs of disasters due to a lack of proper action (Nauels et al., 2017; Kulp and Strauss, 2019).
Coastal urban areas (cities) are critical regions, which will be most affected by a rise in the sea levels driven by climate change. Very often, coastal urban areas are comprised of areas of reclaimed land, which is protected from change (mostly erosion) by means of human made constructions, such as seawalls and rock based structures. Recent estimates show that many coastal regions (mostly urban areas) have over 50 percent of their coastlines strengthened by engineering structures (Chee et al., 2017). The existing protective structures cannot be assumed as adequate to protect against projected future sea levels and storms and with predicted changes in world coastlines, these structures will have to be adapted and/or strengthened in order to be still functional in protecting the land from the sea (Lincke and Hinkel, 2018).
Hallegatte et al. (2013) reported that in the case of 136 of the biggest coastal cities flood related losses would increase from an average of US$6 billion per year in 2005 to US$1 trillion by 2050. On the other hand, well prepared coastal urban areas, which are usually economically strong and enjoy steady economic growth may become centers for climate change mitigation and adaptation activities and hence be the leaders in such type of actions.
Adaptation and Mitigation Strategies and Practices
The IPCC defines climate related adaptation as: “the process of adjustment to actual or expected climate and its effects,” which can be translated to those actions that minimize the adverse effects of climate change. Mitigation of climate change, on the other hand, according to the IPCC relates to “human intervention to reduce the sources or enhance the sinks of greenhouse gases” (IPCC, 2012, p. 556, 561).
In its 5th report, the IPCC compared both approaches and stated that: “many adaptation and mitigation options can help address climate change, but no single option is sufficient by itself” (IPCC, 2014, p. 26).
However, it is obvious that these two strategies, even though both necessary, are quite different, since they produce different outcomes. Adaptation is more related to smaller scale actions (on local and regional levels), while mitigation is a global issue and can be mostly tackled on a much greater scale than adaptation activities.
By their nature, we know that mitigation actions will take several decades to prove to be successful, and so, it is obvious that humans need to keep adapting to the changes which we all experience nowadays and will experience in the future.
There exist a number of approaches to tackle climate change adaptation and mitigation challenges. In order to measure their potential efficiency, certain universal indicators that have the ability to measure the scale of success need to be applied. Most of the indicators are either initiated by the United Nations and their agendas [e.g., Global Adaptation Network (GAN) and Global Centre of Excellence on Climate Adaptation (GCECA)] or are interconnected with the UN [e.g., World Adaption Science Programme (WASP), which was one of the four components that formed the World Climate Programme (WCP) based on the WMO Congress XVI Resolution 18 and has five partners, including the Meteorological Organization (WMO), the Intergovernmental Panel on Climate Change (IPCC), the Green Climate Fund (GCF). The fifth partner, the United Nations Framework Convention on Climate Change (UNFCCC) is hosted by the UN Environment Programme (UNEP)].
The major goal of the 2015 UNFCCC (United Nations Framework Convention on Climate Change) Paris Agreement is to enforce all actions in order to keep the global temperature rise up to 2°C above pre-industrial levels and to strengthen efforts to keep the temperature rise below 1.5°C (IPCC, 2018). However, in order to be realistic, meeting any of these targets will still not resolve all climate change related problems and climate change adaptation measures will still be required. Therefore, the United Nations Environmental Programme is involved in climate change adaptation actions, which are ecosystem-based (UNEP, 2012, 2015; Donatti et al., 2020).
The United Nations has agreed on a total of 93 environment-related Sustainable Development Goals (SDGs) indicators, and the United Nations Environment Programme is responsible for 26 of these indicators. Therefore, the United Nations Environment Programme continues its activities that are focused on developing and refining methodologies to measure SDGs targets, with a focus on climate change adaptation and mitigation aspects.
The four basic UN promoted areas of climate change adaptation activities includes: (1) projects that utilize biodiversity and ecosystem services as part of a holistic adaptation strategy (Ecosystem-based adaptation – EbA); (2) spreading vital adaptation knowledge through well-connected global networks; (3) providing an interface between the adaptation research community and decision-makers (such as the World Adaptation Science Programme – WASP) and (4) supporting countries to advance their National Adaptation Plan (NAPs) processes (UNEP, 2020).
In case of mitigation, eight indicators have been defined by the United Nations Environment Programme Report of 2018, which focus on activities related to climate change and include: (1) minimizing the scale and impact of climate change, (2) minimizing environmental threats, (3) supporting human well-being through healthy ecosystems, (4) strengthening governance, (5) ensuring sound management of chemicals and waste, (6) accelerating the transition to sustainable societies, (7) promoting evidence-based decision-making, and (8) providing knowledge to policymakers (UNEP, 2019b).
In the remainder of the paper, the authors decided to use the mentioned eight climate mitigation indicators and four climate adaptation indicators, as those are officially accepted by the United Nations and thus should provide the most universal tool.
Networking as a Tool in the Marine Governance
Responding to climate change is associated with numerous challenges (Hajer et al., 2015; Xue et al., 2018; Grainger-Brown and Malekpour, 2019; Salvia et al., 2019), including issues related to different aspects, sectors and levels of governance (Visseren-Hamakers, 2015; Biermann et al., 2017; Kanie and Biermann, 2017; Florini and Pauli, 2018; Glass and Newig, 2019). This also applies to the implementation of numerous SDGs, including Goal 13 and 14 and ocean governance, which seem to require a profound transformation based on a more holistic approach (Vierros, 2017). While the effectiveness of sustainable ocean governance depends on different aspects (Glass and Newig, 2019), its organizational forms are essential (Berkowitz et al., 2020), particularly in case of transition governance (Monkelbaan, 2019). As van Leeuwen and van Tatenhove argue, “the dynamics of marine policy making and the power games between different maritime activities and stakeholders […] are increasingly embedded in a multi-level setting and in a rapidly changing institutional context” which is characterized by a “shift from state-led to new, network-like governance arrangements” (van Leeuwen and van Tatenhove, 2010, p. 590). This observation suggests that transnational networking (Risse-Kappen, 2009) of municipal actors can play an important role in the ocean governance for sustainable development, as well as for climate change adaptation and mitigation (Betsill and Bukeley, 2004; Bäckstrand, 2008; Andonova et al., 2009; Florini and Pauli, 2018).
According to a basic understanding, the network consists of nodes and links which display a pattern of connectivity (Taylor and Derudder, 2016). Despite the fact that the term ‘network’ is widely used in different contexts in the literature and represents many scientific disciplines such as transportation, telecommunication, geography, management, sociology and politics (Camagni and Salone, 1993; Ward and Williams, 1997; Sassen, 2002; Taylor and Derudder, 2016), in the social sciences domain a network as a research category is basically applied as an analytical tool or as a form of governance (Forsman and Solitander, 2003, p. 4). In the latter, three approaches to the study of networks can be distinguished: (1) networks as a mode of social coordination, (2) networks as systems of sectoral governance, and (3) networks as interorganizational relations (Halkier and Damborg, 1997, pp. 6–7). According to Torfing, “Transnational governance networks can be understood as a horizontal articulation of interdependent, but operationally autonomous, actors from the public and/or private sector who: (1) interact through ongoing negotiations that take place within a regulative, normative, cognitive, and imaginary framework; (2) facilitate self-regulation; and (3) contribute to the production of public regulations” (Torfing, 2012). Based on past research one can indicate that networks are webs of relatively stable and ongoing relationships between interdependent social actors which acquire or mobilize dispersed resources so that collective (or parallel) actions can be orchestrated toward a solution within the scope of tackling a common policy problem (Kenis and Schneider, 1991, p. 36; Conti, 1993, p. 126; Marsden, 2000, pp. 2727–2728; Forsman and Solitander, 2003, p. 5; Mingus, 2007).
The driving force in the establishment of governance networks is the social and political actors’ recognition of their mutual dependence (Torfing, 2012) as well as micro-level incentives and diffusion processes that create and spread normative impacts (Andonova et al., 2017, p. 253). While transnational governance networks “provide a functional response to the growing differentiation, complexity, and multilayered character of modern societies” (Torfing, 2012, p. 106), they are established via flexible co-operation processes such as agreements of understanding, rather than being formal results of intergovernmental agreements (Cannarella and Piccioni, 2008; Andonova et al., 2009). It is commonly emphasized that the standing of such networks is associated with their “ability to provide information, create knowledge, and to forge norms about the nature and terms of particular issues” (Betsill and Bukeley, 2004, p. 2). One of the areas of territorial network cooperation is urban development. In this context urban networking is understood as both a way of arranging strategic development within the urban region and as a way of organizing co-operation between urban regions (Varitiainen, 2000). While urban networking relates to a specific subset of cooperation, the term municipal networking relates to a form of co-operation between cities, which is examined in two different sets of academic literature: in urban studies (which includes subjects such as political geography and urban sociology) and in political studies (political science, political sociology, and international relations).
As Salomon argues, municipal networks are voluntary cooperation schemes constituted by local governments with varying degrees of institutionalization (Salomon, 2009), where “cooperation tends to get a synergetic effect in which the achievable output (…) is higher than the one that single cities could gain through the exploitation of their single resources” (Rossignolo, 2009, p. 13). There are three main different types of networks. Firstly, there are networks of metropolises – world cities – which perform the whole range of city functions and compete and co-operate amongst themselves at the same time (Sassen, 2001). Secondly, there are networks of specialized national cities, which co-operate with each other as and when desirable (Conti and Spriano, 1989), and lastly there are networks of specialized regional cities, which also co-operate as and when advantageous. The first type of network is essentially one which is based on synergy, whilst the others are either specialized or complementary networks (Ercole et al., 1997, p. 221).
Since the advent of Agenda 21 cities have been engaged in the development of environmental sustainability and the amount of transnational municipal networks (TMNs) that address related challenges have grown (Bouteligier, 2014, p. 57). We here define such TMNs related to climate change to be organizations that aim to support cooperation between cities to improve their climate change mitigation and adaptation work. TMNs can require cities to adopt certain quantitative or qualitative climate goals. They organize events, produce information (e.g., reports on their members’ climate actions), offer tools and/or resources and represent cities internationally. TMNs originally concentrated on mitigation, but adaptation has increasingly become part of their agenda (Heikkinen et al., 2020). Today, there exists a large variety in TMNs for the purpose of global environmental governance. Some are large (e.g., the International Council for Local Environmental Initiatives – Local Governments for Sustainability, or ICLEI), whereas others are smaller (e.g., the Mega-Cities Project), they can have a broad scope (Metropolis) or focus on a specific issue (Energie-cités) and they can appeal to smaller (the Sustainable Cities and Towns Campaign) or larger (the C40 Cities Climate Leadership group) cities (Bouteligier, 2014, p. 57). The different types of TMNs can be distinguished according to different criteria, such as: (1) the degree of institutionalization: strong or weak; formal or informal; (2) spatial range (global or regional); (3) spatial identity (costal or inland); (4) the scope of activities and areas of actions – engaged in many issues and tasks or concerned with a specific policy area or even a single task (Betsill and Bukeley, 2004; Bäckstrand, 2008). One might distinguish two other types of networks – the so-called synergy network, made up of similar cities, and the complementary network, made up of specialized but complementary cities (Ercole et al., 1997, p. 221). An important distinction is also between dispersed networks and adjacent networks – the former encompasses cities located in distant localities, the latter are made up of neighboring cities (Dumała, 2012).
Transnational governance arrangements provide many governance functions – such as rule-setting, dispute resolution, and public good provision – which are traditionally associated with national governments and intergovernmental organizations (Andonova et al., 2017, p. 256). TMNs allow for the sharing of knowledge and best practices, the coordination of action, or joint problem-solving (Torfing, 2012); moreover, they facilitate better communication and cooperation as well as innovative policy diffusion (Feldman, 2012). They also provide access to resources, markets and capabilities allowing for the combination of different pieces of knowledge (Cassi et al., 2008). Bringing together municipal governments to cooperate on tackling common environmental problems, TMNs serve as international communication and representation platforms providing cities with the opportunity to voice their concerns (Bouteligier, 2013a). Cities from different regions and countries tend to share their experiences and their cultures within the networks in order to develop common spatial or social strategies and further cooperation (Baycan-Levent et al., 2010).
Research on the activities of TMNs in the field of adaptation and mitigation of climate change is relatively new in the literature. Scholars are interested in e.g., the role of TMNs in shaping the trend of the emerging urban climate governance (Bulkeley et al., 2003; Toly, 2008; Kern and Bulkeley, 2009; Juhola and Westerhoff, 2011; Lee, 2013), their effects, including their capacity to generate novelties (Papin, 2019, 2020), the role of networks in urban ‘experimentation’ (Smeds and Acuto, 2018), and the actual impact of network participation, especially in the context of adaptation (Heikkinen et al., 2020).
Analytical Framework
Materials and Methods
In order to investigate whether city networking is a useful tool to address climate change-related issues, we have analyzed the documents and activities of three city networks, i.e., (i) the C40 Cities Climate Leadership Group (C40), (ii) CDC, and (iii) the Union of the Baltic Cities (UBC). We have chosen these three networks in order to illustrate the various types of cooperation described in the literature (Table 1). By doing so, we attempt to explore whether network characteristics (e.g., spatial range or the degree of institutionalization) influence the forms in which adaptation and mitigation are perceived and addressed.

Table 1. Overview of the analyzed networks.
We analyzed materials and documents available on the networks’ webpages; the analysis was performed between March and July 2020. Due to the large amount of available materials, we have adopted two criteria to guide our analysis. Firstly, we have only considered the activities of a given network as a whole, i.e., even if webpages provided additional materials about climate-related activities and achievements of individual members, such information has been excluded from the analysis. This approach allowed us to focus on ‘networking,’ i.e., joint activities and the possible added value of operating within a community of interests. Secondly, we predominantly focused on (i) high-level and strategic documents, and (ii) the information included in the major segments of the networks’ webpages. In other words, we have neither analyzed in detail the content of all reports and publications prepared by the network, nor the content of other resources that were accessible through the provided links. Our analysis was complemented by using a search engine, i.e., in each case, we used key phrases related to each mitigation and adaptation indicator (Tables 2, 3) in order to identify content that could have been omitted in the previous step.
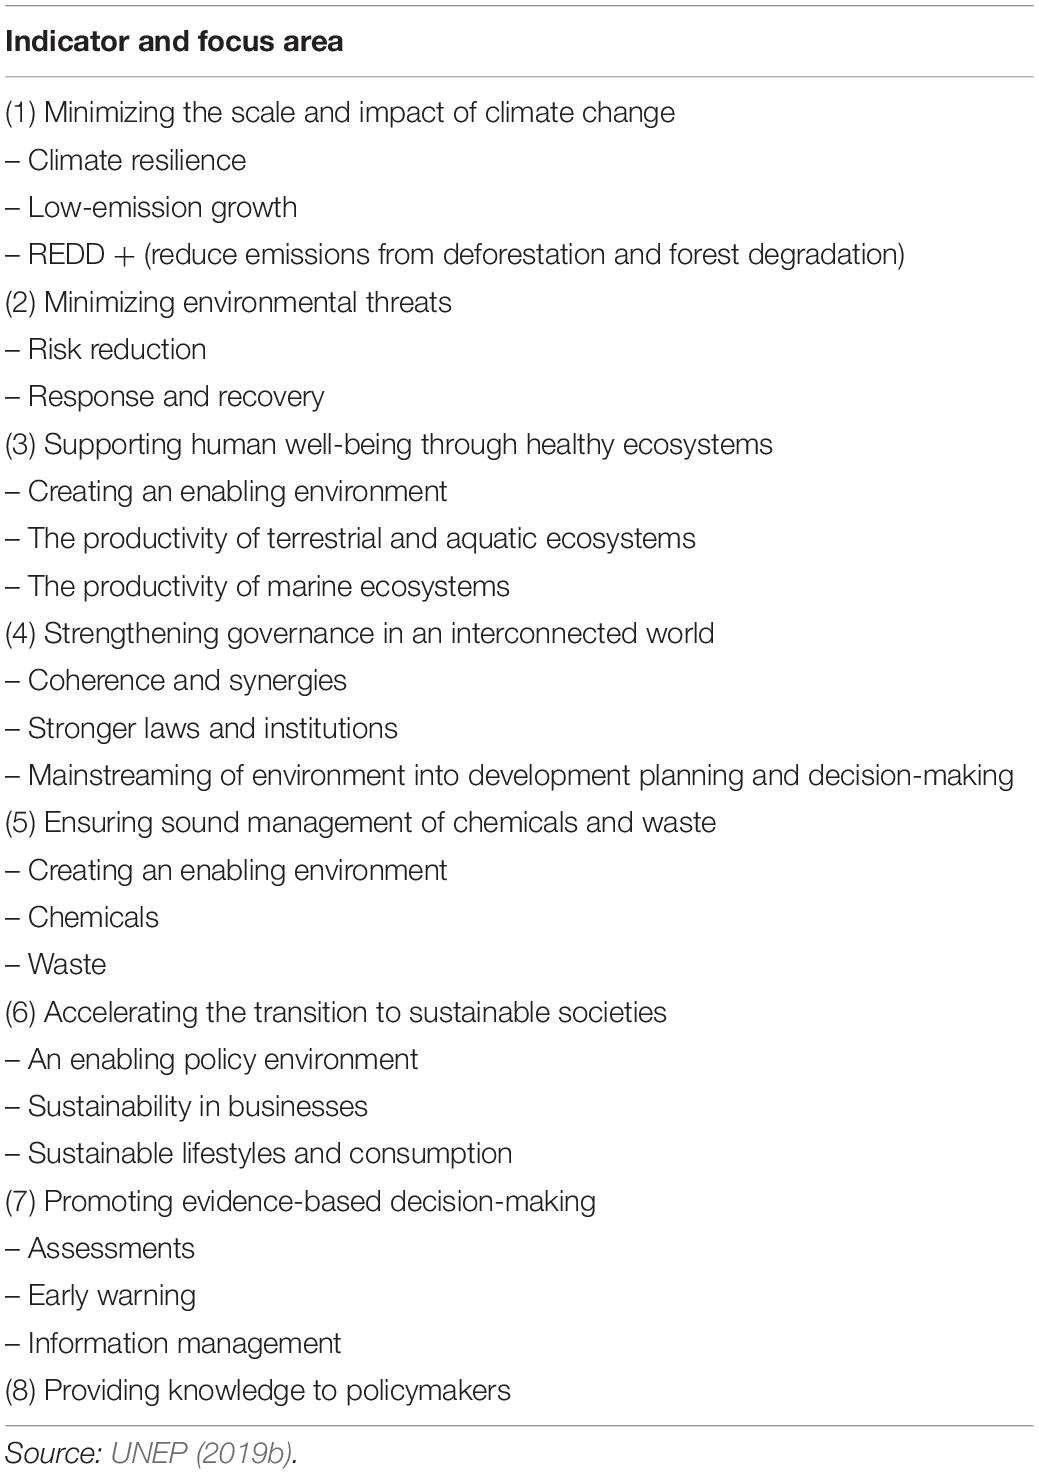
Table 2. UNEP climate mitigation indicators.
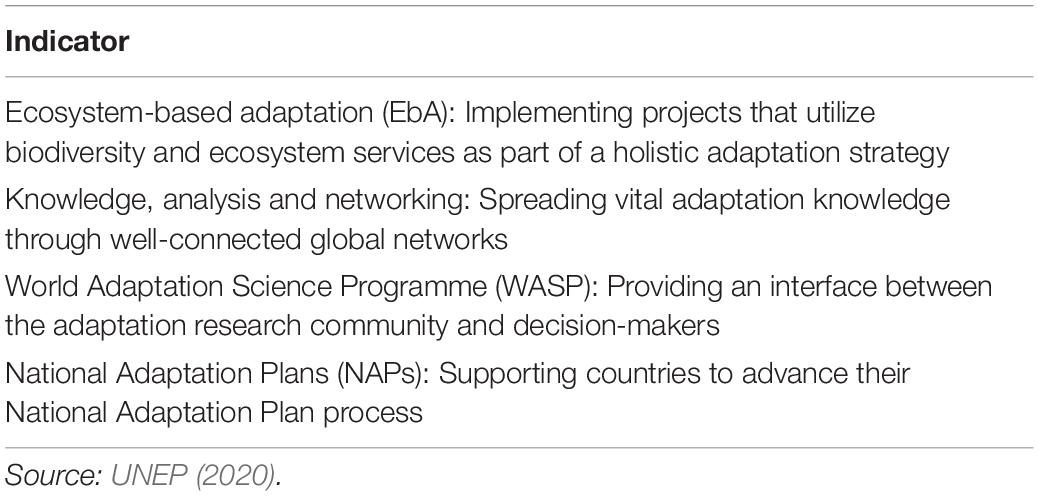
Table 3. UNEP climate adaptation indicators.
We used the content analysis (interpretation of text; Krippendorf, 2004). The relevant content was identified and synthesized according to two sets of pre-defined criteria. Firstly, we explored how network activities fit into (or are relevant to) UNEP mitigation and adaptation indicators (Tables 2, 3). We approached the criteria broadly, i.e., we assumed that ‘an action’ or ‘a statement’ addresses the indicator if its results could contribute to the ambitions described by UNEP. Therefore, we did not expect that a certain word or phrase (e.g., ‘productivity’ in case of indicator three) necessarily needs to appear in the text to have the text classified as relevant to a given indicator. Secondly, each of the network’s activities1 was assigned to one instrument of networking (Table 4). This allowed us to identify what types of cooperation and what instruments are most commonly employed in climate-related networking at the city level. The list of instruments followed the classification put forward by Dumała (2012), which we arranged according to three areas of activities covering the main functions that are performed by transnational networks (Andonova et al., 2009; Strange, 2012; Niederhafner, 2013). In her work, Dumała (2012) presents a comprehensive overview of the various types of cooperation instruments that were applied by dispersed territorial networks in Europe. As the networks we analyzed include cities from all over the world, and not only within Europe, we did not take into account those instruments that are unique to the European area, such as cooperation with the Committee of the Regions or an office in Brussels.
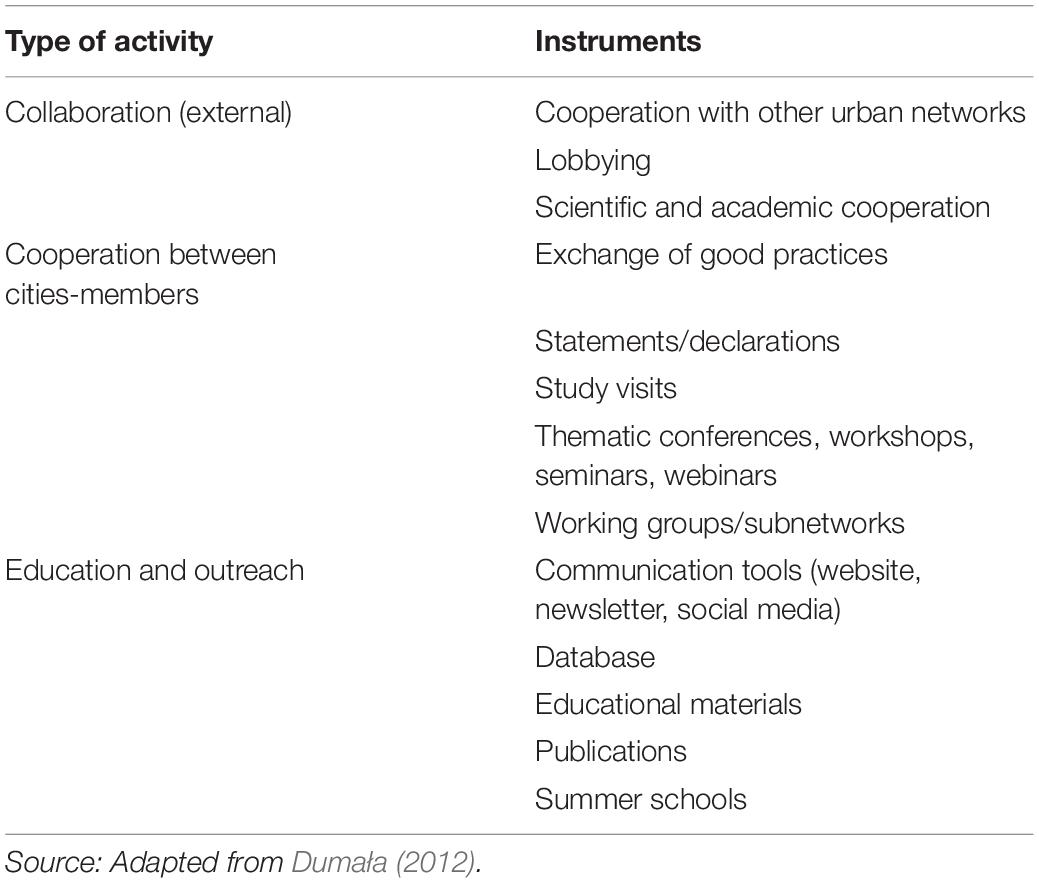
Table 4. List of cooperation instruments.
Networks – Case Studies
The C40 Cities Climate Leadership Group (C40)
The C40 Cities Climate Leadership Group was established (as C20) in October 2005 in London during the World Cities Leadership and Climate Summit, which was attended by 18 major cities form Europe, America and Asia (Barcelona, Beijing, Berlin, Brussels, Chicago, London, Madrid, Mexico City, New Delhi, New York, Paris, Philadelphia, Rome, San Francisco, São Paulo, Shanghai, Stockholm, Toronto, and Zurich). By 2006, the number of cities had grown to 40, and therefore the name was changed into C40. In April 2011 there was a formal merger between C40 and the Clinton’s Climate Initiative Cities Programme (C40, 2016a, p. 8).
C40 is a formal network with the status of a non-profit organization registered in the United States and has registered offices in New York (United States), London (United Kingdom) and Pretoria (South Africa), and a representative office in Beijing (China).
C40 is global in spatial range – it connects 94 of the world’s greatest cities (Africa 12, Europe 20, Latin America 12, North America 17, Asia and Oceania 33), representing over 700 million people and 25% of the global GDP (C40, 2020a). There are three types of membership categories in C40: Megacities, Innovator Cities and Observer Cities (C40, 2012). The members include both coastal and inland cities.
The C40 organizational structure includes: a Steering Committee – consisting of the mayors of C40 cities, and provides strategic direction and governance for C40. Members are elected to represent cities from within their respective geographic regions (7: Africa; Central East Asia; East, South-East Asia & Oceania; Europe; Latin America; North America; South and West Asia), in addition to a representative from the ranks of C40’s Innovator City members. The C40 Board of Directors oversees the management and day-to-day activities of the organization. The Chair is the elected leader of the organization. The Chairmanship is a rotating position (C40, 2020b). C40 summits are held every 2 years. This event has so far been held in London (2005), New York City (2007), Seoul (2009), São Paulo (2011), Johannesburg (2014), Mexico City (2016), and Copenhagen (2019).
The network activities are conducted through 16 inner networks in five policy areas closely related to climate change in which city governments are most likely to be equipped with the necessary legal powers to take action: Air Quality; Food, Waste and Water; Energy and Buildings; Transportation and Urban Planning; Adaptation, Implementation (C40, 2020c). The C40 is therefore a specialized, monothematic network. The specific aim of the C40 is the creation of a Global Green New Deal – a series of essential steps to “cut emissions, invest in clean energy, protect natural resources on a global scale, and ensure a just transition for all, and particularly the most disadvantaged” (C40, 2019, p. 2).
C40 has been present on all major social media platforms since 2011 and works with many other public and private partners.
Connecting Delta Cities
The Connecting Delta Cities is a sub network within the framework of the C40 and it brings together delta and coastal cities that are active in the field of climate change related spatial development, water management and adaptation (Molenaar et al., 2013). It was founded following a workshop on climate change adaptation in C40 cities that was organized in Tokyo in 2008 (Molenaar et al., 2013).
The CDC connects 13 cities (Rotterdam, Tokyo, Jakarta, Hong Kong, New York, New Orleans, London, Ho Chi Minh City, Melbourne, Copenhagen, Venice, Singapore, and Washington DC) and it is led by Rotterdam (C40, 2020d).
The CDC Network was established to deliver concrete climate change adaptation actions by supporting cities in developing and implementing their climate change adaptation strategies. This goal has been achieved through (1) exchanging knowledge on climate adaptation, (2) sharing challenges and lessons learned, policy and infrastructure solutions, research and information, (3) discussing technical and financial partnerships with one another, and (4) facilitating the sharing of good practice and technical expertise (Molenaar et al., 2013; CDC, 2017; C40, 2020d).
While at the policy level the CDC links cities together via bi-lateral Memoranda of Understandings and Letters of Intent, the organizational dimension of cooperation is more composite. In general, the involvement of each city depends on how the individual cities have organized the development of their adaptation plans. Usually, each city has a pool of institutes and experts (policy experts, scientists, business professionals) involved in developing and implementing adaptation plans and these entities are encouraged to participate in a network to support CDC activities (mainly conferences and joint publications) by providing information on climate trends, impacts and adaptation options. In order to manage the flow of information between CDC cities, a small CDC secretariat has been installed in Rotterdam (CDC, 2017). CDC cities have prioritized focus areas which include (C40, 2020d):
– Systematic Adaptation – Moving from ad hoc adaptation to integrated systematic and holistic adaptation;
– Sustainable Urban Drainage – green infrastructure and surface drainage typologies and policies for delta cities;
– Monitoring and Evaluation – methods and standards for indicating the efficacy of adaptation actions;
– Cost-benefit and Co-benefit Assessment – providing economic and social justification for adaptation actions.
CDC cities are among the most advanced in terms of climate change adaptation and are prepared to open themselves up to broader cooperation with peer cities around the world by sharing good practices with them (C40, 2016b, p. 9). While since 2017 the CDC network has limited its activities, a contacted C40 officer claims that there are plans to reinvigorate the network.
In the context of the introduced classification of the TNMs, CDC is an informal network with a weak level of institutionalization, with a global spatial range. It is characterized by delta and/or costal spatial identity, and its activities are focused on selected areas related to the fields of climate change-related spatial development, water management and adaptation.
The Union of Baltic Cities (UBC)
Union of Baltic Cities is a voluntary, proactive, international network, which was founded in 1991 in Gdańsk (Poland), and comprises of cities from ten countries around the Baltic Sea Region (BSR): Denmark, Estonia, Finland, Germany, Latvia, Lithuania, Norway, Poland, Russia, and Sweden. UBC has the following structure (UBC, 2020a): a General Conference, an Executive Board, a Presidium, Commissions, a Secretariat and Board of Audit. The network activities are conducted through seven Commissions: Cultural Cities, Inclusive and Healthy Cities, Planning Cities, Safe Cities, Smart and Prospering Cities, Sustainable Cities, and Youthful Cities (UBC, 2020b). The UBC Commissions are established by the General Conference and they are responsible for member cities’ actions in key areas of interest. The Commissions have their own budgets with various sources of income, and they are responsible for activities which involve; projects, meetings, seminars, exchange programs, events, publications, etc. (UBC, 2020a). The Commissions provide consultations, advice, and initiatives to attract financial resources for those projects that are selected at annual meetings of the Commissions and they report to the Executive Board and to the General Conference (UBC, 2020a).
The UBC’s overarching aim is to mobilize and share the potential of its member cities. The specific aims of the UBC are to (UBC, 2015, p. 1):
– Promote cooperation and facilitate the exchange of experiences between cities in the BSR to advance and deliver sustainable urban solutions and promote the advancement of the quality of life, and thereby foster added value.
– Promote cities as drivers for smart, sustainable, green and resource-efficient growth.
– Advance cities as inclusive, diverse, creative, democratic and safe hubs, where active citizenship, gender equality and participatory policy making are promoted.
– Advocate in favor of common interests of cities and their citizens, act on their behalf and further the interests of the BSR.
The UBC and its Member Cities work in close cooperation with other partners and participate actively in the implementation of regional strategies, notably the European Union Strategy for the Baltic Sea Region.
The UBC pays strong attention to sustainable development and climate change issues. During the 15th UBC General Conference, which was held on 15–18 October 2019 in Kaunas, Lithuania, the Resolution on Climate Change Adaptation and Civil Protection was accepted and will be realized in the upcoming years (UBC, 2019).
Results
Relevance of UNEP Indicators
The analysis of the networks’ webpages resulted in the identification of a plethora of activities and statements related to mitigation and adaptation efforts undertaken by the networks as a whole (Tables 5, 6).

Table 5. Networks and UNEP climate mitigation indicators2.
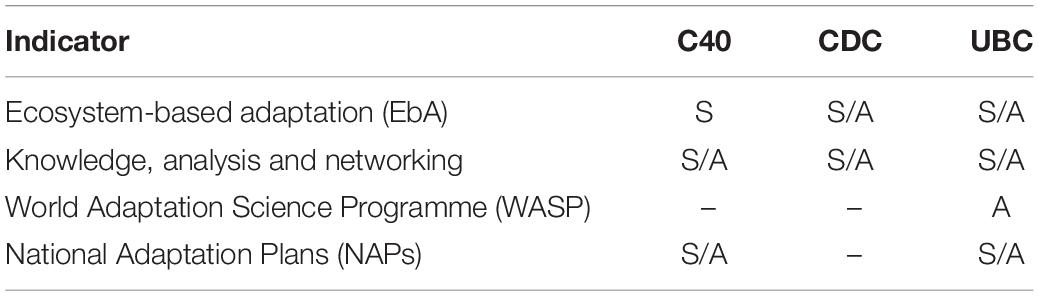
Table 6. Networks and UNEP climate adaptation indicators.
Out of the three analyzed networks, UBC seems to include climate change mitigation and adaptation ambitions most comprehensively in its activities. This is surprising as it is the only multi-sectoral network that does not singularly focuses on climate change. Despite being coastal in its core and hence being more vulnerable to a rise in sea level and its associated effects, the CDC shows little interests in climate change-related actions (even though it defines itself as an organization that focuses on the effects of global warming). However, this network is – in general – less active than the other two networks; this is perhaps because it has a more informal character, and is merely a part of a larger formalized organization, i.e., C40.
Nevertheless, the analyzed networks address the majority of UNEP mitigation and adaptation indicators. The issues related to climate change are present both in the forms of statements in the networks’ documents, and in practical actions undertaken by the networks themselves and their member cities. The CDC is the least active network, which is demonstrated by the limited number of indicators present in this network’s activities.
But what about preferences for mitigation and adaptation indicators? The answer is that our analysis does not reveal any clear patterns. The comparison is even more difficult because of the relatively great difference in terms of numbers between adaptation and mitigation indicators. It seems that the UBC is active in both areas, i.e., its actions and statements cover all adaptation activities (Table 6) and the majority of mitigation activities (over 90%; Table 5). C40 seems to be more active in the field of mitigation, while CDC seems to prefer climate adaptation. However, the last result is subject to severe limitations since this network does not seem to be truly operational.
Overall, our results suggest that the geographical coverage – or otherwise the vicinity of the location(s) – is the most important factor that shapes the preferences for adaptation or mitigations actions. Hence, the UBC seems to be the leader in the climate change related actions when compared with the other two networks. We can speculate that it is both due to the shared resource (i.e., the Baltic Sea) that connects the cities but also due to the influence of the European Union and its policies have on the network’s own policies and strategies. Indeed, the UBC is quite efficient in absorbing the European funding, and this obviously requires that the organization is familiar with the European ambitions and embrace them in own (strategic) goals and activities.
It is perhaps not surprising that the most common indicators are those that pertain to knowledge. All three networks undertake actions to disseminate information and best practices on how to adapt or how to mitigate the effects of global warming. The C40 ‘Climate Change Adaptation Monitoring, Evaluation and Reporting (CCA MER) Framework’ illustrates such efforts. This framework was developed to assist city planners and policymakers in identifying best practices and measuring progress toward climate change adaptation. Another example is the UBC initiative to create a series of webinars related to various (environmental) topics such as stormwater management or CDP reporting.
Overall, there are few differences between the two active networks. However, one difference seems to be most notable. It is a lack of focus on productivity and the state of health of various types of ecosystems (mitigation indicator no. 3; Table 5). Only UBC explicitly mentions the state of natural ecosystems in its ‘Sustainability Action Programme 2016–2021’ aiming to increase biodiversity in urban areas or the enhancement of the ecological status of the Baltic Sea. Although these goals are rather general, they are accompanied by at least some concrete actions. Perhaps the most prominent example of practical actions is the Baltic Smart Water Hub; an on-line tool that collects good practices and ready-to-implement technical solutions and tools within the scope of four thematic areas; i.e., fresh water; sea water; storm; and waste water. Among the available resources, some directly concern adaptation to climate change (e.g., Energy Performance and Carbon Emissions Assessment and Monitoring) or support the enhancement of the ecological status of natural ecosystems (e.g., the Green Area Factor). UBC is also the network that includes an ecosystem-based adaptation in its policies and – to a limited extent – in its actions, i.e., the already mentioned Green Area Factor that in its description underlined the role of green infrastructure (green surfaces) in addressing climate change. Interestingly, this approach is strongly recommended by the CDC, which underlines not only the role of green infrastructure but also blue one.
This lack of focus on ecosystems and their productivity is interesting, especially since all networks have declared efforts to promote environmental sustainability into planning and policy-making. It seems that within the scope of this indicator, cities forming the networks focus on emission neutrality, water storage or providing barriers between the sea and the urban coast while not linking any of these benefits with the health of seas and oceans (and land). Our analysis does not allow us to provide plausible justification for this situation. Nevertheless, we can speculate that it is again the vicinity of the Baltic Sea that makes UBC the front-runner in this area as well. The Baltic Sea region countries have long cooperated in the field of environmental protection (e.g., Kern, 2011) and it is likely that the network of cities from the region follows or at least embraces ambitions widely accepted at respective national levels. Cooperation with the EU and its funding does probably provide additional important trigger that brings UBC toward larger recognition of having a sound environmental status.
Analysis of Networking Tools
The available data on the three examined networks allows the identification of a set of 17 instruments used by the networks that focus on climate change. During the research we identified additional instruments such as: competitions and awards, collaboration with the private sector, technical assistance, training programs/webinars.
We classified the identified instruments into three categories of activities: cooperation between cities-members, collaboration (external), education and outreach (Table 7).
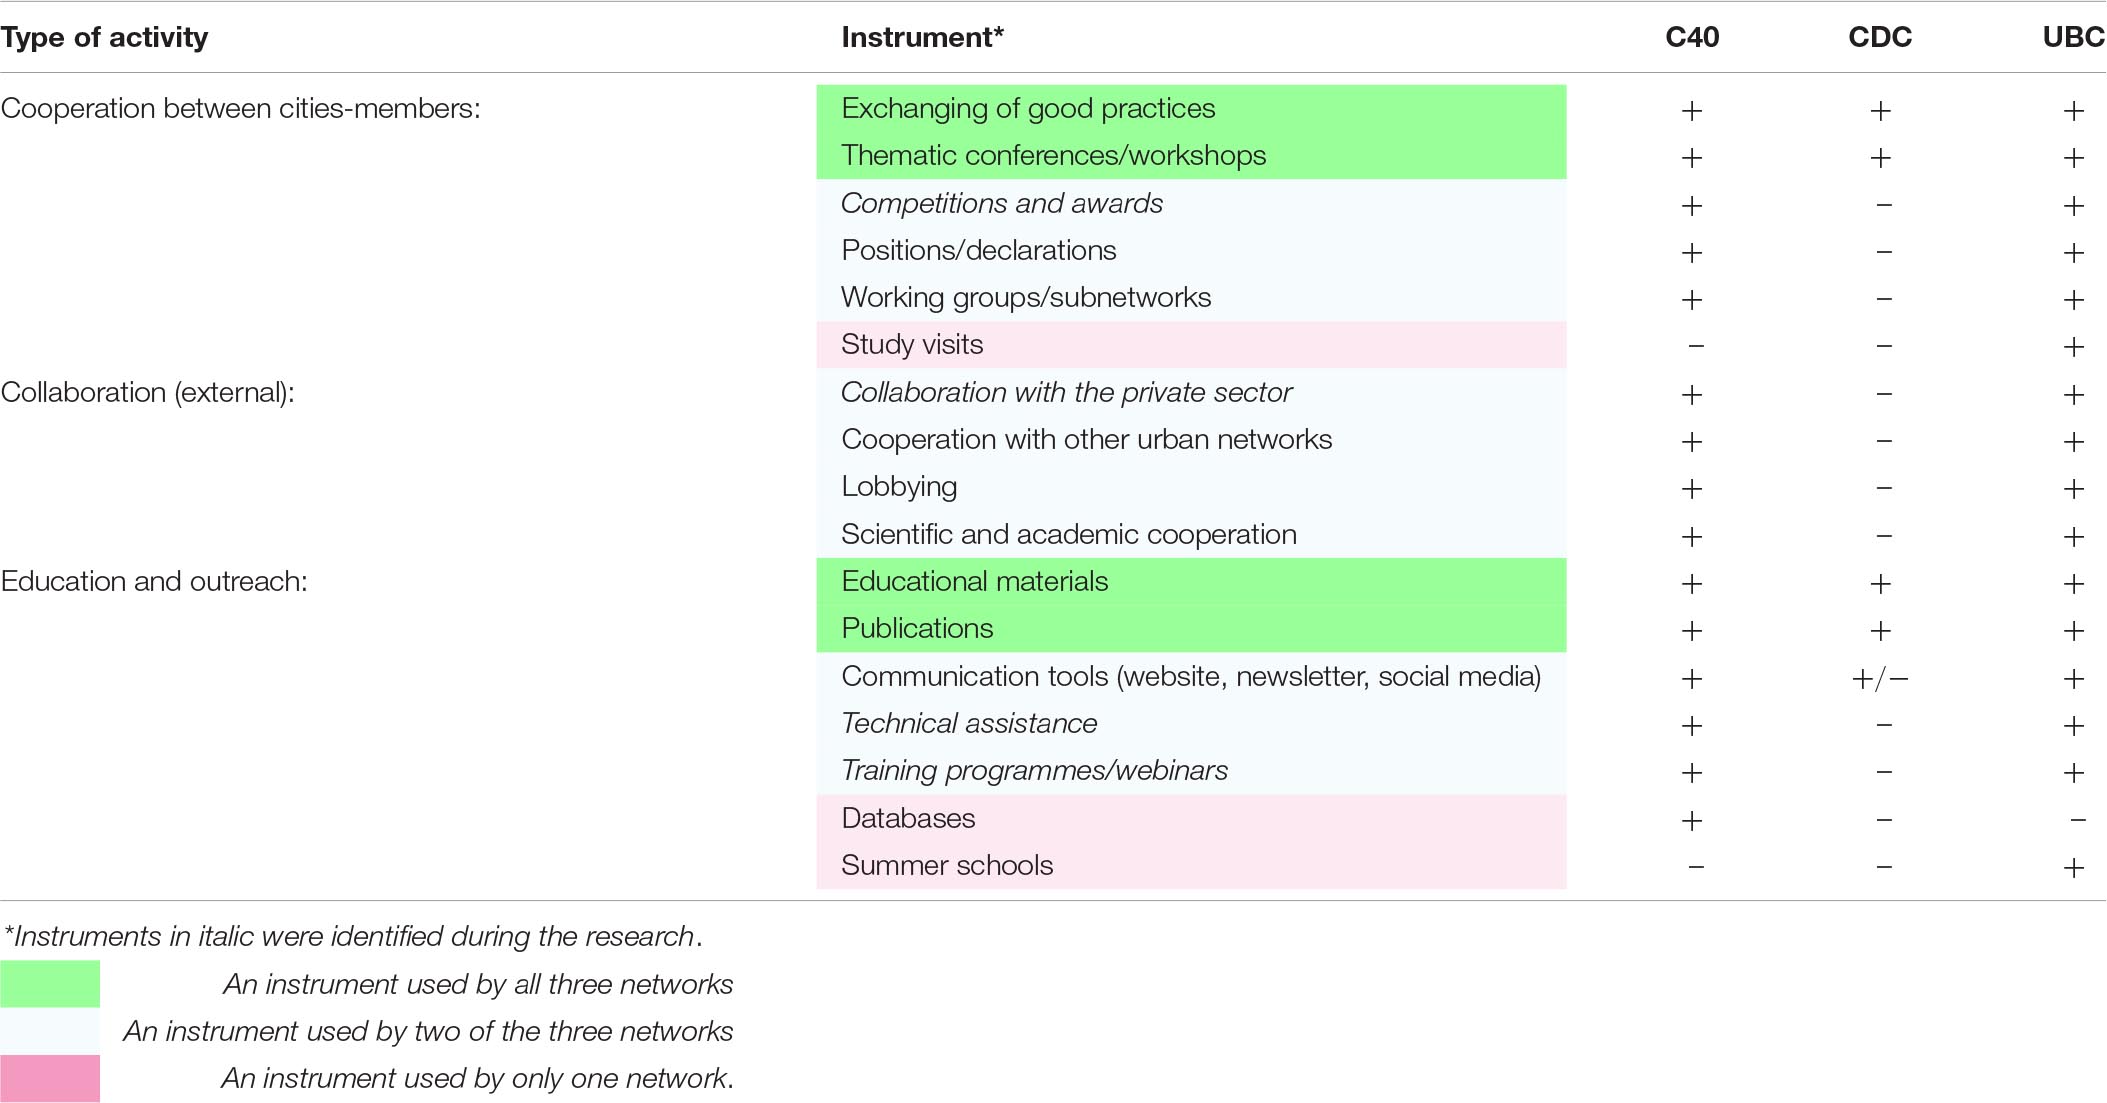
Table 7. Types of activities and applied instruments – data from C40 Cities Climate Leadership Group (C40), Connecting Delta Cities (CDC), and Union of Baltic Cities (UBC).
There are four major observations concerning the types of instruments the TMNs use. First, each of the 17 considered instruments is used by at least one of the networks. Second, most of the instruments are used by UBC – 17, the CDC uses only 5 of them. It should be emphasized, however, that due to the multi-thematic nature of UBC, the tools used are not only related to the issue of climate change, while in the case of C40 and CDC all identified forms and tools concern this issue. Thirdly, the least used tools are running databases, lobbying, organizing study visits and summer schools. Databases are created only by the C40, while the remaining instruments are used by UBC. Fourthly, the most popular and most frequently used instruments are: the exchange of good practices, thematic conferences/workshops, dissemination of educational materials and other publications.
Based on the qualitative analysis we would like to formulate a few comments relating to the selected instruments – those most commonly used and the ones that are particularly valuable and innovative in the context of activities related to climate change.
Exchange of Good Practices
The exchange of good practices takes place in the form of databases and publications, but also takes place during organized conferences, workshops and training seminars. The C40 has created a special website for this purpose3. Since 2015 the C40, in cooperation with partners (Sustainia – international think tank, Realdania – a Danish philanthropic association, Nordic Sustainability – a Copenhagen-based consultancy), issues reports such as ‘The Cities 1000’ containing 100 solutions from cities around the world on climate action. As emphasized: “The final 100 city solutions will serve as a guide to creating the resilient and sustainable urban environments of the future.” The UBC’s database of good practices is available on a blog run by the UBC Sustainable Cities Commission4. The CDC published good practices in 2016 in the form of the Climate Change Adaptation in the ‘Delta Cities Report. Good Practice Guide.’
Thematic Conferences/Workshops
Summits, workshops, and conferences take place on a regular basis to facilitate the exchange of ideas and best practices as well as build personal interactions (in addition to virtual ones). A flagship event for the C40 is the C40 Summit that takes place every 2 years. “At the summits, mayors present their ’groundbreaking projects,’ forge strategic partnerships and announce new initiatives to the public” (Lin, 2018, p. 119). The C40 workshops are organized primarily by networks and are more focused on specific themes of a more technical nature (for example: Waste Workshop, London, March 22–24, 2010; Sustainable Communities: Collaborating, Planning, Delivering, Melbourne, March 28–30, 2012; Solid Waste Networks Workshop, Milan, October 1–3, 2014; C40 Green Growth Network Workshop, Vancouver, March 2, 2016). The CDC organized two multi-day conferences in Rotterdam entitled “Deltas in Times of Climate Change” (2010, 2014) and the workshop: The CDC Workshop (2013). The UBC organized a lot of events of different sizes and for different audiences, e.g., the UBC Climate Resilience Webinar that was held on 26 March 2019 and the UBC Sustainable Cities Commission organized a meeting entitled “Resource Wisdom and Biosphere areas in UBC cities” in Jyväskylä on 16–18 May 2017.
Educational Materials
The most elaborate of the provided educational materials are videos, electronic publications and dedicated portals, such as the C40 Knowledge Hub (see footnote 2) or the CDC Knowledge Portal5. The C40 also has a special tab on its website6 where you can search for examples of effective actions taken by member cities. In cooperation with ICLEI and the World Resources Institute the C40 launched the Global Protocol for Community-scale Greenhouse Gas (GHG) Emission Inventories to support cities to measure and report city-wide GHG emissions in a robust, comprehensive and consistent way7. This enables cities to understand the contribution of different activities and track the impact of climate actions. Consistent with IPCC Guidelines, the Protocol also allows for a credible comparison and aggregation across timescales and geographies, which helps to inform city-wide climate strategies. The UBC does not make much general material available, but provides educational materials that are related to specific events, e.g., the UBC Sustainable Cities Commission shares materials from the webinar “Climate change adaptation through smart stormwater management” organized on 28 April 2020.
Publications
The nature of the network’s publications is differentiated. The networks publish promotional and informational materials in electronic and/or paper form (UBC). There are various types of cyclical magazines published that have a different frequency (semi-annual UBC Baltic Cities Bulletin – each number is devoted to a special theme – e.g., the issue of spring 2017 was entitled “Sustainable and climate-smart Baltic Sea Region Cities.” Moreover, each Bulletin covers information on the latest UBC meetings and activities, news from member cities and more. A separate Bulletin is also published by the UBC Sustainable Cities Commission: the “Sustainable Cities Bulletin”), it reports on the implementation of programs and projects (e.g., the C40 Infrastructure Interdependencies + the Climate Risks Report, Spring 2017; a UBC Report on Climate Leadership from the Baltic Sea Region Cities, October 2017), factsheets about its activities (e.g., C40 Networks. Connecting Cities to Deliver Climate Action) and thematic studies [e.g., ICLEI, C40 (2018), Data Speak Louder than Words. Findings from an initial stocktake of climate change adaptation and urban resilience efforts; Molenaar et al., 2013; CDC; Resilient cities and climate adaptation strategies].
Competitions and Awards
Interesting forms of the networks’ activities are competitions and awards. Since 2013, the C40 organizes the C40 Cities Bloomberg Philanthropies Awards (Siemens was a partner in the City Climate Leadership Awards for years 2013 and 2014), which aims to recognize in cities within the scope of seven categories (e.g., The future we want engages all citizens, The future we want uses green technologies) that have implemented outstanding projects, programs, policies and practices to combat climate change, reduce climate risks and improve lives in their communities8. Additionally, the C40 organizes a global competition for innovative, carbon-free and resilient urban projects (e.g., Reinventing Cities). The UBC also supports the Baltic Sea Award granted to a person or an organization which has made meaningful and outstanding contributions to the Baltic Sea environment.
Cooperation With Other Urban Networks
The examined networks are open to cooperation with other TMNs. The C40 has good working relations with the ICLEI – Local Governments for Sustainability, United Cities and Local Governments (UCLG) and the Global Covenant of Mayors. The UBC is a member of the Conference of European Cross-Border and Interregional City Networks (CECICN) established in April 2010, which is an EU platform of city networks. Its objective is to boost territorial cooperation among cities with specific geographical features in Europe. The UBC has enhanced its cooperation with other Baltic Sea urban networks such as the Baltic Metropoles Network (BaltMet) and is also developing contacts with Baltic interregional networks, i.e., the Parliamentary Conference on Cooperation in the Baltic Sea Area, the Baltic Sea States Subregional Cooperation (BSSSC) and the Conference of Peripheral Maritime Regions (CPMR) Baltic Sea Commission.
Technical Assistance
Many city authorities have limited resources, and the implementation of climate actions requires significant time, money, and human resources. The networks help overcome the constraints that member cities face. Two C40 programs deserve special attention: C40 City Advisers and C40 Cities Finance Facility (CFF). C40 City Advisers are dedicated staff supporting selected member cities in the development and implementation of priority policies, programs, and projects to reduce GHGs and/or climate risks9. The C40 Cities Finance Facility is the result of collaboration between the C40 and the Deutsche Gesellschaft für Internationale Zusammenarbeit (GIZ) GmbH. The CFF facilitates access to finance for climate change mitigation and resilience projects in urban areas by providing technical assistance to develop cities’ sustainability priorities into bankable investment proposals10.
Communication Tools (Website/Social Media/Newsletters)
All three networks are present on the Internet – have their own websites11,12,13, and C40 and UBC also have accounts on popular social media platforms such as Facebook, Instagram, Twitter, YouTube and LinkedIn. Websites are used to inform a wide audience (not only own members) about the activities of the network and its results. They contain information about networks and their members, implemented and planned projects, organized events, and links to publications. As the member cities come from many countries, the websites are run in English and in the case of the C40 also in Chinese. Additionally, C40 and UBS disseminate various types of cyclical newsletters published with different frequency: C40 – bimonthly and UBC – quarterly.
Working Groups/Subnetworks
Working groups also serve as a forum for the exchange of good practices, experience and know-how between the network’s member cities. They organize cooperation around specific issues and problems. The C40 is a specialized, issue-specific network focused on climate change issues. However, this issue is complex, hence as many as 17 subnetworks are formed around a specific topic: Air Quality; Clean Construction Forum; Clean Energy; Connecting Delta Cities; Cool Cities; Food Systems; Land Use Planning; Mass Transit; Mobility Management; Municipal Building Efficiency; New Building Efficiency; Private Building Efficiency; Sustainable Waste Systems; Urban Flooding; Walking & Cycling; Waste to Resources; Zero Emission Vehicles. The CDC is therefore one of these C40 subsets. In the case of UBC, the UBC Sustainable Cities Commission14 is directly dedicated to (but not limited to) climate change among the seven Commissions that are in operation. Two other commissions, i.e., Planning cities and Inclusive and Healthy Cities, also deal with climate change issues, albeit, more implicitly, by using the sustainable development agenda as a guideline for their activities.
Databases
One of the existing databases is the Adaptation and Mitigation Interaction Assessment (AMIA) developed by the C40 in cooperation with the Children’s Investment Fund Foundation. The Excel-based AMIA tool helps cities understand the relationship between mitigation measures, which reduce greenhouse gas emissions, and adaptation measures, which reduce climate risks and helps policy-makers systemically analyze potential interactions between mitigation and adaptation as they develop climate action plans. The online library of nearly 60 case studies is regularly updated with new case studies both from C40 cities and external sources, which brings insight into the actual implementation in different environments.
The Climate action for URBan sustainability (CURB) tool is a data-driven scenario planning tool designed to assist cities in pursuing climate action across their energy, buildings, transport, waste and water systems. The Excel-based tool was developed by C40 Cities in partnership with the World Bank, the Global Covenant of Mayors for Climate and Energy (GCoM), Bloomberg Philanthropies and AECOM. Building on the Global Protocol for Community-scale Greenhouse Gas (GHG) Emission inventory data supports cities to plan a range of actions to reduce energy use, save money, and cut greenhouse gas emissions. The technology and policy actions covered by CURB can also help deliver important local quality of life benefits, including improved air quality, local economic development and job creation.
Discussion and Conclusion
Transnational municipal networks are an increasingly popular form of cooperation of non-state actors, and climate change issues are increasingly common areas of their activity (e.g., van der Heijden, 2018). This also applies to networks of coastal cities. But how is this potential used in relation to climate change adaptation and mitigation measures?
The results of our analysis suggest that the networks of cities implement both mitigation and adaptation measures, although, ‘soft’ mitigation actions seem to be the most common. For example, the C40 AMIA report includes 122 examples on actions related to mitigation, while only 57 cases relate to adaptation measures. This appears to be a well-established trend in the cities’ cooperation (e.g., Mansard et al., 2017; Heikkinen et al., 2020), and the change toward adaptation has only started (e.g., Heikkinen et al., 2020). However, the level and depth of this change is difficult to assess, since practical actions occur at the individual city level, and the networking activities focus on knowledge sharing and the exchange of good practices. A similar situation was observed regarding past mitigation activities (e.g., Kern and Bulkeley, 2009; Busch et al., 2018), and yet the networks of cities are considered rather efficient in mitigating climate change (Castán Broto and Bulkeley, 2013). Therefore, it is likely that the effect of the scale that worked for the mitigation issues (Acuto, 2013; Lin, 2018) can also support the adaptation measures.
It also appears that the UBC is the network that best recognizes the importance of marine ecosystems for combating climate change. The other two networks neglect the productivity of marine ecosystems (Table 5) and – consequently – its health and good environmental status. This is somewhat paradoxical as the UBC is the only network that is not focused solely on climate change. This again raises the question whether this greater awareness is related to the vicinity of the Baltic Sea or to the European recognition of regional seas. Indeed, regional seas are an important element of the larger policy landscape in Europe (van Tatenhove, 2013), and the countries around the Baltic Sea are in fact pioneers and frontrunners in regional cooperation. Initiatives such the Helsinki Convention (HELCOM) or VASAB are examples of well-established cooperation efforts that greatly contribute to the governance of the Baltic Sea (Kern, 2011; Zaucha, 2014).
We believe that this specific ocean ‘blindness’ can be, indeed, an important challenge in combating climate change and a serious setback to the effectiveness and full participation of transnational city networks in marine governance. A good environmental status of marine ecosystems (expressed through the United Nations SDG 14 ‘Life below water’; Salvia et al., 2019) is an important precondition for achieving other SDGs (Nash et al., 2020), and progress toward this goal offers a great range of co-benefits (and almost no trade-offs) for other SDGs (Singh et al., 2018). In other words, actions addressing climate change cannot be successful if seas and oceans are not properly protected (Tessler et al., 2015; Gruber et al., 2019). And yet, SDG 14 is a goal that receives relatively little attention and is of low priority, and consequently does not receive enough funding at both global and national levels (e.g., Nash et al., 2020). It, therefore, does not come as a surprise that the SDG 14 ambitions will most likely not be accomplished (Nash et al., 2020), which among other results stemming from a lack of wide ocean-awareness among the stakeholders in the cities and their networks. The cities’ limited awareness is most likely a reflection of the more general preferences for the other SDGs among decision-makers across various levels and scales. This may be a place for increased activities within the framework of the Ocean Literacy, since an ocean-literate person understands the essential principles and fundamental concepts, can communicate about the ocean in a meaningful way, and what is crucial in mitigation and adaptation actions, is able to make informed and responsible decisions regarding the ocean and its resources (UNESCO, 2020). Without such skills, it is difficult to comprehend the complex issues which govern climate change and its impact on the ocean and the ocean’s impact on climate change (SDGs 13 and 14), thereby reducing the feasibility of achieving the remaining SDGs, which is a key task for all humans but is especially important for coastal communities. Developing Ocean Literacy among the networks’ participants should also be perceived as an important step toward their greater involvement in marine governance, a shift to unlock the potential of coastal city networks in this important sphere.
In our research we confirm that the activities run by TMNs are defined and restricted by the competences granted through national laws and external (foreign) actions of cities just cannot step outside of these bounds (Dumała, 2012). De facto mayoral powers differ within a TMN from city to city depending on constitutional arrangements. Working out the formula and scope of its activity, networks are looking for a ‘common denominator’ of shared competences, which explains why the range of actions that the network undertakes does not include all climate change issues recommended in global debates, programs or documents.
Based on our results we argue that the activity of the network is more determined by the properties of the network than by the tools they used. What is more, it is the properties of the network, especially the proximity of cities to each other that influences the choice of preferred topics. The C40, CDC and UBC are spatially dispersed transnational territorial networks, so they focus on supporting flows of intangible resources, i.e., information, knowledge and experiences (Lee, 2013), mostly via the Internet.
However, we argue that this ‘distance shrinking’ does not eliminate the significance of geographical differences, which are still relevant for responses toward climate change. The spatial identity of the networks and their scope of activities and areas of actions do not influence any type of neither specific activities nor tools, however, they determine their substantive content. The spatial identity of cities that form networks is the foundation of their involvement. The fact that all cities are coastal cities is key to the creation of networks. However, when analyzing the positions and activities of individual networks, we did not observe that the coastal location is the leading thread behind their involvement in marine governance or their approach to climate change adaptation and mitigation. This means that cities with such problems when facing the same challenges (which results from the fact that they are located in the same region, like UBC members – Baltic Sea Region) tackle more practical issues from their point of view, mainly related to adaptation to climate change, because benefits of adaptation efforts are mostly local and regional. In turn, in the case of networks consisting of coastal cities, but scattered around the globe, more general (worldwide) issues are more convenient, allowing the adjustment of common assumptions to meet the needs of a particular place. Therefore, there are fewer joint initiatives and there is more sharing of own experiences – e.g., in the CDC.
We observed that more formalized networks (acting as associations – C40 and UBC) use a much wider range of tools. This can be explained by the functioning of a more developed administration (secretariats and others bodies) which have the financial and human resources available to coordinate and organize the activities of the network. The level of network institutionalization has less impact on the scope of their activity (in principle, all of the studied networks had the same scope, which is related to their similar functions), and more determines the number of tools used and the intensity of their use. It is clear that networks with strong structures and larger resources are more active (C40, UBC). A special case is the CDC, which in recent years – basically without a specific reason – has significantly reduced its functioning and its organizational background is minimal. The leader of a network may also play a role. In the case of the C40, such a leader was undoubtedly the initiator of the first 2-day World Cities Leadership and Climate Summit on 3–5 October 2005, the mayor of London, Ken Livingstone, the other was Mayor of New York City billionaire Michael Bloomberg. During his 3-year tenure as Chair (2010–2013) Bloomberg hired global consulting firm McKinsey to refashion the network into a fully functioning organization with full-time staff, an executive team as well as funding partners. He invested heavily in media and marketing for the C40 network and created a PR division that would promote the networks and member cities’ activities through their website, TV and print and social media (Barthold, 2019). UBC also has a very well-developed institutional framework as its Secretary General has been the same person since the beginning of this network in 1991.
Soft instruments (such as conferences and workshops, exchange of good practices, educational material, publications) still dominate the activities of the analyzed networks. Importantly, the developed good practices are available not only to members of the network, but also to any interested city (or actor) via the open nature of the website where these are published. Apart from the traditional tools, there are also some more innovative tools, such as technical assistance or databases [e.g., Adaptation and Mitigation Interaction Assessment (AMIA), the C40 Greenhouse Gas Protocol for Cities Interactive Dashboard]. The innovativeness of the operation of networks such as the C40 and UBC is confirmed by earlier studies (Bouteligier, 2013b; Papin, 2020). It has been made possible, among others, thanks to the cooperation with other entities (companies and organizations) which strengthen the network’s capabilities by equipping these with resources (financial and human) which these member cities and networks otherwise would not have access to. Lin also notes that C40 partnerships help overcome the constraints that member cities face, such as the limited resources needed to take climate action (Lin, 2018). Acuto confirms this opinion: “[…] their participation is incentivized by scale advantages that are facilitated by pooling large municipal resources, exchanging best practices models, and accessing privileged technical (and more broadly planning) services through the Group’s private allies.” (Acuto, 2013, p. 850). In the case of the UBC, such a role seems to be played by the European Union.
According to Kern and Bulkeley (2009) TMNs have three defining characteristics. (1) Member cities are autonomous, which means they are free to join or leave the network. (2) Due to their non-hierarchical, horizontal, and polycentric nature, they are referred to as practicing a form of self-governance. (3) The decisions made within the networks are implemented directly by their members. The third feature is, in our opinion, the difficulty of assessing the effectiveness of the network: each member city decides for itself whether and how it will implement the recommendations of the network. This is also a certain weakness of the network in terms of its direct performance. Lin (2018) affirms that to encourage the spread of norms, practices, and voluntary standards amongst member cities, TMNs have to resort to persuasion, mutual benefit, and reciprocity.
Nevertheless, the existence of a ‘network effect’ can be observed. For example, in the Carbon Disclosure Project (CDP) analysis we read: “On several key criteria, C40 cities outperform the overall average, suggesting that there may be a relationship between C40 participation/affiliation and higher awareness of the risks and opportunities of climate change.” (CDP and AECOM, 2012, p. 60). According to the above quotation, a comparison of the cities belonging to the network with those not belonging to them indicates the existence of ‘some’ network effect. In more recent studies (Heikkinen et al., 2020) the results confirm that TMN members are more likely to start the climate change adaptation planning process than other cities.
Concluding, we highlight that the TMNs due to their organizational and normative limitations and lack of well-developed ocean literacy are not able to fully engage in all the activities related to climate change adaptation and mitigations as suggested by the UNEP. The networks of coastal cities implement both mitigation and adaptation measures, although ‘soft’ mitigation actions seem to be the most common. While the scale and innovativeness of the networks’ operations are determined by their specificity resulting from spatial identity, the effectiveness of jointly developed strategies and actions depends heavily on the available human resources and the commitment of cities.
Data Availability Statement
The raw data supporting the conclusions of this article will be made available by the authors, without undue reservation.
Author Contributions
HD, MŁ, JP, and TZ: conceptual works and manuscript preparation. HD, MŁ, and TZ: literature review and data collection. HD, MŁ, and JP: analyses of cases and conclusions. All authors contributed to the article and approved the submitted version.
Conflict of Interest
The authors declare that the research was conducted in the absence of any commercial or financial relationships that could be construed as a potential conflict of interest.
Footnotes
- ^ ‘A document’ or ‘a report’ was considered as an activity for the purpose of this analytical step.
- ^ S, issues are presented in the statements and declarations; A, issues are the subject of action (programs or projects).
- ^ https://www.c40knowledgehub.org
- ^ http://ubcenvcom.blogspot.com/
- ^ http://deltacityofthefuture.nl/knowledge-portal
- ^ https://www.c40.org/case_studies
- ^ https://resourcecentre.c40.org/resources/measuring-ghg-emissions
- ^ https://www.c40.org/awards
- ^ https://www.c40.org/programmes/city_advisers
- ^ https://www.c40cff.org/
- ^ https://www.c40.org/
- ^ http://deltacityofthefuture.nl
- ^ https://www.ubc.net/
- ^ https://www.ubc.net/commissions/sustainable-cities
References
Andonova, L. B., Betsill, M. M., and Bulkeley, H. (2009). Transnational Climate Governance. Glob. Environ. Polit. 9, 52–73. doi: 10.1162/glep.2009.9.2.52
Andonova, L. B., Hale, T. N., and Roger, C. B. (2017). National Policy and Transnational Governance of Climate Change: substitutes or Complements? Int. Stud. Q. 61, 253–268. doi: 10.1093/isq/sqx014
Bäckstrand, K. (2008). Accountability of Networked Climate Governance: the Rise of Transnational Climate Partnerships. Glob. Environ. Polit. 8, 74–102. doi: 10.1162/glep.2008.8.3.74
Barthold, S. (2019). “Greening the Global City. The Role of C40 Cities as Actor in Global Environmental Governance,” in The City as Global Political Actor, eds S. Oosterlynck, D. Bassens, L. Beeckmans, B. Derudder, L. Braeckmans, and B. Segaert (London, New York: Routledge), 147–167. doi: 10.4324/9780203701508-8
Baycan-Levent, T., Gülümser, A., Aliye, A., and Kundak, S. (2010). Success Conditions for Urban Networks: eurocities and Sister Cities. Eur. Plan. Stud. 18, 1187–1206. doi: 10.1080/09654311003791259
Berkowitz, H., Crowder, L. B., and Brooks, C. M. (2020). Organizational perspectives on sustainable ocean governance: a multi-stakeholder, meta-organization model of collective action. Mar. Policy 118:104026. doi: 10.1016/j.marpol.2020.104026
Betsill, M. M., and Bukeley, H. (2004). Transnational Networks and Global Environmental Governance: the Cities for Climate Protection Program. Int. Stud. Q. 48, 471–493. doi: 10.1111/j.0020-8833.2004.00310.x
Biermann, F., Kanie, N., and Kim, R. E. (2017). Global governance by goal-setting: the novel approach of the UN Sustainable Development Goals. Curr. Opin. Environ. Sustain. 26–27, 26–31. doi: 10.1016/j.cosust.2017.01.010
Bouteligier, S. (2013a). Inequality in new global governance arrangements: the North–South divide in transnational municipal networks. Innovation 26, 251–267. doi: 10.1080/13511610.2013.771890
Bouteligier, S. (2013b). Cities, Networks, and Global Environmental Governance. Spaces of Innovation, Places of Leadership. New York: Routledge.
Bouteligier, S. (2014). “A Networked Urban World. Empowering Cities to Tackle Environmental Challenges,” in The Power of Cities in International Relations, ed. S. Curtis (New York: Routledge), 57–68. doi: 10.4324/9781315851495-4
Bulkeley, H., Davies, A., Evans, B., Gibbs, D., Kern, K., and Theobald, K. (2003). Environmental Governance and Transnational Municipal Networks in Europe. J. Environ. Policy Plan. 5, 235–254. doi: 10.1080/1523908032000154179
Busch, H., Bendlin, L., and Fenton, P. (2018). Shaping local response – The influence of transnational municipal climate networks on urban climate governance. Urban Clim. 24, 221-230.
C40. (2012). Press Release: C40 Announces New Guidelines For Membership Categories. Available online at: https://www.c40.org/press_releases/press-release-c40-announces-new-guidelines-for-membership-categories (accessed March 20, 2020).
C40. (2016a). Ten Years of Results. Available online at: https://c40-production-images.s3.amazonaws.com/fact_sheets/images/11_C40_on_its_10-year_anniversary_reOct2016.original.pdf?1475504972 (accessed March 25, 2020).
C40. (2016b). Climate Change Adaptation in Delta Cities. Good Practice Guide. Available online at: https://c40-productionimages.s3.amazonaws.com/good_practice_briefings/images/5_C40_GPG_CDC.original.pdf?1456788885 (accessed June 10, 2020).
C40. (2019). C40 Cities Annual Report. Availabl at: https://c40-production-images.s3.amazonaws.com/other_uploads/images/2574_C40_2019_Annual_Report.original.pdf?1587634742 (accessed March 25, 2020).
C40. (2020a). About. Available online at: https://www.c40.org/about (accessed May 27, 2020).
C40. (2020b). C40 Overview. Available online at: https://www.c40.org/careers (accessed June 10, 2020).
C40. (2020c). Networks. Available online at: https://www.c40.org/networks (accessed June 10, 2020).
C40. (2020d). Network overview. Available online at: https://www.c40.org/networks/connecting_delta_cities (accessed May 27, 2020).
Camagni, R. P., and Salone, C. (1993). Network Urban Structures in Northern Italy: elements for a Theoretical Framework. Urban Stud. 30, 1053–1064. doi: 10.1080/00420989320080941
Cannarella, C., and Piccioni, V. (2008). Innovation Diffusion and Architecture and Dynamics of Local Territorial Networks. Trames 12, 215–237. doi: 10.3176/tr.2008.2.06
Cassi, L., Corrocher, N., Malerba, F., and Vonortas, N. (2008). Research networks as infrastructure for knowledge diffusion in European regions. Econ. Innov. New Technol. 17, 663–676. doi: 10.1080/10438590701785603
Castán Broto, V., and Bulkeley, H. (2013). A survey of urban climate change experiments in 100 cities. Glob. Environ. Chang. 23, 92–102. doi: 10.1016/j.gloenvcha.2012.07.005
CDC. (2017). About C40 and CDC. Available online at: http://deltacityofthefuture.nl/about-c40-and-cdc (accessed March 26, 2020).
CDP, and AECOM. (2012). Measurement for Management. CDP Cities 2012 Global Report including special report on C40 Cities. Available online at: https://www.c40.org/researches/cdp-c40-2012-global-report (accessed May 22, 2020).
Chee, S. Y., Othman, A. G., Sim, Y. K., Nabilah, A., Adam, M., and Firth, L. B. (2017). Land reclamation and artificial islands: walking the tightrope between development and conservation. Glob. Ecol. Conserv. 12, 80–95, doi: 10.1016/j.gecco.2017.08.005
Collet, I., and Engelbert, A. (2013). Statistics In Focus 30/2013. Available online at: https://ec.europa.eu/eurostat/statistics-explained/index.php?title=Archive:Coastal_regions_-_population_statistics&oldid=170420 (accessed: 15.04.2020).
Conti, S. (1993). The Network Perspective in Industrial Geography: towards a Model. Geogr. Ann. Ser. B 75, 115–130. doi: 10.1080/04353684.1993.11879655
Conti, S., and Spriano, G. (1989). Strutture urbane, innovazione tecnologica e reti urbane internazionali. Paper presented at the international seminar: Effetto città. Sistemi urbani ed innovazione: prospettive per l’Europa alle soglie degli anni ’90. Torino: Fondazione Agnelli.
Donatti, C. I., Harvey, C. A., Hole, D., Panfil, S. N., and Schurman, H. (2020). Indicators to measure the climate change adaptation outcomes of ecosystem-based adaptation. Clim. Chang. 158, 413–433. doi: 10.1007/s10584-019-02565-9
Dupuis, J., and Biesbroek, R. (2013). Comparing apples and oranges: the dependent variable problem in comparing and evaluating climate change adaptation policies. Glob. Environ. Chang. 23, 1476–1487. doi: 10.1016/j.gloenvcha.2013.07.022
Ercole, E., Walters, M., and Goldsmith, M. (1997). “Cities, Networks, Euregions, European Offices,” in European Integration And Local Government, eds M. J. Goldsmith and K. K. Klausen (Cheltenham, Brookfield (Vt.): Edward Elgar), 219–236.
Feldman, D. L. (2012). The future of environmental networks – Governance and civil society in a global context. Futures 44, 787–796. doi: 10.1016/j.futures.2012.07.007
Florini, A., and Pauli, M. (2018). Collaborative governance for the Sustainable Development Goals. Asia Pac. Policy Stud. 5, 583–598. doi: 10.1002/app5.252
Forsman, M., and Solitander, N. (2003). Knowledge Transfer in Clusters and Networks – An interdisciplinary conceptual analysis. J. Int. Bus. Stud. 3, 1–23.
Glass, L.-M., and Newig, J. (2019). Governance for achieving the Sustainable Development Goals: how important are participation, policy coherence, reflexivity, adaptation and democratic institutions? Earth Syst. Gov. 2:100031. doi: 10.1016/j.esg.2019.100031
Grainger-Brown, J., and Malekpour, S. (2019). Implementing the Sustainable Development Goals: a Review of Strategic Tools and Frameworks Available to Organisations. Sustainability 11:1381. doi: 10.3390/su11051381
Gruber, N., Clement, D., Carter, B., Feely, R., van Heuven, S., and Hoppema, M. (2019). The oceanic sink for anthropogenic CO2 from 1994 to 2007. Science 363, 1193–1199.
Hajer, M., Nilsson, M., Raworth, K., Bakker, P., Berkhout, F., De Boer, Y., et al. (2015). Beyond Cockpit-ism: four Insights to Enhance the Transformative Potential of the Sustainable Development Goals. Sustainability 7:1651–1660. doi: 10.3390/su7021651
Halkier, H., and Damborg, C. (1997). Networks Development Agencies and Intelligent Regions: towards a Framework for Empirical Analysis. European Research Unit, Aalborg University. https://vbn.aau.dk/files/42306479/No22EuropeanStudies_HenrikHalkiermfl_pdf
Hallegatte, S., Green, C., Nicholls, R. J., and Corfee-Morlot, J. (2013). Future flood losses in major coastal cities. Nat. Clim. Chang. 3, 802–806, doi: 10.1038/nclimate1979
Hay, C. C., Morrow, E., Kopp, R. E., and Mitrovica, J. X. (2015). Probabilistic reanalysis of twentieth-century sea-level rise. Nature 517, 481–484. doi: 10.1038/nature14093
Heikkinen, M., Karimo, A., Klein, J., Juhola, S., and Ylä-Anttila, T. (2020). Transnational municipal networks and climate change adaptation: a study of 377 cities. J. Clean. Prod. 257:120474. doi: 10.1016/j.jclepro.2020.120474
IPCC (2012). “Glossary of terms,” in Managing the Risks of Extreme Events and Disasters to Advance Climate Change Adaptation. A Special Report of Working Groups I and II of the Intergovernmental Panel on Climate Change (IPCC), eds C. B. Field, V. Barros, T. F. Stocker, D. Qin, D. J. Dokken, K. L. Ebi, et al. (Cambridge, UK, : Cambridge University Press), 555–564.
IPCC (2014). “Climate Change 2014: Synthesis Report,” in Contribution of Working Groups I, II and III to the Fifth Assessment Report of the Intergovernmental Panel on Climate Change, eds Core Writing Team, R. K. Pachauri, and L. A. Meyer (Geneva, Switzerland: IPCC), 151.
IPCC (2018). “Summary for Policymakers,” in Global Warming of 1.5°C. An IPCC Special Report on the Impacts of Global Warming of 1.5°C above Pre-Industrial Levels and Related Global Greenhouse Gas Emission Pathways, in the Context of Strengthening the Global Response to the Threat of Climate Change, Sustainable Development, and Efforts to Eradicate Poverty, eds V. Masson-Delmotte, P. Zhai, H.-O. Pörtner, D. Roberts, J. Skea, P. R. Shukla, et al. (Geneva: IPCC).
IPCC (2019). “Summary for Policymakers,” in IPCC Special Report on the Ocean and Cryosphere in a Changing Climate, eds H.-O. Pörtner, D. C. Roberts, V. Masson-Delmotte, P. Zhai, M. Tignor, E. Poloczanska, et al. Available online at: https://www.ipcc.ch/srocc/chapter/summary-for-policymakers/ (in press).
Juhola, S., and Westerhoff, L. (2011). Challenges of adaptation to climate change across multiple scales: a case study of network governance in two European countries. Environ. Sci. Policy 14, 239–247. doi: 10.1016/j.envsci.2010.12.006
Kanie, N., and Biermann, F. (eds) (2017). Governing Through Goals. Sustainable Development Goals as Governance Innovation. Cambridge, Massachusetts: The MIT Press.
Kenis, P. N., and Schneider, V. (1991). “Policy networks and policy analysis: Scrutinizing a new analytical toolbox,” in Policy networks. Empirical evidence and theoretical considerations, eds B. Marin and R. Mayntz (Frankfurt am Main, Boulder, Colo: Campus Verlag, Westview Press), 25–59.
Kern, K. (2011). Governance for sustainable development in the Baltic Sea Region. J. Balt. Stud. 42, 21–35. doi: 10.1080/01629778.2011.538517
Kern, K., and Bulkeley, H. (2009). Cities, Europeanization and multi-level governance: governing climate change through transnational municipal networks. JCMS 47, 309–332. doi: 10.1111/j.1468-5965.2009.00806.x
Kopp, R. E., DeConto, R. M., Bader, D. A., Hay, C. C., Horton, R. M., Kulp, S., et al. (2017). Evolving Understanding of Antarctic Ice-Sheet Physics and Ambiguity in Probabilistic Sea-Level Projections. Earths Future 5, 1217–1233. doi: 10.1002/2017EF000663
Kotynska-Zielinska, I., Olenin, S., Fornalewicz, K., Pradzinska, A., and Wesławski, J. M. (2020). Perception of Arctic issues among young learners in Poland and Lithuania. Oceanologia 62, 576–587. doi: 10.1016/j.oceano.2020.03.006
Krippendorf, K. (2004). Content Analysis: An Introduction To Its Methodology. Thousand Oaks, CA: Sage.
Kulp, S. A., and Strauss, B. H. (2019). New elevation data triple estimates of global vulnerability to sea-level rise and coastal flooding. Nat. Commun. 10:5752.
Lee, T. (2013). Global Cities and Transnational Climate Change Networks. Glob. Environ. Polit. 13, 108–127. doi: 10.1162/glep_a_00156
Lin, J. (2018). Governing Climate Change. Global Cities and Transnational Lawmaking. Cambridge: Cambridge University Press, 105–126].
Lincke, D., and Hinkel, J. (2018). Economically robust protection against 21st century sea-level rise. Glob. Environ. Chang. 51, 67–73. doi: 10.1016/j.gloenvcha.2018.05.003
Mansard, J. S., Pattberg, P. H., and Widerberg, O. (2017). Cities to the rescue? Assessing the performance of transnational municipal networks in global climate governance. Int. Environ. Agreem. 17, 229–246. doi: 10.1007/s10784-016-9318-9
Marsden, P. V. (2000). “Social networks,” in Encyclopedia of sociology, eds E. F. Borgatta and R. J. V. Montgomery (Detroit: Macmillan Reference), 2727–2735.
Mingus, M. S. (2007). “Networks,” in Encyclopedia of governance, ed. M. Bevir (Thousand Oaks: Sage Publications), 601–605.
Molenaar, A., Aerts, J. C. J. H., Dircke, P., and Ikert, M. (2013). Connecting delta cities. Resilient Cities and Climate Adaptation Strategies. Rotterdam: Rotterdam.
Monkelbaan, J. (2019). Governance for the Sustainable Development Goals. Singapore: Springer Singapore.
NASA. (2020). The Effects of Climate Change. Available online at: https://climate.nasa.gov/effects/ (accessed May 7, 2020).
Nash, K. L., Blythe, J. L., Cvitanovic, C., Fulton, E. A., Halpern, B. S., Milner-Gulland, E. J., et al. (2020). To achieve a sustainable blue future, progress assessments must include interdependencies between the Sustainable Development Goals. One Earth 2, 161–173. doi: 10.1016/j.oneear.2020.01.008
Nauels, A., Rogelj, J., Schleussner, C.-F., Meinshausen, M., and Mengel, M. (2017). Linking sea level rise and socioeconomic indicators under the Shared Socioeconomic Pathways. Environ. Res. Lett. 12:14002.
Niederhafner, S. (2013). Comparing functions of transnational city networks in Europe and Asia. Asia Eur. J. 11, 377-396.
Pakszys, P., Zielinski, T., Fererro, L., Kotynska-Zielinska, I., and Wichorowski, M. (2020). Changing Arctic. Firm scientific evidence versus public interest in the issue. Where is the gap? Oceanologia 62, 593–602. doi: 10.1016/j.oceano.2020.03.004
Papin, M. (2019). Transnational municipal networks: harbingers of innovation for global adaptation governance? Int. Environ. Agreem. 19, 467–483. doi: 10.1007/s10784-019-09446-7
Papin, M. (2020). Where do novelties come from? A social network analysis of Transnational Municipal Networks in global climate governance. Earth Syst. Gov. 4, 100064. doi: 10.1016/j.esg.2020.100064
Risse-Kappen, T. (ed.) (2009). Bringing Transnational Relations Back In. Cambridge, UK: Cambridge University Press.
Rossignolo, C. (2009). Urban Networks In Europe: policies, Practices, Outcomes. Europa XXI 19, 11–20 doi: 10.7163/Eu21.2008.19.1
Salomon, M. (2009). Local Governments as Foreign Policy Actors and Global Cities Network-Makers: the Cases of Barcelona and Porto Alegre. GaWC Res. Bull. 305. Available online at: https://www.lboro.ac.uk/gawc/rb/rb305.html (accessed July 22, 2020).
Salvia, A. L., Leal, F. W., Brandli, L. L., and Griebeler, J. S. (2019). Assessing research trends related to Sustainable Development Goals: local and global issues. J. Clean. Prod. 208, 41–849. doi: 10.1016/j.jclepro.2018.09.242
Shi, L., Chu, E., Anguelovski, I., Aylett, A., Debats, J., Goh, K., et al. (2016). Roadmap towards justice in urban climate adaptation research. Nat. Clim. Chang. 6, 131–137. doi: 10.1038/nclimate2841
Singh, G. G., Cisneros-Montemayor, A. M., Swartz, W., Cheung, W., Guy, J. A., Kenny, T.-A., et al. (2018). A rapid assessment of co-benefits and trade-offs among Sustainable Development Goals. Mar. Policy 93, 223–231. doi: 10.1016/j.marpol.2017.05.030
Smeds, E., and Acuto, M. (2018). Networking Cities after Paris: weighing the Ambition of Urban Climate Change Experimentation. Glob. Policy 9, 549–559. doi: 10.1111/1758-5899.12587
Strange, M. (2012). “Transnational Networks and the Making of Global Governance – the Example of Non-State Actors in the Multilateral Trade Regime,” in Governance – Is it for Everyone?, ed. A. M. Bissessar (Hauppauge: Nova Science Publishers), 49–72.
Taylor, P. J., and Derudder, B. (2016). World city network. A global urban analysis. London, New York: Routledge, Taylor & Francis Group.
Tessler, Z. D., Vörösmarty, C. J., Grossberg, M., Gladkova, I., Aizenman, H., Syvitski, J. P. M., et al. (2015). Profiling risk and sustainability in coastal deltas of the world. Science 349, 638–643. doi: 10.1126/science.aab3574
Toly, N. J. (2008). Transnational Municipal Networks in Climate Politics: from Global Governance to Global Politics. Globalizations 5, 341–356. doi: 10.1080/14747730802252479
Torfing, J. (2012). “Governance Networks,” in The Oxford Handbook of Governance, ed. D. Levi-Faur (Oxford: Oxford University Press), 99–112.
UBC. (2015). UBC Strategic Framework 2016–2021. Available online at: https://ubc.net/sites/default/files/ubc_strategic_framework_2016-2021.pdf (accessed May 25, 2020).
UBC. (2019). Resolution on Climate Change Adaptation and Civil Protection. Available online at: https://www.ubc.net/sites/default/files/resolution_on_climate_change_adaptation_and_civil_protection.pdf (accessed May 25, 2020).
UBC. (2020a). Internal Regulations. Available online at: https://www.ubc.net/sites/default/files/internal_regulations.pdf (accessed June 15, 2020).
UBC. (2020b). Commissions. Available online at: https://ubc.net/commissions (accessed June 15, 2020).
Un Atlas of the Oceans. (2020). Facts. About. Available online at: http://www.oceansatlas.org/facts/en/ (accessed July 28, 2020).
UNEP. (2012). Making The Case For Ecosystems-Based Adaptation: Building Resilience To Climate Change. Nairobi, Kenya: UNEP.
UNEP. (2015). “Implementation of resolutions adopted by the United Nations Environment Assembly at its first session,” in Addendum Resolution 1/8: Ecosystem-Based Adaptation. Report of the Executive Director. Nairobi: UNEP.
UNEP. (2019a). UNEP Programme Performance Report 2018. Available online at: https://wedocs.unep.org/bitstream/handle/20.500.11822/27734/PPR_2018_FINAL.pdf?sequence=1&isAllowed=y (accessed June 15, 2020).
UNEP. (2019b). “UNEP Annual Report 2018,” in Putting the environment at the heart of people’s lives. Available online at: https://wedocs.unep.org/bitstream/handle/20.500.11822/27689/AR2018_EN.pdf?sequence=1&isAllowed=y (accessed June 15, 2020).
UNEP. (2020). Climate adaptation. Available online at: https://www.unenvironment.org/explore-topics/climate-change/what-we-do/climate-adaptation (accessed May 7, 2020).
UNESCO. (2020). Ocean Literacy Portal. Available online at: https://oceanliteracy.unesco.org/home/ (accessed September 7, 2020).
van der Heijden, J. (2018). “City and Subnational Governance. High Ambitions, Innovative Instruments and Polycentric Collaborations?,” in Governing Climate Change: Policentricity in Action, eds A. Jordan, D. Huitema, H. Van Asselt, and J. Forster (Cambridge: Cambridge University Press), 81–96. doi: 10.1017/9781108284646.006
van Leeuwen, J., and van Tatenhove, J. (2010). The triangle of marine governance in the environmental governance of Dutch offshore platforms. Mar. Policy 34, 590–597. doi: 10.1016/j.marpol.2009.11.006
van Tatenhove, J. P. M. (2013). How to turn the tide: developing legitimate marine governance arrangements at the level of the regional seas. Ocean Coast. Manag. 71, 296–304. doi: 10.1016/j.ocecoaman.2012.11.004
Varitiainen, P. (2000). Method Of Description For The Urban Network In The Baltic Sea Region. Helsinki: Finnish Ministry of Environment.
Vierros, M. (2017). Global marine governance and oceans management for Achievement of SDG 14. UN Chron. 54, 66–68 doi: 10.18356/ec606c8a-en
Visseren-Hamakers, I. J. (2015). Integrative environmental governance: enhancing governance in the era of synergies. Curr. Opin. Environ. Sustain. 14, 136–143. doi: 10.1016/j.cosust.2015.05.008
Ward, S., and Williams, R. (1997). From Hierarchy to Networks? Sub-central Government and EU Urban Environment Policy. J. Common Mark. Stud. 35, 439–464 doi: 10.1111/1468-5965.00069
Wong, P. P., Losada, I. J., Gattuso, J.-P., Hinkel, J., Khattabi, A., McInnes, K. L., et al. (2014). “Coastal Systems and Low-Lying Areas,” in climate change 2014: Impacts, Adaptation, and vulnerability. Part a: Global and Sectoral Aspects. Contribution of working group ii to the fifth Assessment Report of the Intergovernmental Panel on Climate Change, eds C. B. Field, V. R. Barros, D. J. Dokken, K. J. Mach, M. D. Mastrandrea, T. E. Bilir, et al. (Cambridge, United Kingdom and New York, NY, USA: Cambridge University Press), 361–409.
Woodruff, S., and Stults, M. (2016). Numerous strategies but limited implementation guidance in US local adaptation plans. Nat. Clim. Chang. 6, 796–802. doi: 10.1038/NCLIMATE3012
Xue, L., Weng, L., and Yu, H. (2018). Addressing policy challenges in implementing Sustainable Development Goals through an adaptive governance approach: a view from transitional China. Sustain. Dev. 26, 150–158. doi: 10.1002/sd.1726
Keywords: climate change, adaptation, mitigation, networking, transnational municipal networks (TMNs), coastal cities
Citation: Dumała H, Łuszczuk M, Piwowarczyk J and Zieliński T (2021) Transnational Municipal Networks as a Mechanism for Marine Governance Toward Climate Change Adaptation and Mitigation: Between Potential and Practice. Front. Mar. Sci. 8:626119. doi: 10.3389/fmars.2021.626119
Received: 04 November 2020; Accepted: 06 May 2021;
Published: 04 June 2021.
Edited by:
Lyne Morissette, M – Expertise Marine, CanadaReviewed by:
Christian T. K.-H. Stadtlander, Independent Researcher, St. Paul, MN, United StatesDi Jin, Woods Hole Oceanographic Institution, United States
Copyright © 2021 Dumała, Łuszczuk, Piwowarczyk and Zieliński. This is an open-access article distributed under the terms of the Creative Commons Attribution License (CC BY). The use, distribution or reproduction in other forums is permitted, provided the original author(s) and the copyright owner(s) are credited and that the original publication in this journal is cited, in accordance with accepted academic practice. No use, distribution or reproduction is permitted which does not comply with these terms.
*Correspondence: Hanna Dumała, aGFubmEuZHVtYWxhQHVtY3MuZXU=