 Jessica Kolbusz
 Simon de Lestang
 Tim Langlois
 Charitha Pattiaratchi
- 1Oceans Graduate School, The University of Western Australia, Crawley, WA, Australia
- 2The UWA Oceans Institute, Indian Ocean Marine Research Centre, Crawley, WA, Australia
- 3Western Australian Fisheries and Marine Research Laboratories, Department of Primary Industries and Regional Development, Government of Western Australia, Hillarys, WA, Australia
- 4School of Biological Sciences, The University of Western Australia, Crawley, WA, Australia
The pelagic development stages of many marine invertebrate species dictates their spatial and temporal distribution once reaching their benthic second phase of life. This life cycle is associated with the Western Rock Lobster (Panulirus cygnus) along the coast of Western Australia. Over the past 50 years, the number of puerulus reaching the nearshore reefs after their first 9 to 11 months of pelagic life in Western Australia has been monitored. These numbers, collected now at eight sites over the latitudes of the fishery, are indicative of the catchable stock 3–4 years into the future. In 2008, the fishery experienced a recruitment failure which lasted for several years before recovering to mean numbers pre-2008. This was associated with spatial and temporal shifts in the patterns of puerulus settlement. Previous research has hypothesized that physical and biological conditions in the south-east Indian Ocean no longer favored their survival. However, this decline has not been attributed to a single process. As the recovery is ongoing, contrasts in the settlement data before and after the decline are not completed. Here we characterize the data using ANOVA and pairwise comparisons to gain a better understanding of the typical patterns after the decline. Our results demonstrate that there has been a significant reduction in puerulus numbers over the first half of the season at all sites post decline. For the sites south of Lancelin there has been a significant reduction in puerulus numbers over the whole season. In addition, sites that show signs of recovery indicate that the majority of settlement occurred in the second half of the season. We anticipate these results to be the starting point for focused research into the environmental changes which may have occurred to generate these shifts in settlement numbers both from a timing and spatial perspective.
Introduction
The early life history of most marine fishes and invertebrates have a bi-phasic life cycle with pelagic and benthic stages. In the pelagic phase, larvae and eggs in the upper water column can be transported long distances over periods of many months. They return to the coast, settle and live as a benthic adult. Data on larval settlement are valuable for stock monitoring as many oceanographic, biological, and anthropogenic processes influence their distribution, abundance, and survival. In many fisheries, insufficient data are available on critical life stages or the environment, and over a large enough spatial and time scales, to provide advance warning of any changes. One of the longest time series of fishery catch is from the north-east Pacific Ocean of two salmon species: the Gulf of Alaska pink salmon and Oregon Coho salmon. The time series extends over many decades to the mid-1920’s (Francis and Sibley, 1991) and their year-to year variability led to the discovery of the Pacific Decadal Oscillation (PDO) and longer term variability in sea surface temperature in the Pacific Ocean (Mantua et al., 1997). For many years, the PDO served as a useful index for predicting fish productivity and distribution patterns in the north-east Pacific but these relationships broke down around 1988 (Litzow et al., 2020). The availability of long-term time series on fish catches were invaluable in evaluating these changes.
The western rock lobster (Panulirus cygnus), a benthic species with pelagic larval stage, was the first post-larvae (puerulus) to be successfully collected at regular intervals (Phillips, 1972). This has provided over half a century of recruitment data at several sites within the fishery which is a rarity (Smith et al., 2009; Geromont and Butterworth, 2015). The longevity of this dataset and its importance in the effective management of the fishery lead to it being the first species in the world to achieve the international gold standard in sustainability with accreditation from the Marine Stewardship Council (Bellchambers et al., 2016). The dataset has been used to develop a Puerulus index (PI) of settlement of P. cygnus at key sites across the fishery for management to predict catches 3–4 years to the future (Phillips, 1986; Caputi et al., 1995; de Lestang et al., 2015). The PI is the annual (May—April) sum of the monthly mean of puerulus numbers currently collected at eight sites spanning the lower two thirds of the fishery (Figure 1).
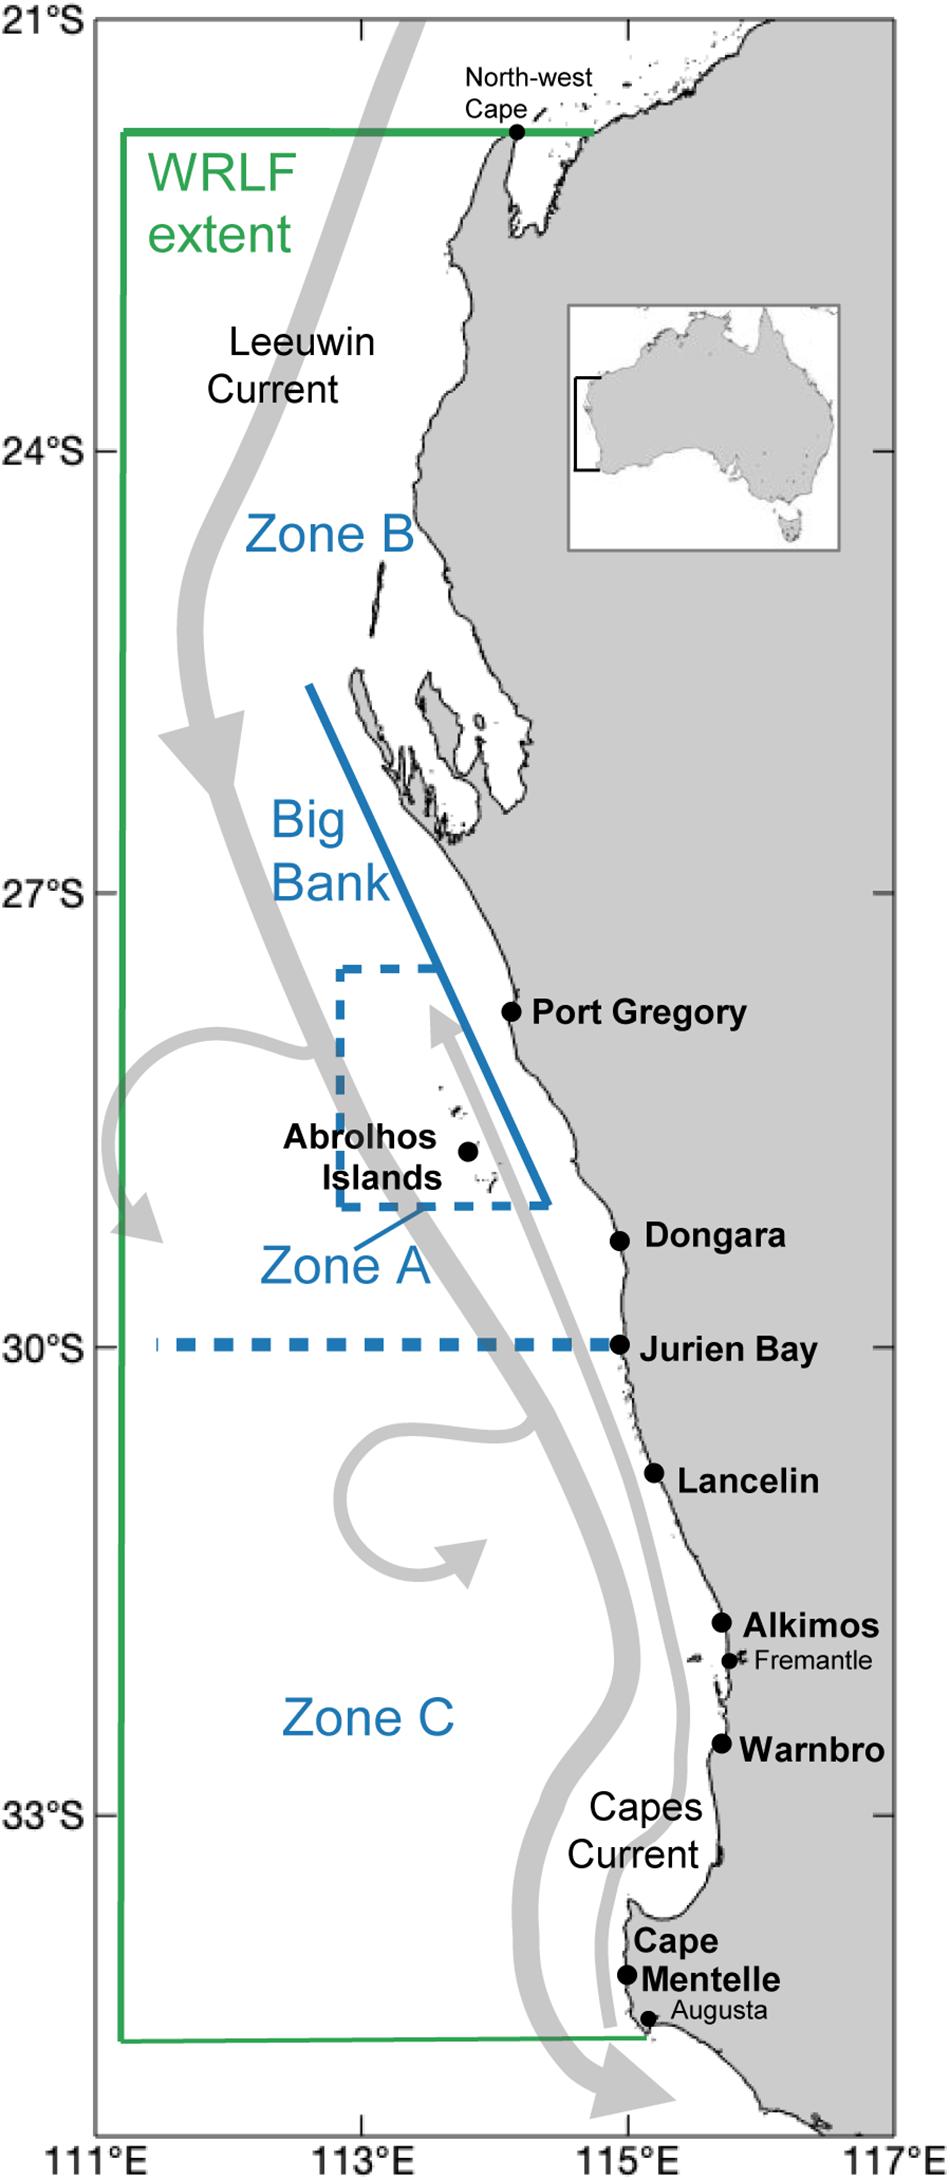
Figure 1. The extent of the Western Rock Lobster Fishery (WRLF) (green). The zones and key areas of the WRLF are in blue (de Lestang et al., 2012). These spatially define management controls. Current puerulus survey sites are indicated by the locations in bold. Schematic includes the referenced currents systems in gray. Eddies generated by the Leeuwin Current flow down the continental shelf are seen and the approximate location of the Cape Current is included.
The study region (Figure 1) is strongly influenced by the Leeuwin and Capes Currents (Pattiaratchi and Woo, 2009; Wijeratne et al., 2018). In contrast to other eastern boundary currents that consist of equatorward surface flow accompanied by large-scale upwelling (Bakun, 1990; Montecino and Lange, 2009), the poleward flow of the Leeuwin Current (LC) promotes a downwelling system (Cresswell and Golding, 1980). The LC is associated with strong seasonal and inter-annual variability with stronger (weaker) currents during the winter (summer) and La Niña (El Niño) events (Pattiaratchi and Buchan, 1991; Feng et al., 2003; Wijeratne et al., 2018). The peak transport of the LC usually occurs in June with a minima in October. There is a weaker secondary peak in December/January (Wijeratne et al., 2018). The LC also supports a highly energetic meso-scale eddy field (Figure 1) compared to other eastern boundary current systems (Pattiaratchi and Siji, 2020). The mean monthly sea level at Fremantle (Figure 1) has been used as a proxy for the strength of the LC (Pattiaratchi and Buchan, 1991; Feng et al., 2003). The Capes Current (CC), a seasonal inner shelf wind-driven current (Figure 1), flows northward inshore of the LC during summer months (Gersbach et al., 1999; Pearce and Pattiaratchi, 1999).
Eggs hatch from berried P. cygnus females from November to February within the study region, after a temperature-dependent incubation period of up to 2 months (Gray 1992). Once hatched, larvae are transported offshore by strong alongshore winds and a weaker LC into the deeper ocean where they transform from the pelagic phyllosoma larval stage to settlement ready in the more actively swimming puerulus larval stage over 9–11 months (Phillips, 1981; Feng et al., 2011; de Lestang et al., 2015). The phyllosoma undertake diurnal vertical migration and exhibit nutrient and water temperature dependent growth during this time (O’Rorke et al., 2014). Metamorphosis into puerulus occurs during late austral winter-spring (Caputi and Brown, 1993). The circulation patterns of the open ocean likely give rise to spatially varied transport of the puerulus, with the majority of settlement thought to occur in shallow areas along the western Australian coast of less than 5 m depth (Caputi, 2008; Feng et al., 2011).
Historically, the variability in the settlement of P. cygnus has been attributed to environment drivers offshore (Caputi et al., 2001; Griffin et al., 2001; Caputi, 2008). In the late 1980s, a positive relationship was found between the strength of the southward flowing Leeuwin Current (with Fremantle Mean Sea Level (FMSL) in April as a proxy) and the PI (Pearce and Phillips, 1988). Similarly, the FMSL from June to September correlated with the mean latitude of settlement prior to 2007 (Caputi, 2008). If the LC was stronger, the mean latitude of settlement was further south. La Niña phases were also found to coincide with an above-average PI, thought to be due to a strengthened Leeuwin Current during these phases, with the Southern Oscillation Index (SOI) as an indicator (Pearce and Phillips, 1988; Clarke and Li, 2004). Offshore, sea surface temperature, bottom temperature throughout the spawning season and westerly (onshore) winds in spring have also been identified as co-varying with the PI of the coming season (Chittleborough, 1975; Caputi et al., 2001, 2010).
Abnormally low puerulus settlement across all collector sites of the fishery were observed between the 2007 and 2009 seasons (Caputi et al., 2014; de Lestang et al., 2015). In 2007, the settlement was expected to increase due to environmental indicators but instead remained at historically low levels until a recovery was observed in 2010 (Figure 2). Research on this period of PI decline included an examination of overfishing of the spawning stock (de Lestang et al., 2015) and whether conditions of survival were no longer met in the early pelagic life stages (Säwström et al., 2014). Despite the extensive records on puerulus settlement, the primary focus on how this recruitment anomaly occurred centered on the PI for the whole fishery, and not the individual monitoring sites (Figure 1). Additional years of data since the recruitment failure have revealed different possible responses across sites and over the settlement season. The aims of this study are to: (1) examine spatial and temporal variability in puerulus settlement across the fishery using a time series of several decades; and, (2) elucidate factors that may have contributed to the recruitment failure in 2008–2009.
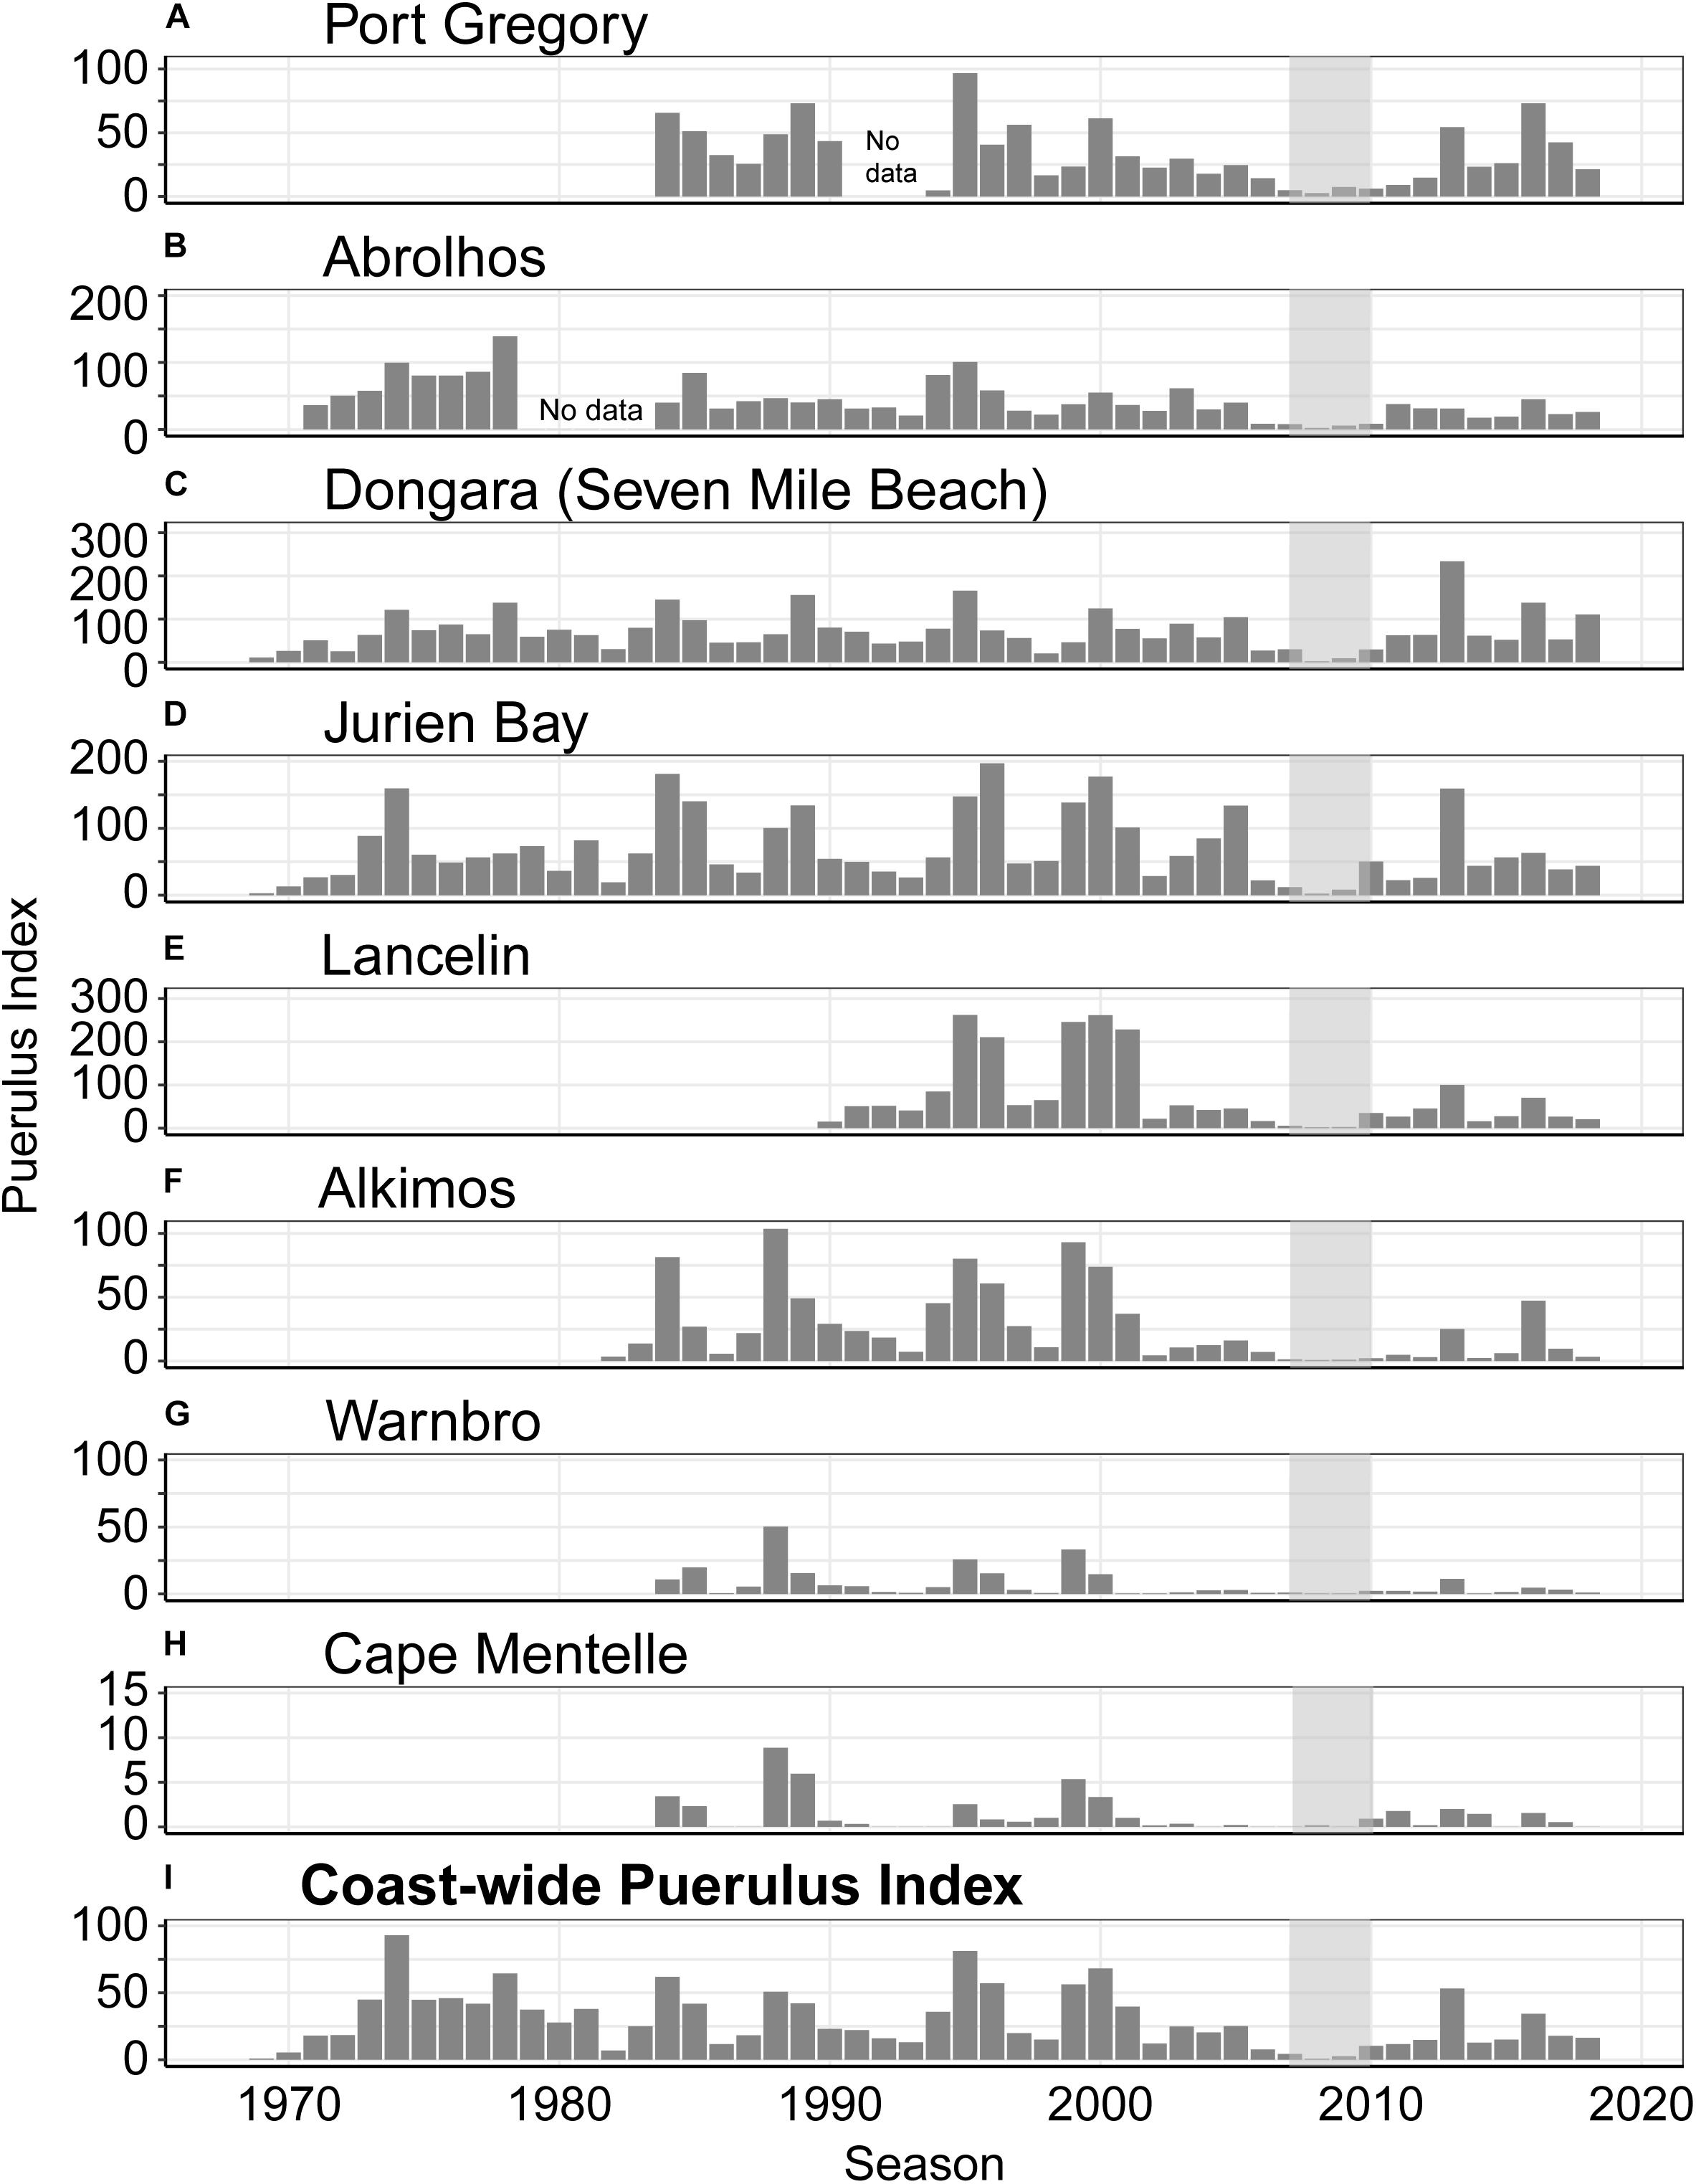
Figure 2. Annual Puerulus Index (PI) at all survey sites currently in use. In order of latitude from north to south (A) Port Gregory, (B) Abrolhos, (C) Dongara (Seven Mile Beach), (D) Jurien Bay, (E) Lancelin, (F) Alkimos, (G) Warnbro, and (H) Cape Mentelle. The fishery-wide PI (I) is calculated as a mean of all 8 sites. The gray shading indicates the period of low settlement index which occurred over the whole fishery.
Materials and Methods
Puerulus Settlement Data
Puerulus settlement is surveyed year-round, currently at eight sites across the fishery (Figure 1) using artificial seagrass-like collectors (Phillips, 1972). The first collectors were deployed at Seven-Mile beach near Dongara in 1968, with sites chosen based on observed habitat association of juvenile P. cygnus (Phillips, 1972). Puerulus settlement sampling is conducted as close as possible to the full-moon, but may occur 5-days either side. Puerulus are likely to have settled on the previous new moon period, giving approximately monthly data (de Lestang et al., 2012).
For this study we used all available puerulus settlement data from 1968 onward to assess changes in the magnitude of settlement (Table 1). For each site, monthly puerulus settlement was calculated as the average number of puerulus counted per collector. If a site was not sampled for a month, the proportion that month contributed on average to a settlement season was used to estimate the missing month’s likely proportional settlement level. The annual PI for a given site is the sum of monthly mean values between May and April. The standardized fishery-wide puerulus index, PI, is calculated based on the monthly mean puerulus settlement numbers from all 8 sites, using a Generalized Linear Model to adjust for unbalanced sampling (if it occurred) between site and month, thus obtaining an annual index [marginal means computed by the emmeans() R package (Lenth 2020)].
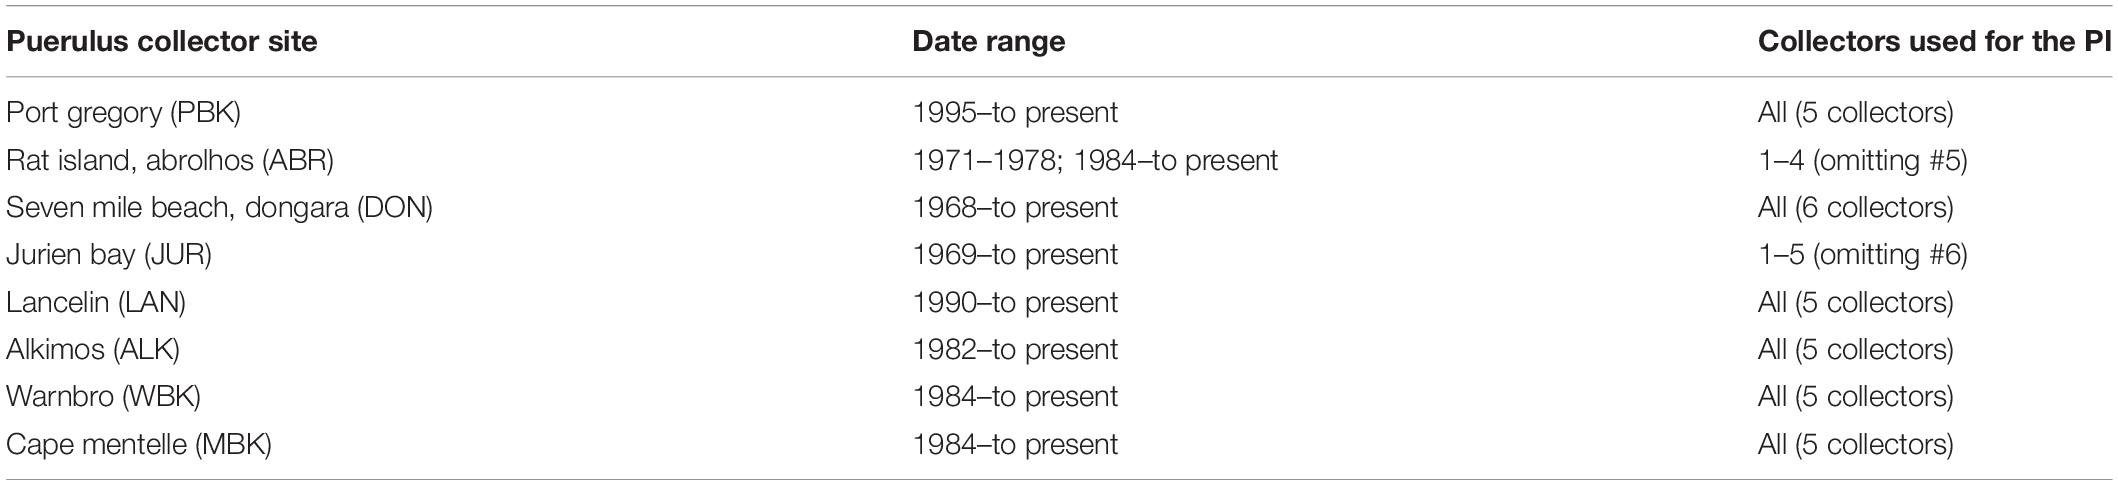
Table 1. Summary of identified contrasts in puerulus settlement patterns before and after the P. cygnus recruitment failure in 2008.
The spatial and temporal distribution of settlement over the latitudes of the fishery were investigated from 1984 onward, when most sites were being frequently serviced and providing consistent data. The timing and latitude of settlement are separate indices derived from all sites’ data. The timing of settlement was calculated as the mean day since May 1 of the season, weighted by the monthly magnitude of settlement. This was calculated here for the whole fishery and each site. We have chosen to focus on sites individually as changes in the PI at the sites have evidently responded differently over the last twenty years.
Statistical Analysis
Three fixed factors were used to test changes in the mean numbers of puerulus before and after the low settlement period across the fishery: in the early or late part of the season (2 levels; Early and Late), before or after the period of low settlement (2 levels; Before and After), and the Site (8 levels; Port Gregory (PBK), Abrolhos (ABR), Dongara (DON), Jurien Bay (JUR), Lancelin (LAN), Alkimos (ALK), Warnbro (WBK), and Cape Mentelle (MBK). Monthly settlement numbers were averaged by each collector for both the early and late part of the settlement season, with seasons before and after the period of low settlement used as replicates. A repeated measure analysis of variance was conducted, with Collector identity (6 levels; nested in Site) included to account for repeated sampling, using the PERMANOVA + add-on package for PRIMER v6 (using 9,999 permutations, Anderson et al., 2008) and a Euclidean distance measure. Significant terms and interactions were investigated using a posteriori pairwise comparisons with the PERMANOVA t-statistic and 9,999 permutations (see Anderson, 2001).
Results
Magnitude of Settlement
Concurrent Seasonal Settlement Across the Fishery
High and low puerulus settlement seasons occur concurrently across all sites with the highest numbers occurring in the central latitudes of the fishery at Dongara, Jurien Bay, and Lancelin. Lancelin recorded the highest PI for one collector site in the 1995 season with 262 (Figure 2). The highest mean PI across the whole fishery was during the 1974 season when all existing sites at the time (Abrolhos, Dongara, and Jurien Bay) experienced a peak in settlement (Figures 2B–D). Since data collection began, there has been a general trend in highs and subsequent lows approximately every five years (Figure 2). This is consistent at all sites apart from Cape Mentelle, which has consistently low puerulus numbers. Often the high/low settlements coincided with ENSO events with higher settlement during La Niña years (1974, 1988–1989, 1999) and lower settlement index during El Niño years (1982, 1988, 2002). There were also contrasts to this pattern with a higher settlement index in 1988 associated with El Niño and lower settlement index during the La Niña event in 2011. Subsequent to the higher settlement in 1999–2000 there was a gradual decrease in settlement index with the minimum values recorded in 2008–2009. We define recruitment failure for the 2008 and 2009 seasons. The settlement index gradually increased from 2010 onward (Figure 2I).
A Change in the Magnitude of Monthly Settlement: Before and After the Puerulus Decline
The monthly puerulus settlement over the season (May–April) differs between the sites, although sites closer in latitude to one another vary more similarly, even in their response to the period of low settlement (Figure 3). At the northern latitudes of the fishery (27–29°S), Port Gregory would, on average, peak in August and September before gradually declining until the end of the season. This is in comparison to now, where the peak monthly puerulus settlement, post-2010, has now decreased in magnitude by half and occurs in December and February (Figure 3). Regardless of the period of low settlement, the peak month for the Abrolhos puerulus settlement has consistently occurred in December. Across the central sites (Dongara, Jurien Bay and Lancelin) the timing of settlement appears to have shifted toward later in the season (Figure 3). Both Warnbro and Cape Mentelle have declined to low puerulus numbers with no distinguishable patterns. Across the latitudinal range of PI collection, monthly numbers of puerulus settlement have decreased more in the first half of the season, than the second. This is particularly clear for the central sites where the greatest puerulus numbers are typically recorded.
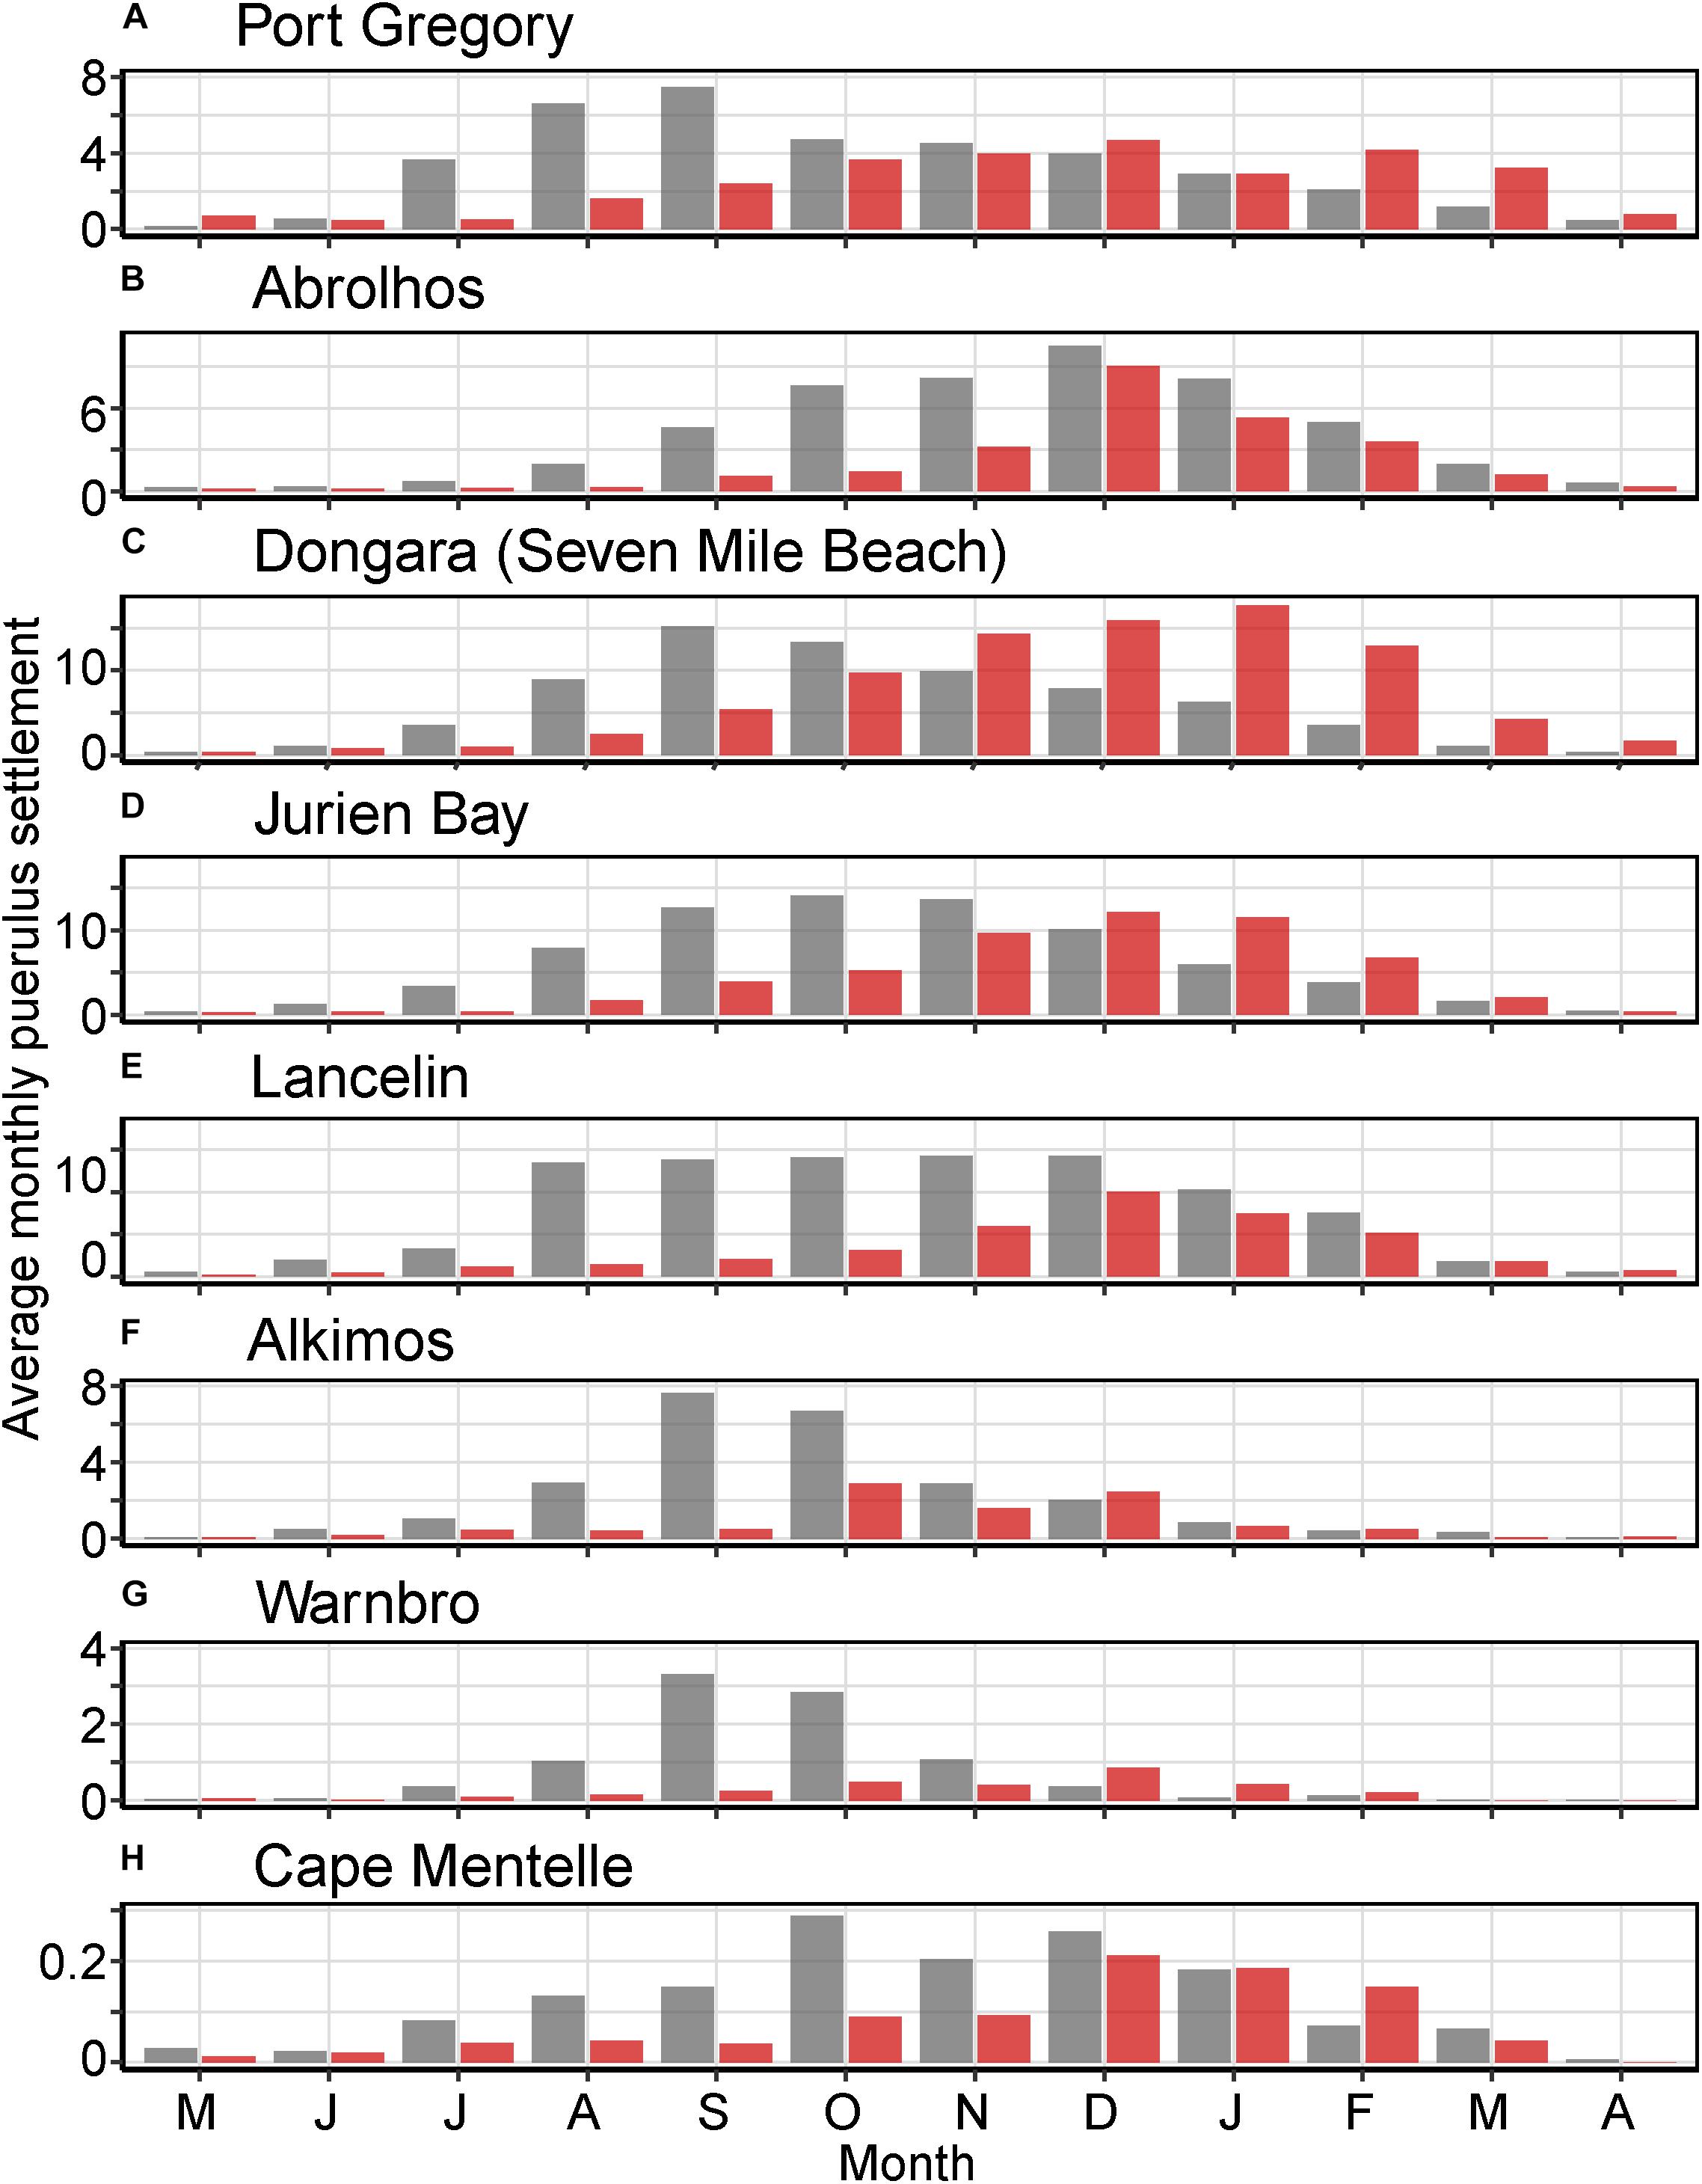
Figure 3. Average monthly puerulus settlement over the season (May—April) at each survey site before (gray) and after (red) the 2007 downturn in the puerulus index, with 2007 to 2009 seasons removed. In order of latitude from north to south (A) Port Gregory (B) Abrolhos (C) Dongara (Seven Mile Beach) (D) Jurien Bay (E) Lancelin (F) Alkimos (G) Warnbro and (H) Cape Mentelle.
Timing of Settlement: Variation Across Sites
The mean timing of settlement over all sites have shifted later in the year. Prior to 2008–2009 the peak mean settlement occurred October and November and post-2009 it is in December (Figure 4). The mean timing of settlement at each individual site has shifted 23 days later post-2009.
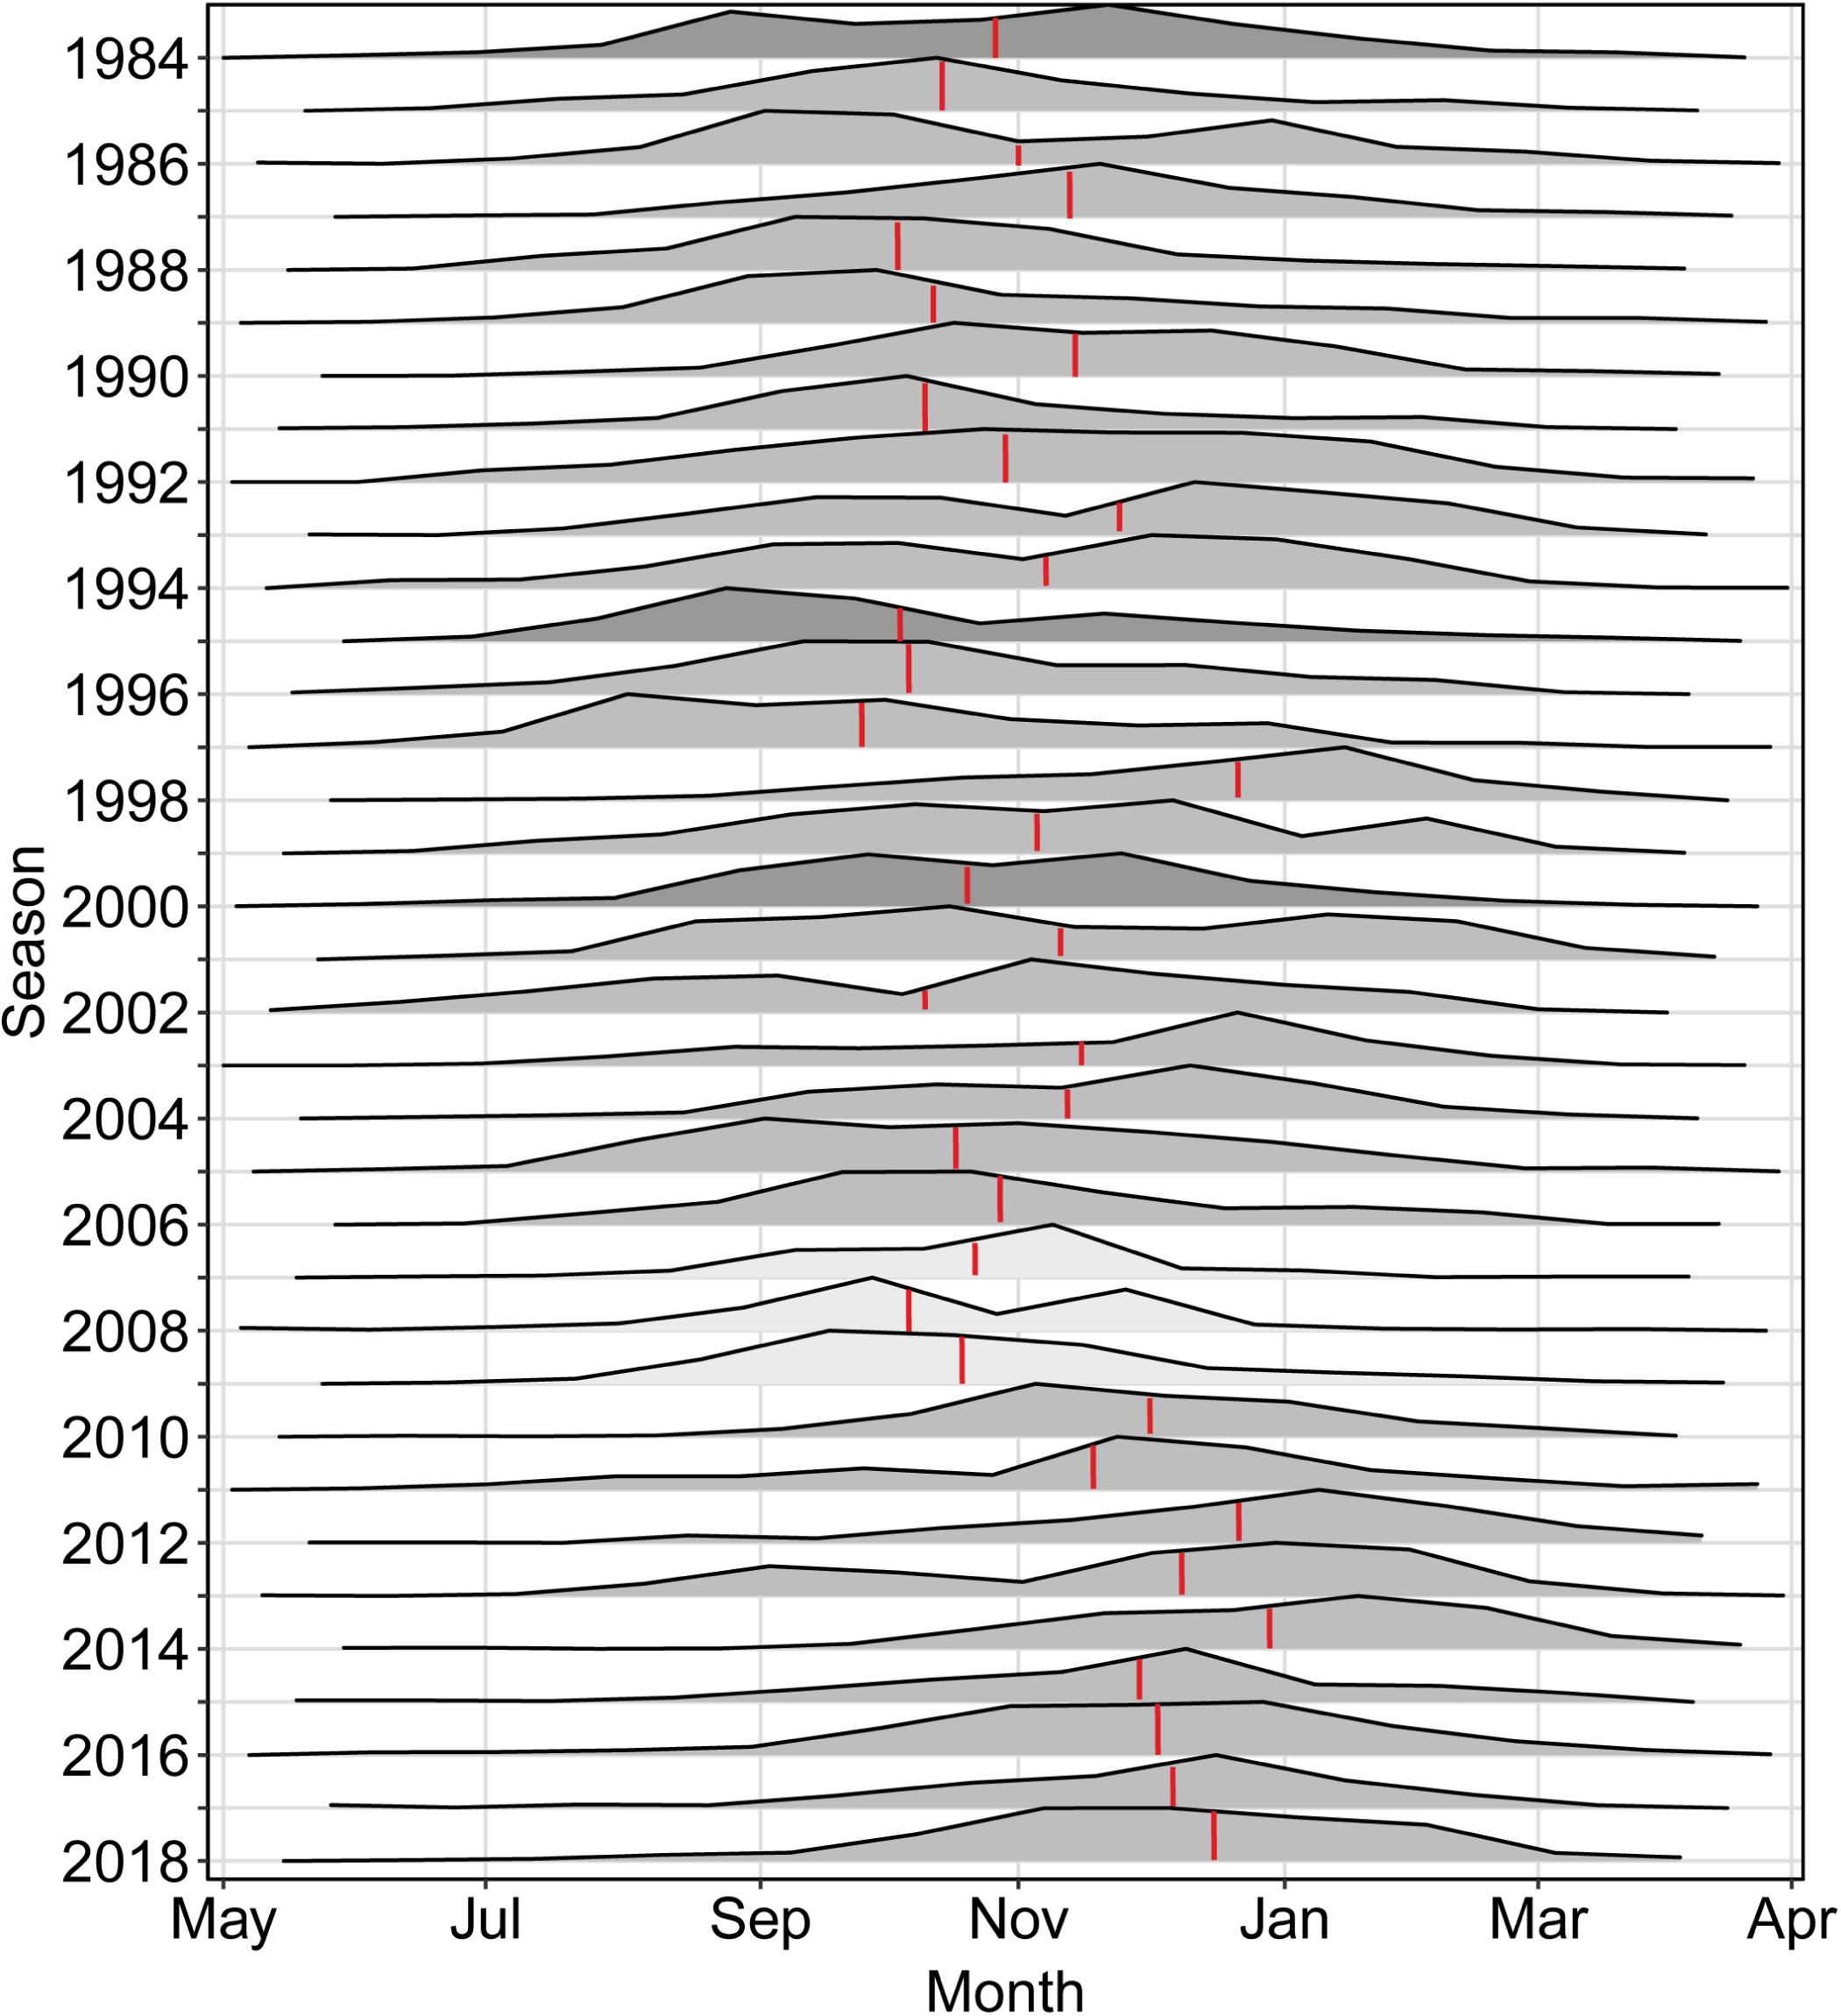
Figure 4. Adjusted settlement ridgeline plot over all puerulus sites from 1990 to 2018, displaying the timing of puerulus settling into the fishery throughout the season. Red line indicates the mean timing for the whole season starting May 1. Light gray seasons are those with a PI in the lowest 10 percentile, dark gray seasons had a PI in the highest 90 percentile.
Prior to 2007, there were puerulus settling into the fishery from August through to February with high PI years exhibiting characteristics of two peaks in settlement over the season (e.g., 1984, 1995, and 2000) (Figure 4). Across all locations, aside from Abrolhos, half of the settlement occurred 8before the end of October, implying that the puerulus settling over the fishery was fairly evenly distributed between the first and second 6 months of the season. After 2009, settlement was minimal in the first half of the season, with most puerulus settling after September, with the two settlement peaks no longer being distinguishable (Figure 4). The ratio of May to October settlement to November to April settlement, decreased by approximately 30% after 2009, with over 70% of settlement now occurring after October.
Before the period of low settlement, most sites had significantly higher settlement earlier in the season (PBK, t = 3.79 p < 0.001; ABR, t = 8.47 p < 0.001; DON, t = 5.78 p < 0.001) except for Jurien Bay and Lancelin which did not vary across the season (Figure 5). Historically, Abrolhos was different with consistently more settlement in the latter half of the season. After the period of low settlement, settlement is now generally lower across many sites but there has been a striking shift where the settlement regime of the majority of coastal settlement sites now resembles patterns observed at Abrolhos, with significantly greater settlement occurring in the latter half of the season (Figure 5) (PBK, t = 2.45 p = 0.27; ABR, t = 7.21 p < 0.001; DON, t = 6.53 p < 0.001; JUR, t = 5.48 p < 0.001; LAN t = 5.26 p < 0.001). Exceptions Warnbro, Alkimos, and Cape Mentelle which now have generally very low settlement throughout the year.
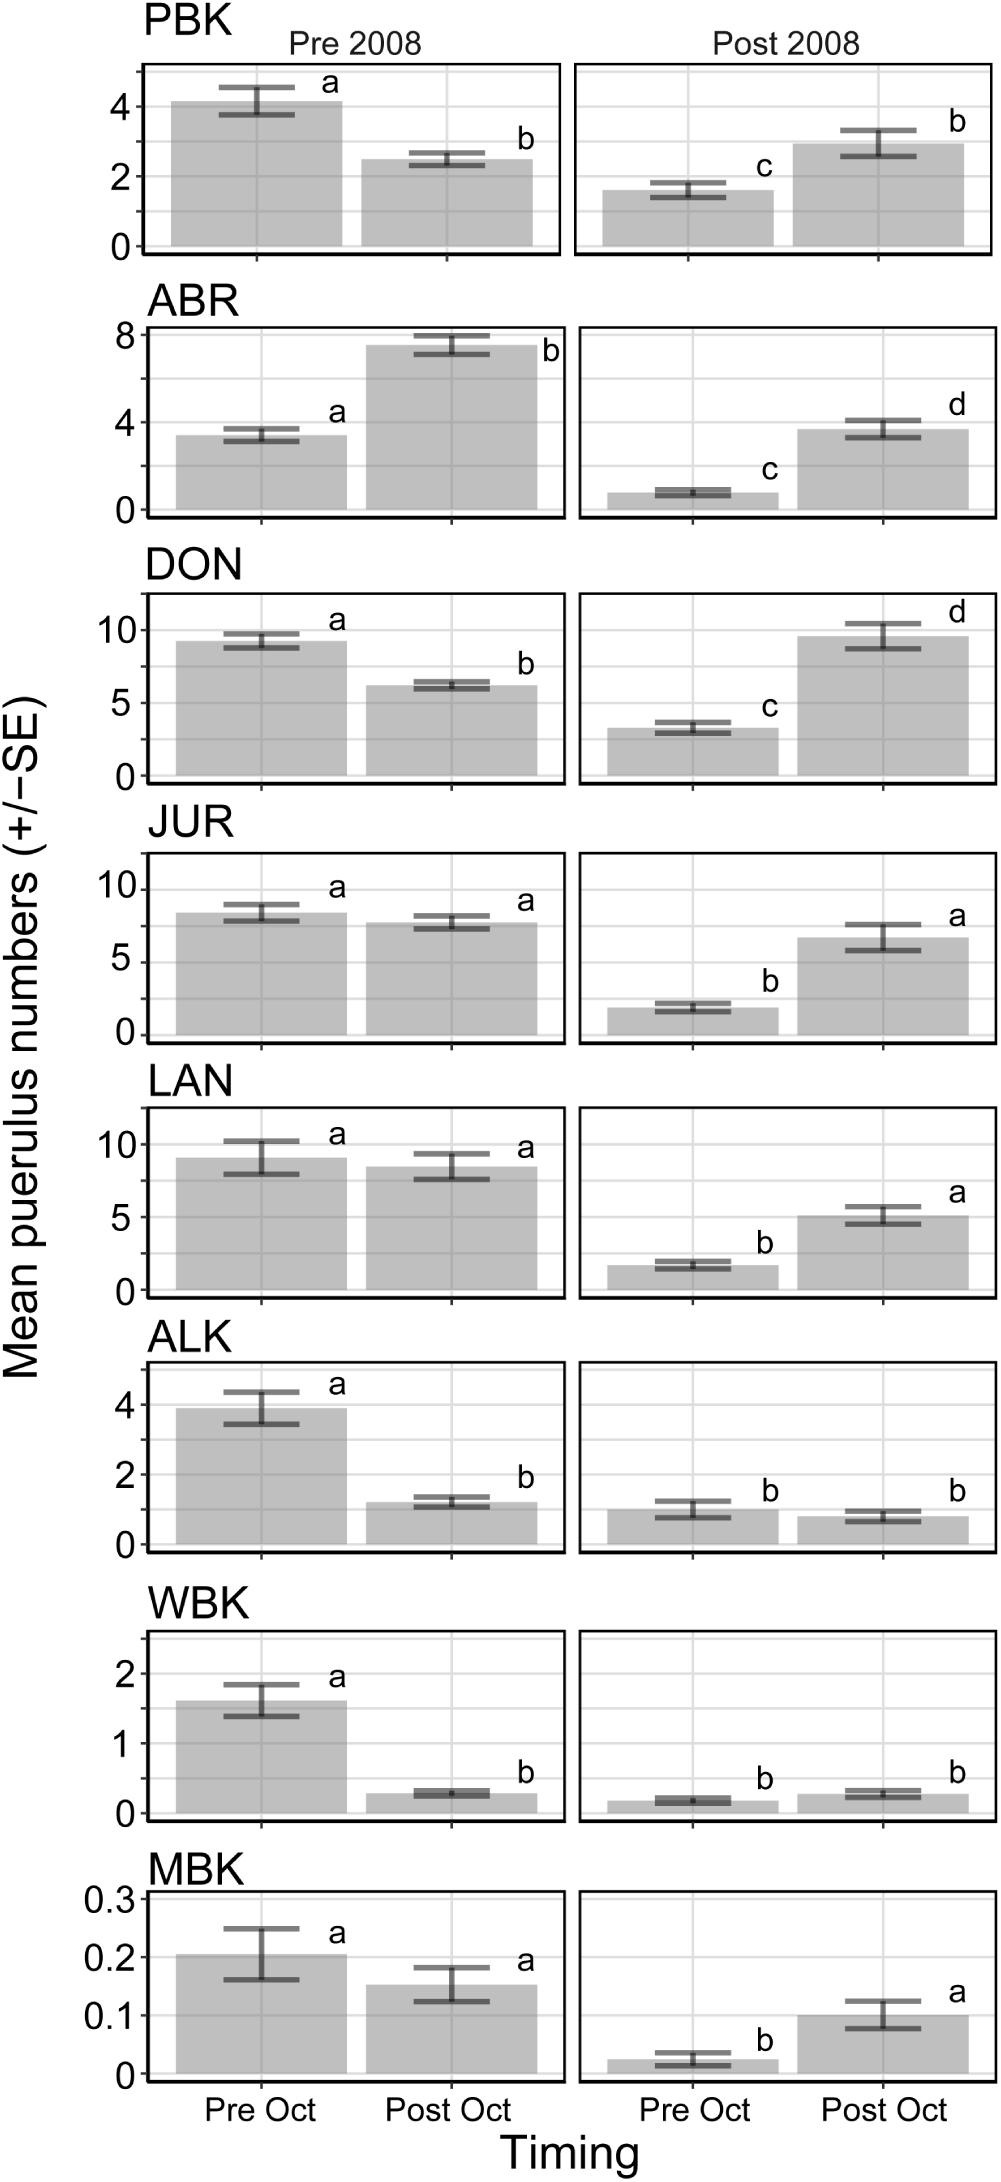
Figure 5. Mean puerulus numbers in the early (May—October) and late (November—April) half of the seasons before (pre 2007) and after (post 2009) the low settlement period. The interaction between site, timing and before or after the decline was significant in the ANOVA model. Results of pair-wise comparisons are indicated by alphabetic character.
Discussion
Using a long-term time series of puerulus settlement along the coast of Western Australia, this study has shown that, although the number of puerulus settling has returned to historical levels in the northern section of the fishery, patterns of puerulus settlement at all coastal sites remain very different to those prior to 2007. This is despite offshore conditions and egg production within the fishery being conducive to successful recruitment and associated high stocks (de Lestang et al., 2015). Through describing changes in PI that have occurred and contrasting them between sites along the coast and times of the year, we have identified a number of indicators that could prove vital in disentangling both the cause of the recruitment failure as well the longer term implications for the western rock lobster fishery (Table 2).

Table 2. Summary of identified contrasts in puerulus settlement patterns before and after the P. cygnus recruitment failure in 2008.
Puerulus settlement levels in the northern areas of the fishery have recovered since the decline to exhibit similar seasonal fluctuations with peaks in PI every few years (Figure 2). In contrast, sites to the south of Lancelin indicated significant decreases in PI magnitude in the early and late stages in the season (Figure 5) with little recovery exhibited (Figure 2). Lancelin, a location with very high recruitment numbers before, has also recovered but to a lesser extent than its adjacent northern counterpart, Jurien Bay (Figure 2). We can therefore examine closely the conditions that may prevent puerulus from recruiting at these southern sites, causing this break-point at Lancelin, including patterns before and after the decline.
In most cases where there has been recovery in the magnitude of settlement, patterns in monthly settlement numbers over the season have shifted (cf. Figures 3, 5). Abrolhos, the only site located offshore, has changed the least in its monthly settlement characteristics and therefore timing of settlement (Figures 3B, 5). Abrolhos was previously an outlier regarding its later timing of settlement and being located within an island chain offshore (de Lestang et al., 2016). A decade later, the coastal settlement regime now resembles the historic offshore settlement regime (Figure 5). Settlement numbers in the early half of the season have declined, but they recovered later at both Port Gregory and all sites further south (Figure 5). This shifts the mean timing of settlement to approximately a month later. In the years prior to 2008, the more southern sites rarely exhibited a secondary peak in settlement in the latter half of the season, even during a high puerulus season (Figure 6). Therefore, it’s possible that the first larvae to hatch (September–December) is where potential system mismatches lie, as they would be the early recruits within a season. The latter portion of the season has recovered to usual levels at most northern sites with Dongara being significantly higher in this section than before (Figure 5). Abrolhos, the offshore site reflects minimal changes, suggesting that puerulus journey across the shelf to the nearshore is where changes may have occurred. Future research needs to examine changes on the continental shelf that may have occurred, particularly during the peak months of settlement at the different sites.
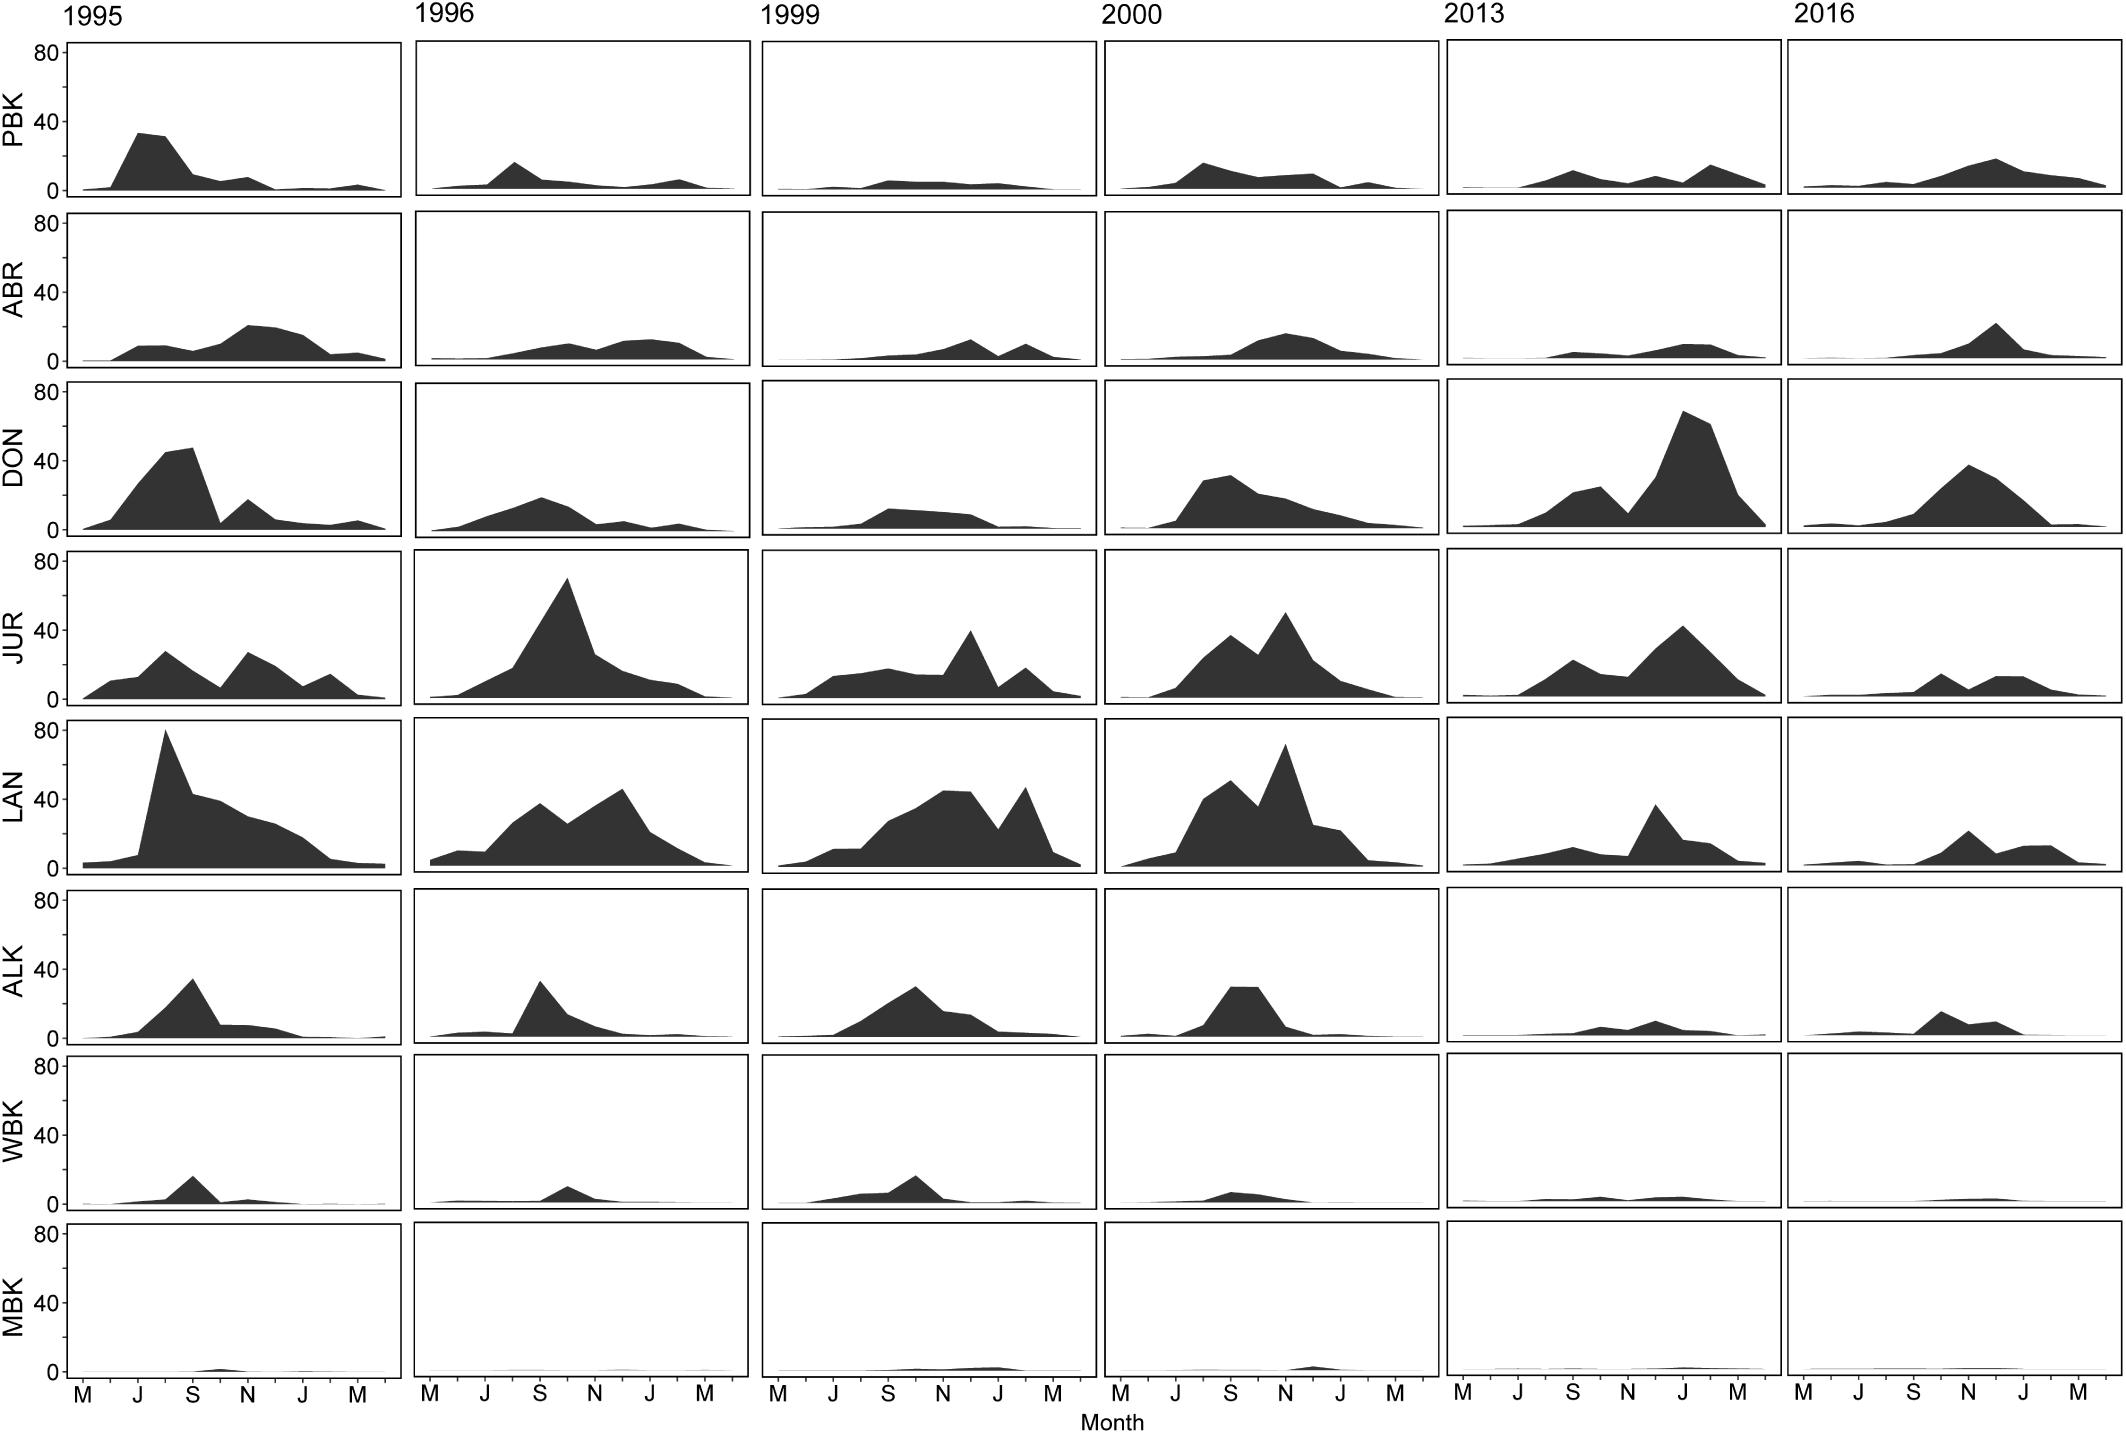
Figure 6. Monthly puerulus numbers on collectors at each monitoring site over select seasons from north to south as the top to bottom of the page.
Between and within years, there was a strong pattern of synchronicity in PI between adjacent sites, suggesting that local oceanic conditions likely contribute to variation in puerulus settlement (Figure 3). This is not surprising, as multiple spawning periods over one season, or over a few months, leads to altering dispersal patterns and greatly different oceanographic forcing for many pelagic larvae (Schilling et al., 2020). As a whole, the mean timing of settlement during peak years (highest 90%) has been during October whereas now, the mean timing of settlement is usually in late December, irrespective of the puerulus numbers. Years with high puerulus numbers provide an opportunity to disentangle relationships with environmental predictors, i.e., low PI numbers at a site would not be due to a poor spawning or high phyllosoma mortality but rather changing environmental conditions (Figure 6). In 1995 and 2000, Abrolhos peaked in the second half of the season. Sometimes a similar timed peak is experienced in Dongara (1995) and sometimes not (2000). But since the recovery of settlement (post 2009), the peak in Dongara settlement during higher years were only in line with those experienced at Abrolhos (2013 and 2016). The same was true for Jurien Bay and Lancelin now only experiencing a late peak in settlement, with Lancelin to a lesser extent (Figure 6). Prior to 2007, multiple peaks were common with consecutive months of high settlement (Lancelin 1995, Jurien Bay 1996). These patterns suggested that since the decline, there may have been a change in the locations (latitude) and timing of cross shelf transport in the system, particularly along the southern sites. This cross-shelf transport changes with the preferential latitudes of mesoscale eddies off the continental shelf. Therefore, taking into account the decline at Lancelin and evidence of more northward settlement at Quobba during the years of decline, the presence of eddies and differences in cross-shelf transport should be examined (de Lestang et al., 2012).
Given the changes highlighted above, seasons with substantial puerulus collection at one or more sites indicated there must have been some egg production along the coast 9–11 months prior. Therefore, when little to negligible settlement was experienced at any of the eight collector sites (2007–2010) there was the possibility of reduced larvae supply to the system (Brown, 2009) or increased larval mortality. Independent Breading Stock Surveys (IBSS) indicated that there was no change in the mature female stock prior to the PI decline (de Lestang et al., 2015), but there was the possibility that surveys were not representative of all mature females. Risk assessment on the low puerulus settlement indicated that 35–50% of the decline was likely due to poor breeding stock levels around the Abrolhos and Big Bank area, which suggest the possibility was known (Brown, 2009). Management actions were taken at the time and current stock levels indicate that breeding stock levels are now at record highs, yet patterns in the magnitude and timing of settlement throughout the fishery have undoubtedly changed. Depending on environmental conditions, it has been suggested that certain breeding areas would have more successful puerulus recruits to the fishery. Previous research has indicated that the puerulus reaching the Abrolhos were possibly less influenced by broad-scale environmental conditions and more influenced by the spawning stock (Caputi et al., 1995). Consequently, the Abrolhos recovery has occurred with a similar month to month pattern as it may have been affected by the low breeding stock but offshore broad-scale environmental conditions have been consistent. However, for coastal sites, it’s possible that the recovery in the spawning stock has occurred in a way that has resulted in a timing mismatch or shift in environmental drivers, such as the Capes Current, which now resembles the Abrolhos (Caputi et al., 2018).
Previous studies on variability of puerulus settlement and links to the ocean environment have concentrated on processes in the deeper ocean, offshore of the continental shelf. These have included the strength of the Leeuwin Current, using the Fremantle sea level as proxy (Pearce and Phillips, 1988; Caputi and Brown, 1993); The meso-scale eddies in the Leeuwin Current promoting onshore transport of puerulus (Säwström et al., 2014; Hood et al., 2017) and the condition of larvae within the offshore eddies (Fitzgibbon et al., 2014); and, surface gravity wave generated through Stokes drift (Feng et al., 2011). Individual based modeling (IBM) efforts for P. cygnus, with the most recent in 2018, performed fairly well and incorporated the season of recruitment failure. However, their focus was on capturing the annual PI over several decades and not specifically examining the reasons behind the decline in settlement (Feng et al., 2011; Caputi et al., 2018). The hydrodynamic models used in these studies furthermore had low spatial resolution (~10 km) and were not able to resolve the physical processes on the continental shelf without some adjustment (Caputi et al., 2018). Based on the results presented in this study, we believe that the main focus on why these shifts have occurred should be on the processes operating on the continental shelf. The main driver of circulation along the WA continental shelf is wind, particularly over the summer months and the associated Capes Current (Gersbach et al., 1999; Wijeratne et al., 2018). Another contributing factor may be the second peak in the Leeuwin Current in January (Wijeratne et al., 2018).
The years of recruitment failure (2007–2009, section “Concurrent Seasonal Settlement Across the Fishery”) can be interrogated from a “whole of fishery” perspective. The period 2000–2007, prior to the minima in settlement index, was associated with a cooler sea surface temperature anomalies (SSTA) that progressively became cooler over time (Pattiaratchi and Hetzel, 2020). Here, the SSTA decreased from –0.5°C in 2001 to –1.75°C in 2006. Similar trends decrease over the period 2000–2007 were recorded in Kinetic Energy and Eddy Kinetic Energy across the study region (Pattiaratchi and Siji, 2020). Over 2004–2013 the heat content in the subtropical Southern Indian Ocean was increasing generating three consecutive positive Indian Ocean Dipole events, one which additionally corresponded with a La Niña event (2007) (Cai et al., 2009; Volkov et al., 2020). This extended period of the hiatus in the system and unprecedented conditions could have bene a contributor to the recruitment failure. The region also experienced a severe marine heat wave (Ningaloo Niña) during 2011 that has a significant effect on the coastal ecosystems (Feng et al.,2015a,b). This event may have an influence on the recovery of the settlement index after 2008–2009. For example, lower settlement in 2011, a La Niña year when higher settlement was expected may have been influenced by this event. The changes in the ocean environment that may have contributed to the recruitment failure and the subsequent shifts in recruitment patterns highlighted here will be investigated in future research.
Over a decade after the period of low puerulus settlement, we understand that a broad-scale south-east Indian Ocean physical change was not the sole reason behind the changes in recruitment patterns, as one sustained change likely did not occur to alter all sites equally. However, breaking down each stage of the P. cygnus early pelagic life cycle highlights just how many physical and biological impacts there are on their survival, including a successful breeding stock. It is possible that over the period of low settlement all worse case scenarios coincided, only to recover in a slightly shifted manner. The significant changes in the fishery since the recruitment failure (2008–2009) can now be dissected as likely nearshore responses as opposed to a shift in the south-east Indian Ocean conditions.
Conclusion
In summary, we have dissected major points of contrast prior to and following the recruitment failure in 2008 to generate the data required to examine the relationships between puerulus recruitment and the physical marine environment. The number of successful recruits reaching the Abrolhos has changed the least whilst the three southern-most collector sites (Alkimos, Warnbro, and Cape Mentelle) have markedly declined. Monthly settlement patterns in the central sites and Port Gregory have shifted to peaking in the second half of the season similarly to what is exhibited at the Abrolhos. Due to these changes, the mean latitude of settlement has shifted further north since 2008. Particle tracking efforts during the years of decline, before and after will help answer some of these questions surrounding the mechanisms driving their transport month to month and clarify reasons behind the decline.
Data Availability Statement
Publicly available datasets were analyzed in this study. This data can be found here: http://www.fish.wa.gov.au/Species/Rock-Lobster/Lobster-Management/Pages/Puerulus-Settlement-Index.aspx.
Author Contributions
JK completed the analysis of the data and conclusions under the guidance of SL, TL, and CP. JK wrote the manuscript and produced the figures with the help and inputs from all co-authors. All authors contributed to the article and approved the submitted version.
Funding
This project was funded by the University of Western Australia. JK was supported by the UWA University Postgraduate Award and Australia Research Training Program scholarships.
Conflict of Interest
The authors declare that the research was conducted in the absence of any commercial or financial relationships that could be construed as a potential conflict of interest.
Acknowledgments
We would like to acknowledge the Department for Primary Industries and Regional Development (Fisheries) for the use of raw puerulus collector data. We thank Todd Bond for his assistance with statistical analysis.
References
Anderson, M. J. (2001). Permutation tests for univariate or multivariate analysis of variance and regression. Can. J. Fish. Aquat. Sci. 58, 626–639. doi: 10.1139/f01-004
Anderson, M. J., Gorley, R. N., and Clarke, K. R. (2008). PERMANOVA+ for PRIMER: Guide to Software and Statistical Methods. Plymouth: PRIMER-E Ltd.
Bakun, A. (1990). Global climate change and intensification of coastal ocean upwelling. Science 247, 198–201.
Bellchambers, L. M., Gaughan, D. J., Wise, B. S., Jackson, G., and Fletcher, W. J. (2016). Adopting marine stewardship council certification of Western Australian fisheries at a jurisdictional level: the benefits and challenges. Fish. Res. 183, 609–616. doi: 10.1016/j.fishres.2016.07.014
Brown, R. (2009). Western Rock Lobster Low Puerulus Settlement Risk Assessment Workshop Held 1 and 2 April 2009. Perth, WA: Department of Fisheries.
Cai, W., Pan, A., Roemmich, D., Cowan, T., and Guo, X. (2009). Argo profiles a rare occurrence of three consecutive positive Indian Ocean Dipole events, 2006-2008. Geophys. Res. Lett. 36:4. doi: 10.1029/2008GL037038
Caputi, N. (2008). Impact of the Leeuwin Current on the spatial distribution of the puerulus settlement of the western rock lobster (Panulirus cygnus) and implications for the fishery of Western Australia. Fish. Oceanogr. 17, 147–152. doi: 10.1111/j.1365-2419.2008.00471.x
Caputi, N., and Brown, R. (1993). The effect of environment on puerulus settlement of the western rock lobster (Panulirus cygnus) in Western Australia. Fish. Oceanogr. 2, 1–10. doi: 10.1111/j.1365-2419.1993.tb00007.x
Caputi, N., Brown, R., and Chubb, C. (1995). Regional prediction of the Western Rock Lobster, Panulirus Cygnus, commercial catch in Western Australia. Crustaceana 68, 245–256. doi: 10.1163/156854095X00142
Caputi, N., Chubb, C., and Pearce, A. (2001). Environmental effects on recruitment of the western rock lobster, Panulirus cygnus. Mar. Freshw. Res. 52, 1167–1174. doi: 10.1071/MF01180
Caputi, N., Feng, M., de Lestang, S., Denham, A., Penn, J., Slawinski, D., et al. (2014). Identifying Factors Affecting the Low Western Rock Lobster Puerulus Settlement in Recent Years Final FRDC Report – Project 2009/18. Western Australia: Department of Fisheries, 144. Available online at: http://www.fish.wa.gov.au/Documents/research_reports/frr255.pdf
Caputi, N., Feng, M., Denham, A., de Lestang, S., Penn, J., Slawinski, D., et al. (2018). Optimizing an oceanographic-larval model for assessment of the puerulus settlement of the Western Rock Lobster, Panulirus cygnus, in Western Australia. Bull. Mar. Sci. 94, 1–26.
Caputi, N., Melville-Smith, R., de Lestang, S., Pearce, A., and Feng, M. (2010). The effect of climate change on the western rock lobster (Panulirus cygnus) fishery of Western Australia. Can. J. Fish. Aquat. Sci. 67, 85–96. doi: 10.1139/F09-167
Chittleborough, R. (1975). Environmental factors affecting growth and survival of juvenile western rock lobsters Panulirus longipes (Milne-Edwards). Mar. Freshw. Res. 26, 177–196. doi: 10.1071/MF9750177
Clarke, A., and Li, J. (2004). El Nino/La Nina shelf edge flow and Australian western rock lobsters. Geophys. Res. Lett. 31, 8–11. doi: 10.1029/2003GL018900
Cresswell, G., and Golding, T. (1980). Observations of a south-flowing current in the southeastern Indian Ocean. Deep. Sea Res. A 27, 449–466.
de Lestang, S., Caputi, N., Feng, M., Denham, A., Penn, J., Slawinski, D., et al. (2015). What caused seven consecutive years of low puerulus settlemt in the western rock lobster fishery of Western Australia? ICES J. Mar. Sci. 72, 49–58. doi: 10.1093/icesjms/fst048
de Lestang, S., Caputi, N., and How, J. (2016). Resource Assessment Report: Western Rock Lobster Resource of Western Australia. Western Australian Marine Stewardship Council Report Series. Western Australia: Department of Fisheries. Available online at: http://www.fish.wa.gov.au/Documents/wamsc_reports/wamsc_report_no_9.pdf
de Lestang, S., Caputi, N., How, J., Melville-Smith, R., Thomson, A., and Stephenson, P. (2012). Stock Assessment for the West Coast Rock Lobster Fishery. Western Australia: Department of Fisheries, 200. Available online at: http://www.fish.wa.gov.au/Documents/research_reports/frr217.pdf
Feng, M., Benthuysen, J., Zhang, N., and Slawinski, D. (2015a). Freshening anomalies in the Indonesian throughflow and impacts on the Leeuwin Current during 2010-2011. Geophys. Res. Lett. 42, 8555–8562. doi: 10.1002/2015GL065848
Feng, M., Caputi, N., Penn, J., Slawinski, D., de Lestang, S., Weller, E., et al. (2011). Ocean circulation, Stokes drift, and connectivity of western rock lobster (Panulirus cygnus) population. Can. J. Fish. Aquat. Sci. 68, 1182–1196. doi: 10.1139/f2011-065
Feng, M., Hendon, H. H., Xie, S. P., Marshall, A. G., Schiller, A., Kosaka, Y., et al. (2015b). Decadal increase in Ningaloo Niño since the late 1990s. Geophys. Res. Lett. 42, 104–112. doi: 10.1002/2014GL062509
Feng, M., Meyers, G., Pearce, A., and Wijffels, S. (2003). Annual and interannual variations of the Leeuwin Current at 32 ° S. J. Geophys. Res. 108, 19–39. doi: 10.1029/2002JC001763
Fitzgibbon, Q., Jeffs, A., and Battaglene, S. (2014). The Achilles heel for spiny lobsters: the energetics of the non-feeding post-larval stage. Fish Fish. 15, 312–326. doi: 10.1111/faf.12018
Francis, R., and Sibley, T. (1991). Climate change and fisheries: what are the real issues? NW Environ. J. 7, 295–307.
Geromont, H., and Butterworth, D. (2015). Generic management procedures for data-poor fisheries: forecasting with few data. ICES J. Mar. Sci. 72, 251–261. doi: 10.1038/278097a0
Gersbach, G., Pattiaratchi, C., Ivey, G., and Cresswell, G. (1999). Upwelling on the south-west coast of Australia – source of the capes current. Cont. Shelf Res. 19, 363–400. doi: 10.1016/S0278-4343(98)00088-0
Griffin, D., Wilkin, J., Chubb, C., Pearce, A., and Caputi, N. (2001). Ocean currents and the larval phase of Australian western rock lobster, Panulirus cygnus. Mar. Freshw. Res. 52, 1187–1199. doi: 10.1071/MF01181
Hood, R. R., Beckley, L. E., and Wiggert, J. D. (2017). Biogeochemical and ecological impacts of boundary currents in the Indian Ocean. Prog. Oceanogr. 156, 290–325. doi: 10.1016/j.pocean.2017.04.011
Litzow, M., Hunsicker, M., Bond, N., Burke, B., Cunningham, C., Gosselin, J., et al. (2020). The changing physical and ecological meanings of North Pacific Ocean climate indices. Proc. Natl. Acad. Sci. U. S. A. 117, 7665–7671. doi: 10.1073/pnas.1921266117
Mantua, N., Hare, S., Zhang, Y., Wallace, J., and Francis, R. (1997). A pacific interdecadal climate oscillation with impacts on salmon production. Bull. Am. Meteorol. Soc. 78, 1069–1079. doi: 10.1175/1520-04771997078<1069:APICOW<2.0.CO;2
Montecino, V., and Lange, C. (2009). The humboldt current system: ecosystem components and processes, fisheries, and sediment studies. Prog. Oceanogr. 83, 65–79. doi: 10.1016/j.pocean.2009.07.041
O’Rorke, R., Jeffs, A., Wang, M., Waite, A., Beckley, L., and Lavery, S. (2014). Spinning in different directions: western rock lobster larval condition varies with eddy polarity, but does their diet? J. Plankton Res. 37, 542–553. doi: 10.1093/plankt/fbv026
Pattiaratchi, C., and Buchan, S. (1991). Implications of long-term climate change for the Leeuwin Current. J. R. Soc. West. Aust. 74, 133–140.
Pattiaratchi, C., and Woo, M. (2009). The mean state of the Leeuwin Current system between North West Cape and Cape Leeuwin. J. R. Soc. West. Aust. 92, 221–241.
Pattiaratchi, C. B., and Hetzel, Y. (2020). “Sea surface temperature variability,” in State and Trends of Australia’s Oceans Report, eds A. J. Richardson, R. Eriksen, T. Moltmann, I. Hodgson-Johnston, and J. R. Wallis (Hobart, Tas: Integrated Marine Observing System), 1.2.1–1.2.4.
Pattiaratchi, C. B., and Siji, P. (2020). “Variability in ocean currents around Australia,” in State and Trends of Australia’s Oceans Report, eds A. J. Richardson, R. Eriksen, T. Moltmann, I. Hodgson-Johnston, and J. R. Wallis (Hobart, Tas: Integrated Marine Observing System), 1.4.1–1.4.6.
Pearce, A., and Pattiaratchi, C. (1999). The capes current: a summer countercurrent flowing past Cape Leeuwin and Cape Naturaliste, Western Australia. Cont. Shelf Res. 19, 401–420. doi: 10.1016/S0278-4343(98)00089-2
Pearce, A., and Phillips, B. (1988). Enso events, the leeuwin current, and larval recruitment of the western rock lobster. ICES J. Mar. Sci. 45, 13–21. doi: 10.1093/icesjms/45.1.13
Phillips, B. (1972). A semi-quantitative collector of the puerulus larvae of the western rock lobster panulirus longipes cygnus george (Decapoda, Palinuridea). Crustaceana 22, 147–154. doi: 10.1163/156854072X00408
Phillips, B. (1981). The circulation of the southeastern Indian Ocean and the planktonic life of the western rock lobster. Oceanogr. Mar. Biol. An Annu. Rev. 19, 11–39. doi: 10.1071/MF9810417
Phillips, B. (1986). Prediction of commercia catches of the western rock lobster (Panulirus cygnus). Can. J. Fish. Aquat. Sci. 43, 2126–2130.
Säwström, C., Beckley, L., Saunders, M., Thompson, P., and Waite, A. (2014). The zooplankton prey field for rock lobster phyllosoma larvae in relation to oceanographic features of the south-eastern Indian Ocean. J. Plankton Res. 36, 1003–1016. doi: 10.1093/plankt/fbu019
Schilling, H. T., Everett, J. D., Smith, J. A., Stewart, J., Hughes, J. M., Roughan, M., et al. (2020). Multiple spawning events promote increased larval dispersal of a predatory fish in a western boundary current. Fish. Oceanogr. 29, 309–323. doi: 10.1111/fog.12473
Smith, D., Punt, A., Dowling, N., Smith, A., Tuck, G., and Knuckey, I. (2009). Reconciling approaches to the assessment and management of data-poor species and fisheries with Australia’s harvest strategy policy. Mar. Coast. Fish. 1, 244–254. doi: 10.1577/c08-041.1
Volkov, D. L., Lee, S. K., Gordon, A. L., and Rudko, M. (2020). Unprecedented reduction and quick recovery of the south indian ocean heat content and sea level in 2014-2018. Sci. Adv. 6: eabc1151. doi: 10.1126/sciadv.abc1151
Keywords: puerulus, western rock lobster, timing of settlement, Western Australia, time series
Citation: Kolbusz J, de Lestang S, Langlois T and Pattiaratchi C (2021) Changes in Panulirus cygnus Settlement Along Western Australia Using a Long Time Series. Front. Mar. Sci. 8:628912. doi: 10.3389/fmars.2021.628912
Received: 13 November 2020; Accepted: 21 May 2021;
Published: 25 June 2021.
Edited by:
Yngvar Olsen, Norwegian University of Science and Technology, NorwayReviewed by:
Adrian Linnane, South Australian Research and Development Institute, AustraliaOscar Sosa-Nishizaki, Center for Scientific Research and Higher Education in Ensenada (CICESE), Mexico
Copyright © 2021 Kolbusz, de Lestang, Langlois and Pattiaratchi. This is an open-access article distributed under the terms of the Creative Commons Attribution License (CC BY). The use, distribution or reproduction in other forums is permitted, provided the original author(s) and the copyright owner(s) are credited and that the original publication in this journal is cited, in accordance with accepted academic practice. No use, distribution or reproduction is permitted which does not comply with these terms.
*Correspondence: Jessica Kolbusz, amVzc2ljYS5rb2xidXN6QHJlc2VhcmNoLnV3YS5lZHUuYXU=
†ORCID: Jessica Kolbusz, orcid.org/0000-0003-2779-451X; Simon de Lestang, https://www.researchgate.net/profile/Simon-De-Lestang; Tim Langlois, orcid.org/0000-0001-6404-4000; Charitha Pattiaratchi, orcid.org/0000-0003-2229-6183