 Marcos Tonelli*
 Camila Negrão Signori
 Amanda Bendia
 Juliana Neiva
 Bruno Ferrero
 Vivian Pellizari
 Ilana Wainer
- Instituto Oceanográfico, Universidade de São Paulo, São Paulo, Brazil
Anthropogenic global warming can have strong impacts on marine ecosystems, especially on climate-sensitive regions such as the Southern Ocean (SO). As key drivers of biogeochemical cycles, pelagic microbial communities are likely to respond to increases in sea surface temperature (SST). Thus, it is critical to understand how SST may change in future scenarios and how these changes will affect the composition and structure of microbial communities. By using a suite of Earth System Models participating in the Coupled Model Intercomparison Project Phase 6 (CMIP6), machine learning, and 16S rRNA sequencing data, we investigated the long-term changes as projected by CMIP6 simulations in SST throughout the twenty first century and the microbial diversity responses in the SO. Four Shared Socioeconomic Pathways (SSP1-2.6, SSP2-4.5, SSP3-7.0, and SSP5-8.5) were considered to assess the SO surface sensitivity to a warming climate. The SST changes across SSPs were ≈0.3, ≈0.7, ≈1.25, and ≈1.6oC between 2015 and 2100, respectively, and the high emissions scenarios projected a much sooner emergence of the human-induced temperature change throughout the SO. The impacts on Antarctic marine diversity of bacteria and archaea are expected to be significant and persistent by the late twenty first century, especially within the higher end of the range of future forcing pathways.
Introduction
Throughout the second half of the twentieth century, most of the Earth’s energy imbalance has been stored in the ocean, primarily at the surface (Ishii and Kimoto, 2009; Lyman et al., 2010; Trenberth, 2010; Abraham et al., 2013), and more recently reaching deeper layers (Bilbao et al., 2019). The resulting increase in ocean heat content has been reported to be largely due to anthropogenic forcing (Barnett et al., 2005; Gleckler et al., 2012; Pierce et al., 2012; Bilbao et al., 2019). These human-induced changes have already spread to about half (20–55%) of the world oceans (Silvy et al., 2020), and the largest heat gain has occurred in the Southern Ocean (Roemmich et al., 2015; Trenberth et al., 2016). However, the ice-insulated regions of the SO protect its sea surface waters from climate forcing (Gille, 2008, 2002; Fahrbach et al., 2011; Tonelli et al., 2019). As a result, heat and carbon uptake happens mostly through the formation and subduction of water masses (Heuzé et al., 2013; Sallée et al., 2013), and the earliest detection of the anthropogenic warming fingerprint in the SO occurs in the ocean interior rather than in surface waters (Silvy et al., 2020).
Despite the ability of the ice-insulated regions of the SO to delay the warming trends throughout the global ocean due to the local circulation and the interaction with sea ice and ice shelves (Fahrbach et al., 2011; Tonelli et al., 2019), warmer surface waters lead to increased sea ice melting, loss of ice mass, and increased surface water flux (Rignot et al., 2008), ultimately leading to a slowdown of bottom water formation and the stalling of the CO2 sink in the SO (Lovenduski et al., 2008; Lenton et al., 2009; Purkey and Johnson, 2012). In particular, the surroundings of the Antarctic Peninsula and the western Weddell Sea have been exposed to intense warming and sea ice melting (Fan et al., 2014).
Climate change affects the growth, reproduction, and survival of aquatic organisms (Kroeker et al., 2010; McFeeters and Frost, 2011; Weydmann et al., 2012; Cripps et al., 2014). The increase in ocean temperature will likely affect the structure and dynamics of microbial community, but since microorganisms show large population sizes and relatively fast reproduction, they might be capable of adapting to global environmental changes through phenotypic plasticity and adaptive evolution (Collins et al., 2014; Hellweger et al., 2014; Doblin and van Sebille, 2016; Verde et al., 2016; Cavan et al., 2019). Microorganisms’ responses to climate change have strong implications for an environmentally sustainable future (Cavicchioli et al., 2019), but our understanding of how they respond to climate warming remains limited.
Although the effect of climate change on microbial functioning is still poorly understood, we know that marine phytoplankton performs half of the global photosynthetic CO2 fixation and half of the oxygen production, and they can have a fast response to climate variations (Arrigo, 2005; Teeling and Glöckner, 2012; Buttigieg et al., 2018). Heterotrophic and chemolithotrophic microorganisms are also important drivers of ocean biogeochemical cycles and constitute the foundations of many marine ecosystems, acting as an essential part of the functioning of trophic levels (Arrigo, 2005; Teeling and Glöckner, 2012; Buttigieg et al., 2018). The SO has shown high and dynamic microbial diversity, with the community composition strongly influenced by temperature (Signori et al., 2014, 2018; Cavicchioli, 2015). Given that temperature increase is expected to modify microbial diversity and distribution with cascading effects at higher trophic levels, predicting how the microbial diversity and community composition will respond to climate change has become an important challenge (Thomas et al., 2012; Toseland et al., 2013; Cavicchioli et al., 2019).
The main tools to investigate projections of global climate change are state-of-the-art climate models designed to estimate the progression of Earth’s climate system in the twenty first century (21C; Eyring et al., 2016). These complex models, however, are not able to represent the marine microbial structure. It is, therefore, critical to make use of new methodologies combined with real data to assess the impacts of climate change on these sensitive pelagic microbiomes. Machine learning (ML) techniques enable the analysis of high-dimensional data, linking prediction and computational intelligence methods based on in situ measured data, which can be used to elucidate relationships between microorganisms and environmental factors, such as temperature (Yu and Liu, 2003; Bishop, 2006; Qu et al., 2019; Thompson et al., 2019). ML algorithms like random forest (RF) and neural networks were reported to be one of the most effective tools for analyzing microbiome data, with high accuracy in a range of 16S rRNA sequencing data (Liu et al., 2011; Larsen et al., 2012; Statnikov et al., 2013; Pasolli et al., 2016).
Here, we investigate the long-term sea surface temperature (SST) changes throughout the 21C, as simulated by CMIP6 projections (SSP1-2.6, SSP2-4.5, SSP3-7.0, and SSP5-8.5), as well as the response of microbial diversity and composition in the northwestern Antarctic Peninsula (NWAP) and the northwestern Weddell Sea (NWWS) using an RF model available from Python toolkit SciKit-Learn ML libraries.
Materials and Methods
Climate and Earth System Models
The World Climate Research Program coordinates the development of Climate and Earth System Models (ESM) by major modeling centers under the scope of the Coupled Model Intercomparison Project, now in its sixth phase (CMIP6; Eyring et al., 2016). CMIP6 models simulate the climate under different scenarios of future anthropogenic activity (Shared Socioeconomic Pathways–SSP) within the scope of an endorsed CMIP6 project named ScenarioMIP (O’Neill et al., 2016). These SSPs are built upon the same radiative forcing range previously used in CMIP5 (Taylor et al., 2012) described as Representative Concentration Pathways (RCP2.6, RCP4.5, RCP6.0, and RCP8.5), and named after a possible range of radiative forcing values in the year 2100: 2.6, 4.5, 7.0, and 8.5 W/m2, respectively (Meinshausen et al., 2011). The tier 1 SSPs are SSP1-2.6, SSP2-4.5, SSP3-7.0, and SSP5-8.5 (O’Neill et al., 2016).
The SSP narrative1 illustrates possible anthropogenic drivers of climate change over the 21C (departing from the historical runs), ranging from sustainable to fossil-fueled development (Riahi et al., 2017):
• SSP1–Sustainability–Taking the Green Road: Low challenges to mitigation and adaptation;
• SSP2–Middle of the Road: Medium challenges to mitigation and adaptation;
• SSP3–Regional Rivalry–A Rocky Road: High challenges to mitigation and adaptation;
• SSP4–Inequality–A Road Divided: Low challenges to mitigation, high challenges to adaptation;
• SSP5–Fossil-fueled Development–Taking the Highway: High challenges to mitigation, low challenges to adaptation.
Sea Surface Temperature Data
To quantify the projected changes in surface temperature over the Southern Ocean (SO), we computed the area-weighted SST annual means between 60°S and 80°S across four future scenarios, ranging from the more sustainable scenarios (SSP1-2.6 and SSP2-4.5) to high emissions trajectories (SSP3-7.0 and SSP5-8.5). The SST data were retrieved from the Earth System Grid Federation (ESGF2) CMIP6 archive (variable name “tos”; native grid “gn”). Monthly mean outputs from 18 ESM (Table 1) were available at the time of writing for the preindustrial control experiment (piControl) and four ScenarioMIP 21C projections: SSP1-2.6, SSP2-4.5, SSP3-7.0, and SSP5-8.5. CMIP6 models are usually run multiple times for each experiment. Here, one single run was used for each model (usually the variant named “r1i1p1f1”).
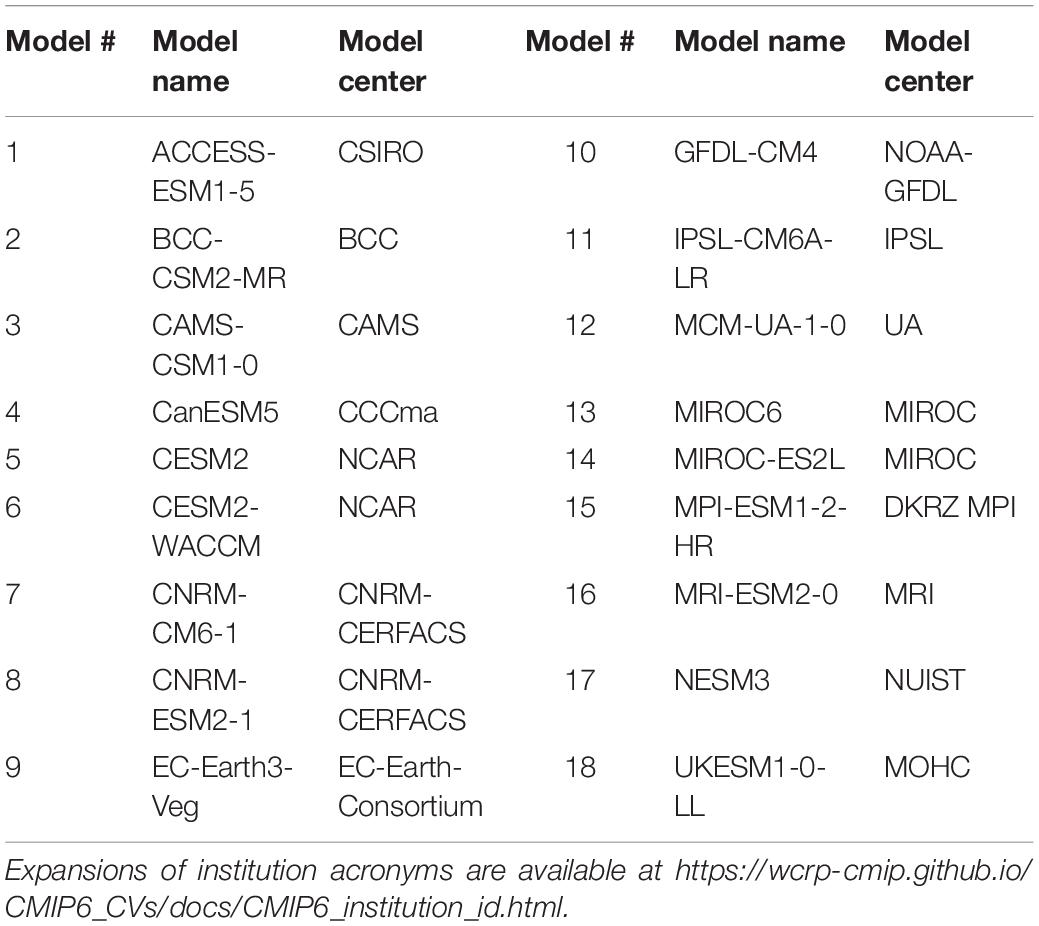
Table 1. List of models used in this study.
For consistency, the SST outputs from each model were firstly interpolated onto the same regular 360° × 180° grid using bilinear filtering with the same land-ocean mask, excluding the marginal seas and interior lakes like the Mediterranean Sea, Red Sea, Arabian Gulf, Black Sea, Caspian Sea, Baltic Sea, and Hudson Bay. The first-year annual mean (2015) is subtracted from each time series yielding the actual SST change over each SSP scenario projection. Although it has been suggested that model drift is negligible when considering multimodel means (Gupta et al., 2013), SST data were de-drifted based on each model piControl run to remove trends potentially caused by model equilibrium adjustment rather than by external forcing as in Ferrero et al. (2021).
Microbial Diversity Data
Microbial community datasets were obtained by our group from previously published studies (Signori et al., 2018; de Ferreira, 2019) under the Brazilian Antarctic Program, and comprised a total of 105 samples from surface waters (∼5 m depth) collected in the NWAP and NWWS. Sampling strategy and sample processing are detailed in Signori et al. (2018) and de Ferreira (2019). Briefly, approximately 3 L of seawater samples were filtered onto 0.22 μm-membrane SterivexTM filters using a peristaltic pump onboard the Brazilian polar vessel Almirante Maximiano (Signori et al., 2018) or at Comandante Ferraz Brazilian Antarctic Station (King George Island, Antarctica; de Ferreira, 2019). After filtration, samples were frozen at −20 or −80°C for molecular analysis. DNA extraction of SterivexTM filters was performed using the DNEasy Power Water Kit (Qiagen, Hilden, Germany), following manufacturing protocols, or according to specifications available in Signori et al. (2018). Total extracted DNA was then sequenced using an Illumina Miseq paired-end system 2 × 250 bp reads configuration, with the primers 515F (5′-GTGCCAGCMGCCGCGGTAA-3′) and 806R (5′-GGACTACHVGGGTWTCTAAT-3′; Caporaso et al., 2012), targeting the V4 region of the 16S rRNA gene for both Bacteria and Archaea. Reads are available in the NCBI database under the Bioproject IDs PRJNA383940 and PRJNA665033. The description of samples, coordinates, environmental temperatures, and NCBI Bioproject IDs are available in Supplementary Table 1.
We obtained a total of 8,538,820 reads distributed among the 105 water samples, which 5,968,201 were quality filtered and then analyzed with QIIME2 (Quantitative Insights into Microbial Ecology) and its plugins (Bolyen et al., 2019). Based on the quality scores observed using qiime demux summarize and the interactive quality plot, the forward reads were truncated at position 270, and the reverse reads at 200, using the q2-dada2-denoise script. This script uses DADA2 software to obtain a set of observed amplicon sequence variants (ASVs), as described by Callahan et al. (2016). Taxonomy was assigned through feature-classifier classify-sklearn using SILVA database v.132 with a confidence threshold of 0.7. Alpha diversity indices (Chao1 and Shannon) were calculated using the Phyloseq (McMurdie and Holmes, 2012) and vegan (Oksanen et al., 2020) packages in R (R Core Team, 2019). Shannon index is calculated based on the proportion of ASVs relative to the total number of ASVs and then multiplied by the natural logarithm of this proportion (Shannon, 1948), accounting for both the abundance and evenness of the ASVs. A map with the sampling regions is provided in Supplementary Figure 1.
Time of Emergence
The Time of Emergence (ToE) is defined as the time at which the signal of a forced response emerges from the noise of internal variability (Hawkins and Sutton, 2012), thus providing an indicator of the human-induced climate change for several climate variables (Chadwick et al., 2019). The ToE was computed for each model separately as the year when the SST time series at each grid point exceeds two standard deviations of the monthly mean SST from the piControl experiment, similar to previous studies (Hawkins and Sutton, 2012; Bordbar et al., 2015; Lyu et al., 2020; Ferrero et al., 2021). The results were averaged to obtain the 18-model mean ToE for each SSP future projection.
Machine Learning Predictions
The RF model used to predict microbial diversity and composition responding to SST in the NWAP and the NWWS consists of a supervised machine learning algorithm available from Python toolkit SciKit-Learn (Pedregosa et al., 2011). This ML model is a classifier that combines multiple decision trees, trains each one on a slightly different set of observations, and its final prediction accords to the voting on each decision tree (Svetnik et al., 2003; Chen et al., 2018).
The RF model was firstly trained with Chao1 and Shannon indices and observed SST from oceanographic stations in the NWAP and the NWWS. From a total of 105 samples, 80% were used to train the model (84 samples) and the remaining 20% (21 samples) were used to test it.
In practical terms, each sample provides one value of observed SST, one Chao1 index, and one Shannon index. These variables are sorted by temperature values ranging from −1.6 to 2.3°C interval. The RF model is trained separately for each index multiple times using the same SST input as the classifier for both indices, which represent the ML targets. To avoid overfitting, the dataset is randomly partitioned into subsets of 84 samples for training, while 21 samples are kept for testing. Once validated for both indices, the model is used to predict the spatial distribution of Chao1 and Shannon using area-weighted SST annual means outputs from the projected future scenarios. It should be noted that, from a centennial-scale climate change perspective, the entire study area is subject to roughly the same warming trends within each SSP, therefore, the long-term SST time series used in RF predictions differ only across SSPs.
A similar approach was used to perform the composition analysis, where the participation percentage of each microbial taxon identified within the sample community and the associated SST observation were used to train the RF model. The projected SST annual means for each SSP were used to predict the composition percentage of each taxon and the results were merged to provide a temporal evolution of the microbial community composition. All RF trained models reached the score range of 0.87–0.93, suggesting good accuracy.
Results and Discussion
Consistent with Bracegirdle et al. (2020), warming trends are projected to happen across all future climate scenarios, where higher human industrial activity leads to higher surface temperatures. The approximate SST change across these scenarios is ≈0.3, ≈0.7, ≈1.25, and ≈1.6°C between 2015 and 2100 (Figure 1). Variation within these scenarios increases throughout the second half of the 21C, particularly for the high forcing scenarios, mostly due to uncertainties arising from internal variability, model structural differences, and radiative forcing (Ferrero et al., 2021).
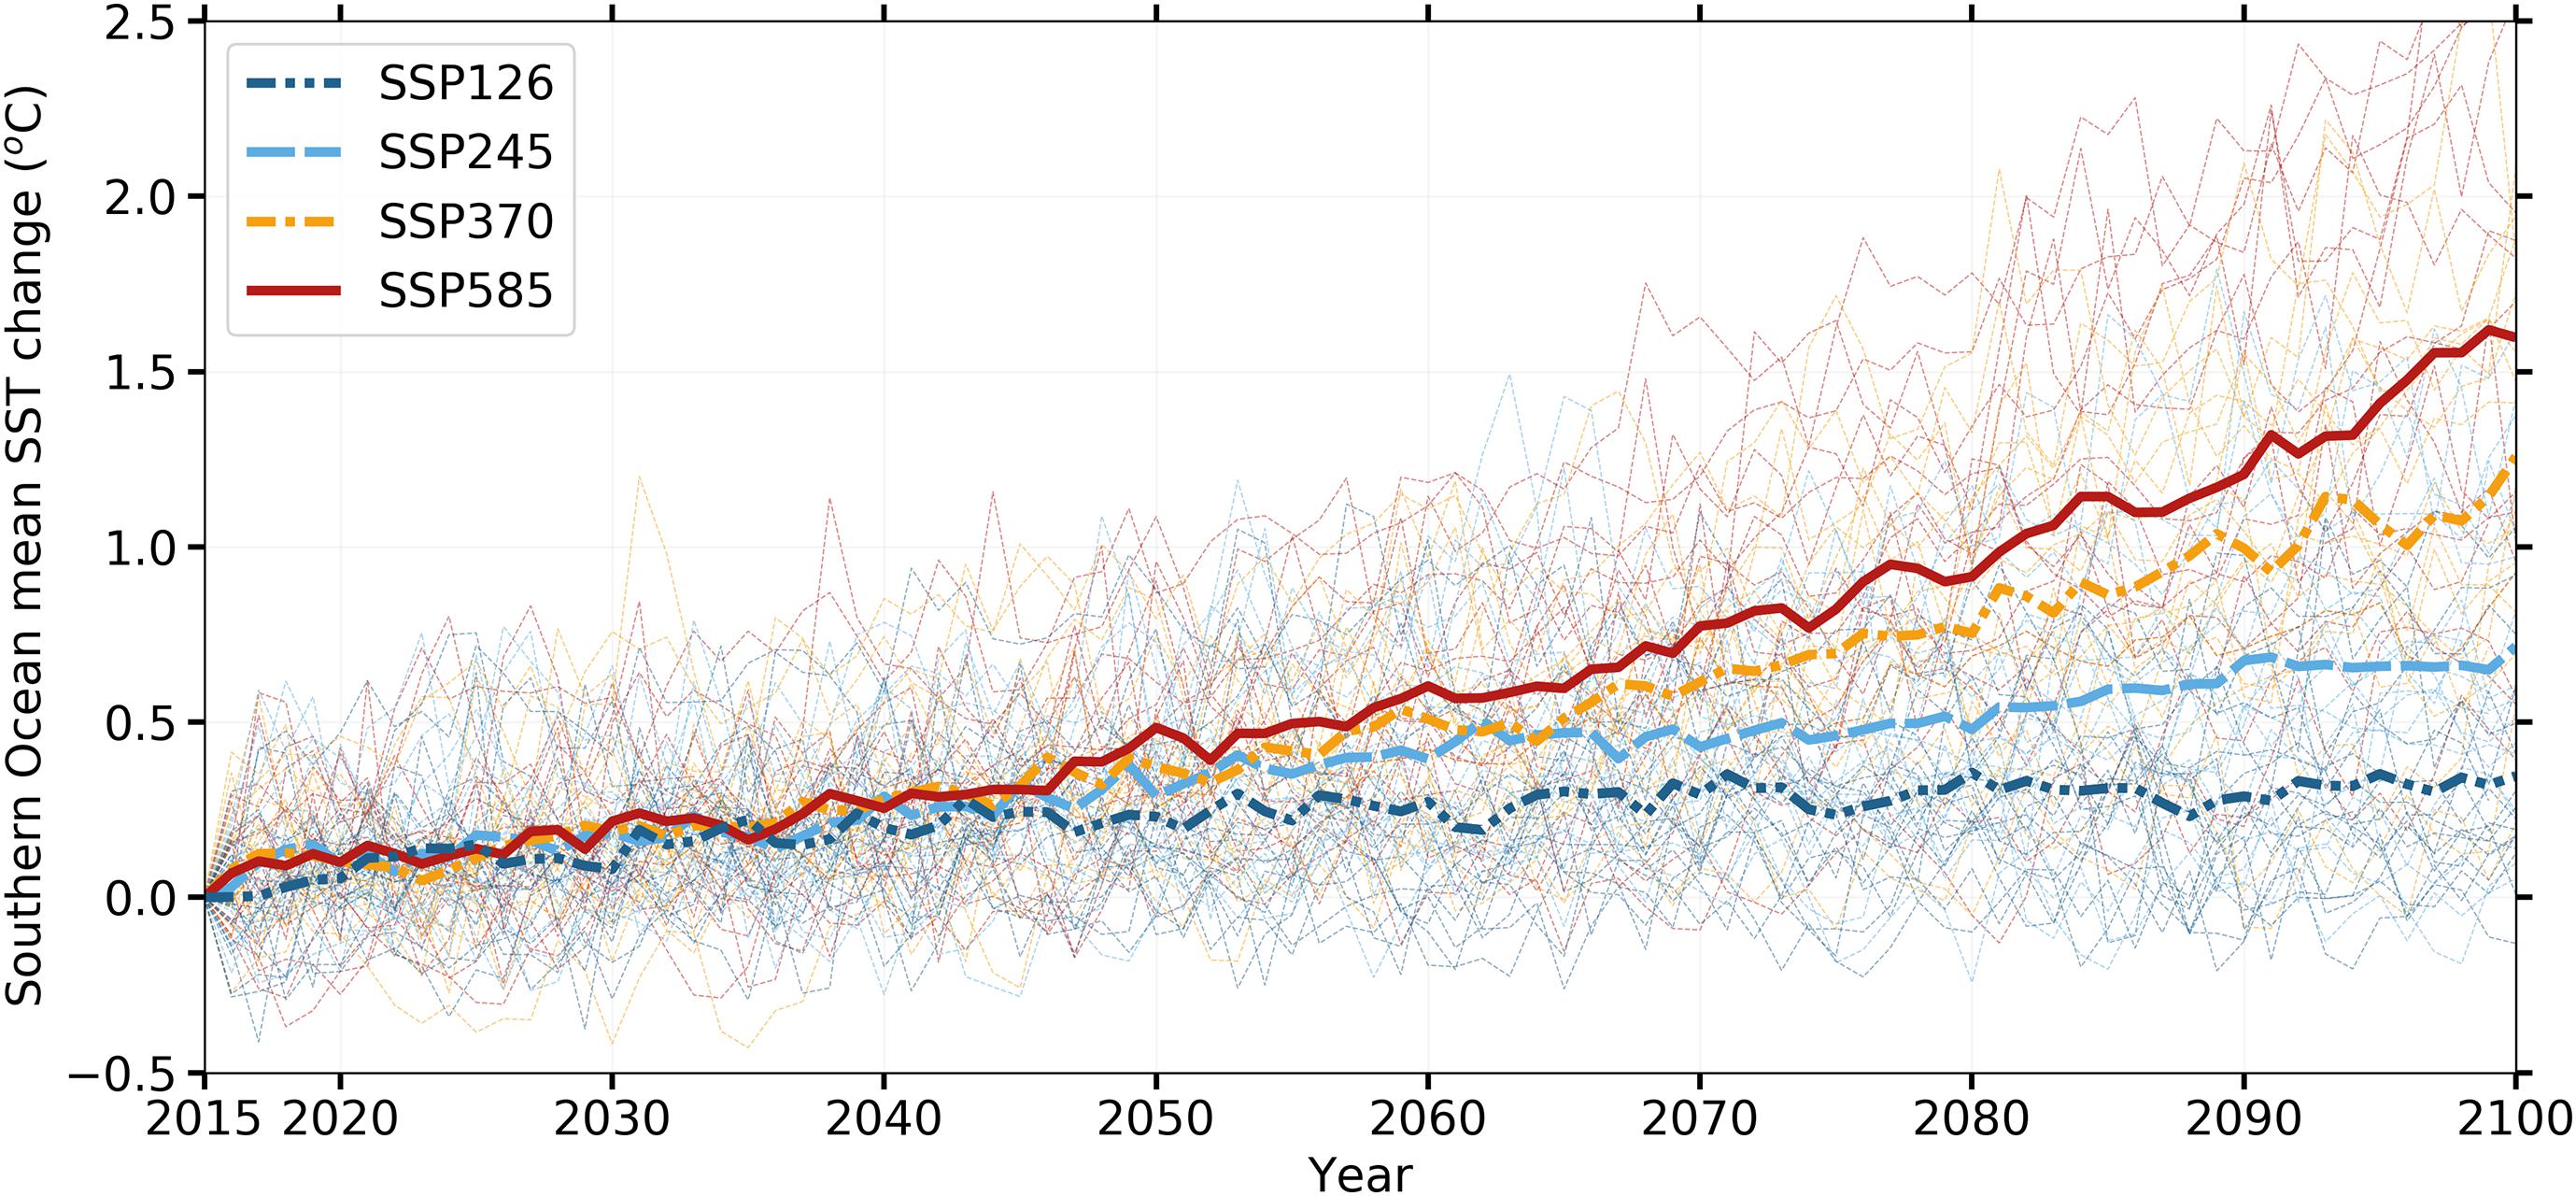
Figure 1. Absolute sea surface temperature (SST) change in the Southern Ocean (annual means of the area-weighted SST between 60°S and 80°S) relative to 2015 for future scenarios. Thin dashed lines indicate individual ensemble members and solid lines indicate ensemble means for each SSP projection.
Our SSP1-2.6 simulations project mild warming in the SO (Figure 1). Significant increases in SST are not expected to happen in the northwestern Antarctic Peninsula (NWAP) coast before 2080 nor until the end of the century in the northwestern Weddell Sea (NWWS; Figure 2A). This is particularly relevant to reassure the Weddell Sea (WS) ability to cushion the offshore warming signal advected by the Weddell Gyre (Ryan et al., 2016) due to the local dynamics and cryosphere-related processes (Fahrbach et al., 2011; Tonelli et al., 2019).
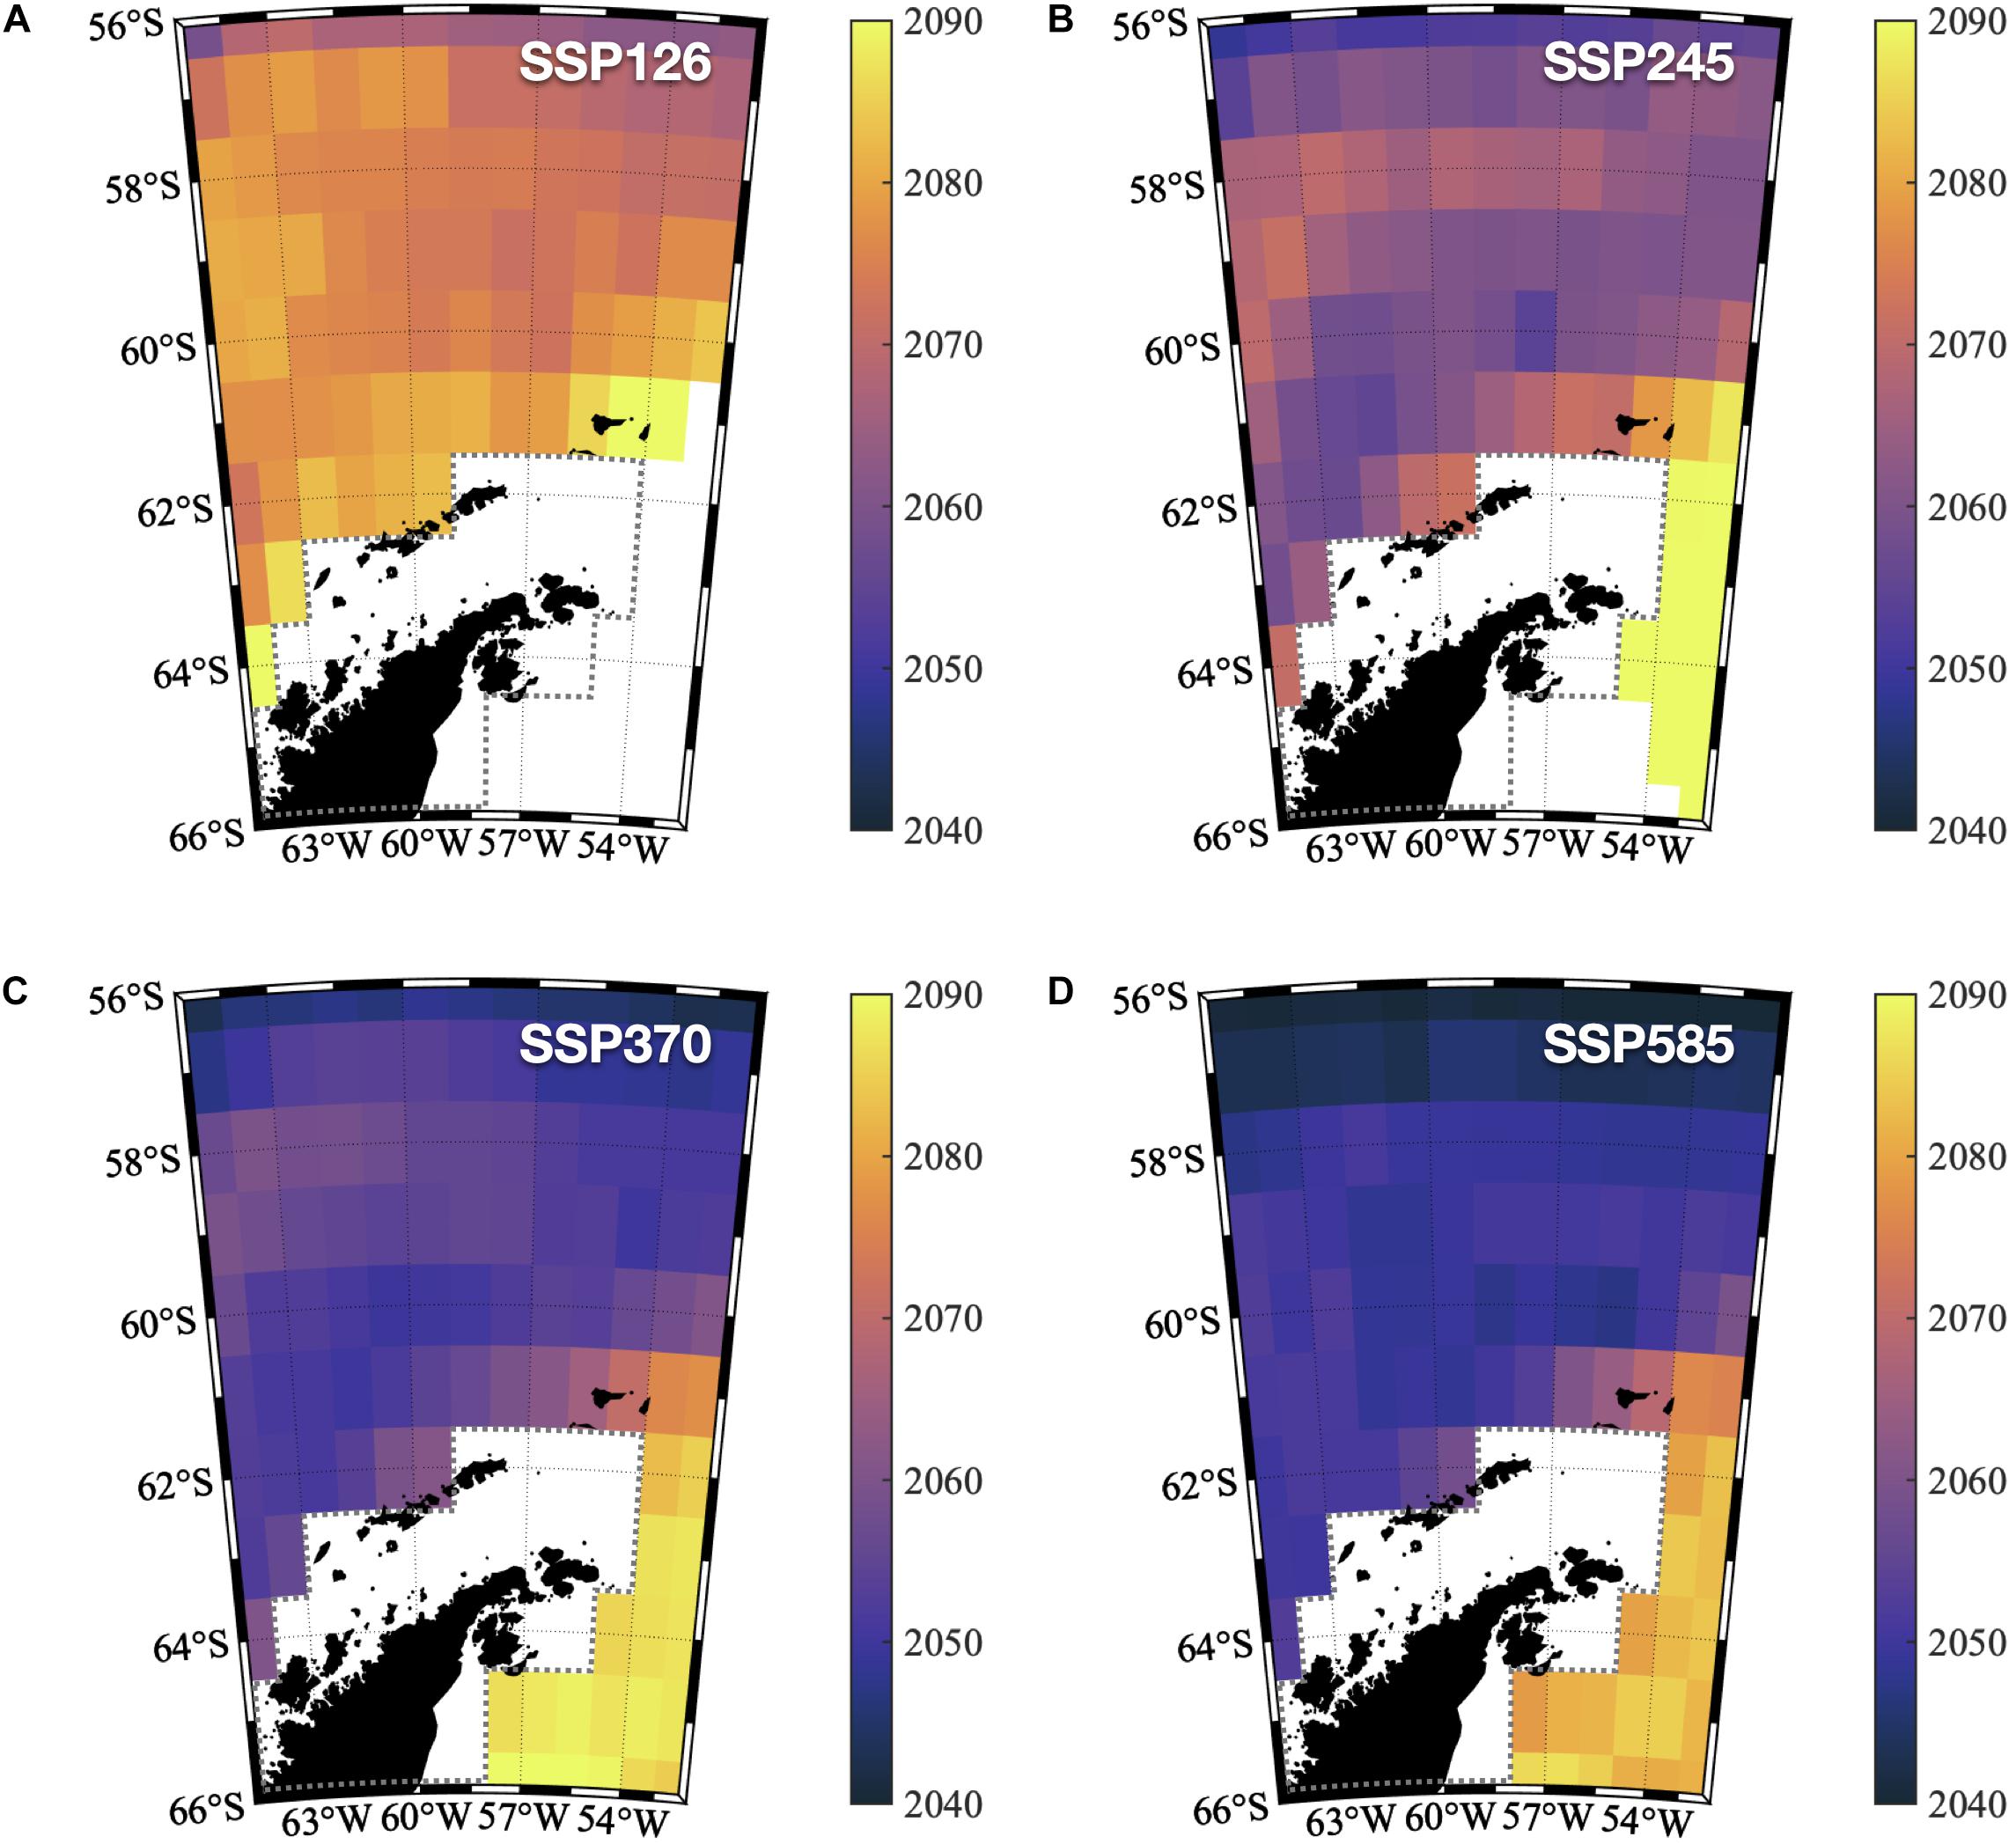
Figure 2. Sea surface temperature Time of Emergence around the Northwestern Antarctic Peninsula and the Northwestern Weddell Sea: the decade when the SST time-series at each grid point exceeds the range of internal variability (defined by two standard deviations of the monthly mean SST simulated in the piControl experiment). The illustrated time of emergence (ToE) corresponds to the averaged ToE from all 18 models. (A) SSP126. (B) SSP245. (C) SSP370. (D) SSP585.
The “Middle of the Road” outcome from SSP2-4.5 simulations indicates a slightly sooner emergence of the climate change signal across the NWAP, which is projected to take place during the 2060 decade (Figure 2B). Again, the NWWS is able to postpone the anthropogenic warming until the last decade of the 21C, with the inner WS still showing areas within the range of internal variability (≈65°S).
Due to greater environmental pressure, the results of SSP3-7.0 and SSP5-8.5 yielded even earlier ToE around the NWAP sea surface (Figures 2C,D). Close to coastal areas, rising SST exceeds the internal variability envelope in the early 2050 decade in these high forcing scenarios. And although the NWWS still exhibits a much later ToE compared to the NWAP, the human-induced warming is projected to reach the inner WS by the end of the 2070 decade based on SSP5-8.5 simulations. To assess the spatial variability of ToE, we have computed the horizontal anomalies with the mean ToE for each SSP (Supplementary Figure 2). This corroborates the understanding that the higher the anthropogenic footprint, the sooner the human-induced warming will emerge in the regions adjacent to the Antarctic Peninsula. Moreover, Supplementary Figure 2 highlights that this warming signal is expected to emerge much sooner across the NWAP compared to the NWWS. The more intensive and faster warming in the NWAP is caused by the Antarctic Circumpolar Current carrying well-mixed warmer waters much closer to the continent, which is consistent with studies that investigated the ocean and ice shelf dynamics along the West Antarctica Peninsula (Jacobs et al., 2011; Hellmer et al., 2012; Paolo et al., 2015; Zhang et al., 2016; Smith et al., 2020).
Our machine learning models indicate a decrease in both microbial communities’ richness and diversity within all climate projections, with higher emissions causing a more significant decrease in both indices, particularly under the most critical scenario SSP5-8.5 (Figure 3). Therefore, microbial communities might be highly impacted by increasing temperatures, corroborating the observed trend for phytoplankton (Thomas et al., 2012) and prokaryotic communities from a mesocosm experiment in the Baltic Sea (Lindh et al., 2013). Also, SSP1-2.6 and SSP5-8.5 yielded contrasting predictions for microbial composition (Figure 4). Whilst the low emission scenario projected small changes in the relative abundance of microorganisms, the three scenarios with the highest increase in temperature, including the “middle of the road” scenario, show changes in microbial communities’ structure, including the loss of diversity and decrease in microbial taxa that are important contributors to the biogeochemical processes and ecosystem functioning in the NWAP and NWWS. In general, the heterotrophic Flavobacteriales are projected to have higher relative abundances, while the sulfur-oxidizing Thiomicrospirales, the ammonia-oxidizing Archaea within Nitrosopumilales, and the planktonic euryarchaeotal Marine Group II have reduced relative abundance. These orders are composed of several species with important roles in the functioning of pelagic ecosystems, including the sulfur, nitrogen, and carbon cycles, and are currently described as abundant taxa in the SO (Signori et al., 2014; Zhang et al., 2015; Liu et al., 2019). For instance, Nitrosopumilales members are important contributors to nitrogen remineralization and carbon fixation, and are often the most abundant taxa in cold waters, including the euphotic and aphotic zones of the SO (Signori et al., 2014; Cheung et al., 2019).
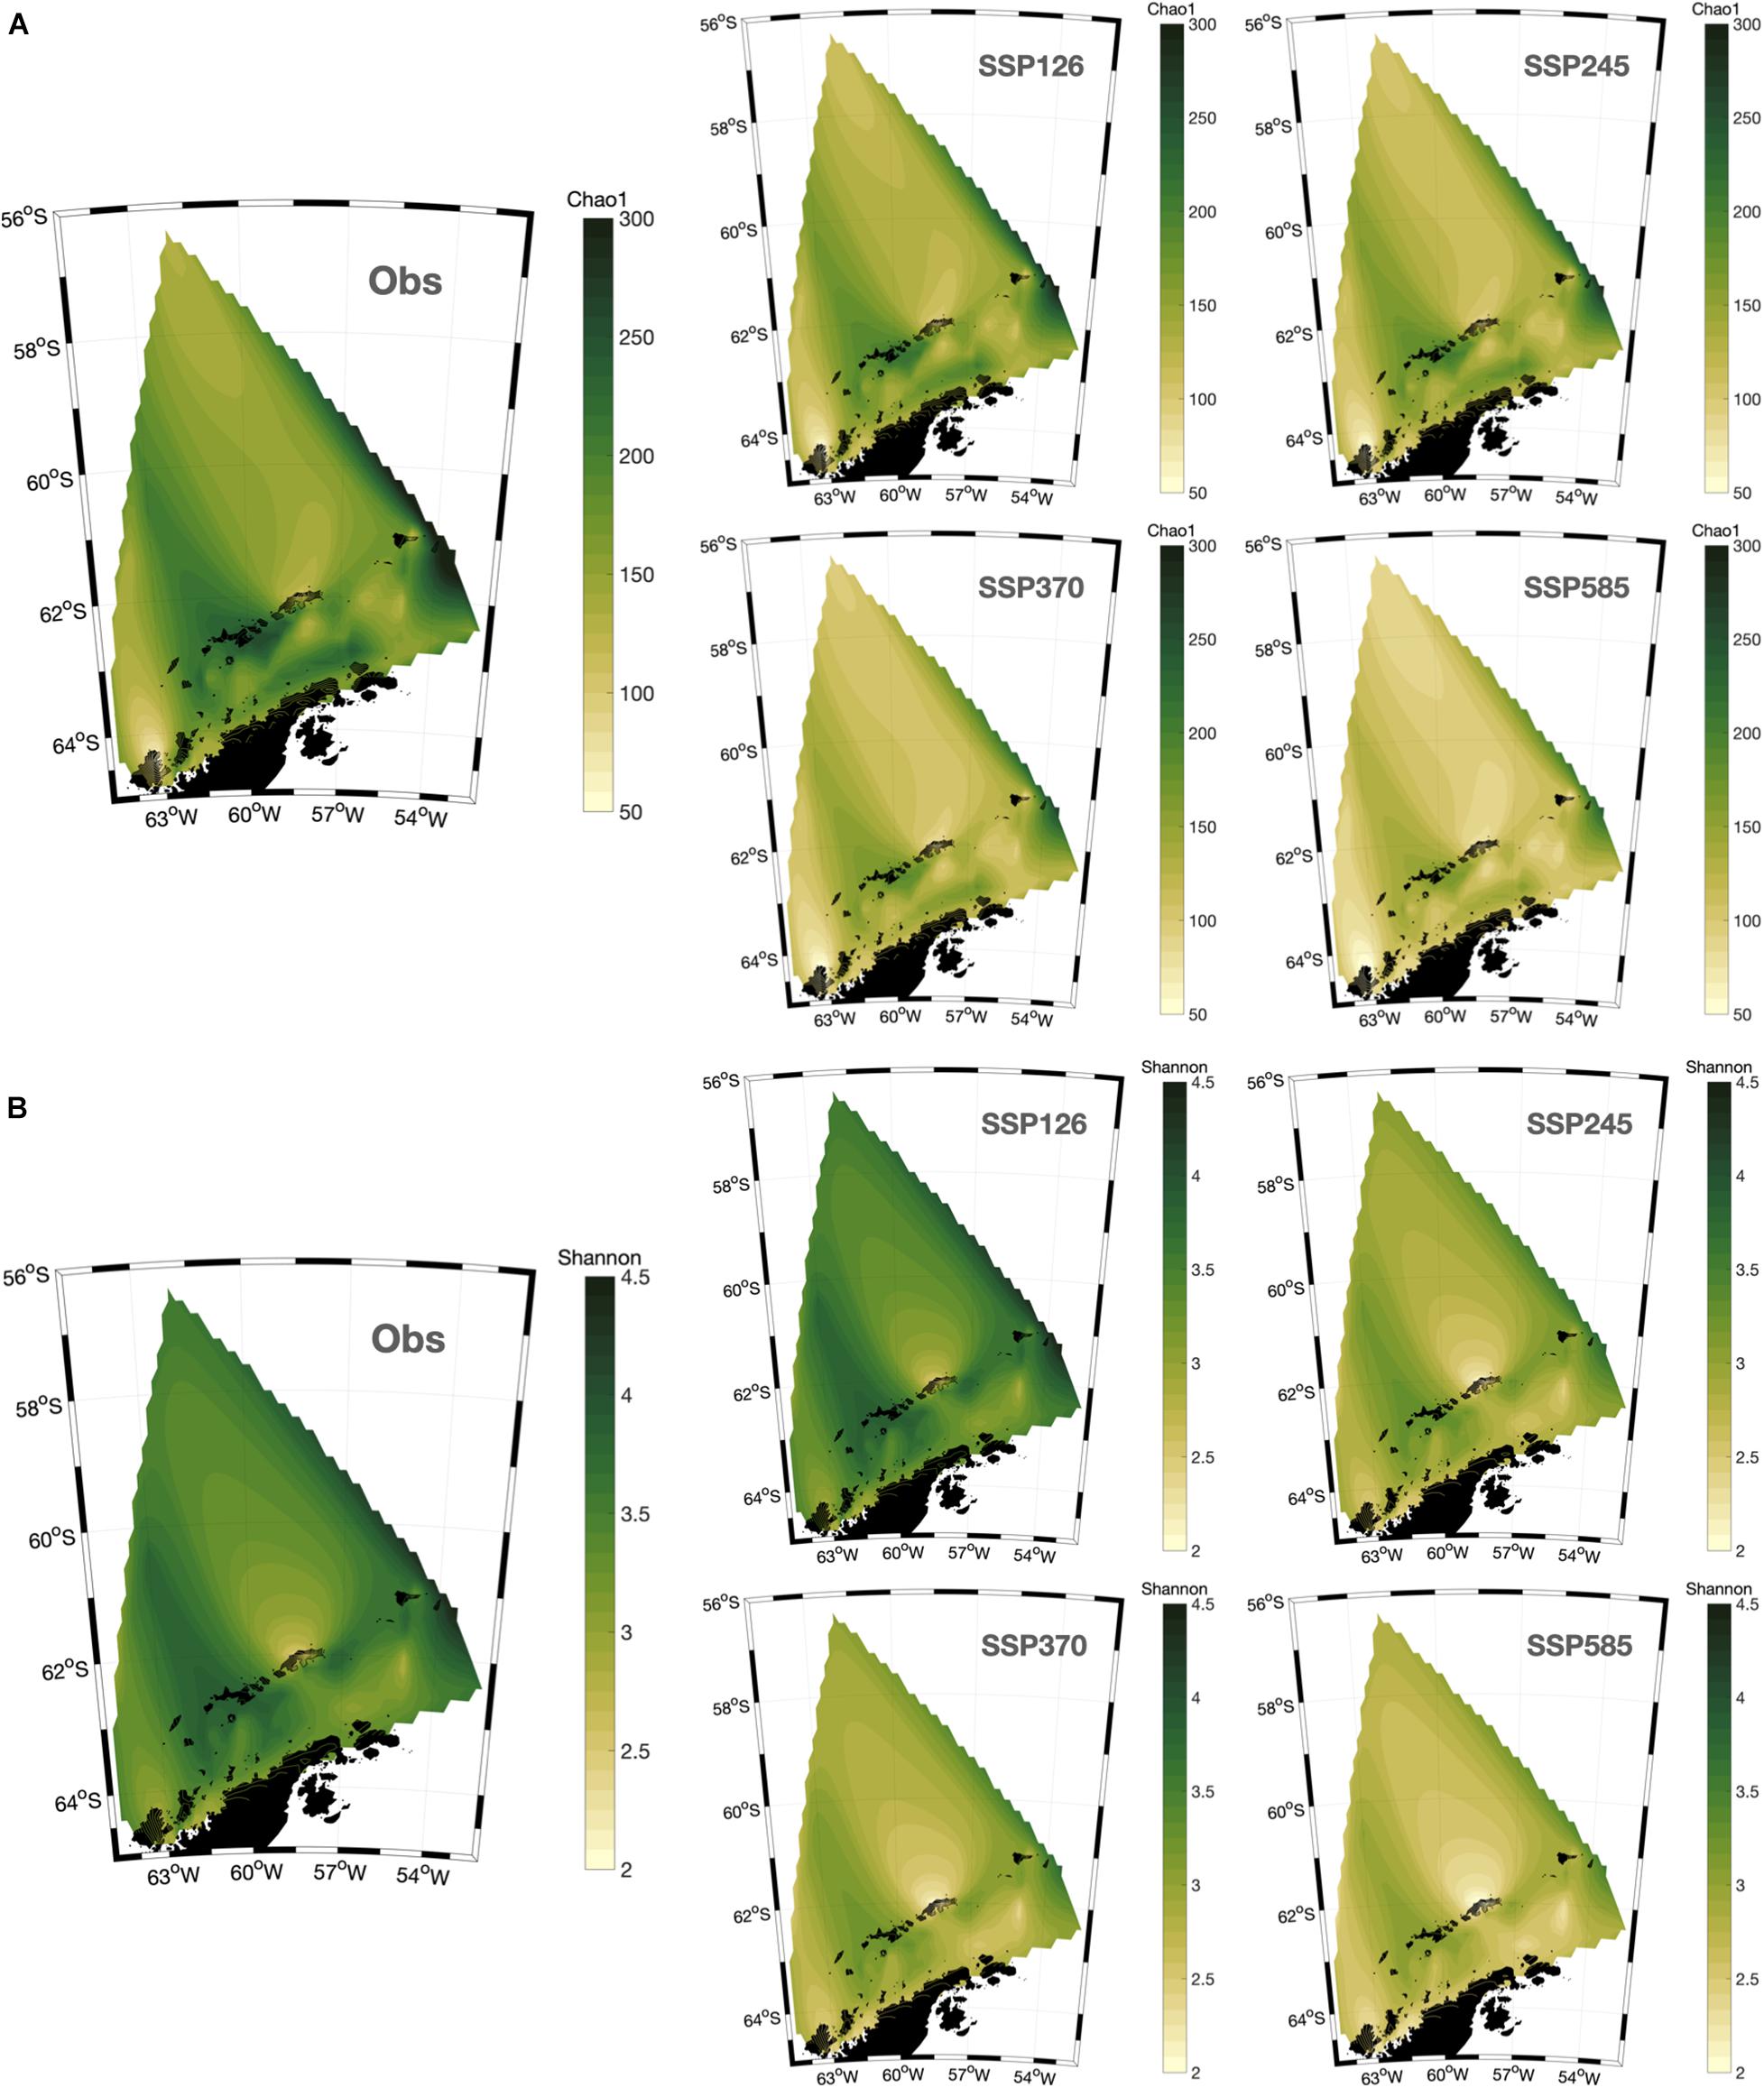
Figure 3. Spatial distribution of observed (Obs) and machine learning projected (SSPs) microbial alpha diversity indices Chao1 (A) and Shannon (B) around the Northwestern Antarctic Peninsula.
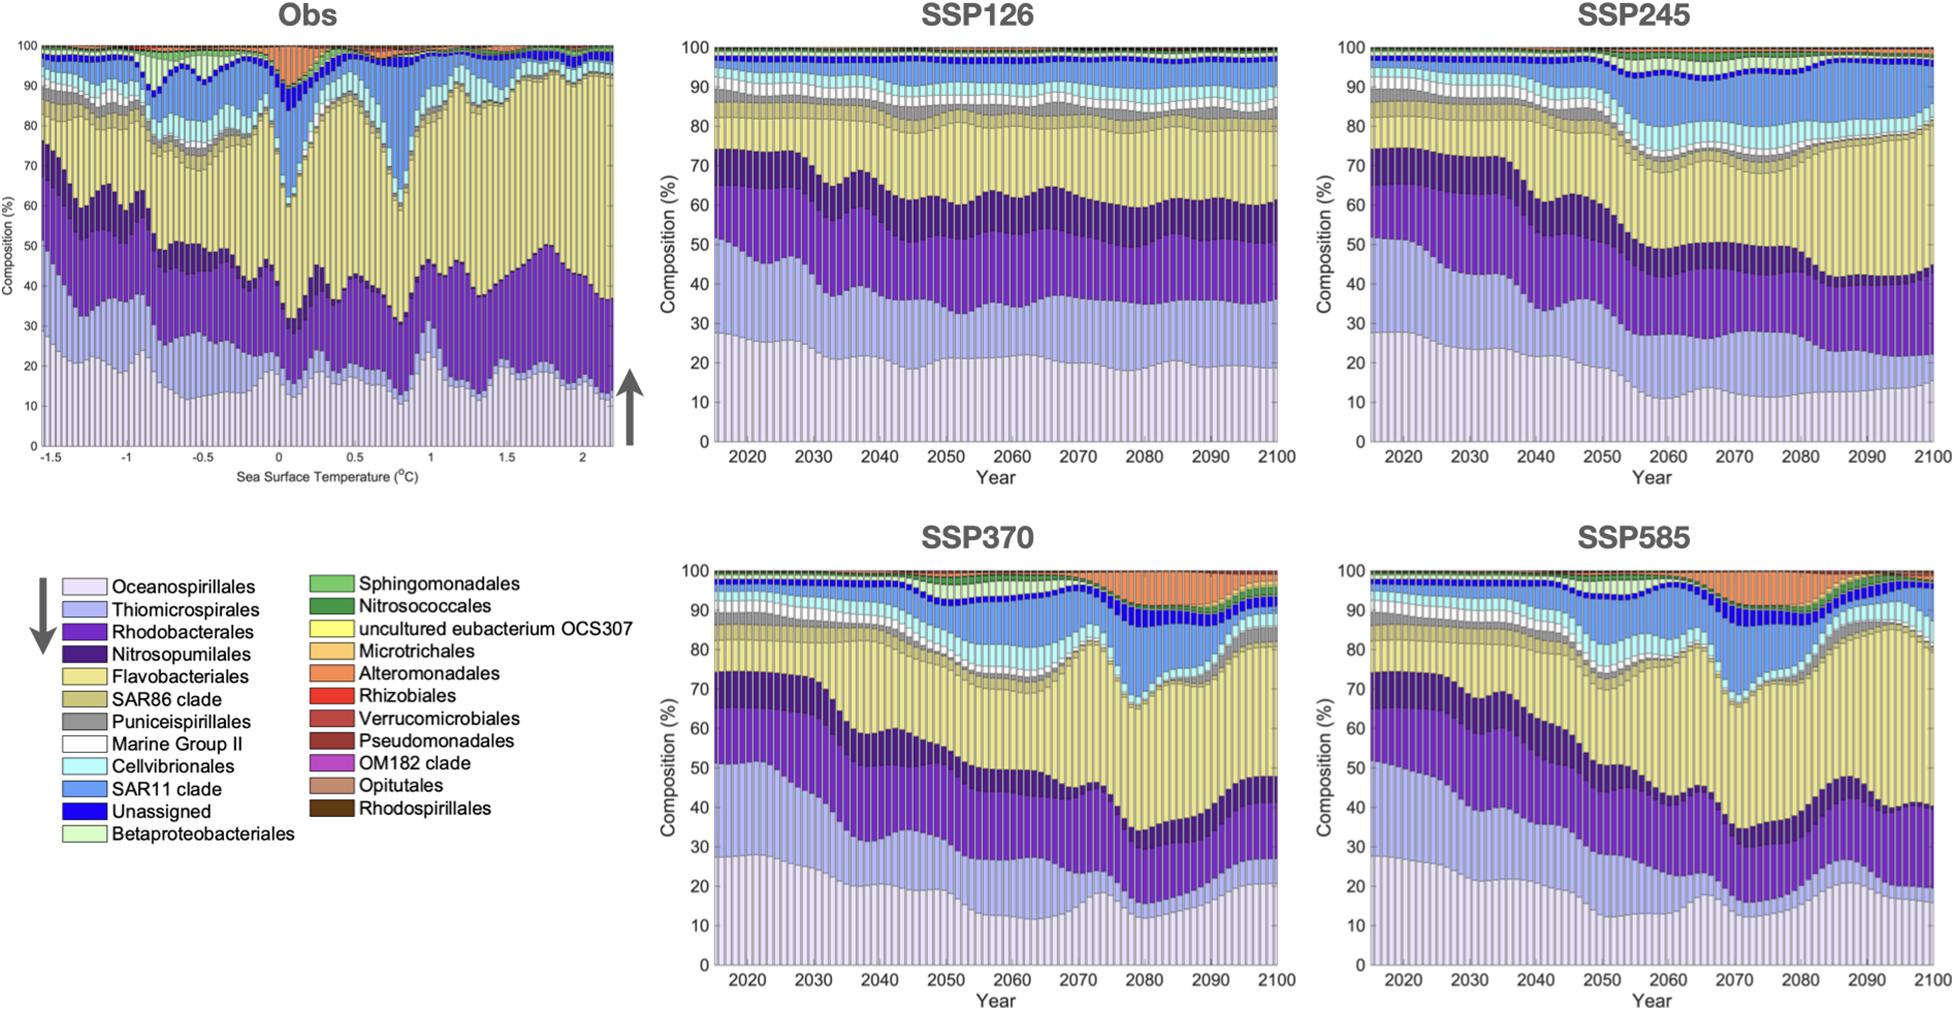
Figure 4. Histogram representing the microbial composition (%) at the order level for the observations sorted by SST (Obs). The SSPs histograms are sorted by years of projection (as in Figure 1) to illustrate the temporal evolution of the bacterial and archaeal community composition. Only taxa with relative abundance above 1% are presented.
The implications of a decrease in ammonia oxidation in the pelagic ecosystems are still unclear, but some modeling studies have indicated that it might affect nutrient stoichiometry, denitrification, marine productivity, and the biological carbon pump (Beman et al., 2011; Kitidis et al., 2011). Members of the Marine Group II have not yet been cultured and their lifestyles are still not well known. The information obtained through the reconstruction of genomes from metagenomic data showed a photoheterotrophic lifestyle inferred by the presence of proteorhodopsin genes (Pereira et al., 2019). Some studies have suggested that photoheterotrophy contributes to biomass accumulation in oligotrophic waters, and a loss in this metabolism would potentially affect nutrients uptake by the pelagic communities (Evans et al., 2015). Furthermore, a decrease in Thiomicrospirales populations would affect the oxidation of sulfur compounds, which has been described as an important process that contributes to protecting marine ecosystems from sulfide toxicity in coastal areas (Hu et al., 2018). However, the importance of sulfur oxidation in the functioning of the SO ecosystem is still unknown.
Microbes respond to changes in light, temperature, metabolites, and other environmental factors, making them good candidates for monitoring both short- and long-term ecological variations (Hanson et al., 2012; Zinger et al., 2014; Brum et al., 2015; Turner et al., 2016; Baker-Austin and Oliver, 2018; Buttigieg et al., 2018). Climate change affects interactions between species and forces them to adapt, migrate, and even be replaced by others (Hoffmann and Sgrò, 2011; Hutchins and Fu, 2017). Understanding how well microorganisms are adapted to environmental factors, such as temperature, and predicting how well they will respond to warming is essential to elucidate ecological adaptation of these organisms (Cavicchioli, 2016).
In this work, we were able to project future changes of microbial community structure and a diversity decrease for NWAP and NWWS, according to the SSP climate change scenarios. The ML prediction showed a trend of decreasing important bacterial and archaeal taxa involved with crucial biogeochemical processes, such as Nitrosopumilales, Marine Group II, and Thiomicrospirales, and an increase of heterotrophic groups, such as Flavobacteriales. In other words, regardless of when the forced signal emerges from the internal variability, temperature changes are seen to modulate the dynamics of the Southern Ocean marine microbial community.
Conclusion
This investigation delivers an assessment of 21C projected changes in SST over the SO in the four Tier-1 CMIP6 ScenarioMIP scenarios: SSP1-2.6, SSP2-4.5, SSP3-7.0, and SSP5-8.5. A multimodel mean of 18 ESMs projects approximate warming across these scenarios of ≈0.3, ≈0.7, ≈1.25, and ≈1.6°C, respectively, between 2015 and 2100. ToE analyses suggest delayed warming across the NWAP in the lower socioeconomic pressure scenarios, i.e., SSP1-2.6 and SSP2-4.5, compared to projections based on high forcing pathways (SSP3-7.0 and SSP5-8.5).
In response to SSP scenarios, our predicted results showed that the impacts of high latitude climate change on pelagic microbial communities vary across future projections and mainly indicate a loss of bacterial and archaeal diversity in surface waters. However, it should be noted that even though the use of machine learning is growing in microbial ecology studies, it remains a predictive tool whose interpretation needs to be done carefully (Lucas, 2020). To our knowledge, this is the first study to predict the effect of long-term climate changes of SST on microbial diversity in the SO. In addition, our results show a trend of decreasing important bacterial and archaeal taxa involved with crucial biogeochemical processes, such as Nitrosopumilales, Marine Group II, and Thiomicrospirales, and an increase of heterotrophic groups, such as Flavobacteriales. We suggest that these microorganisms can be applied as potential models in future marine studies, to validate our prediction and to create new hypotheses regarding the response of these microbial taxa under the increasing temperatures predicted by the SSP scenarios.
Data Availability Statement
The original contributions presented in the study are included in the article/Supplementary Material, further inquiries can be directed to the corresponding author.
Author Contributions
We apply Time of Emergence analysis and machine learning models (ML), and 16S rRNA sequencing data, to investigate the long-term changes in the SST throughout the twenty first century in the Southern Ocean (SO), as projected by CMIP6 Earth System Models simulations (SSP1-2.6, SSP2-4.5, SSP3-7.0, and SSP5-8.5), and the microbial diversity responses to increasing temperature in the northwestern Antarctic Peninsula. The high emissions scenarios projected a much sooner emergence of the human-induced temperature change throughout the SO. Based on ML predictions, the impacts on Antarctic marine diversity of bacteria and archaea are expected to be significant and persistent by the late twenty first century, especially within the higher end of the range of future forcing pathways. All authors contributed to the article and approved the submitted version.
Funding
Grants CNPq/MCTIC/CAPES/FNDCT EcoPelagos Process 442637/2018-7, CNPq-MCT-INCT-594 CRIOSFERA 573720/2008-8, CNPq-MICROSFERA 407816/2013-5 and Coordenação de Aperfeiçoamento de Pessoal de Nível Superior-Brasil (CAPES)-Finance Code 001, FAPESP 2018/14789-9, and FAPESP 2012/23241-0.
Conflict of Interest
The authors declare that the research was conducted in the absence of any commercial or financial relationships that could be construed as a potential conflict of interest.
Acknowledgments
We acknowledge the World Climate Research Program, which, its Working Group on Coupled Modeling, coordinated and promoted CMIP6. We thank the climate modeling groups for producing and making available their model output, the Earth System Grid Federation (ESGF) for archiving the data and providing access, and the multiple funding agencies that support CMIP6 and ESGF. We also thank the Brazilian Antarctic Program (PROANTAR), the captains of Npo. Almirante Maximinao and their respective crews of OPERANTAR XXXII and XXXIII; the Brazilian High Latitude Oceanography Group (GOAL) and our colleagues onboard for their help in sampling and data acquisition; and Ivan G. de C. Ferreira for MICROSFERA’s data. The content of this manuscript has been presented in part at the SCAR 2020 OSC Online, Session 7–Southern Ocean Circulation: change and consequences, ISBN: 978-0-948277-59-7.
Supplementary Material
The Supplementary Material for this article can be found online at: https://www.frontiersin.org/articles/10.3389/fmars.2021.636226/full#supplementary-material
Footnotes
- ^ For a comprehensive description of the SSPs the reader is referred to Riahi et al. (2017).
- ^ For a comprehensive description of the SSPs the reader is referred to Riahi et al. (2017).
References
Abraham, J. P., Baringer, M., Bindoff, N. L., Boyer, T., Cheng, L. J., Church, J. A., et al. (2013). A review of global ocean temperature observations: implications for ocean heat content estimates and climate change. Rev. Geophys. 51, 450–483. doi: 10.1002/rog.20022
Arrigo, K. R. (2005). Marine microorganisms and global nutrient cycles. Nature 437, 349–355. doi: 10.1038/nature04159
Baker-Austin, C., and Oliver, J. D. (2018). Vibrio vulnificus: new insights into a deadly opportunistic pathogen. Environ. Microbiol. 20, 423–430. doi: 10.1111/1462-2920.13955
Barnett, T. P., Pierce, D. W., AchutaRao, K. M., Gleckler, P. J., Santer, B. D., Gregory, J. M., et al. (2005). Penetration of human-induced warming into the world’s oceans. Science 309, 284–287. doi: 10.1126/science.1112418
Beman, J. M., Chow, C.-E., King, A. L., Feng, Y., Fuhrman, J. A., Andersson, A., et al. (2011). Global declines in oceanic nitrification rates as a consequence of ocean acidification. PNAS 108, 208–213. doi: 10.1073/pnas.1011053108
Bilbao, R. A. F., Gregory, J. M., Bouttes, N., Palmer, M. D., and Stott, P. (2019). Attribution of ocean temperature change to anthropogenic and natural forcings using the temporal, vertical and geographical structure. Clim. Dyn. 53, 5389–5413. doi: 10.1007/s00382-019-04910-1
Bishop, C. (2006). Pattern Recognition and Machine Learning, Information Science and Statistics. New York: Springer-Verlag.
Bolyen, E., Rideout, J. R., Dillon, M. R., Bokulich, N. A., Abnet, C. C., Al-Ghalith, G. A., et al. (2019). Reproducible, interactive, scalable and extensible microbiome data science using QIIME 2. Nat. Biotechnol. 37, 852–857. doi: 10.1038/s41587-019-0209-9
Bordbar, M. H., Martin, T., Latif, M., and Park, W. (2015). Effects of long-term variability on projections of twenty-first century dynamic sea level. Nat. Climate Change 5, 343–347. doi: 10.1038/nclimate2569
Bracegirdle, T. J., Krinner, G., Tonelli, M., Haumann, F. A., Naughten, K. A., Rackow, T., et al. (2020). Twenty first century changes in Antarctic and Southern Ocean surface climate in CMIP6. Atmospheric Sci. Lett. 21:e984. doi: 10.1002/asl.984
Brum, J. R., Ignacio-Espinoza, J. C., Roux, S., Doulcier, G., Acinas, S. G., Alberti, A., et al. (2015). Patterns and ecological drivers of ocean viral communities. Science 348:1261498. doi: 10.1126/science.1261498
Buttigieg, P. L., Fadeev, E., Bienhold, C., Hehemann, L., Offre, P., and Boetius, A. (2018). Marine microbes in 4D-using time series observation to assess the dynamics of the ocean microbiome and its links to ocean health. Curr. Opin. Microbiol. 43, 169–185. doi: 10.1016/j.mib.2018.01.015
Callahan, B. J., McMurdie, P. J., Rosen, M. J., Han, A. W., Johnson, A. J. A., and Holmes, S. P. (2016). DADA2: high-resolution sample inference from Illumina amplicon data. Nat. Methods 13, 581–583. doi: 10.1038/nmeth.3869
Caporaso, J. G., Lauber, C. L., Walters, W. A., Berg-Lyons, D., Huntley, J., Fierer, N., et al. (2012). Ultra-high-throughput microbial community analysis on the Illumina HiSeq and MiSeq platforms. ISME J. 6, 1621–1624. doi: 10.1038/ismej.2012.8
Cavan, E. L., Henson, S. A., and Boyd, P. W. (2019). The sensitivity of subsurface microbes to ocean warming accentuates future declines in particulate carbon export. Front. Ecol. Evol. 6:230. doi: 10.3389/fevo.2018.00230
Cavicchioli, R. (2015). Microbial ecology of Antarctic aquatic systems. Nat. Rev. Microbiol. 13, 691–706. doi: 10.1038/nrmicro3549
Cavicchioli, R. (2016). On the concept of a psychrophile. ISME J. 10, 793–795. doi: 10.1038/ismej.2015.160
Cavicchioli, R., Ripple, W. J., Timmis, K. N., Azam, F., Bakken, L. R., Baylis, M., et al. (2019). Scientists’ warning to humanity: microorganisms and climate change. Nat. Rev. Microbiol. 17, 569–586. doi: 10.1038/s41579-019-0222-5
Chadwick, C., Gironás, J., Vicuñ, S., and Meza, F. (2019). Estimating the local time of emergence of climatic variables using an unbiased mapping of GCMs: an application in semiarid and mediterranean chile. J. Hydrometeorol. 20, 1635–1647. doi: 10.1175/JHM-D-19-0006.1
Chen, X., Wang, C.-C., Yin, J., and You, Z.-H. (2018). Novel human miRNA-disease association inference based on random forest. Mol. Therapy - Nucleic Acids 13, 568–579. doi: 10.1016/j.omtn.2018.10.005
Cheung, S., Mak, W., Xia, X., Lu, Y., Cheung, Y., and Liu, H. (2019). Overlooked genetic diversity of ammonia oxidizing archaea lineages in the global oceans. J. Geophys. Res. Biogeosci. 124, 1799–1811. doi: 10.1029/2018JG004636
Collins, S., Rost, B., and Rynearson, T. A. (2014). Evolutionary potential of marine phytoplankton under ocean acidification. Evol. Appl. 7, 140–155. doi: 10.1111/eva.12120
Cripps, G., Lindeque, P., and Flynn, K. J. (2014). Have we been underestimating the effects of ocean acidification in zooplankton? Global Change Biol. 20, 3377–3385. doi: 10.1111/gcb.12582
de Ferreira, I. G. C. (2019). Caracterização da Microbiota Marinha Sob Influência do Degelo Glacial na Baía do Almirantado, Antártica (text). São Paulo: Universidade de São Paulo, doi: 10.11606/D.21.2020.tde-30012020-154852
Doblin, M. A., and van Sebille, E. (2016). Drift in ocean currents impacts intergenerational microbial exposure to temperature. PNAS 113, 5700–5705. doi: 10.1073/pnas.1521093113
Evans, C., Gómez-Pereira, P. R., Martin, A. P., Scanlan, D. J., and Zubkov, M. V. (2015). Photoheterotrophy of bacterioplankton is ubiquitous in the surface oligotrophic ocean. Prog. Oceanography 135, 139–145. doi: 10.1016/j.pocean.2015.04.014
Eyring, V., Bony, S., Meehl, G. A., Senior, C. A., Stevens, B., Stouffer, R. J., et al. (2016). Overview of the coupled model intercomparison project phase 6 (CMIP6) experimental design and organization. Geosci. Model Dev. 9, 1937–1958. doi: 10.5194/gmd-9-1937-2016
Fahrbach, E., Hoppema, M., Rohardt, G., Boebel, O., Klatt, O., and Wisotzki, A. (2011). Warming of deep and abyssal water masses along the Greenwich meridian on decadal time scales: the weddell gyre as a heat buffer. Deep Sea Res. Part II: Top. Stud. Oceanography 58, 2509–2523. doi: 10.1016/j.dsr2.2011.06.007
Fan, T., Deser, C., and Schneider, D. P. (2014). Recent Antarctic sea ice trends in the context of Southern Ocean surface climate variations since 1950. Geophys. Res. Lett. 41, 2419–2426. doi: 10.1002/2014GL059239
Ferrero, B., Tonelli, M., Marcello, F., and Wainer, I. (2021). Long-term regional dynamic sea level changes from CMIP6 projections. Adv. Atmos. Sci. 38, 157–167. doi: 10.1007/s00376-020-0178-4
Gille, S. T. (2002). Warming of the Southern Ocean since the 1950s. Science 295, 1275–1277. doi: 10.1126/science.1065863
Gille, S. T. (2008). Decadal-Scale temperature trends in the Southern Hemisphere Ocean. J. Climate 21, 4749–4765. doi: 10.1175/2008JCLI2131.1
Gleckler, P. J., Santer, B. D., Domingues, C. M., Pierce, D. W., Barnett, T. P., Church, J. A., et al. (2012). Human-induced global ocean warming on multidecadal timescales. Nat. Climate Change 2, 524–529. doi: 10.1038/nclimate1553
Gupta, A. S., Jourdain, N. C., Brown, J. N., and Monselesan, D. (2013). Climate drift in the CMIP5 models. J. Climate 26, 8597–8615. doi: 10.1175/JCLI-D-12-00521.1
Hanson, C. A., Fuhrman, J. A., Horner-Devine, M. C., and Martiny, J. B. H. (2012). Beyond biogeographic patterns: processes shaping the microbial landscape. Nat. Rev. Microbiol. 10, 497–506. doi: 10.1038/nrmicro2795
Hawkins, E., and Sutton, R. (2012). Time of emergence of climate signals. Geophys. Res. Lett. 39:L01702. doi: 10.1029/2011GL050087
Hellmer, H. H., Kauker, F., Timmermann, R., Determann, J., and Rae, J. (2012). Twenty-first-century warming of a large Antarctic ice-shelf cavity by a redirected coastal current. Nature 485, 225–228. doi: 10.1038/nature11064
Hellweger, F. L., van Sebille, E., and Fredrick, N. D. (2014). Biogeographic patterns in ocean microbes emerge in a neutral agent-based model. Science 345, 1346–1349. doi: 10.1126/science.1254421
Heuzé, C., Heywood, K. J., Stevens, D. P., and Ridley, J. K. (2013). Southern Ocean bottom water characteristics in CMIP5 models. Geophys. Res. Lett. 40, 1409–1414. doi: 10.1002/grl.50287
Hoffmann, A. A., and Sgrò, C. M. (2011). Climate change and evolutionary adaptation. Nature 470, 479–485. doi: 10.1038/nature09670
Hu, X., Liu, J., Liu, H., Zhuang, G., and Xun, L. (2018). Sulfur metabolism by marine heterotrophic bacteria involved in sulfur cycling in the ocean. Sci. China Earth Sci. 61, 1369–1378. doi: 10.1007/s11430-017-9234-x
Hutchins, D. A., and Fu, F. (2017). Microorganisms and ocean global change. Nat. Microbiol. 2:17058. doi: 10.1038/nmicrobiol.2017.58
Ishii, M., and Kimoto, M. (2009). Reevaluation of historical ocean heat content variations with time-varying XBT and MBT depth bias corrections. J. Oceanogr. 65, 287–299. doi: 10.1007/s10872-009-0027-7
Jacobs, S. S., Jenkins, A., Giulivi, C. F., and Dutrieux, P. (2011). Stronger ocean circulation and increased melting under Pine Island Glacier ice shelf. Nat. Geosci. 4, 519–523. doi: 10.1038/ngeo1188
Kitidis, V., Laverock, B., McNeill, L. C., Beesley, A., Cummings, D., Tait, K., et al. (2011). Impact of ocean acidification on benthic and water column ammonia oxidation. Geophys. Res. Lett. 38:L21603. doi: 10.1029/2011GL049095
Kroeker, K. J., Kordas, R. L., Crim, R. N., and Singh, G. G. (2010). Meta-analysis reveals negative yet variable effects of ocean acidification on marine organisms. Ecol. Lett. 13, 1419–1434. doi: 10.1111/j.1461-0248.2010.01518.x
Larsen, P. E., Field, D., and Gilbert, J. A. (2012). Predicting bacterial community assemblages using an artificial neural network approach. Nat. Methods 9, 621–625. doi: 10.1038/nmeth.1975
Lenton, A., Codron, F., Bopp, L., Metzl, N., Cadule, P., Tagliabue, A., et al. (2009). Stratospheric ozone depletion reduces ocean carbon uptake and enhances ocean acidification. Geophys. Res. Lett. 36:L12606. doi: 10.1029/2009GL038227
Lindh, M. V., Riemann, L., Baltar, F., Romero-Oliva, C., Salomon, P. S., Granéli, E., et al. (2013). Consequences of increased temperature and acidification on bacterioplankton community composition during a mesocosm spring bloom in the Baltic Sea. Environ. Microbiol. Rep. 5, 252–262. doi: 10.1111/1758-2229.12009
Liu, Y., Debeljak, P., Rembauville, M., Blain, S., and Obernosterer, I. (2019). Diatoms shape the biogeography of heterotrophic prokaryotes in early spring in the Southern Ocean. Environ. Microbiol. 21, 1452–1465. doi: 10.1111/1462-2920.14579
Liu, Z., Hsiao, W., Drábek, E. F., and Fraser-Liggett, C. (2011). Sparse distance-based learning for simultaneous multiclass classification and feature selection of metagenomic data. Bioinformatics 27, 3242–3249. doi: 10.1093/bioinformatics/btr547
Lovenduski, N. S., Gruber, N., and Doney, S. C. (2008). Toward a mechanistic understanding of the decadal trends in the Southern Ocean carbon sink. Global Biogeochem. Cycles 22, 1–9. doi: 10.1029/2007GB003139
Lucas, T. C. D. (2020). A translucent box: interpretable machine learning in ecology. Ecol. Monographs 90:e01422. doi: 10.1002/ecm.1422
Lyman, J. M., Good, S. A., Gouretski, V. V., Ishii, M., Johnson, G. C., Palmer, M. D., et al. (2010). Robust warming of the global upper ocean. Nature 465, 334–337. doi: 10.1038/nature09043
Lyu, K., Zhang, X., and Church, J. A. (2020). Regional dynamic sea level simulated in the CMIP5 and CMIP6 models: mean biases, future projections, and their linkages. J. Climate 33, 6377–6398. doi: 10.1175/JCLI-D-19-1029.1
McFeeters, B. J., and Frost, P. C. (2011). Temperature and the effects of elemental food quality on Daphnia. Freshwater Biol. 56, 1447–1455. doi: 10.1111/j.1365-2427.2011.02586.x
McMurdie, P. J., and Holmes, S. (2012). Phyloseq: a bioconductor package for handling and analysis of high-throughput phylogenetic sequence data. Pac. Symp. Biocomp. 2012, 235–246.
Meinshausen, M., Smith, S. J., Calvin, K., Daniel, J. S., Kainuma, M. L. T., Lamarque, J.-F., et al. (2011). The RCP greenhouse gas concentrations and their extensions from 1765 to 2300. Clim. Change 109:213. doi: 10.1007/s10584-011-0156-z
Oksanen, J., Blanchet, F. G., Friendly, M., Kindt, R., Legendre, P., McGlinn, D., et al. (2020). vegan: Community Ecology Package. R package version 2.5-7. Available online at: https://cran.r-project.org/web/packages/vegan/index.html
O’Neill, B. C., Tebaldi, C., van Vuuren, D. P., Eyring, V., Friedlingstein, P., Hurtt, G., et al. (2016). The Scenario Model Intercomparison Project (ScenarioMIP) for CMIP6. Geosci. Model Dev. 9, 3461–3482. doi: 10.5194/gmd-9-3461-2016
Paolo, F. S., Fricker, H. A., and Padman, L. (2015). Ice sheets. volume loss from Antarctic ice shelves is accelerating. Science 348, 327–331. doi: 10.1126/science.aaa0940
Pasolli, E., Truong, D. T., Malik, F., Waldron, L., and Segata, N. (2016). Machine learning meta-analysis of large metagenomic datasets: tools and biological insights. PLoS Comp. Biol. 12:e1004977. doi: 10.1371/journal.pcbi.1004977
Pedregosa, F., Varoquaux, G., Gramfort, A., Michel, V., Thirion, B., Grisel, O., et al. (2011). Scikit-learn: machine learning in python. J. Mach. Learn. Res. 12, 2825–2830.
Pereira, O., Hochart, C., Auguet, J. C., Debroas, D., and Galand, P. E. (2019). Genomic ecology of Marine Group II, the most common marine planktonic Archaea across the surface ocean. MicrobiologyOpen 8:e00852. doi: 10.1002/mbo3.852
Pierce, D. W., Gleckler, P. J., Barnett, T. P., Santer, B. D., and Durack, P. J. (2012). The fingerprint of human-induced changes in the ocean’s salinity and temperature fields. Geophys. Res. Lett. 39:21704. doi: 10.1029/2012GL053389
Purkey, S. G., and Johnson, G. C. (2012). Global contraction of Antarctic bottom water between the 1980s and 2000s. J. Climate 25, 5830–5844. doi: 10.1175/JCLI-D-11-00612.1
Qu, K., Guo, F., Liu, X., Lin, Y., and Zou, Q. (2019). Application of machine learning in microbiology. Front. Microbiol. 10:827. doi: 10.3389/fmicb.2019.00827
R Core Team (2019). R: A Language and Environment for Statistical Computing. Version 3.5.3. Vienna: R Foundation for Statistical Computing.
Riahi, K., van Vuuren, D. P., Kriegler, E., Edmonds, J., O’Neill, B. C., Fujimori, S., et al. (2017). the shared socioeconomic pathways and their energy, land use, and greenhouse gas emissions implications: an overview. Global Environ. Change 42, 153–168. doi: 10.1016/j.gloenvcha.2016.05.009
Rignot, E., Bamber, J. L., van den Broeke, M. R., Davis, C., Li, Y., van de Berg, W. J., et al. (2008). Recent Antarctic ice mass loss from radar interferometry and regional climate modelling. Nat. Geosci. 1, 106–110. doi: 10.1038/ngeo102
Roemmich, D., Church, J., Gilson, J., Monselesan, D., Sutton, P., and Wijffels, S. (2015). Unabated planetary warming and its ocean structure since 2006. Nat. Clim. Change 5, 240–245. doi: 10.1038/nclimate2513
Ryan, S., Schröder, M., Huhn, O., and Timmermann, R. (2016). On the warm inflow at the eastern boundary of the Weddell Gyre. Deep Sea Res. Part I: Oceanographic Res. Papers 107, 70–81. doi: 10.1016/j.dsr.2015.11.002
Sallée, J.-B., Shuckburgh, E., Bruneau, N., Meijers, A. J. S., Bracegirdle, T. J., Wang, Z., et al. (2013). Assessment of Southern Ocean water mass circulation and characteristics in CMIP5 models: historical bias and forcing response. J. Geophys. Res. Oceans 118, 1830–1844. doi: 10.1002/jgrc.20135
Shannon, C. E. (1948). A mathematical theory of communication. Bell System Tech. J. 27, 379–423. doi: 10.1002/j.1538-7305.1948.tb01338.x
Signori, C. N., Pellizari, V. H., Enrich-Prast, A., and Sievert, S. M. (2018). Spatiotemporal dynamics of marine bacterial and archaeal communities in surface waters off the northern Antarctic Peninsula. Deep Sea Res. Part II: Top. Stud. Oceanography 149, 150–160. doi: 10.1016/j.dsr2.2017.12.017
Signori, C. N., Thomas, F., Enrich-Prast, A., Pollery, R. C. G., and Sievert, S. M. (2014). Microbial diversity and community structure across environmental gradients in Bransfield Strait, Western Antarctic Peninsula. Front. Microbiol. 5:647. doi: 10.3389/fmicb.2014.00647
Silvy, Y., Guilyardi, E., Sallée, J.-B., and Durack, P. J. (2020). Human-induced changes to the global ocean water masses and their time of emergence. Nat. Clim. Change 10, 1030–1036. doi: 10.1038/s41558-020-0878-x
Smith, B., Fricker, H. A., Gardner, A. S., Medley, B., Nilsson, J., Paolo, F. S., et al. (2020). Pervasive ice sheet mass loss reflects competing ocean and atmosphere processes. Science 368, 1239–1242. doi: 10.1126/science.aaz5845
Statnikov, A., Henaff, M., Narendra, V., Konganti, K., Li, Z., Yang, L., et al. (2013). A comprehensive evaluation of multicategory classification methods for microbiomic data. Microbiome 1:11. doi: 10.1186/2049-2618-1-11
Svetnik, V., Liaw, A., Tong, C., Culberson, J. C., Sheridan, R. P., and Feuston, B. P. (2003). Random forest: a classification and regression tool for compound classification and QSAR modeling. J. Chem. Inf. Comput. Sci. 43, 1947–1958. doi: 10.1021/ci034160g
Taylor, K. E., Stouffer, R. J., and Meehl, G. A. (2012). An overview of CMIP5 and the experiment design. Bull. Am. Meteorol. Soc. 93, 485–498. doi: 10.1175/BAMS-D-11-00094.1
Teeling, H., and Glöckner, F. O. (2012). Current opportunities and challenges in microbial metagenome analysis–a bioinformatic perspective. Brief. Bioinform. 13, 728–742. doi: 10.1093/bib/bbs039
Thomas, M. K., Kremer, C. T., Klausmeier, C. A., and Litchman, E. (2012). A global pattern of thermal adaptation in marine phytoplankton. Science 338, 1085–1088. doi: 10.1126/science.1224836
Thompson, J., Johansen, R., Dunbar, J., and Munsky, B. (2019). Machine learning to predict microbial community functions: an analysis of dissolved organic carbon from litter decomposition. PLoS One 14:e0215502. doi: 10.1371/journal.pone.0215502
Tonelli, M., Marcello, F., Ferrero, B., and Wainer, I. (2019). Warm deep water variability during the last millennium in the CESM–LME: pre-industrial scenario versus late 20th Century changes. Geosciences 9:346. doi: 10.3390/geosciences9080346
Toseland, A., Daines, S. J., Clark, J. R., Kirkham, A., Strauss, J., Uhlig, C., et al. (2013). The impact of temperature on marine phytoplankton resource allocation and metabolism. Nat. Clim. Change 3, 979–984. doi: 10.1038/nclimate1989
Trenberth, K. E., Fasullo, J. T., von Schuckmann, K., and Cheng, L. (2016). Insights into earth’s energy imbalance from multiple sources. J. Clim. 29, 7495–7505. doi: 10.1175/JCLI-D-16-0339.1
Turner, J. W., Berthiaume, C. T., Morales, R., Armbrust, E. V., and Strom, M. S. (2016). Genomic evidence of adaptive evolution in emergent Vibrio parahaemolyticus ecotypes. Elementa: Sci. Anthropocene 4:000117. doi: 10.12952/journal.elementa.000117
Verde, C., Giordano, D., Bellas, C. M., di Prisco, G., and Anesio, A. M. (2016). Polar marine microorganisms and climate change. Adv. Microb. Physiol. 69, 187–215. doi: 10.1016/bs.ampbs.2016.07.002
Weydmann, A., Søreide, J. E., Kwasniewski, S., and Widdicombe, S. (2012). Influence of CO2-induced acidification on the reproduction of a key Arctic copepod Calanus glacialis. J. Exp. Mar. Biol. Ecol. 428, 39–42. doi: 10.1016/j.jembe.2012.06.002
Yu, L., and Liu, H. (2003). “Feature selection for high-dimensional data: a fast correlation-based filter solution,” in Proceedings, Twentieth International Conference on Machine Learning. Presented at the Proceedings, Twentieth International Conference on Machine Learning, (Washington, DC), 856–863.
Zhang, C. L., Xie, W., Martin-Cuadrado, A.-B., and Rodriguez-Valera, F. (2015). Marine Group II Archaea, potentially important players in the global ocean carbon cycle. Front. Microbiol. 6:1108. doi: 10.3389/fmicb.2015.01108
Zhang, X., Thompson, A. F., Flexas, M. M., Roquet, F., and Bornemann, H. (2016). Circulation and meltwater distribution in the Bellingshausen Sea: from shelf break to coast. Geophys. Res. Lett. 43, 6402–6409. doi: 10.1002/2016GL068998
Keywords: Southern Ocean (Antarctica), climate change, microbial diversity, CMIP6, time of emergence, machine learning
Citation: Tonelli M, Signori CN, Bendia A, Neiva J, Ferrero B, Pellizari V and Wainer I (2021) Climate Projections for the Southern Ocean Reveal Impacts in the Marine Microbial Communities Following Increases in Sea Surface Temperature. Front. Mar. Sci. 8:636226. doi: 10.3389/fmars.2021.636226
Received: 01 December 2020; Accepted: 13 April 2021;
Published: 20 May 2021.
Edited by:
André Frainer, Norwegian Institute for Nature Research (NINA), NorwayReviewed by:
Hyewon Heather Kim, Woods Hole Oceanographic Institution, United StatesAlexandra Schönle, University of Cologne, Germany
Copyright © 2021 Tonelli, Signori, Bendia, Neiva, Ferrero, Pellizari and Wainer. This is an open-access article distributed under the terms of the Creative Commons Attribution License (CC BY). The use, distribution or reproduction in other forums is permitted, provided the original author(s) and the copyright owner(s) are credited and that the original publication in this journal is cited, in accordance with accepted academic practice. No use, distribution or reproduction is permitted which does not comply with these terms.
*Correspondence: Marcos Tonelli, bXRvbmVsbGlAdXNwLmJy