 Kevin J. Flynn
 Douglas C. Speirs
 Michael R. Heath
 Aditee Mitra
- 1Plymouth Marine Laboratory, Plymouth, United Kingdom
- 2Department of Mathematics and Statistics, University of Strathclyde, Glasgow, United Kingdom
- 3School of Earth and Environmental Sciences, Cardiff University, Cardiff, United Kingdom
Projecting ocean biogeochemistry and fisheries resources under climate change requires confidence in simulation models. Core to such models is the description of consumer dynamics relating prey abundance to capture, digestion efficiency and growth rate. Capture is most commonly described as a linear function of prey encounter or by rectangular hyperbola. Most models also describe consumers as eating machines which “live-to-eat,” where growth (μ) is limited by a maximum grazing rate (Gmax). Real consumers can feed much faster than needed to support their maximum growth rate (μmax); with feeding modulated by satiation, they “eat-to-live.” A set of strategic analyses were conducted of these alternative philosophies of prey consumption dynamics and testing of their effects in the StrathE2E end-to-end marine food web and fisheries model. In an experiment where assimilation efficiencies were decreased by 10%, such as might result from a change in temperature or ocean acidity, the different formulation resulted in up to 100% variation in the change in abundances of food web components, especially in the mid-trophic levels. Our analysis points to a need for re-evaluation of some long-accepted principles in consumer-resource modeling.
Introduction
Consumer dynamics are central to ecology (e.g., Cohen et al., 1993; Hanley and La Pierre, 2015; Schaffner et al., 2019). The removal of prey, the efficiency of conversion of prey biomass into that of the consumer, and the form of the voided material (as inorganics to directly support primary production, or organics to support detritivores) all play pivotal roles in shaping food web functionality. Models of ecosystems typically display high sensitivity to functional descriptions and parameter values describing consumer dynamics (Wood and Thomas, 1999; Mitra et al., 2014; Bates et al., 2016; Chenillat et al., 2021). The magnitude and direction of this sensitivity becomes particularly important when models are used to simulate the effects of changing environmental conditions (e.g., different prey types or temperature) which may affect processes such as maximum feeding rates, assimilation efficiencies or respiration rates. However, it is not clear whether changes projected by simulations run under different environmental conditions do indeed provide a robust reflection of reality, or whether at least in part projections are the consequences of decisions made in the construction of the model itself. At the extreme, an inappropriately constructed model may incorrectly describe the direction of change in simulation output, for example, describing an increase in a facet when in reality the converse occurs. The behavior of the consumer model thus affects its usefulness both to support our fundamental understanding of ecology, and also our views on climate-induced and allied changes to ecosystems and ecosystem services, and how best to manage them.
Here different approaches to describing core facets of consumer models were compared, specifically those used in plankton and fisheries simulations. Feeding in these models is often represented as a rectangular hyperbolic type-2 (RHt2) function of prey abundance (Gentleman et al., 2003; Malard et al., 2020), while empirical studies often make reference to the classic work of Holling (1965) which describes a linear relationship over the initial resource abundance range (hereafter Ht1) before curving over due to limitations at handling (Holling type 2; Ht2). We have previous indicated that care must be taken in deploying RHt2, else it can give rise to impossible rates of prey capture at low prey abundance (Flynn and Mitra, 2016), proposing an alternative satiation controlled encounter based (SCEB) to better conform with expectations.
The other facet of the topic of consumer model philosophy explored here relates to factors controlling the maximum grazing rate (Gmax). In most models, Gmax is set as an input variable (usually as a constant), with the maximum growth rate (μmax) being an emergent property of growth when food is supplied in excess, after taking account of various loss processes (e.g., Fasham et al., 1990; Plagányi, 2007). This approach we will term “live-to-eat” (L2E). The alternative, which we will term “eat-to-live” (E2L), is to set μmax as the input variable, and modulate Gmax to provide the resource required to fulfill the need net of respiratory and other loss terms (Flynn, 2018).
Models are increasingly used to explore the implications of environmental change on functioning of ecological systems. There are various points of interaction with consumer dynamics. The maximum growth rate (μmax in a model) of each organisms (or often a functional type in a model) is affected by temperature and its differential effects then impact upon community functioning (e.g., Yang et al., 2013). There are three routes through which ingested material is lost during consumer activity, and which must be countered by altering prey ingestion in order for the emergent growth rate to approach μmax. These are losses associated with voiding (linked to assimilation efficiency, AE), with respiration during anabolism (with specific dynamic action, SDA; McCue, 2006), and that due to catabolic respiration (Cres) supporting homeostasis and other activities, such as motility. The value of these parameters, although usually held constant in models, in reality varies significantly. AE is known to be affected across different consumers by food quality and also by the rate of feeding (e.g., Afik and Karasov, 1995; Tirelli and Mayzaud, 2005; Trumble and Castellini, 2005; Mitra and Flynn, 2007; Houston et al., 2011). SDA is also affected by food quality (Glickman and Mitchell, 1948; Secor, 2008; Bessler et al., 2010). In the real world, changes in the demand (hunger) for food results in the consumer modifying its activity, for example increasing its feeding rate to compensate for the increased loss rate with higher respiration caused by stress (e.g., Pope et al., 2014). Catabolic respiration (Cres) is not only affected by changes in stress and activity, but also by temperature (e.g., Lehette et al., 2016). Changes in gut satiation balanced against demands for nutrition act as a modulating influence between feeding and food digestion to support growth. However, to describe this explicitly in models requires the use of an additional state variable for the gut (e.g., Mitra and Flynn, 2007), hence the more typical use of simplifications such as L2E.
Using the L2E modeling approach, which operates with a defined Gmax, if loss rates were to increase then even if optimal food was present in abundance, the simulated growth rate would inevitably decline. Real animals are capable of instantaneous grazing at rates far in excess (perhaps by over an order of magnitude) of that required on average to attain their maximum growth rate. If this was not so, then they would have to feed all the time at their maximum rate if they were to ever attain growth rates approaching μmax; this they do not do. Consistent with this capability, the alternative E2L modeling approach enables the simulated consumer to feed at a higher rate (i.e., Gmax is increased) to counter changing loss rates; E2L enables μ to approach μmax in the presence of sufficient food.
In this work, we explore how alternative permutations of grazing kinetics (RHt2 vs. SCEB) and control of grazing potential (L2E vs. E2L) impact upon predator-prey dynamics that would affect biogeochemical cycling and also, in a complex food web simulation, upon fisheries simulations.
Materials and Methods
Consumer models compute growth as functions of food acquisition, food processing and other loss processes, ultimately capped at a maximum rate. Different descriptions were compared for food acquisition and for the linkage between the maximum grazing and growth rates.
Food Acquisition
Food acquisition is described by a grazing term, G, as defined by f{Gmax,S}, where Gmax is the maximum grazing rate, and S is food (prey) abundance. G is usually defined using a type 2 function, most frequently by a rectangular hyperbola (hereafter RHt2, but often termed Michaelis-Menten, or Monod). RHt2 references external prey abundance (S) with a half saturation constant Kpred (Equation 1).
Equation 1 aligns with Holling type 2, which has the form a⋅s/(1 + a⋅b⋅s) where a is the attack rate, b the handling time and s the prey abundance, by dividing through by 1/a⋅b.
A feature of Equation 1 is that if the value of Gmax is changed, then the initial kinetics of food acquisition (which is set in reality by the prey encounter rate) are also changed. Thus, for example, increasing Gmax as a function of an increase in temperature has the consequence of effectively (implicitly) also increasing the encounter rate that governs ingestion kinetics. In reality, encounter rates may increase, decrease or essentially remain unaltered depending on temperature effects on both consumer and prey. Differential effects of temperature on predator and prey have been identified as important factors for higher animal consumers (Kruse et al., 2008; Öhlund et al., 2015), but functions describing the motility in plankton that define prey encounter rates do not usually include temperature as a moderator (e.g., Visser and Kiørboe, 2006). Furthermore, if to compensate for stress the consumer ate more (Gmax increasing) then the implicit increase in prey encounter rate in a stressed organism appears counter intuitive. It is for such reasons that Flynn and Mitra (2016) recommended that the RHt2 function be used with great caution in consumer models.
To avoid the inadvertent change in simulated feeding kinetics when using the RHt2 approach, a function is required that explicitly separates the prey encounter component from the satiation feedback component of the interaction. Here the satiation controlled encounter based (SCEB) grazing function of Flynn and Mitra (2016) was used, developed from Mitra and Flynn (2006). The SCEB function describes the kinetics of the relationship between food availability and consumption as initially linear (akin to the classic Holling type (1), but becoming curvilinear as G approaches Gmax with that change being attributed to satiation feedback from the total biomass ingested of all prey types. If there were grounds to justify an alteration of encounter kinetics for any or all prey types with changes in environmental conditions, then this can be achieved using SCEB independently of any changes to the value of Gmax (see Flynn and Mitra, 2016).
The SCEB equations as applied to a single prey food source are (Mitra and Flynn, 2006) are as follows:
S (here as μgN L–1) is prey biomass abundance, Cr (d–1 (μgN L–1) –1) is the slope of the relationship between prey abundance and encounter (which may be related to the size of both the consumer and of the prey, and motilities of predator and prey); Cp (d–1; Equation 2) is thus the potential food acquisition rate and is akin to the clearance rate. KI (d–1; used in Equation 3) is a half saturation constant linking the recent total ingestion of all prey items to satiation feedback controlling further ingestion. Gmax is as defined earlier, Gp (Equation 3) is the potential satiation-controlled ingestion rate, and G (Equation 4) is the actual feeding rate; all have units here of d–1.
From here on, reflecting the basic ethos of these two descriptions of the kinetics of food acquisition descriptions, the terms “RHt2” and “SCEB” are used, noting that SCEB has at its heart a linear Holling-style term (Holling, 1965).
Maximum Grazing and Growth Rates
Equations describing the maximum growth rate (μmax) of consumers typically resemble Equation 5, where the maximum grazing rate (Gmax) is a constant input parameter. Note that Gmax is a controlling variable in both the RHt2 and SCEB descriptions of food acquisition (Equations 1, 3, respectively).
Loss rates are associated with assimilation efficiency (AE), respiration during anabolism (i.e., specific dynamic action, SDA – McCue, 2006), plus catabolic respiration for homeostasis, motility with hunting etc., (Cres). The full description is as per Equation 6.
When food is not available in excess, and hence grazing (G) is less than Gmax, then growth rate (μ) is a function of food availability (S) and of Gmax (f{Gmax,S}), as in Equation 7.
Equation 7 thus describes consumer growth as a consequence of losses subtracted from grazing rates. This, then, describes the “live-to-eat” format (from hereon, L2E), in which eating constitutes the driver for consumer growth and activity.
While there will be, for any individual, an absolute maximum rate of feeding (), the operational meaning of what modelers describe as Gmax de facto describes the average rate of grazing required to support μmax for a given set of loss rates (associated with AE, SDA, and Cres). Accordingly, Equation 6 can be rearranged for the instance where food supply is not limiting, now setting μmax as the driver, and Gmax as the emergent property (Equation 8).
Within sensible bounds (such that Gmax < ) the values of μmax, AE, SDA, and Cres can now be modified in response to temperature, food quality and quantity, and with stress, and Gmax (as the time-averaged maximum feeding rate) will be adjusted accordingly. That is to say, if food is available to support G = Gmax, then μ can still attain μmax through application of Equation 7 provided the value of Gmax employed is that obtained from Equation 8. This describes the base for the “eat-to-live” configuration (from hereon, E2L).
Permutations for Testing
The consequences of deploying the traditional consumer description (RHt2 + L2E) through to the proposed alternate (SCEB + E2L), giving four permutations in total (the others being SCEB + L2E, and RHt2 + E2L), were explored with reference to an initial set of parameters which enable all four permutations to give essentially the same dynamics (Table 1). To achieve this, use was made of Equations 9 (from Mitra and Flynn, 2006) to directly compute parameter values for Cr and KI from set values of Gmax and Kpred.
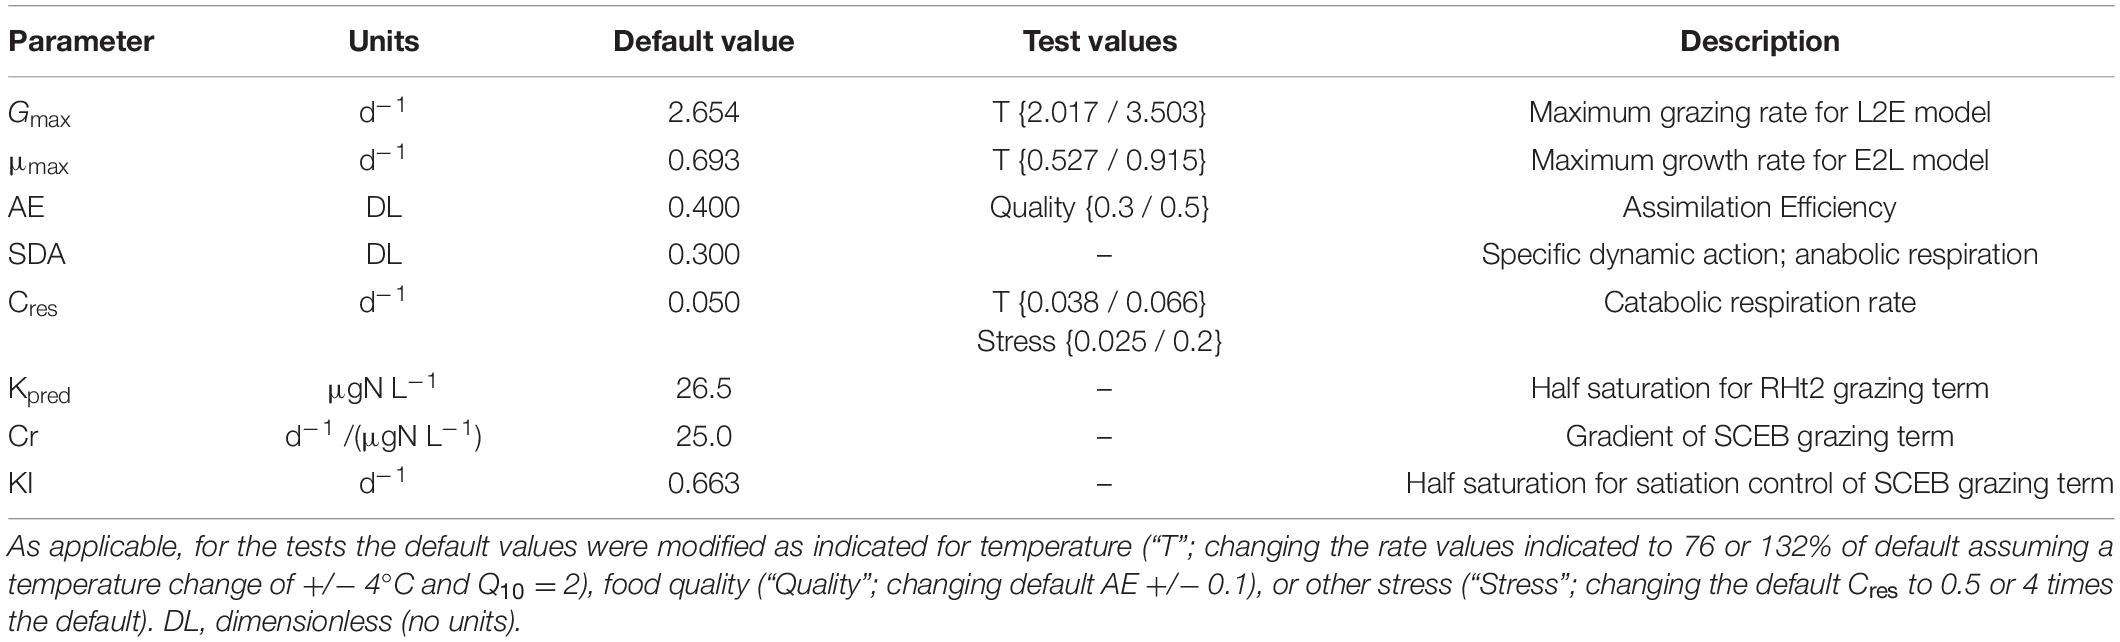
Table 1. Parameter values used to generate the default plots in Figure 1, and the test comparisons portrayed in Figures 2–4, 6.
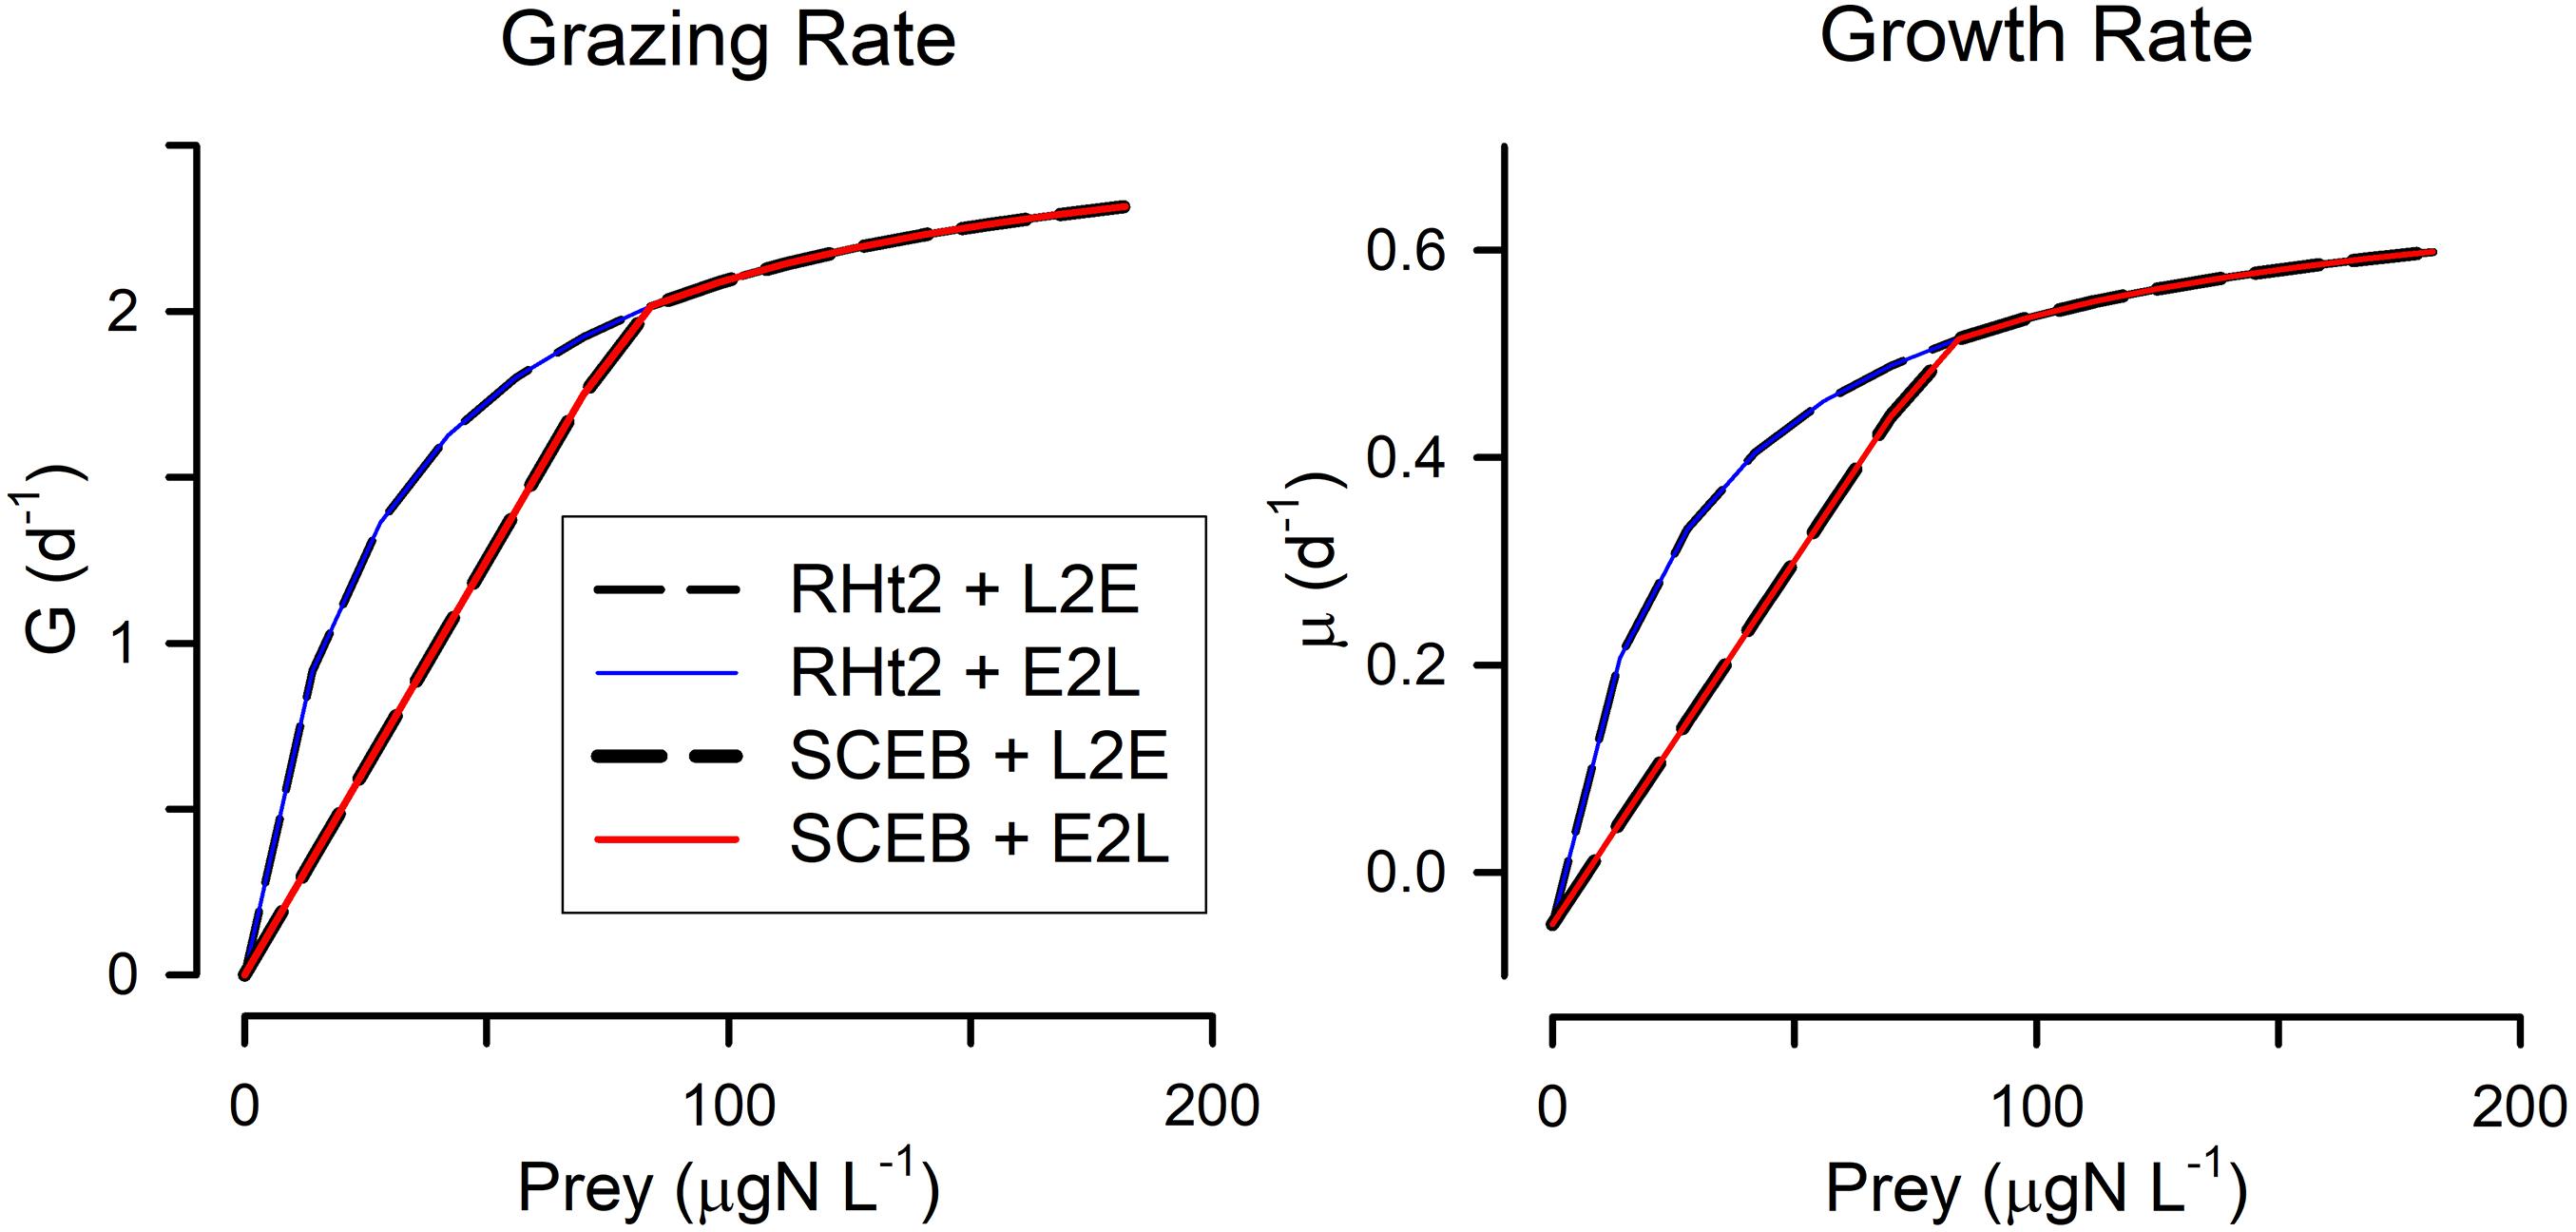
Figure 1. Default relationships between prey abundance and grazing rate (G) and growth rate (μ), for all combinations of two grazing functions. These grazing functions are rectangular hyperbolic (RHt2) vs. satiation controlled encounter based (SCEB) and the growth control functions are live-to-eat (L2E) vs. eat-to-live (E2L). These alternatives have been configured to closely align with each other (see Table 1 for parameter values). The alternative grazing functions, RHt2 and SCEB, give the same outputs at higher prey abundance values but different outputs at low abundance as the SCEB function uses a Holling-like linear response term. L2E and E2L configurations for these default setting give the same outputs for a given grazing function.
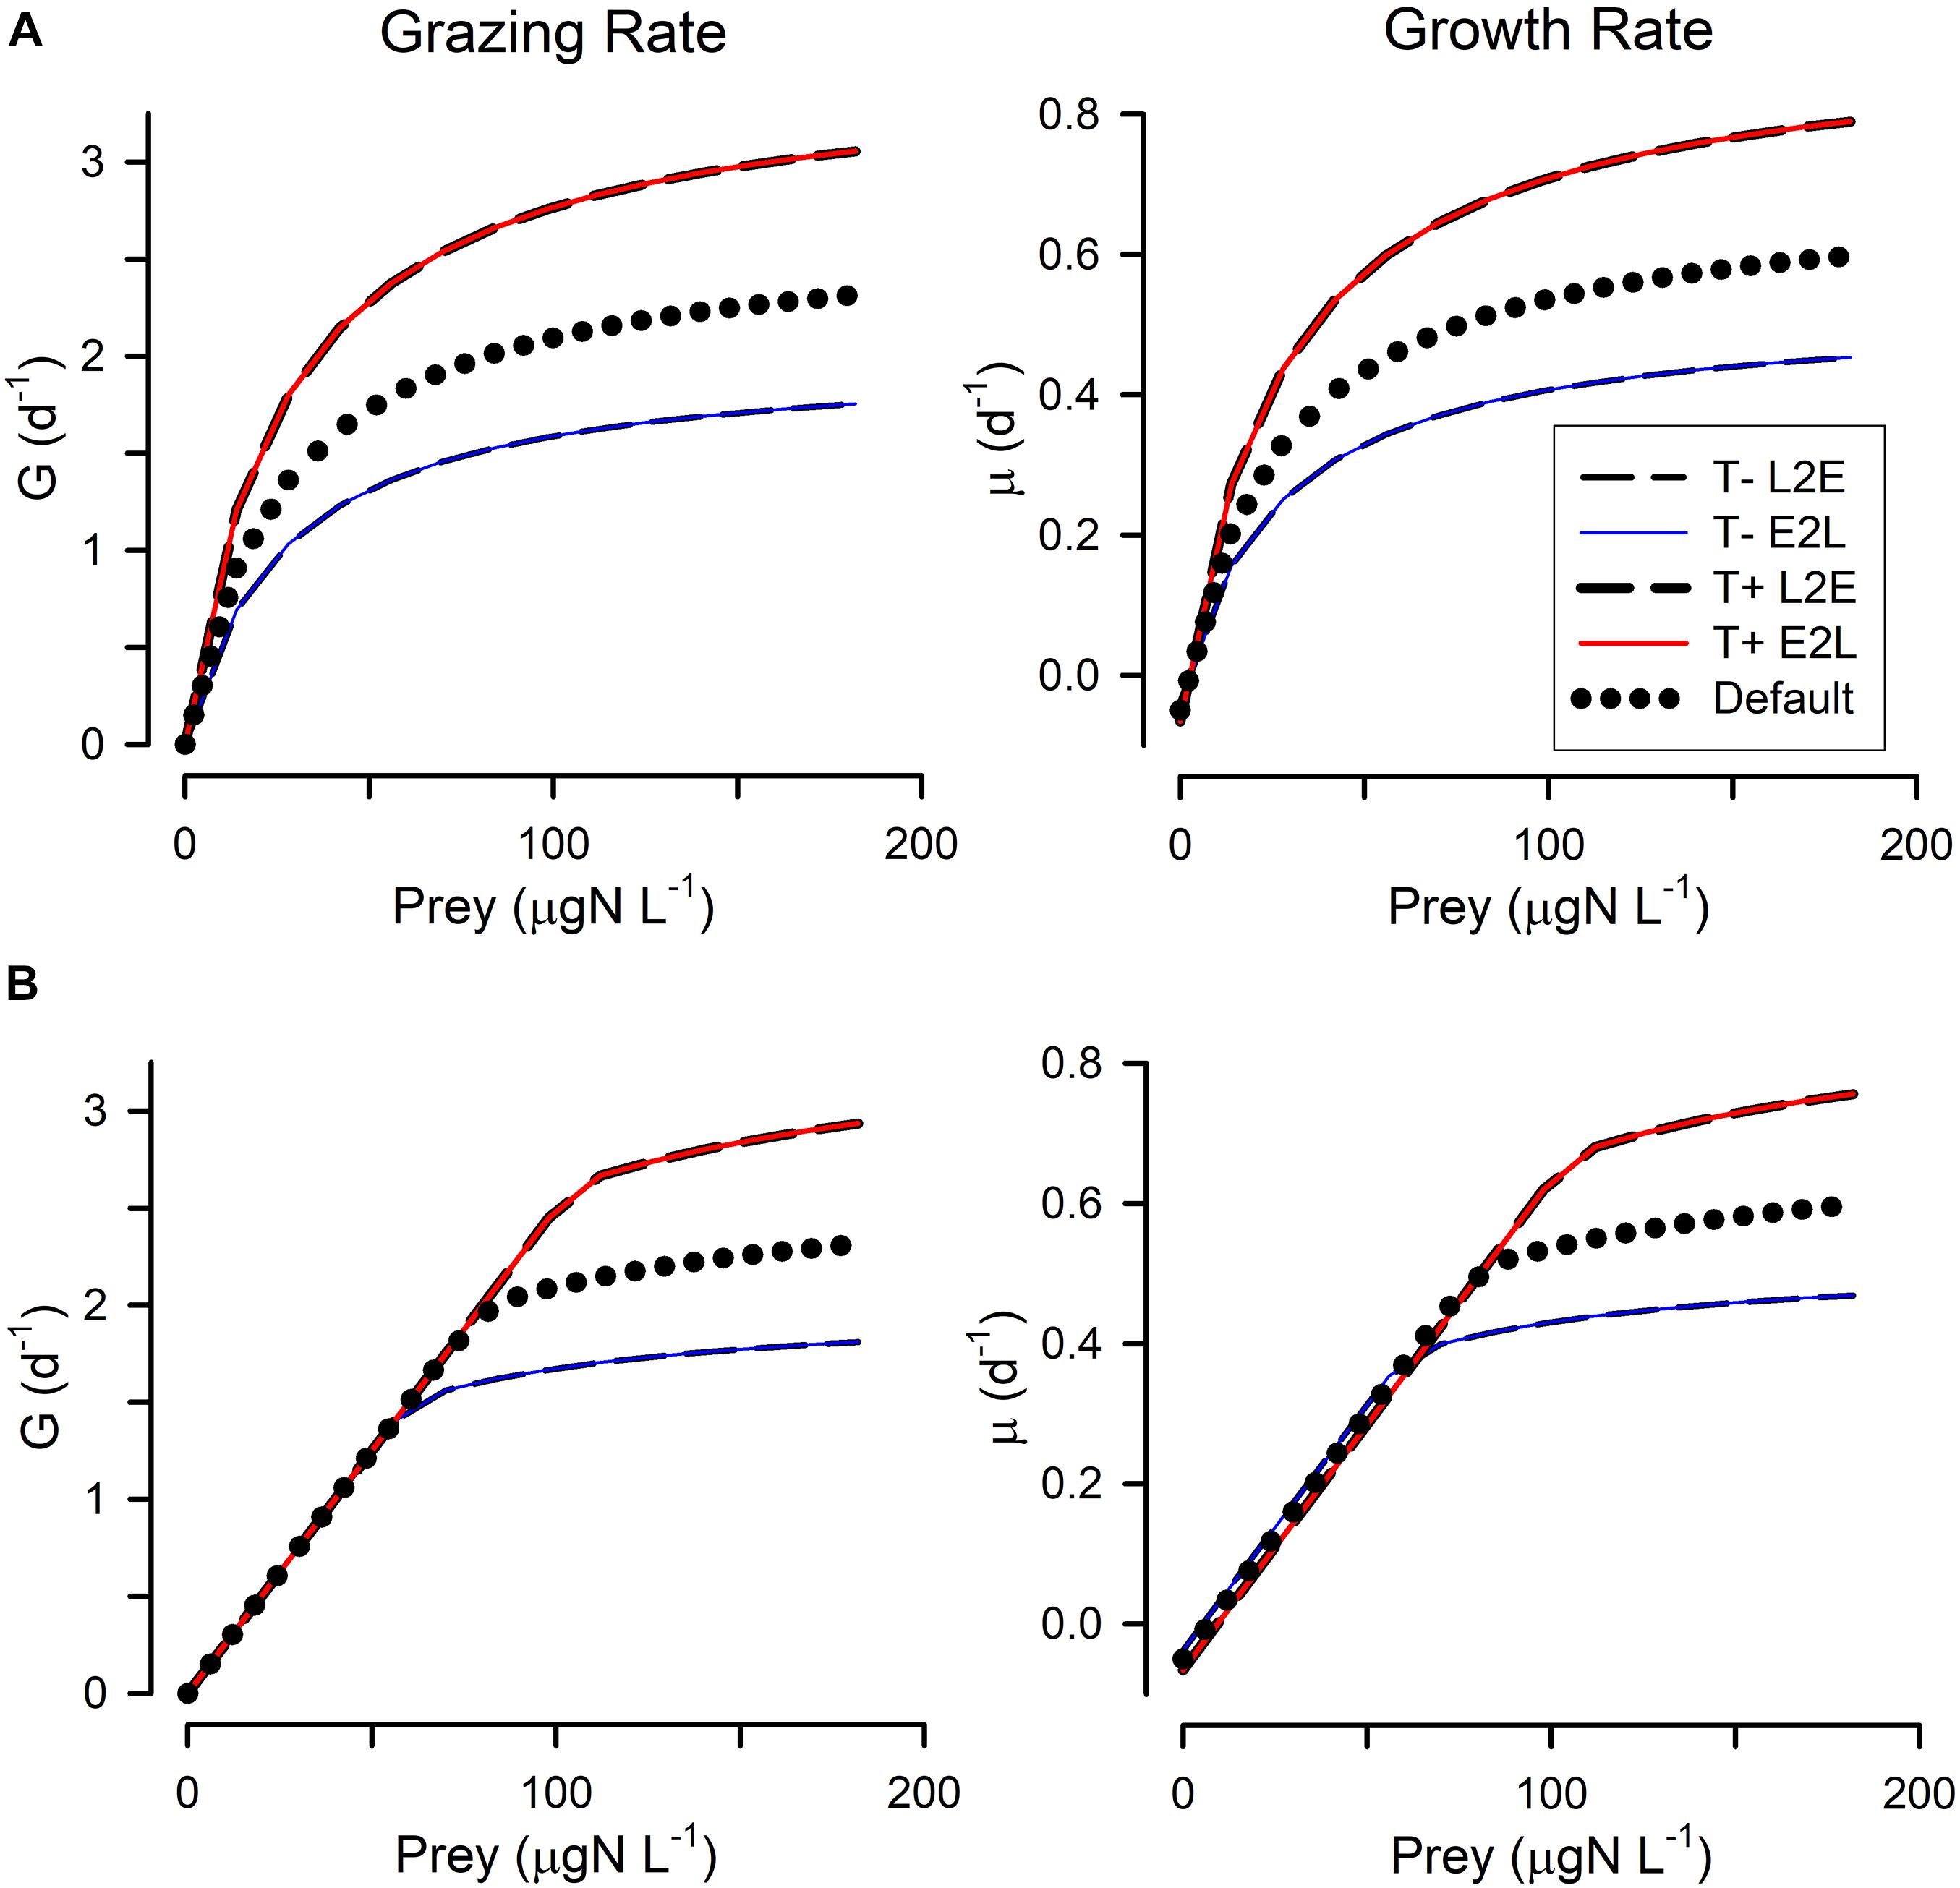
Figure 2. Changes in grazing (G) and growth (μ) relationships with prey abundance in response to lower temperature (T–) or higher temperature (T+). The applied temperature changes (+/– 4°C) affected the rate processes via a Q10 = 2 term (i.e., pro rata doubling rates for a 10°C increase). (A) Shows these when using the rectangular hyperbolic, RHt2, grazing function. (B) Shows these when using the satiation controlled encounter based, SCEB, grazing function. Two alternative growth control functions are used: live-to-eat L2E, and eat-to-live E2L. See Figure 1 and Table 1 for more details.
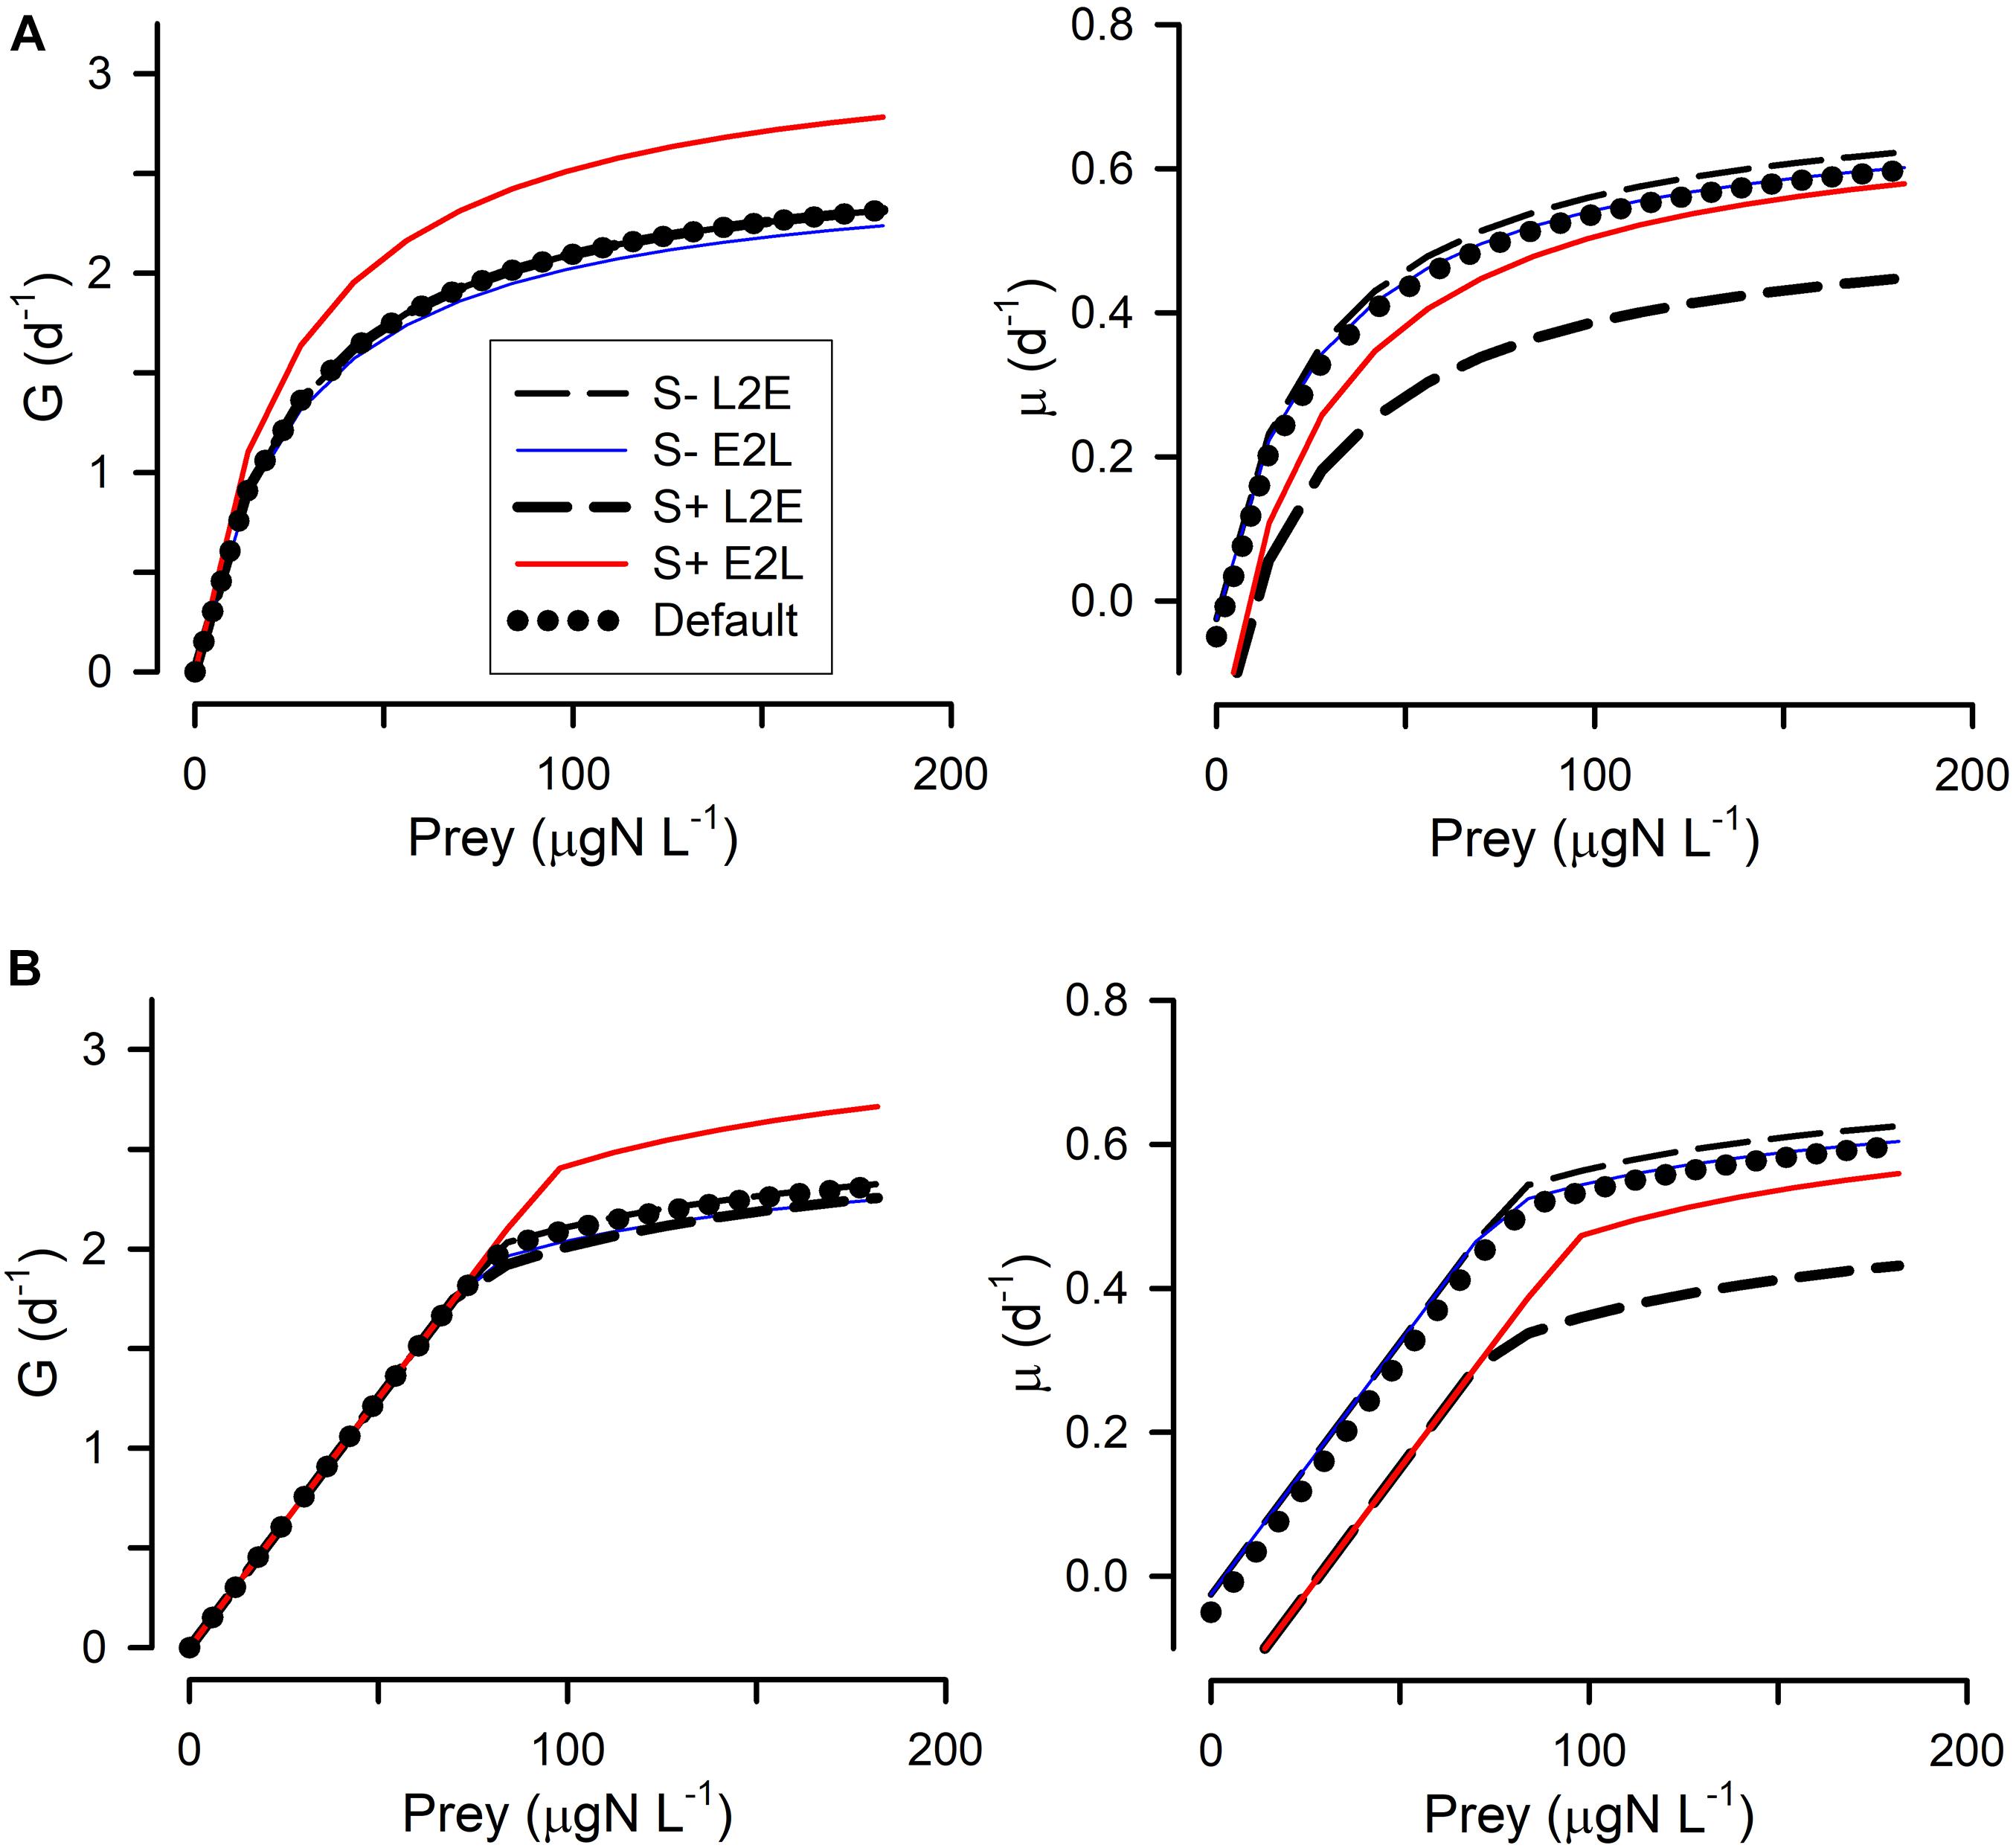
Figure 3. Changes in grazing (G) and growth (μ) relationships with prey abundance in response to lower generic stress (S–) or higher generic stress (S+). Generic stress (e.g., in response to changes in pH) was considered to alter the catabolic rate of respiration by 0.5 (S–) or 4 (S+) times the default value of Cres. (A) Shows these when using the rectangular hyperbolic, RHt2, grazing function. (B) Shows these when using the satiation controlled encounter based, SCEB, grazing function. Two alternative growth control functions are used: live-to-eat L2E, and eat-to-live E2L. See Figure 1 and Table 1 for more details.
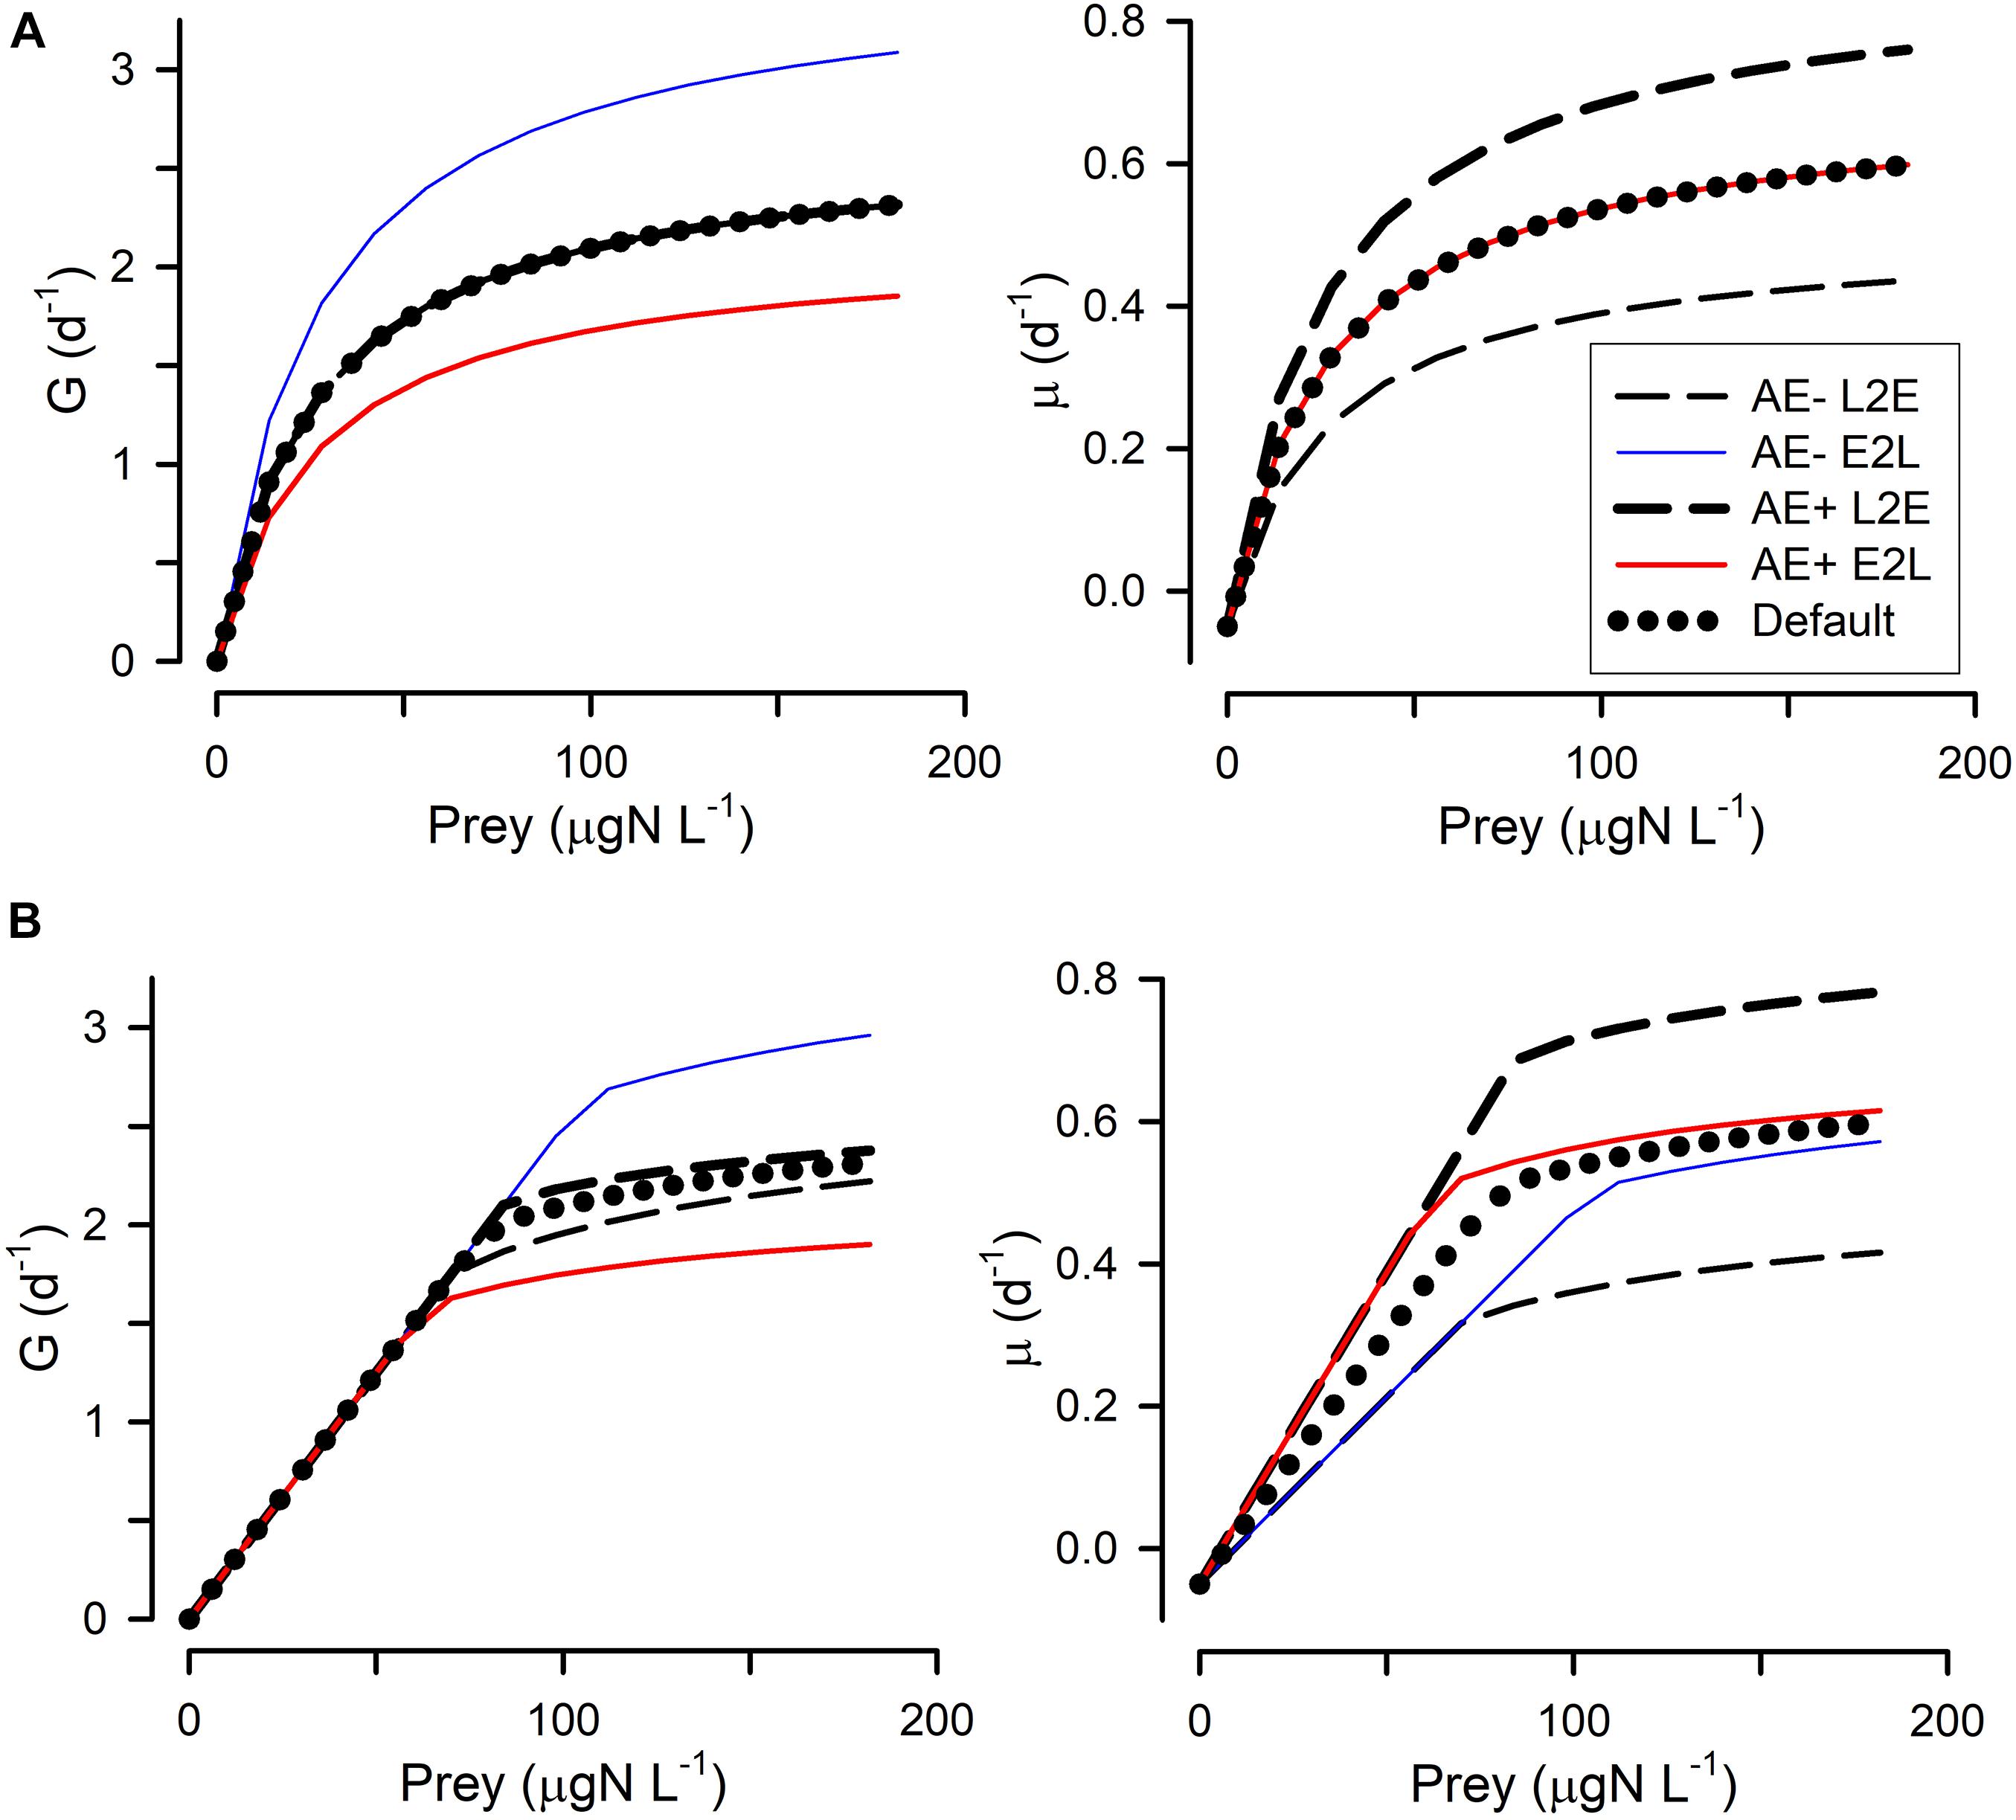
Figure 4. Changes in grazing (G) and growth (μ) relationships with prey abundance in response to lower assimilation efficiency (AE–) or higher assimilation efficiency (AE+). Assimilation efficiency affects the proportion of prey-biomass grazed that actually enters the body of the predator; the applied changes to AE were +/– 0.1 around the default of 0.4. (A) Shows these when using the rectangular hyperbolic, RHt2, grazing function. (B) Shows these when using the satiation controlled encounter based, SCEB, grazing function. Two alternative growth control functions are used: live-to-eat L2E, and eat-to-live E2L. See Figure 1 and Table 1 for more details.
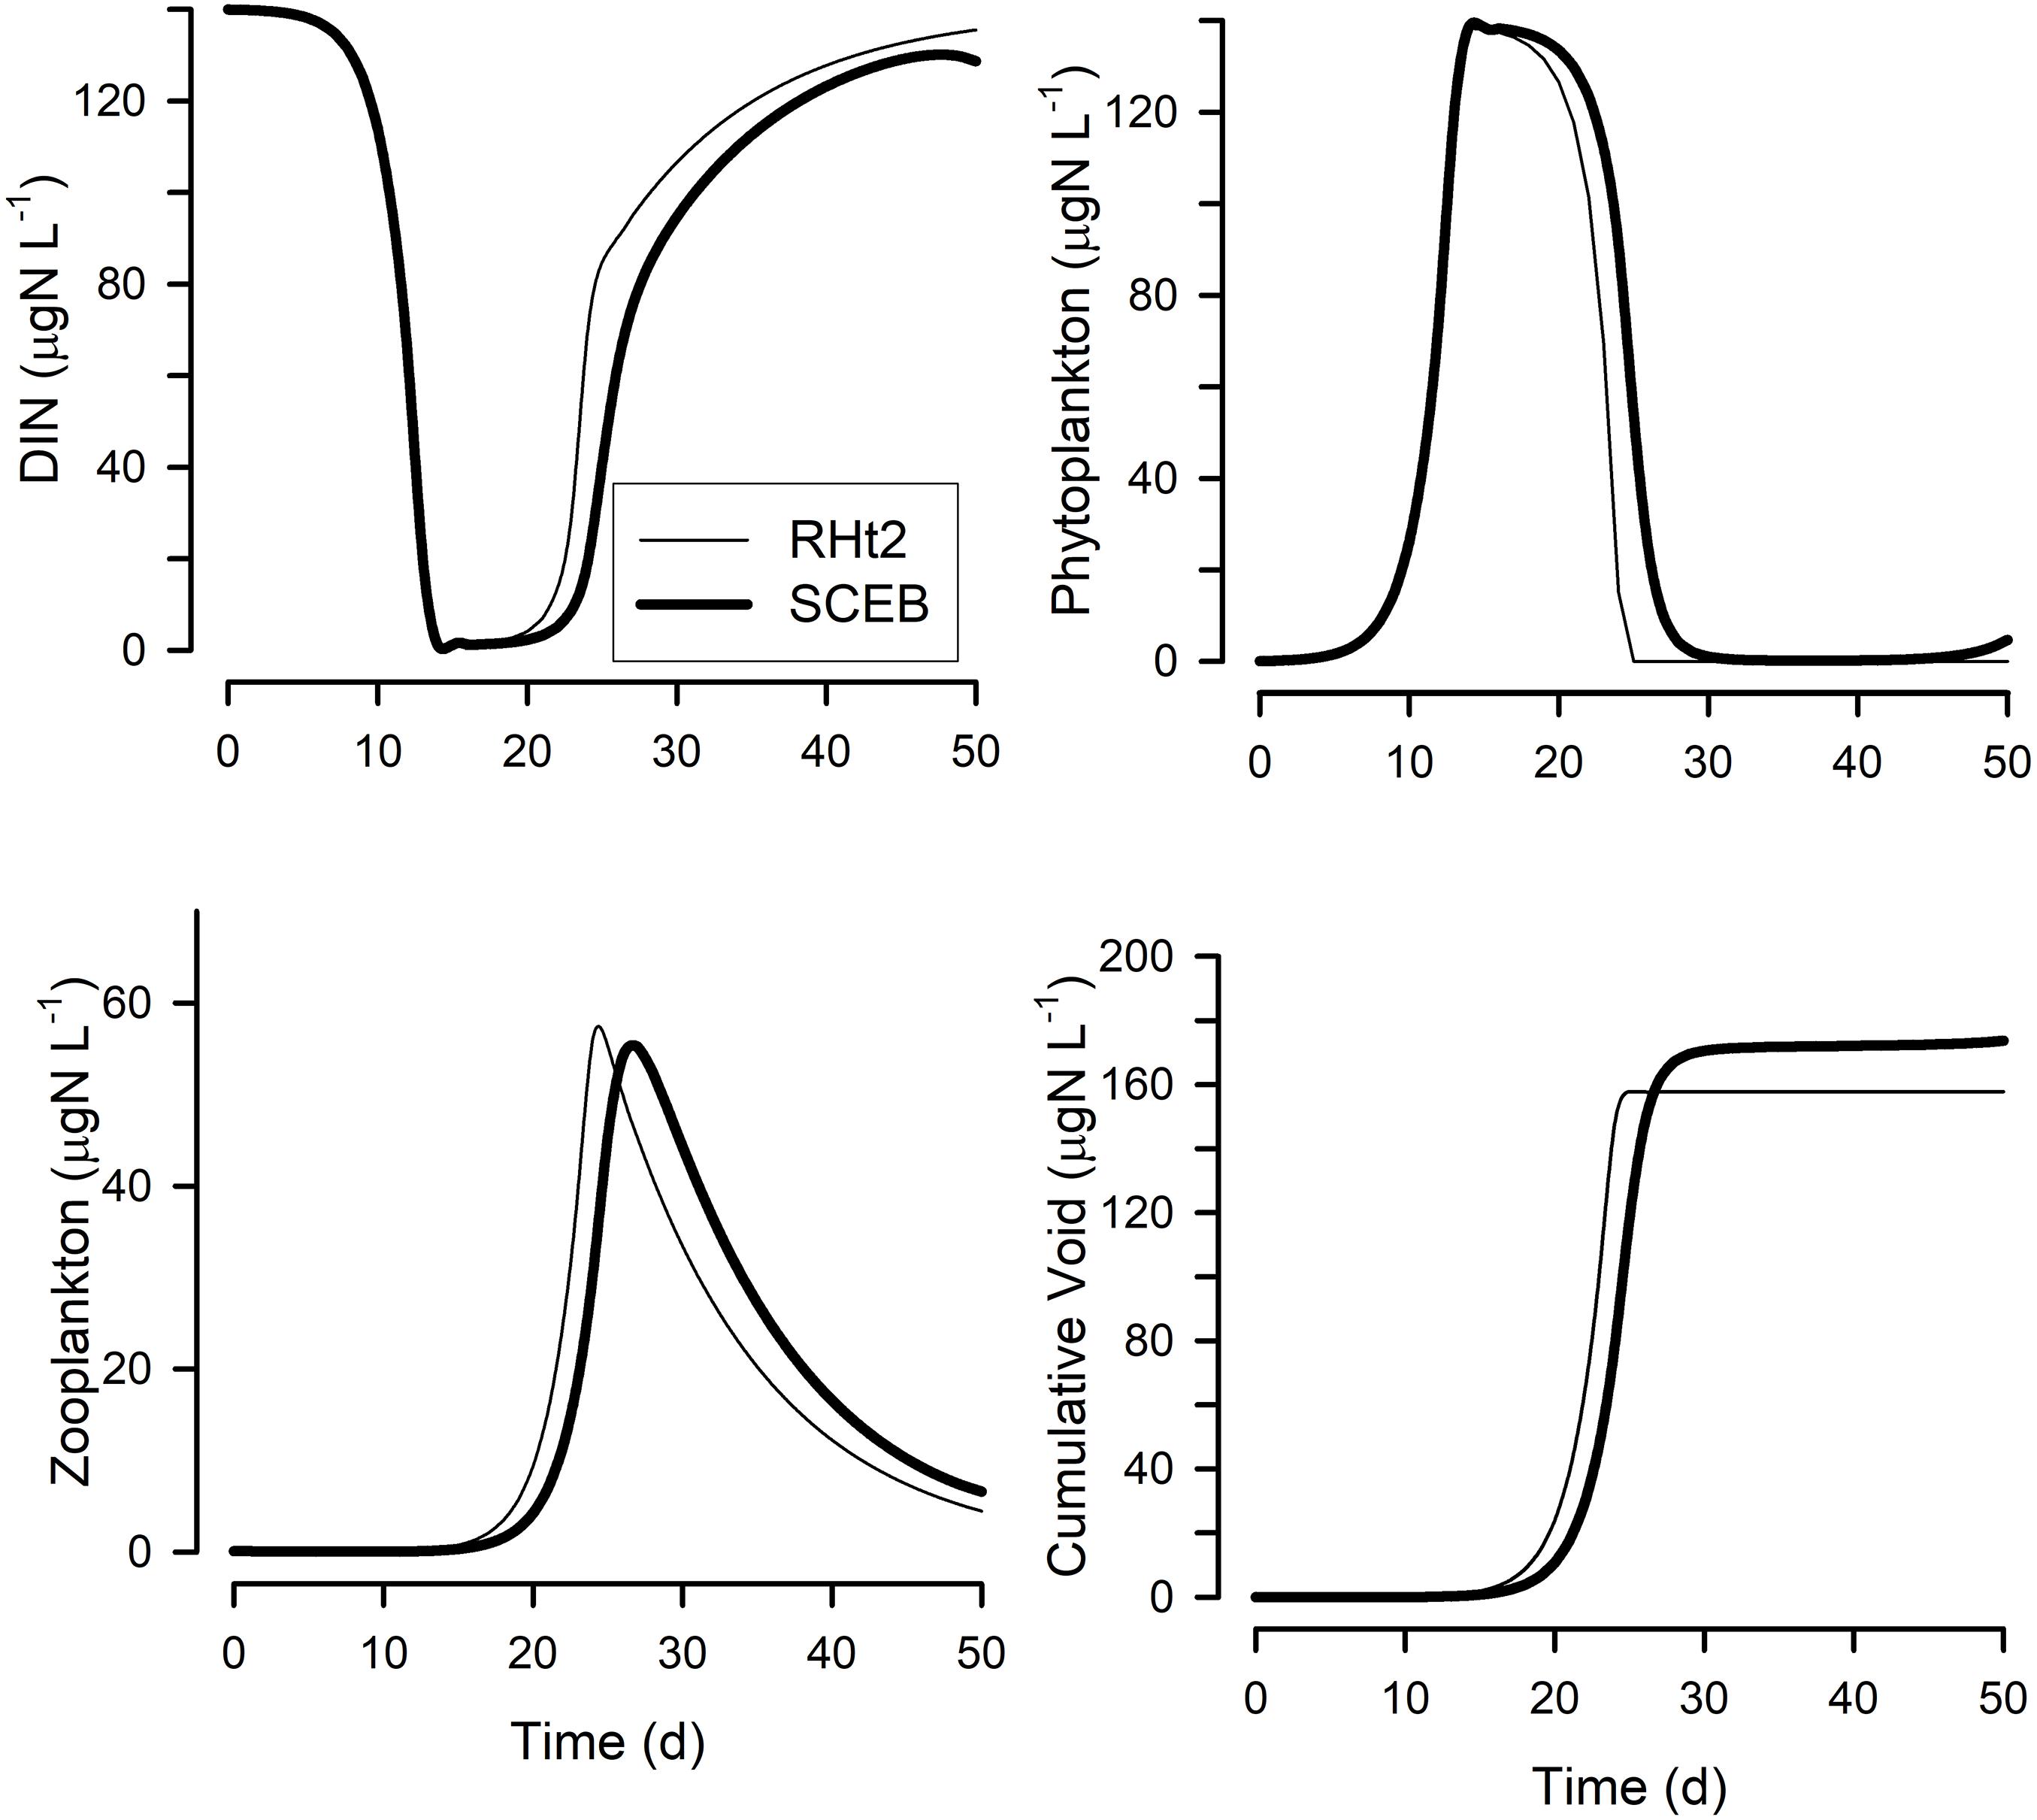
Figure 5. Output from a simple Nutrient-Phytoplankton-Zooplankton (NPZ) style model running with either the RHt2 or SCEB based default grazing configurations. The grazing and growth kinetics relationships for the zooplankton vs. prey abundance for these configurations are as shown in Figure 1; the live-to-eat (L2E) and eat-to-live (E2L) configurations give exactly the same outputs for a given grazing function (RHt2 or SCEB). Plotted are dissolved inorganic-N (DIN) concentration, phytoplankton and zooplankton biomasses, and the cumulative void. The cumulative void value is the sum of material voided by the zooplankton (i.e., (1-AE) × grazing); in the model this material is immediately converted back to DIN, but in reality it would likely enter a different food web.
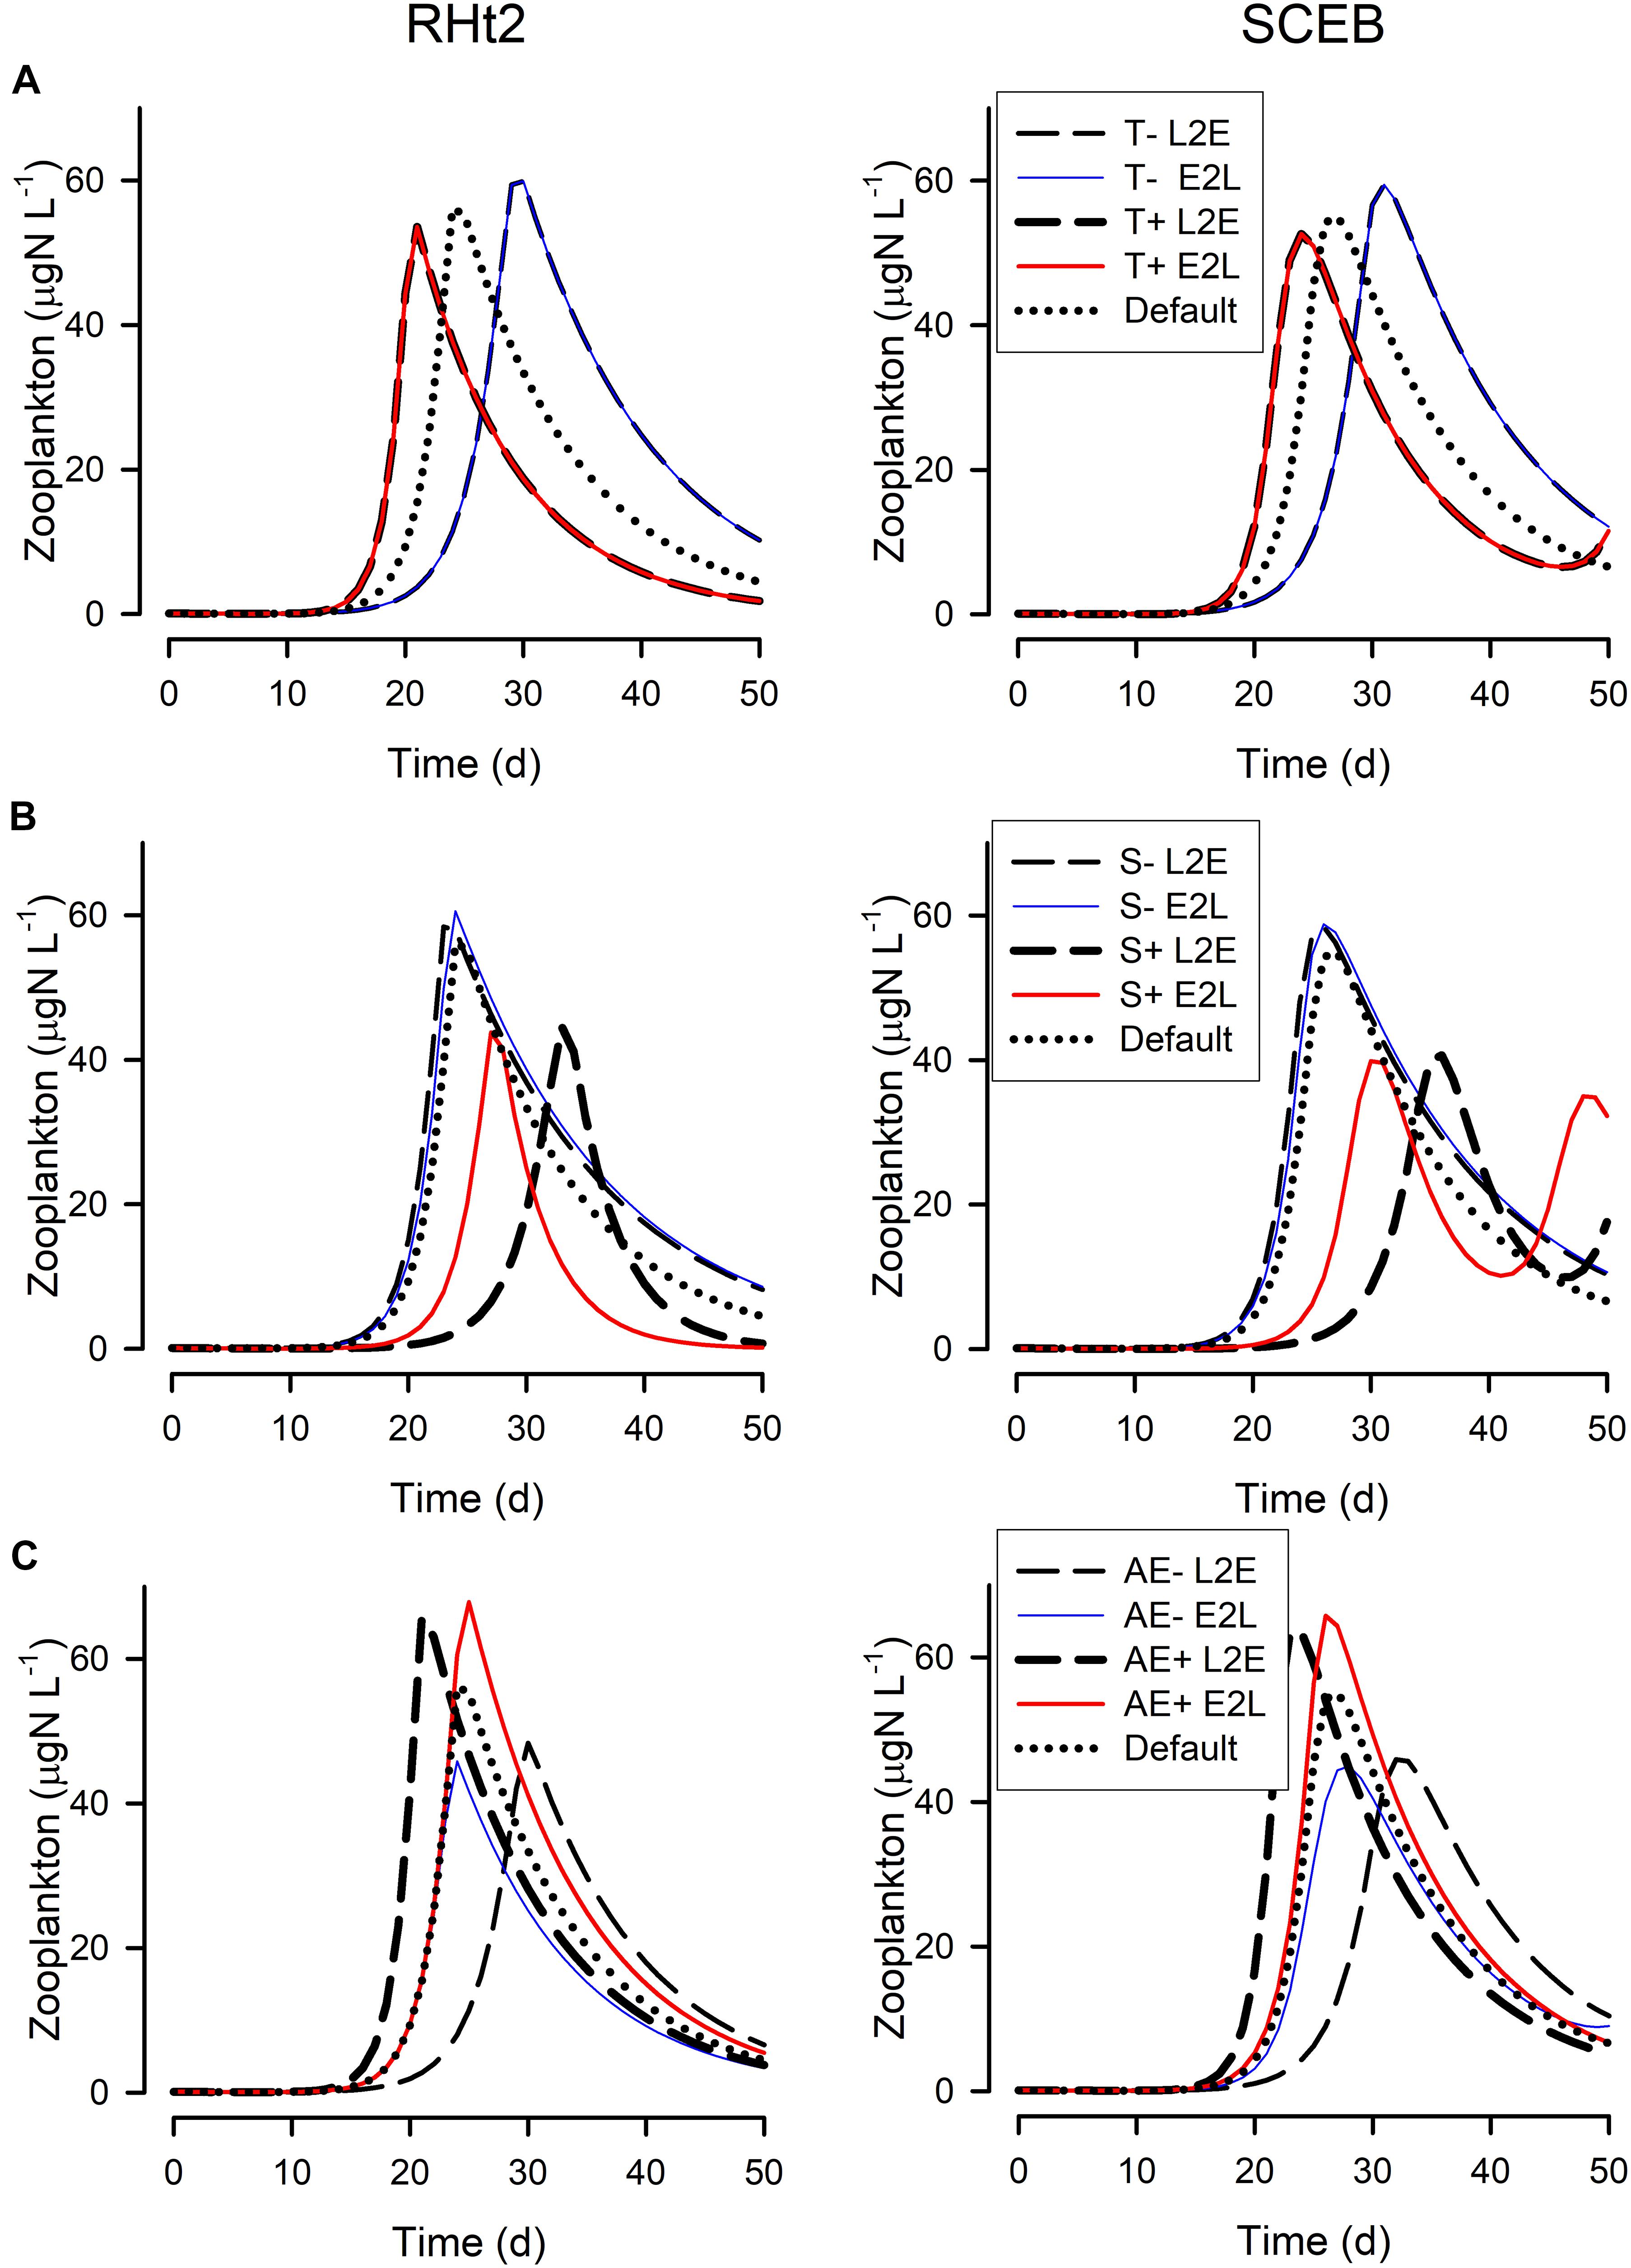
Figure 6. Changes in the zooplankton biomass during the simulations shown in Figure 5, run using RHt2 (left hand column) or SCEB (right hand column) -based models operated in the live-to-eat (L2E, dashed lines) or the eat-to-live (E2L, solid lines) configurations. (A) Show the impact of lower temperature (default –4°C; T-) or higher temperature (default +4°C; T+). (B) Are for lowered stress (0.5x default; S-) or higher stress (4x default; S+). (C) Are for lowered AE (0.3; AE-) or higher AE (0.5; AE+) around the default AE = 0.4. The “Default” plots for RHt2 and SCEB are the same as those shown in Figure 5 for “Zooplankton.” See also Figures 1–4.
In order to assess the ecosystem-level consequences of these four formulations of consumer uptake, the four alternate model philosophies were implemented in two ecosystem models of differing levels of complexity.
Simple Trophic Model
In the style of the classic nutrient-phytoplankton-zooplankton “NPZ” model (after Fasham et al., 1990), a simple model was constructed with a single nutrient currency (nitrogen, N) supplied as inorganic-N, a primary producer (phytoplankton, P), and its zooplanktonic consumer (Z). Z regenerates N which is then available for P. Such constructs lay at the heart of many IPCC models (Arora et al., 2013). In tests with this NPZ model the following changes were considered:
(i) With temperature, parameters Gmax (for L2E) or μmax (for E2L), and also Cres, were altered by assuming Q10 = 2 (i.e., using an Arrhenius function describing a doubling in a rate process with an increase in temperature by 10°C). Values of temperature (T) were explored as the default vs. T ± 4°C; T+4 °C raises rates to 132% of the reference, while T-4°C depresses rates to 76% of the reference.
(ii) Catabolic respiration (Cres) can also change in response to other stresses, such as ocean acidification as well as to temperature for zooplankton and fish (Pope et al., 2014; Cripps et al., 2016), but it also changes with other generic events confronting consumers such as predator avoidance, increased search time for food, and combatting disease. To explore such stress-related changes the impact was considered of halving or quadrupling the default Cres value.
(iii) With changes in food quality, AE and/or SDA are expected to change. Mathematically, and for the description of only consumer growth dynamics, AE and SDA appear to be coupled but physiologically and for the functioning of a food web there are important differences. The proportion of ingestate described by (1-AE) is that voided as particulate material (feces) and is then available for other consumers. In contrast, the proportion associated with SDA is lost as inorganic nutrients available not to other consumers (other than to bacteria), but to primary producers. In a N-based model the value of SDA can be considered as that for protein assimilation (with a value of SDA = 0.3), and hence only AE was altered, doing so over the rather conservative range of AE = 0.4 ± 0.1 (Mitra, 2006).
The values of parameters constraining the encounter kinetics for the default (control) model configuration are given in Table 1. The growth of phytoplankton (P) assumed a Monod relationship (akin to Equation 1) with the maximum growth rate of a division per day (0.693 d–1) and a concentration of inorganic N that half limited phytoplankton growth (Kg) of 1μM inorganic N (i.e., 14 μg N L–1). The whole model was run to explore system dynamics running under a set of ordinary differential equations.
Multi-Trophic Model
The second ecosystem model used was an end-to-end model of the North Sea ecosystem of intermediate complexity (Heath, 2012; Morris et al., 2014) that has been used to investigate the ecosystem-level effects of eliminating fishery discards (Heath et al., 2014a) and other trophic cascades (Heath et al., 2014b). This model, “StrathE2E” (Strathclyde End-to-End model), has 22 state variables representing the nitrogen mass (moles N⋅m–2 sea surface) of functional groups including detritus, dissolved inorganic nutrient, phytoplankton, carnivorous and omnivorous zooplankton, carnivorous and scavenging benthos, pelagic and demersal fish, and birds and mammals. The dynamics of these variables are simulated in continuous time and output at daily intervals by integrating a set of linked ordinary differential equations describing key physical, geochemical and biological processes that occur in the sea and seabed sediments. Uptake of food is defined, in the original StrathE2E formulation, by RHt2 functions for each resource-consumer interaction defined by a preference matrix. Time-dependent external drivers and boundary conditions for the model are harvesting rates of fish and benthos, temperature, sea surface irradiance, suspended sediment, inflow rates of water and nutrient across the external ocean boundaries and from rivers, vertical mixing rates, and atmospheric deposition of nutrients. A complete formal model definition, parameterisation and validation is given in Heath (2012).
For this work four versions of the StrathE2E North Sea model were implemented, one for each combination of the L2E and E2L formulations with either the RHt2 or SCEB functional responses. In StrathE2E each functional group represents a collection of species feeding on one or more prey functional groups. However, each individual species does not necessarily feed on all the prey functional groups available to a given predator group. For example, the demersal fish functional group contains species (such as plaice) that are almost exclusively predators on benthic invertebrates, and others (such as whiting) which are primarily piscivores. Such non-overlapping diets therefore suggest that the consumption of prey functional groups by a given predator group are largely separate processes. The taxonomic range implicit in the functional groups suggests that there are many species within the predator functional groups whose diets do not overlap, and hence that the consumption of one prey group should not influence the consumption of others. For this reason, the uptake rates of different prey by a predator group were represented as being independent and additive. Thus, for each functional group, i, the per-unit-biomass growth rate, μi, is given by Equation 10.
Here, ai is the proportion of ingested food that contributes to growth, Gmax,i is the maximum consumption rate, ϕi(Sj) is a function (detailed below, Equation 11) describing the dependence of the uptake rate on the abundance of the various prey Sj, n is the total number of functional groups, and Rcat,i is the metabolic loss rate (and also a Q10 function of temperature). The StrathE2E parameter ai is equivalent to AE⋅(1 - SDA), as the product of the assimilation efficiency proper and the fraction of the assimilated food not respired with SDA. In StrathE2E half of the food not assimilated goes to detritus, and the other half goes to dissolved ammonia. The fraction of uptake lost to detritus, (1−a)/2, is therefore equivalent to (1−AE), and the fraction lost to ammonia is respiration and equivalent to AE⋅SDA.
The functional response type affects the form of ϕi(Sj) used in Equation 10. This is given by Equation 11.
The value of Pj = 3Kpred,i marks the transition point between the linear and curvilinear portions of the SCEB functional response (Mitra and Flynn, 2006; Flynn and Mitra, 2016). In contrast, the L2E or E2L formulations affect the maximum uptake rate, Gmax,i, and were implemented in Equation 10 using the alternates described in Equation 12.
Here, is the default maximum uptake rate, and μmax,i is the target growth rate when food is not limiting. From Equations 10, 11, and when food is unlimited, Equation 13 is derived.
Equations 11, 12 allow for the implementation of all four versions of the StrathE2E model; the original version of the model corresponds to RHt2 + L2E. For each of these four versions two simulations were carried out, one using the default values of ai, the parameters defining the assimilation efficiencies of each trophic guild (proportions of ingested food that contributes to growth; in Equations 10, 12) and one in which ai was decreased by 10% in all of the consumer functional groups. For each of the eight resulting runs StrathE2E was run to a steady annual cycle and the mean annual biomass abundance of each functional group was calculated. From these the difference in steady state values is obtained between the unperturbed (default ) and the perturbed () systems for each of the four combinations (L2E or E2L formulation, RHt2 or SCEB). The parameters ai were chosen as the subject of these experiments as exemplars of the physiological changes likely to be induced by climate warming and ocean acidification (e.g., Ullah et al., 2018), and because the model is particularly sensitive to their values, especially in the mid-trophic levels (Morris et al., 2014).
Results
All four combinations (L2E or E2L formulations with RHt2 or SCEB grazing functions) could, with suitable parameter values (Table 1), describe similar functional relationships between prey abundance vs. grazing rates and vs. growth rates (Figure 1). L2E and E2L formulations for a given ingestion description (RHt2 or SCEB) also gave similar grazing and growth rates with changes in temperature (Figure 2). General stress, associated with elevated respiration, likewise elicited similar grazing rates from L2E and E2L formulations (Figure 3). However, the effect on growth rates was not the same; the traditional L2E formulations showed a greater difference in growth between low and high stress than did the E2L formulation for both RHt2 and SCEB variants (Figure 3). This was because the E2L form compensated for increased respiratory demands by up-regulating Gmax (Equation 8). Similarly, changing AE generated different outputs because the E2L-computed grazing rates again altered to (de facto) compensate for changes in AE (Figure 4).
Figure 5 show outputs from the operation of the nutrient-phytoplankton-zooplankton (NPZ) model, operating with the default formulations of the RHt2 or SCEB variants of the consumer sub-model. These outputs were broadly the same, the variants having been configured to minimize any differences. In Figures 6, 7 are shown for the consumer and for cumulative voided material, respectively, the response to changes in temperature, stress (acting via respiration), or AE. Consistently these test scenarios showed delayed zooplankton growth and voiding with the model built with the traditional L2E approach, while the E2L approach gives less deviation from the control (default) outputs. There were also differences in the RHt2 vs. SCEB versions which could result in significant changes in dynamics in subsequent predator-prey cycles (Figures 6, 7).
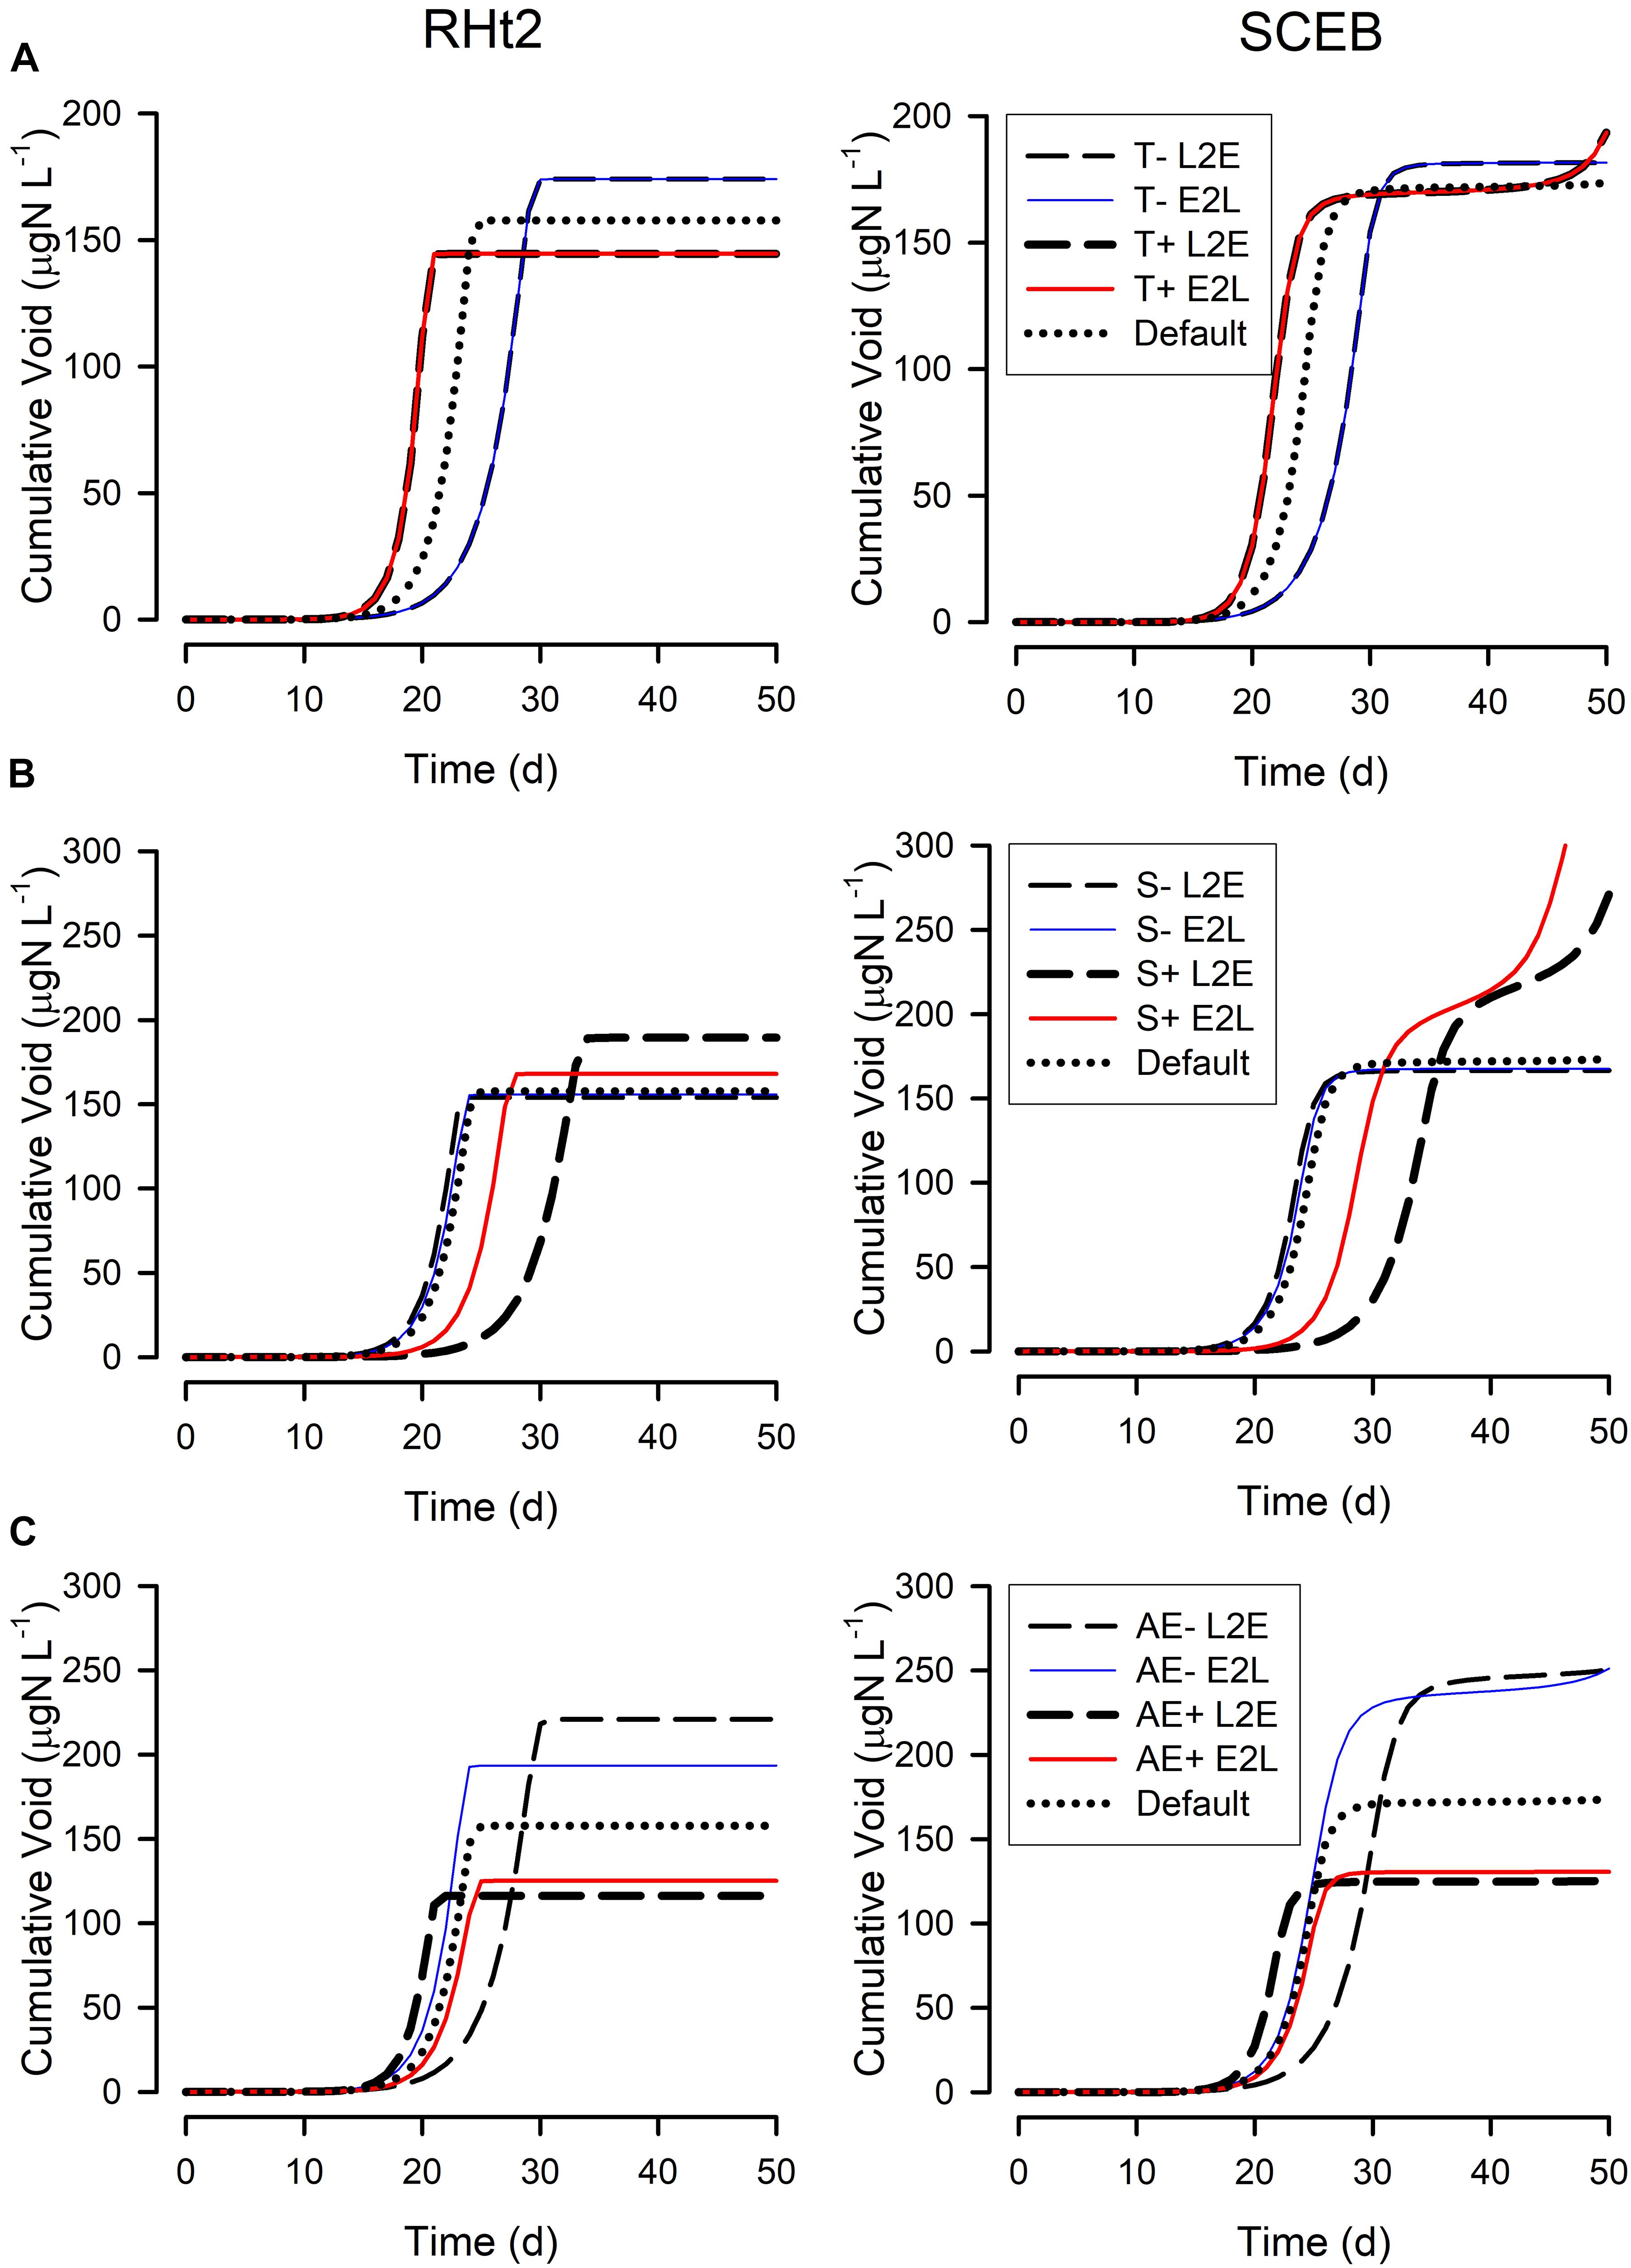
Figure 7. Changes in the cumulated voided material during the simulations shown in Figure 5. See legends for Figures 5, 6 for further details. The cumulative void value is the sum of material voided by the zooplankton (i.e., (1-AE) × grazing); the “Default” plots for RHt2 and SCEB are the same as those shown in Figure 5 for “Cumulative Void.”
The four (L2E or E2L with RHt2 or SCEB) control implementations of the fisheries model StrathE2E gave similar outputs consistent with the minor changes seen between different configurations within the NPZ model (Figure 5). However, when changes in response to climate change were introduced affecting food conversion efficiency (increasing stress and decreasing AE) these different configurations showed similar implications of the effects seen for the NPZ model in Figures 6, 7 but now cascading through a whole ecosystem (Figure 8). In general, decreased food conversion efficiency resulted in decreases in annual abundances for most functional groups, with the greatest impacts on the highest trophic levels (demersal fish, and birds and mammals). At lower trophic levels (phytoplankton and omnivorous zooplankton) the traditional RHt2 + L2E combination formulation resulted in small increases in abundance. Notably though, the greater temporal range in the production of voided material, as seen in the NPZ model with different grazing functions (Figure 7), had important ramification for system dynamics. Thus, taking extremes of RHt2 + L2E vs. SCEB + E2L (dark blue vs. dark red columns in Figure 8), the projections could be overturned in some instances (omnivorous zooplankton, pelagic fish vs. demersal biomass; Figure 8).
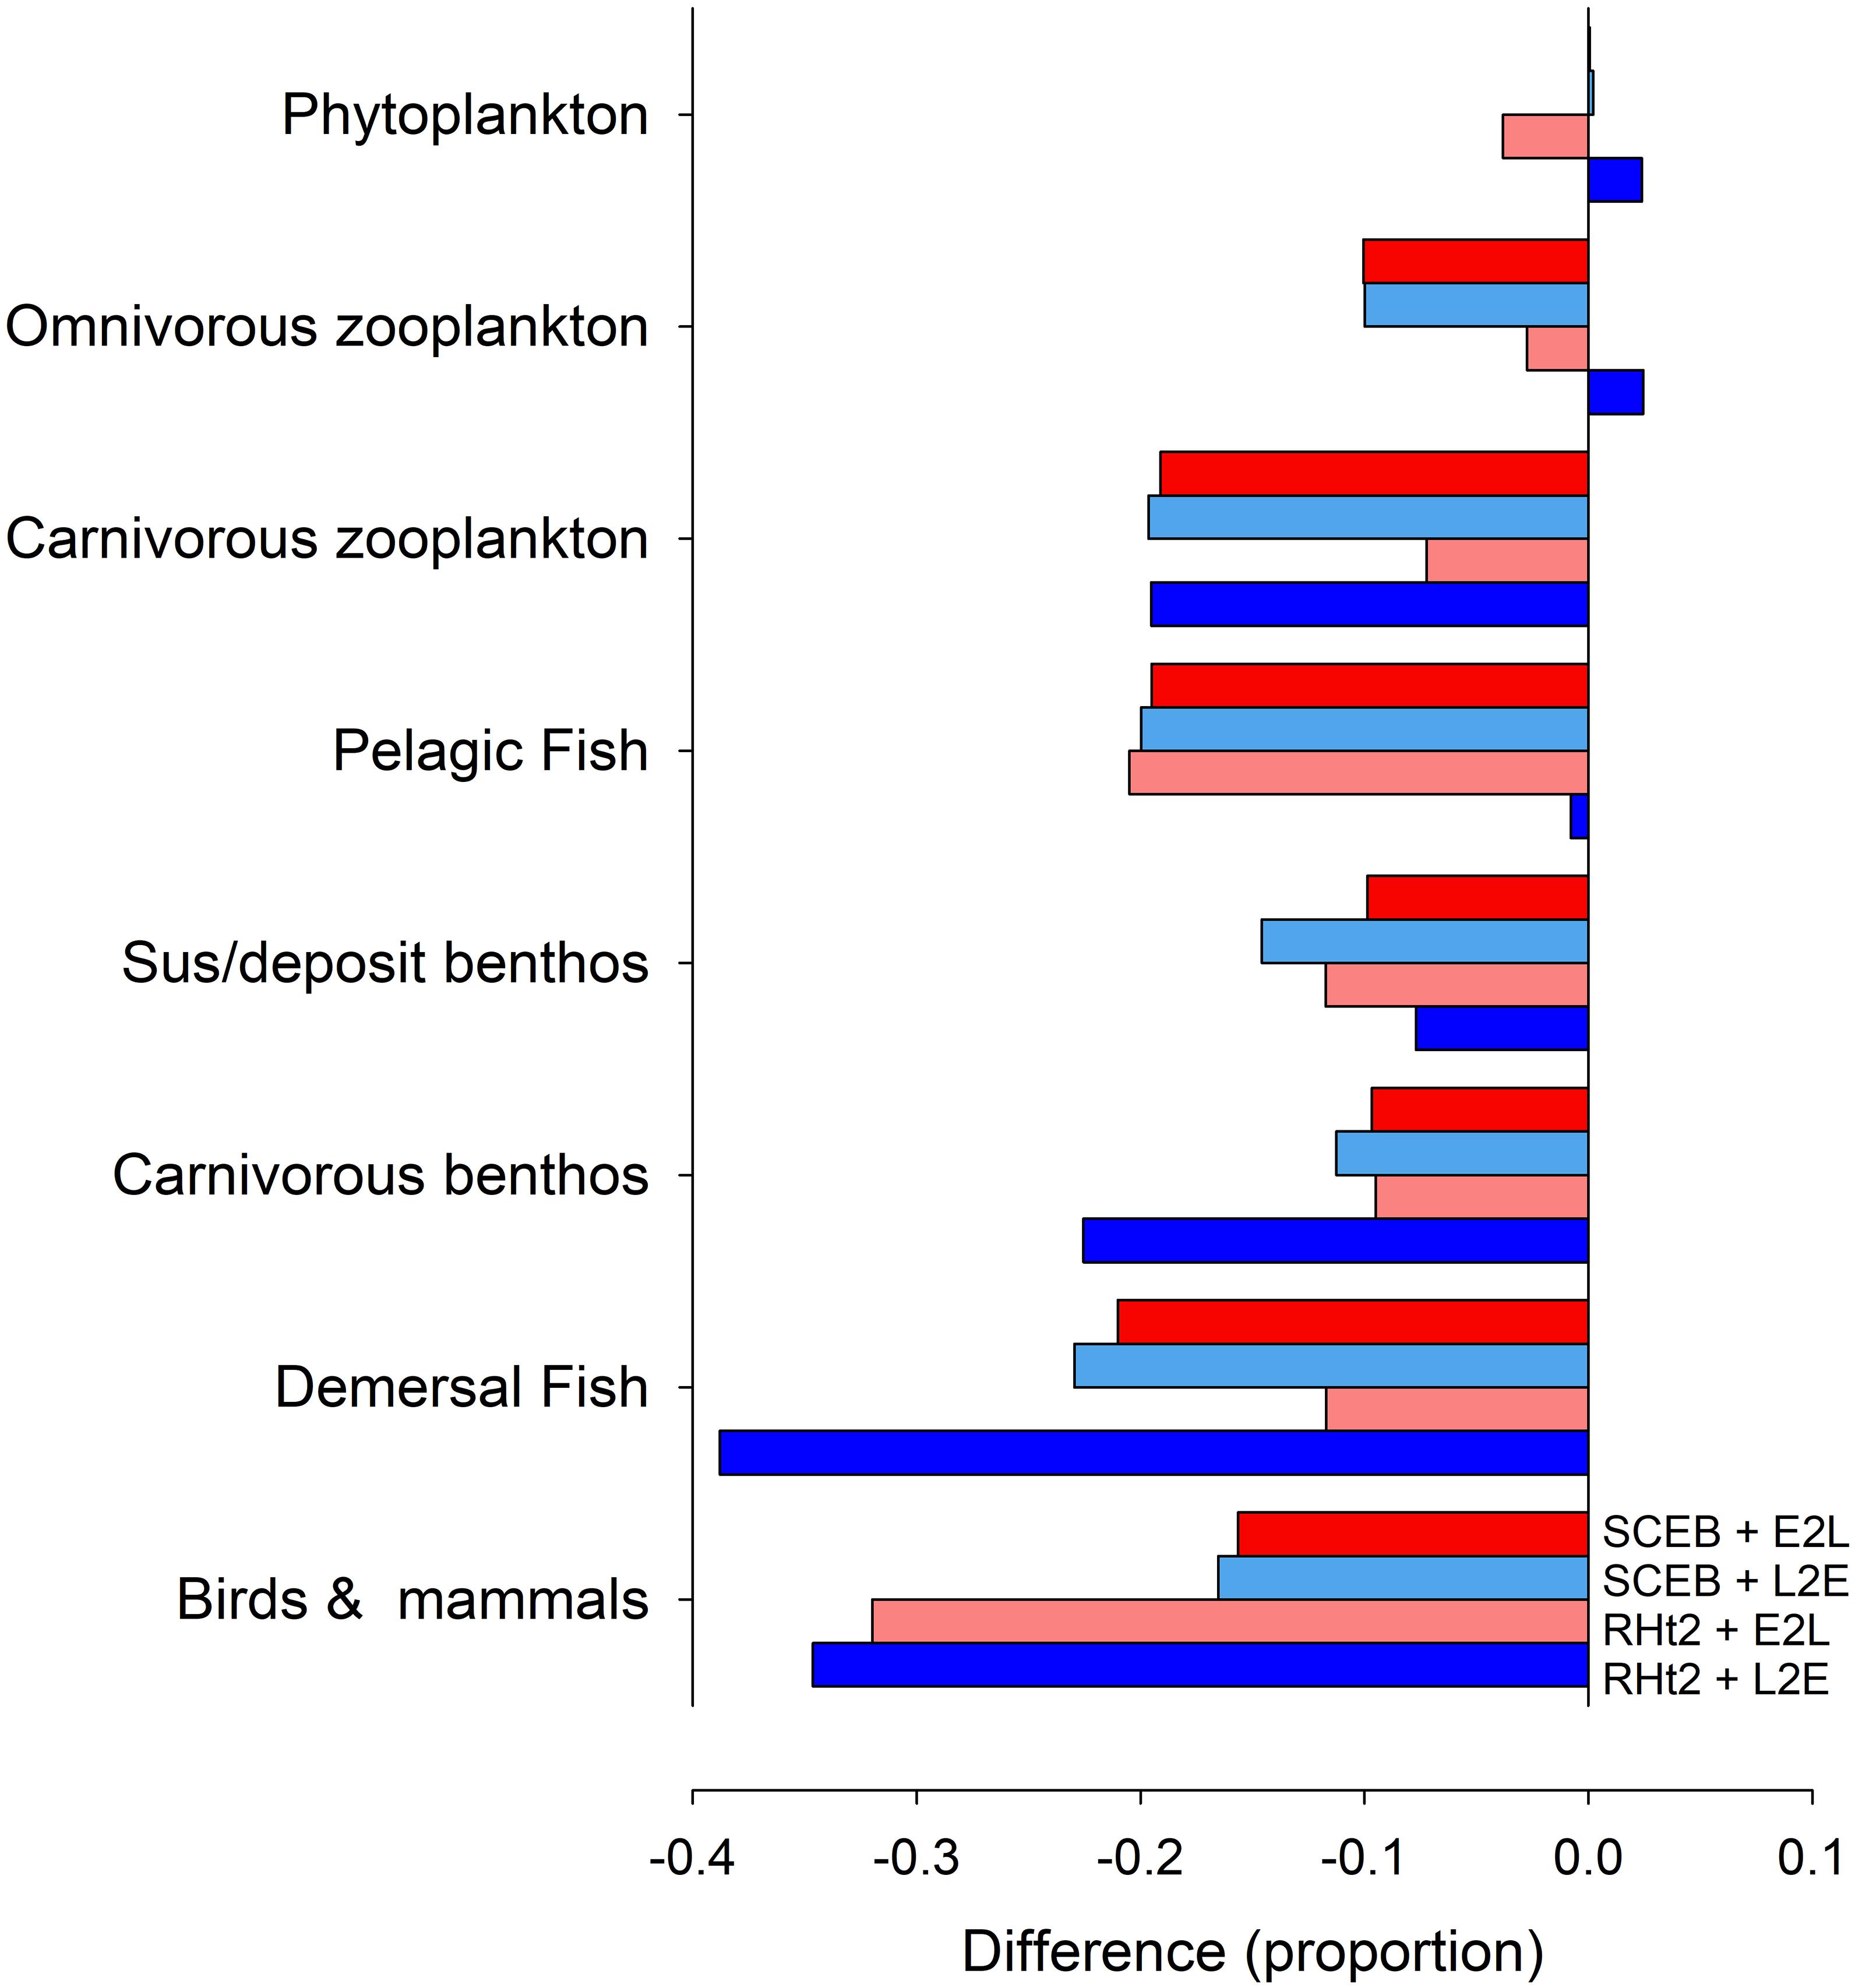
Figure 8. Output generated by the StrathE2E North Sea model showing changes in annual biomass ascribed to different functional groups in consequence to operating under a climate change scenario in comparison with the default (no change) status. The model was run with consumer dynamics operating with the usual RHt2 + L2E configuration deployed for StrathE2E, with RHt2 + E2L, SCEB + L2E or with SCEB + E2L. The climate change scenario is assumed to result in a 10% difference (i.e., 0.1) in food conversion efficiency (see section “Materials and Methods”).
Discussion
The functioning of consumers is a critical determinant in the overall performance of models describing food webs (e.g., for zooplankton – Gentleman et al., 2003; Mitra et al., 2014; Bates et al., 2016). Here it was shown that simple changes to the fundamental features of the conceptual foundation of consumer sub-models radically affect behavior of the overall system, and thence predictive capabilities of the whole model. The activity of consumers depends both in reality and in silico upon the realized rate of grazing and thence the abundance of prey and its quality. Most emphasis in consumer models is directed toward prey capture (e.g., Malard et al., 2020). While RHt2 functions are commonly used as a basis for consumer models (Gentleman et al., 2003), this function is prone to describe implausible encounter, and thence feeding, dynamics (Flynn and Mitra, 2016). The SCEB function has a linear interactive term in common with the initial (low prey abundance) section of the classic Holling type 1 description (Holling, 1965) but couples this to a term linked to gut satiation rather than limitation by handling time (Whelan and Brown, 2005). Further, using SCEB, the value of the maximum possible feeding rate (Gmax) can be altered independently of the encounter slope. In contrast, if the value of Gmax is changed for RHt2 then additional changes in grazing kinetics occur, unless compensatory changes are made also to the half saturation constant (Flynn and Mitra, 2016). The effect of choosing RHt2 vs. SCEB could thus be viewed as being coupled closely to the choice of L2E vs. E2L through scope for the variability of Gmax in E2L.
Although the different consumer model configurations can behave in a similar way (Figures 1, 5), they behave quite differently under conditions that in reality would place different demands upon the physiology of the consumer (Figures 2–4, 6–8). These are the types of conditions that modelers considering the implications of climate change are likely to explore. In complex, multi-trophic applications with the potential for trophic cascades, explored here using StrathE2E, deployment of alternative philosophies configuring consumer activity can have profound effects on simulation output (Figure 8). Depending on the application, such effects could have significant ramifications for our understanding of ecology and for ecosystem management. The magnitude and timing of voided production also affects the recycling of nutrients and allied biogeochemical cycling. Although the relative complexity of the StrathE2E food web means that generalized patterns are hard to extract, the traditional RHt2+L2E implementation (dark blue columns in Figure 8) tended to predict worse impacts from the deterioration in food conversion efficiency than those seen when using E2L implementations (Figure 8). This difference is not uniform across all functional groups, but some differences are of considerable magnitude (ca. 20%; Figure 8). The performance of simple consumer models appears particularly sensitive to values of trophic transfer efficiency (Mitra et al., 2014) as tested here for StrathE2E. This impacts food web dynamics both directly and via the transfer of material to detritus (Figure 7), affecting pelagic vs. demersal biomass in Figure 8. Such changes occur also with density dependant inefficiency of consumers in high food abundance scenarios, with AE declining markedly (Tirelli and Mayzaud, 2005; Flynn, 2009). While the E2L formulation is readily modified to describe such events, L2E cannot as there would be no adjustment of Gmax to enable μ = μmax as AE changes.
Of the four permutations of functions defining consumer activity explored in this work, that most closely according with reality is arguably (see Introduction) a linear initial grazing response curve coupled with a E2L control (SCEB+E2L as implemented here, in Results). This approach is no more complex or computationally expensive to operate than the traditional RHt2+L2E formulation, which on balance appears to be the formulation least likely to best describe biological reality.
Under conditions where factors affecting physiology (temperature, respiration, AE) are not changing during the simulation, arguably it does not matter which approach is used. Differences between the approaches under such situations only become apparent at low prey abundances (Figure 1). Here, RHt2 is more likely to lead to prey extinction, and thence perhaps to extreme predator starvation, because it describes higher consumption rates at low prey abundance. RHt2 forms the base of many predation formulations, such as prey-selection descriptions (Fasham et al., 1990; Gentleman et al., 2003) and the “kill-the-winner” equations (Vallina et al., 2014). In such prey selection equations, part of the functionality of the switching is to divert grazing away from prey at lowest abundance, preventing extinction.
Where these alternate formulations give very different emergent properties is in simulations where events such as climate change, or food quality changes, are considered. Here, where one may expect in reality a reactive compensatory response by consumers in the face of levels of stress that may be manifested by changes in feeding behavior, the E2L formulation appears more appropriate and gives rise to quite different dynamics. Care is also required in selecting consumer formulations in models exploring adaptive evolution, as such models are likely to consider matters affecting resource acquisition (here, prey capture) and exploitation. Thus, in the growth rate evolution model of Flynn and Skibinski (2020), the E2L formulation (with SCEB) was used; the L2E formulation could not allow a useful evolution of μmax.
Conclusion
A better understanding is required about how multiple stressors affect consumer dynamics to better appreciate whether current models are adequately describing climate change and allied implications for fisheries management and biogeochemical models. That decreasing food conversion efficiency by 10%, such as might result from a change in temperature or ocean acidity, could result in different consumer model formulations yielding up to a 100% variation in the projected change in abundances of food web components (especially in the mid-trophic levels; Figure 8) indicates the magnitude of the problem. More questioning is needed of the core features of consumer models both with respect to components (like grazing) that are applied to many functional types, as well as with respect to which functional types are present. The latter includes the recognition of the importance of mixoplankton (Flynn et al., 2019) – protist plankton (including most protist “phytoplankton” and 50% or “protozooplankton”) that photosynthesize and eat – because describing the control of grazing in these mixotrophic organisms is especially problematic (Mitra and Flynn, 2010). In short, the analysis we present points to a need for re-evaluation of some long-accepted principles in consumer-resource modeling across all trophic levels.
Data Availability Statement
Publicly available datasets were analyzed in this study. This data can be found here: within the manuscript and at https://pureportal.strath.ac.uk/en/datasets/strathe2e-marine-foodweb-model.
Author Contributions
KF conceived the idea, and all authors were responsible for its elaboration and the construction and running of the models, and contributed to analysis of the results and writing of the manuscript.
Funding
This work was part funded by the Natural Environment Research Council (NERC, United Kingdom) through its iMARNET programme NE/K001345/1, and through the Marine Ecosystems Programme grant NE/L003120/1. AM was part-funded by the ERDF-WG funded Sêr Cymru MixoHUB project 82372.
Conflict of Interest
The authors declare that the research was conducted in the absence of any commercial or financial relationships that could be construed as a potential conflict of interest.
Publisher’s Note
All claims expressed in this article are solely those of the authors and do not necessarily represent those of their affiliated organizations, or those of the publisher, the editors and the reviewers. Any product that may be evaluated in this article, or claim that may be made by its manufacturer, is not guaranteed or endorsed by the publisher.
Acknowledgments
Thanks to Robert Wilson for comments on an earlier version of this work.
References
Afik, D., and Karasov, W. H. (1995). The trade-offs between digestion rate and efficiency in warblers and their ecological implications. Ecology 76, 2247–2257.
Arora, V. K., Boer, G. J., Friedlingstein, P., Eby, M., Jones, C. D., Christian, J. R., et al. (2013). Carbon–concentration and carbon–climate feedbacks in CMIP5 earth system models. J. Climate 26, 5289–5313. doi: 10.1175/JCLI-D-12-00494.1
Bates, M. L., Cropp, R. A., Hawker, D. W., and Norbury, J. (2016). Which functional responses preclude extinction in ecological population-dynamic models? Ecol. Complex. 26, 57–67. doi: 10.1016/j.ecocom.2016.03.003
Bessler, S., Stubblefield, M. C., Ultsch, G. R., and Secor, S. M. (2010). Determinants and modelling of specific dynamic action for the Common Garter Snake (Thamnophis sirtalis). Can. J. Zool. 88, 808–820. doi: 10.1139/Z10-045
Chenillat, F., Rivière, P., and Ohman, M. D. (2021). On the sensitivity of plankton ecosystem models to the formulation of zooplankton grazing. PLoS One 16:e0252033. doi: 10.1371/journal.pone.0252033
Cohen, J. E., Pimm, S. L., Yodzis, P., and Saldana, J. (1993). Body sizes of animal predators and animal prey in food webs. J. Anim. Ecol. 62, 67–78. doi: 10.2307/5483
Cripps, G., Flynn, K. J., and Lindeque, P. K. (2016). Ocean acidification affects the phyto-zoo plankton trophic transfer efficiency. PLoS One 11:e0151739. doi: 10.1371/journal.pone.0151739
Fasham, M. J. R., Ducklow, H. W., and Mckelvie, S. M. (1990). A nitrogen-based model of plankton dynamics in the oceanic mixed layer. J. Mar. Res. 48, 591–639.
Flynn, K. J. (2009). Food-density dependent inefficiency in animals with a gut as a stabilising mechanism in trophic dynamics. Proc. Roy.Soc. B 276, 1147–1152. doi: 10.1098/rspb.2008.1575
Flynn, K. J. (2018). Dynamic Ecology – an Introduction to the Art of Simulating Trophic Dynamics. Swansea: Swansea University.
Flynn, K. J., and Mitra, A. (2016). Why plankton modellers should reconsider using rectangular hyperbolic (Michaelis-Menten, Monod) descriptions of predator-prey interactions. Front. Mar. Sci. 3:165. doi: 10.3389/fmars.2016.00165
Flynn, K. J., and Skibinski, D. O. F. (2020). Exploring evolution of maximum growth rates in plankton. J. Plankt. Res. 42, 497–513. doi: 10.1093/plankt/fbaa038
Flynn, K. J., Mitra, A., Anestis, K., Anschütz, A. A., Calbet, A., Ferreira, G. D., et al. (2019). Mixotrophic protists and a new paradigm for marine ecology: where does plankton research go now? J. Plankt. Res. 41, 375–391. doi: 10.1093/plankt/fbz026
Gentleman, W., Leising, A., Frost, B., Strom, S., and Murray, J. (2003). Functional responses for zooplankton feeding on multiple resources: a review of assumptions and biological dynamics. Deep-Sea Res. II 50, 2847–2875.
Glickman, N., and Mitchell, H. H. (1948). The total specific dynamic action of high-protein and high-carbohydrate diets on human subjects. J. Nut. 36, 41–57. doi: 10.1093/jn/36.1.41
Hanley, T. C., and La Pierre, K. J. (eds). (2015). Trophic Ecology: Bottom-up and top-Down Interactions Across Aquatic and Terrestrial Systems. Cambridge: Cambridge University Press.
Heath, M. R. (2012). Ecosystem limits to food web fluxes and fisheries yields in the North Sea simulated with an end-to-end food web model. Prog. Oceanogr. 102, 42–66. doi: 10.1016/j.pocean.2012.03.004
Heath, M. R., Cook, R. M., Cameron, A. I., Morris, D. J., and Speirs, D. C. (2014a). Cascading ecological effects of eliminating fishery discards. Nat. Com. 5:3893. doi: 10.1038/ncomms4893
Heath, M. R., Speirs, D. C., and Steele, J. H. (2014b). Understanding patterns and processes in models of trophic cascades. Ecol. Let. 17, 101–114. doi: 10.1111/ele.12200
Holling, C. S. (1965). The functional response of predators to prey density and its role in mimicry and population regulation. Mem. Entomol. Soc. Can. 97, 5–60.
Houston, A., Higginson, A. S., and McNamara, J. (2011). Optimal foraging for multiple nutrients in an unpredictable environment. Ecol. Let. 14, 1101–1107. doi: 10.1111/j.1461-0248.2011.01678.x
Kruse, P. D., Toft, S., and Sunderland, K. D. (2008). Temperature and prey capture: opposite relationships in two predator taxa. Ecol. Entomol. 33, 305–312. doi: 10.1111/j.1365-2311.2007.00978.x
Lehette, P., Ting, S. M., Chew, L.-L., and Chong, V. C. (2016). Respiration rates of the copepod Pseudodiaptomus annandalei in tropical waters: beyond the thermal optimum. J. Plankt. Res. 38, 456–467. doi: 10.1093/plankt/fbv119
Malard, J., Adamowski, J., Nassar, J. B., Anandaraja, N., Tuy, H., and Melgar-Quiñonez, H. (2020). Modelling predation: theoretical criteria and empirical evaluation of functional form equations for predator-prey systems. Ecol. Model. 437:109264. doi: 10.1016/j.ecolmodel.2020.109264
McCue, M. D. (2006). Specific dynamic action: a century of investigation. Comp. Biochem. Physiol. A Mol. Integr. Physiol. 144, 381–394. doi: 10.1016/j.cbpa.2006.03.011
Mitra, A. (2006). A multi-nutrient model for the description of stoichiometric modulation of predation (SMP) in micro- and mesozooplankton. J. Plankt. Res. 28, 597–611.
Mitra, A., and Flynn, K. J. (2006). Accounting for variation in prey selectivity by zooplankton. Ecol. Mod. 199, 82–92. doi: 10.1111/jfb.12924
Mitra, A., and Flynn, K. J. (2007). Importance of interactions between food quality, quantity, and gut transit time on consumer feeding, growth, and trophic dynamics. Am. Nat 169, 632–646. doi: 10.1086/513187
Mitra, A., and Flynn, K. J. (2010). Modelling mixotrophy in harmful algal blooms: More or less the sum of the parts? J. Mar. Sys. 83, 158–169. doi: 10.1016/j.jmarsys.2010.04.006
Mitra, A., Castellani, C., Gentleman, W. C., Jónasdóttir, S. H., Flynn, K. J., Bode, A., et al. (2014). Bridging the gap between marine biogeochemical and fisheries sciences; configuring the zooplankton link. Prog. Oceanogr. B 129, 76–199. doi: 10.1016/j.pocean.2014.04.025
Morris, D., Cameron, A., Heath, M. R., and Speirs, D. C. (2014). Global sensitivity analysis of an end-to-end marine ecosystem model of the North Sea: factors affecting the biomass of fish and benthos. Ecol. Mod. 273, 251–263. doi: 10.1016/j.ecolmodel.2013.11.019
Öhlund, G., Hedström, P., Norman, S., Hein, C. L., and Englund, G. (2015). Temperature dependence of predation depends on the relative performance of predators and prey. Proc. R. Soc. B 282:20142254. doi: 10.1098/rspb.2014.2254
Plagányi, E. E. (2007). Models for an Ecosystem Approach to Fisheries. FAO (Food and Agriculture Organization of the United Nations) Fisheries Technical Paper 477. Rome: FAO.
Pope, E. C., Ellis, R. P., Scolamacchia, M., Scolding, J. W. S., Keay, A., Chingombe, P., et al. (2014). European sea bass, Dicentrarchus labrax, in a changing ocean. Biogeoscience 11, 2519–2530.
Schaffner, L. R., Govaert, L., De Meester, L., Ellner, S. P., Fairchild, E., Miner, B. E., et al. (2019). Consumer-resource dynamics is an eco-evolutionary process in a natural plankton community. Nat. Ecol. Evol. 3, 1351–1358. doi: 10.1038/s41559-019-0960-9
Secor, S. M. (2008). Specific dynamic action: a review of the postprandial metabolic response. J. Comp. Physiol. B 179, 1–56. doi: 10.1007/s00360-008-0283-7
Tirelli, V., and Mayzaud, P. (2005). Relationship between functional response and gut transit time in the calanoid copepod Acartia clausi: role of food quantity and quality. J. Plankt. Res. 27, 557–568. doi: 10.1093/plankt/fbi031
Trumble, S. J., and Castellini, M. A. (2005). Diet mixing in an aquatic carnivore, the harbour seal. Can. J. Zoo. 83, 851–859. doi: 10.1016/j.scitotenv.2020.142842
Ullah, H., Nagelkerken, I., Goldenberg, S. U., and Fordham, D. A. (2018). Climate change could drive marine food web collapse through altered trophic flows and cyanobacterial proliferation. PLoS Biol. 16:e2003446. doi: 10.1371/journal.pbio.2003446
Vallina, S. M., Ward, B. A., Dutkiewicz, S., and Follows, M. J. (2014). Maximal feeding with active prey-switching: a kill-the-winner functional response and its effect on global diversity and biogeography. Prog. Oceanogr. 120, 93–109. doi: 10.1016/j.pocean.2013.08.001
Visser, A. W., and Kiørboe, T. (2006). Plankton motility patterns and encounter rates. Oecologia 148, 538–546. doi: 10.1007/s00442-006-0385-4
Whelan, C. J., and Brown, J. S. (2005). Optimal foraging and gut constraints: reconciling two schools of thought. Oikos 110, 481–496.
Wood, S. N., and Thomas, M. B. (1999). Super-sensitivity to structure in biological models. Proc. R. Soc. Lond. B 266, 565–570. doi: 10.1098/rspb.1999.0673
Keywords: consumer dynamics, monod grazing, holling, feeding kinetics, trophic dynamics, predator-prey
Citation: Flynn KJ, Speirs DC, Heath MR and Mitra A (2021) Subtle Differences in the Representation of Consumer Dynamics Have Large Effects in Marine Food Web Models. Front. Mar. Sci. 8:638892. doi: 10.3389/fmars.2021.638892
Received: 07 December 2020; Accepted: 25 October 2021;
Published: 16 November 2021.
Edited by:
Fabio A. Madau, University of Sassari, ItalyReviewed by:
Tatiana Margo Tsagaraki, University of Bergen, NorwaySiti Nor Fatihah, Politeknik Jeli Kelantan, Malaysia
Copyright © 2021 Flynn, Speirs, Heath and Mitra. This is an open-access article distributed under the terms of the Creative Commons Attribution License (CC BY). The use, distribution or reproduction in other forums is permitted, provided the original author(s) and the copyright owner(s) are credited and that the original publication in this journal is cited, in accordance with accepted academic practice. No use, distribution or reproduction is permitted which does not comply with these terms.
*Correspondence: Kevin J. Flynn, S0pGQFBNTC5hYy51aw==
†ORCID: Kevin J. Flynn, orcid.org/0000-0001-6913-5884; Douglas C. Speirs, orcid.org/0000-0002-4367-1459; Michael R. Heath, orcid.org/0000-0001-6602-3107; Aditee Mitra, orcid.org/0000-0001-5572-9331