Abstract
This study compares the noise levels at the cold-water coral Tisler reef, before and after the closure of the border between Norway and Sweden, which occurred as a direct result of the COVID-19 pandemic. The Tisler reef is a marine protected area located under a ferry “highway” that connects Norway and Sweden. Cold-water coral reefs are recognised as being important hotspots of both biodiversity and biomass, they function as breeding and nursing grounds for commercially important fish and are essential in providing ecosystem functions. Whilst studies have shown that fishery, ocean warming, and acidification threaten them, the effects of noise pollution on cold-water coral reefs remains unstudied. To study the severity of noise pollution at the Tisler reef, a long-term acoustic recorder was deployed from 29 January 2020 until 26 May 2020. From 15 March COVID-19 lockdown measures stopped passenger vessel traffic between Norway and Sweden. This study found that the overall noise levels were significantly lower after border closure, due to reduced ferry traffic, wind speeds, and sea level height. When comparing the median hourly noise levels of before vs. after border closure, this study measured a significant reduction in the 63–125 Hz 1/3 octave band noise levels of 8.94 ± 0.88 (MAD) dB during the day (07:00:00–19:59:59) and 1.94 ± 0.11 (MAD) dB during the night (20:00:00–06:59:59). Since there was no ferry traffic during the night, the drop in noise levels at night was likely driven by seasonal changes, i.e., the reduction in wind speed and sea level height when transitioning from winter to spring. Taking into account this seasonal effect, it can be deduced that the COVID-19 border closure reduced the noise levels in the 63–125 Hz 1/3 octave bands at the Tisler reef by 7.0 ± 0.99 (MAD) dB during the day. While the contribution of, and changes in biological, weather-related and geophysical sound sources remain to be assessed in more detail, understanding the extent of anthropogenic noise pollution at the Tisler cold-water coral reef is critical to guide effective management to ensure the long-term health and conservation of its ecosystem functions.
Introduction
Coral reefs are not restricted to the shallow tropics, they also thrive in the cold aphotic waters at depths of 40–2,000 m (Davies et al., 2008; Morato et al., 2020; Sundahl et al., 2020), with some cold-water corals being able to grow as deep as 6,000 m (Roberts et al., 2009). Cold-water corals occur throughout the world’s oceans and form complex reef ecosystems that can be 10–100s m in height, constructed by only a handful of scleractinian coral species [Lophelia pertusa (Recently synonymised to Desmophyllum pertusum (Addamo et al., 2016)), Madrepora Ocolata, Solenosmilia variabilis, Oculina varicose] (Roberts et al., 2009). The extensive reef structures they build can be of considerable age, with nearshore reefs in Norway dating back to 8,600 years before present (Wisshak et al., 2005) and deeper off-shore cold-water coral carbonate mounds likely being thousands to millions of years old, with some continuously growing for at least the last circa 11,000 years (Roberts et al., 2006; Wheeler et al., 2007; Mienis et al., 2009; Van der Land et al., 2014).
In contrast to tropical corals, cold-water corals lack the presence of symbiotic zooxanthellae algae, giving them white to orange coloured polyps (Hennige et al., 2014; De Clippele et al., 2019; Figure 1). They opportunistically feed on dissolved organic matter, bacteria, algae, and zooplankton (Mueller et al., 2014). They are ecologically important as hotspots of biomass (De Clippele et al., 2021) and biodiversity (Buhl-Mortensen et al., 2010; Henry et al., 2010; Kazanidis et al., 2016), function as breeding and nursing grounds for fish (Baillon et al., 2012), sharks and skates (Henry et al., 2013, 2016), are paleoclimatic archives (Douarin et al., 2014) and are essential in providing ecosystem functions such as carbon and nitrogen recycling (van Oevelen et al., 2009; Cathalot et al., 2015; Rovelli et al., 2015; de Froe et al., 2019; Maier et al., 2020; De Clippele et al., 2021).
FIGURE 1
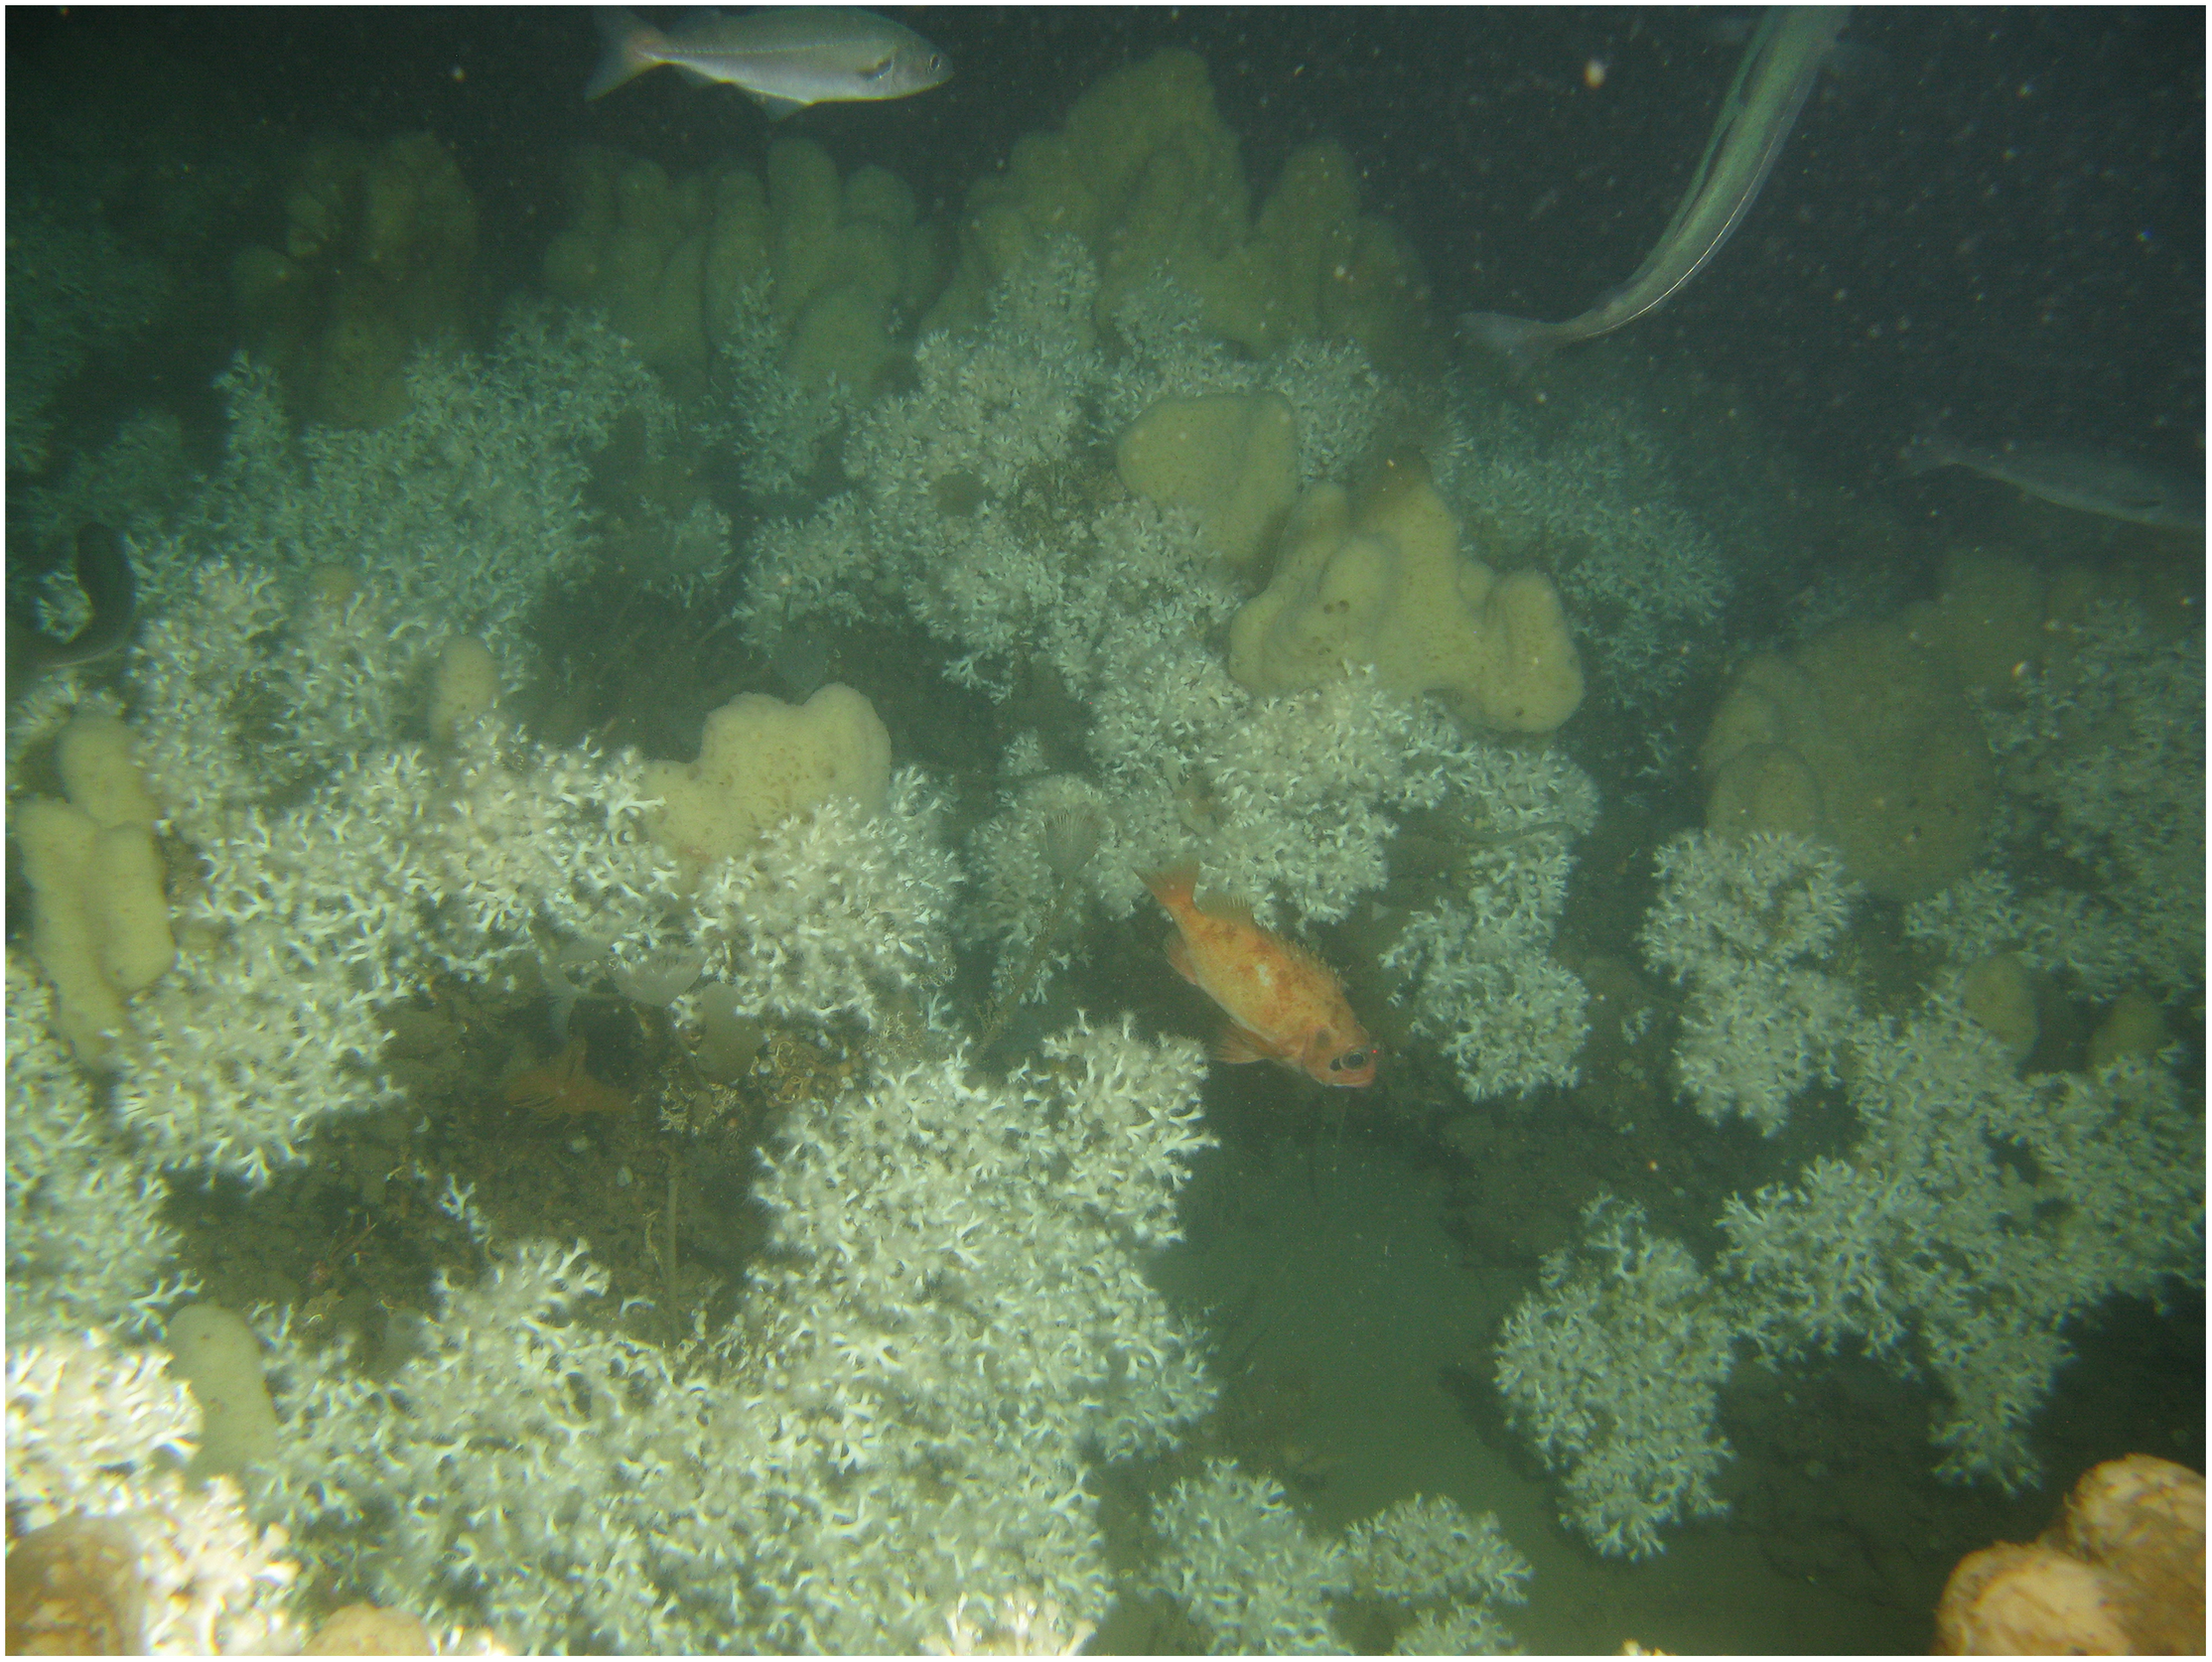
Dense coverage of the cold-water scleractinian coral Lophelia pertusa at the Tisler reef with the sponge Mycale lingua growing within its framework, the fish Sebastes sp. and the fish Pollachius sp. (Saithe).
Due to recent advances in technology, there has been a dramatic increase in our understanding of these diverse ecosystems, as well as growing evidence that many cold-water coral habitats have been degraded by bottom trawling and are threatened by ocean warming and acidification (Wheeler et al., 2005; Clark et al., 2006; Roberts et al., 2009; Hennige et al., 2015; Sweetman et al., 2017; Morato et al., 2020).
Since the industrial revolution, the number of powered vessels has grown rapidly, bringing with them a new type of pollution, noise pollution (Andrew et al., 2002, 2011; Frisk, 2012; Simmonds et al., 2014; Duarte et al., 2021). A recent review summarises the current knowledge on how the prevalence and intensity of anthropogenic noise pollution can affect the behaviour, physiology and ecology of tropical coral reef organisms (Ferrier-pages et al., 2021). For example, noise pollution can cause sensory confusion, or mask communication among reef animals (Simpson et al., 2011; Carroll et al., 2017; Stanley et al., 2017), which can produce sounds during reproductive behaviour, territorial defence and predator deterrence (Myrberg and Fuiman, 2002). However, due to their often remote and inaccessible nature, the prevalence, noise levels, and effects of noise pollution have not been studied yet for cold-water coral reefs.
Acoustic landscapes, or soundscapes, are composed of biological, geophysical, and anthropogenic sounds. In healthy tropical coral reefs, the soundscape is typically dominated by biological sounds produced by, for example, grunting fish and snapping shrimps (Piercy et al., 2014). In the last two decades advances in technology have allowed us to study cold-water coral reefs, and simultaneously noise pollution from ships have increasingly affected marine soundscapes. While the effects of noise pollution on terrestrial ecosystems have been recognised, the effects on marine ecosystems are still widely understudied (Duarte et al., 2021). Anthropogenic noise, including vessel noise, can affect all frequencies (Duarte et al., 2021), but the 1/3–octave bands centred at 63, 100 and 125 Hz have often been used as indicators of low-frequency vessel noise (Tasker et al., 2010; Peng et al., 2015; Merchant et al., 2016; Thomson and Barclay, 2020). These frequency bands were selected as they are generally less influenced by pseudo flow noise and wind noise (Wenz, 1962; Strasberg, 1979; Bassett et al., 2014; Peng et al., 2015; Merchant et al., 2016).
A global slowdown in private and commercial shipping traffic as a measure to mitigate the threat of COVID-19 to human life and welfare has inadvertently resulted in a natural “before and after impact” experiment offering unanticipated insight into how human behaviour affects ocean noise levels. Already in the first quarter of 2020, large negative trends of 2.3–7.1 dB at 100 Hz have been observed near the port of Vancouver, Canada, coinciding with a 21.5% reduction in Automatic Identification System (AIS) ship-tracking transmissions (Thomson and Barclay, 2020). In terrestrial rural and urban environments, drops of 3.6–7.4 dB in the ambient noise levels led to positive changes in the communication distance and salience of the performance of the songs of birds (Derryberry et al., 2020). These drastic changes shown for these two habitats raise the question of what the extent and effect is of the reduction of anthropogenic noise pollution due to COVID-19 in other ecological systems, including cold-water coral reefs, which are currently understudied in terms of their soundscape.
This study quantified the prevalence and the noise levels at the Tisler cold-water coral reef in Norway before and after the international border between Sweden and Norway closed on 15 March 2020 as a result of the COVID-19 pandemic.
Materials and Methods
Study Area
The Tisler cold-water coral reef lies in the north-eastern part of the Skagerrak in the Hvaler area in Norway (Lavaleye et al., 2009; Figure 2). North of Tisler Island, the reef grows in a NW–SE direction in the Ytre Hvaler, a 48-km-long ocean channel through which Atlantic water of around 8°C flows (Wagner et al., 2011; Guihen et al., 2013; De Clippele et al., 2018). The reef is approximately 8,600–8,700 year old (Wisshak et al., 2005), 1.2 km long, 200 m wide and has live coral growing between 70 and 160 m depth (Lavaleye et al., 2009; De Clippele et al., 2018). The Tisler Reef has been protected against bottom-impacting fishing techniques by Norwegian fishery regulations since 2003 (Fosså et al., 2010).
FIGURE 2
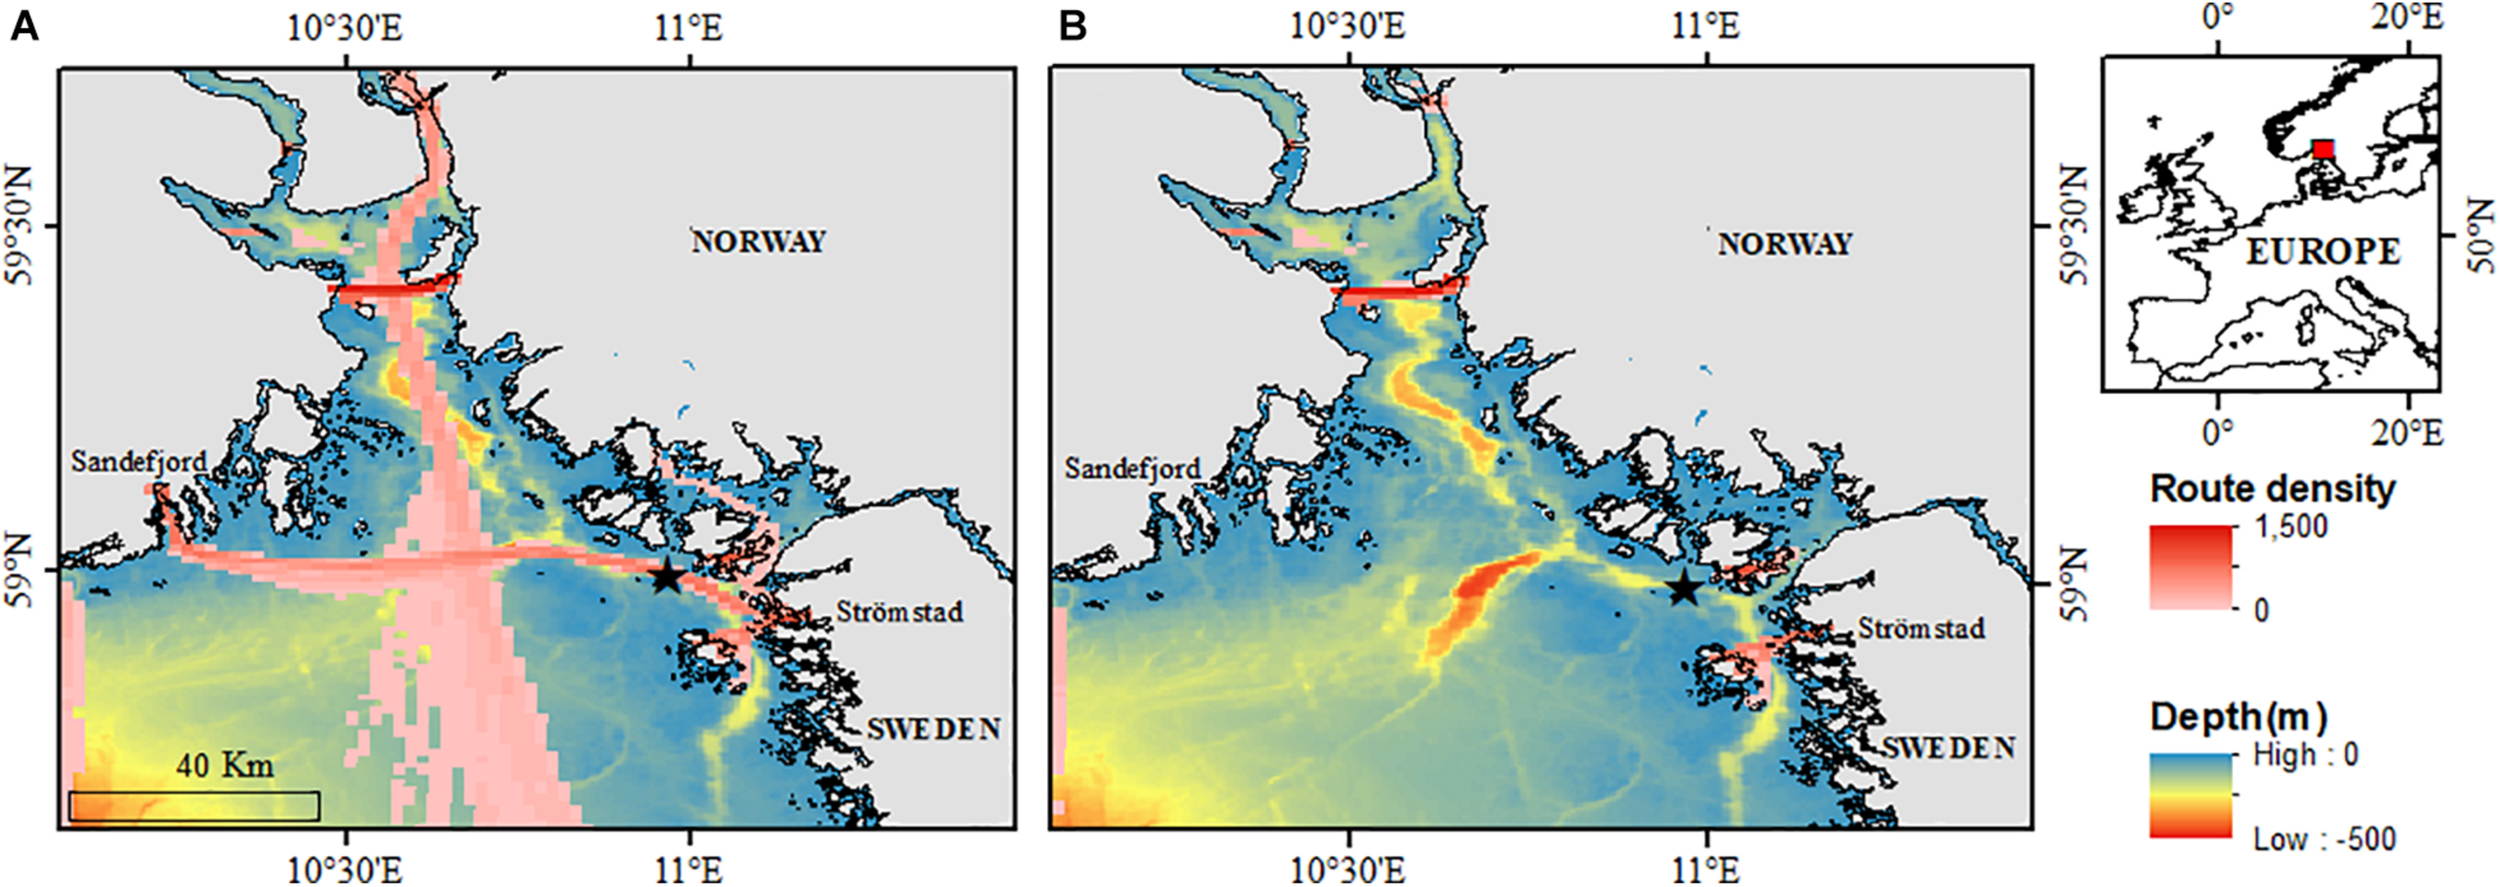
Map indicating the location of the Tisler cold-water coral reef (black star and red square) and the passenger routes density (Source: EMODnet Human Activities: EMSA Route Density Map) in (A) February 2020 (before COVID-19 border closure) and (B) April 2020 (after COVID-19 border closure).
Acoustic Data Analysis
We established a recording station at 120 m depth on the southeast side of the Tisler reef (Longitude: 10.970683, Latitude: 58.9947) to collect long-term passive acoustic underwater recordings from 12:00:00 (CET) 29 January 2020 to 00:45:01 (CEST) 26 May 2020. The local time switched from CET to CEST on 29 March 2020. The SoundTrap ST500 long-term recorder (Ocean Instruments, Auckland, New Zealand) used for this study, sampled at 96,000 Hz, providing an effective analysis bandwidth of 20–60,000 Hz. The sensitivity of the whole system chain (recorder, hydrophone and applied gain) was -175.5 dB re 1 V/μPa at 250 Hz. Recordings were saved in the lossless X3 compressed file format (Johnson et al., 2013). The recorder was fixed at approximately 3.5 m above the seafloor using submersible floats attached to a deep-sea acoustic release canister (ARC) (RS Aqua, United Kingdom). The ARC allowed for a quick recovery without leaving the anchor behind in the Tisler reef, a marine protected area. The acoustic recorder collected data continuously for 118 days. After the recorder was retrieved, waveform audio files were generated using the SoundTrap Host for further analysis. Visual inspections with a remotely operated vehicle (ROV) indicated the ST500 was surrounded by rubble, dead coral framework, and live coral colonies.
The sound pressure levels were further quantified by 1/3–octave bands (TOB) from 20 to 20,000 Hz using the “TOL” (Third Octave Levels) function in PAMGuide to describe distributions and trends in noise levels. For the statistical analyses, hourly medians of the TOBs were calculated in R using the openair package (Carslaw and Ropkins, 2012).
Spectrograms (Window type: Hanning, 50%, hop size: 256, DFT size: 512 samples, grid spacing: 188 Hz) generated using Raven Pro 1.6.1 (K. Lisa Yang Center for Conservation Bioacoustics, 2019) were used to visually pinpoint the closest point of approach (CPA) of the ferries to the acoustic recordings.
Passenger Vessel Traffic
The Tisler reef is located under a ferry “highway” between Sandefjord (Norway) and Strömstad (Sweden). The recorder was located approximately 91 m from this ferry “highway.” Three types of ferries are used by two companies. The company ColorLine uses the M/S Colour Viking (capacity: 1,720 passengers, 370 cars) and, their second vessel, the world’s largest plug-in hybrid, runs on batteries to reduce its noise level (capacity: 2,000 passengers). The third vessel is run by Fjordline and is slightly smaller (capacity: 1,350 passengers). Unless there is a cancellation due to bad weather or docking periods, the ferries will sail up to 12 times a day above the reef (Figure 2 and Table 1).
TABLE 1
| Colorline | Fjordline | |
| From Sandefjord to Strömstad | 07:00, 10:00, 13:30, 17:00 | 08:30, 15:20 |
| From Strömstad to Sandefjord | 10:00, 13:40, 17:00, 20:00 | 12:00, 18:30 |
Departure times of the two ferry companies that sail between Sandefjord and Strömstad, 2020.
Due to the closure of borders between Norway and Sweden, as a result of the COVID-19 pandemic, there were no sailings from March 15, 2020 to the present (May 2021) (Figure 2A vs. Figure 2B). In the period between 29 January and 15 March, consistent strong signals from the passing ferries, lasting for ∼30 min, had an approximate CPA, as determined by visual inspection of the sound files, at 07:50, 09:25, 09:30, 11:03, 11:29, 13:09, 14:25, 16:17, 16:30, 17:52, 17:57, and 19:27 on each day of the week.
Route Density
The total and average monthly route density of marine vessels (i.e., passenger, fishing, cargo, tanking, and all other types) were calculated using the open source EMODnet Human Activities EMSA Route Density Maps. Route density maps were downloaded as .TIF format for February, March, April and May 2020 and imported in the ArcGIS 10.1, ESRI Software. The “Extract by mask” ArcGIS tool was used to clip these route density maps to an area of 100 km2 around the Tisler reef. The ArcGIS “raster to point” tool was then used to create an attribute table from which the total and average monthly route density of marine vessels could be extracted and calculated.
Shipping Noise Indicators
While all the TOB can be affected by vessel noise (Hildebrand, 2009; McKenna et al., 2012), the ones centred at 63, 79, 100, and 125 Hz were used, as these are the current noise indicators of low-frequency vessel noise in an European management context (Dekeling et al., 2016; Garrett et al., 2016), and are less influenced by flow and wind noise (Wenz, 1962; Tasker et al., 2010; Peng et al., 2015; Merchant et al., 2016; Thomson and Barclay, 2020).
Environmental Variables
Hourly data on the wind speed (m/s) and sea level height (cm) were downloaded from the Nordkoster and Kungsvik SMHI meteorological stations1. A categorical variable “ferry” was created, representing the hours at which the ferry would have their CPA to the recorder on the reef and were labelled as “ferry passage” vs. “no ferry passage” [i.e., 07:00, 09:00, 11:00, 13:00, 14:00, 16:00, 17:00, and 19:00 (CET)]. The latter was determined by checking repeated patterns of vessel passage over the reef in Raven Pro 1.6.1 (see section Acoustic data analyses).
Statistical Analyses
The 25th percentile, median, mean absolute deviation (MAD), and 75th percentile of the median hourly TOB sound pressure levels, were used to assess the change in noise levels before (29 January–14 March 2020) and during (15 March–26 May 2020) border closure in the statistical software R (R Development Core Team, 2010; Wickham, 2011).
The distribution of the response variables (TOB) did not follow a Gaussian distribution. Therefore the more flexible Generalised Linear Modelling (GLM) approach was used. The probability distributions of the noise levels analysed here belong to the exponential quasi-Poisson family (McCullagh and Nelder, 1989; Dobson and Barnett, 2008). The software R was used to perform the GLM. The GLM models were run four times for all TOB (25–15,849 Hz). Once for daytime recordings (07:00:00–19:59:59) before (593 samples) and after closure (936 samples) and once for nighttime recordings (20:00:00–06:59:59) before (499 samples) and after border closure (795 samples). The model performance of the quasi-Poission GLM regressions were indicated by the quasi-Akaike information criterion (QAIC) (Bolker, 2020). A lower QAIC indicates a better goodness of fit. Correlation between variables was tested using the cor.test() function in R. No variables were correlated and since no ferries run at night this variable was excluded from the nighttime models.
Data Visualisation
The ggplot2 package in R was used to plot the seasonal variables against the shipping noise indicators and the higher frequency TOB that according to the Wenz curve should be heavily influenced by wind (100–10,000 Hz) (Wenz, 1962). A LOESS curve was fitted with a span of 0.05 to make the comparison of the trends more intuitive.
To assess daily and weekly noise level changes, the hourly median 63–125 Hz TOB were plotted using the timeVariation function from the openair package in R (Carslaw and Ropkins, 2012). Diurnal and weekly changes were assessed separately for the data collected before (29 January–14 March 2020) and during (15 March–26 May 2020) border closure. This function plots the 95% confidence intervals and the median, which were calculated through bootstrap simulation, providing the diurnal variation of the noise levels. These plots were used to identify any diurnal or weekly patterns in elevated noise levels in the before and after periods.
Results
Route Density
In February and March 2020, passenger route density (RD) is the highest, while in April and May fishing RD is the highest compared to the other vessel types (Figure 3 and Table 2). The route density of cargo vessels remain relatively similar from February to May 2020. From February to May 2020, the total marine vessel RD increased 15%, passenger RD decreased 47%, cargo RD increased 8%, fishing RD increased 46%, tanker RD decreased 2%, and all other types of vessel RD increased 76% within the 100 km2 area around the Tisler reef (Figure 3 and Table 2).
FIGURE 3
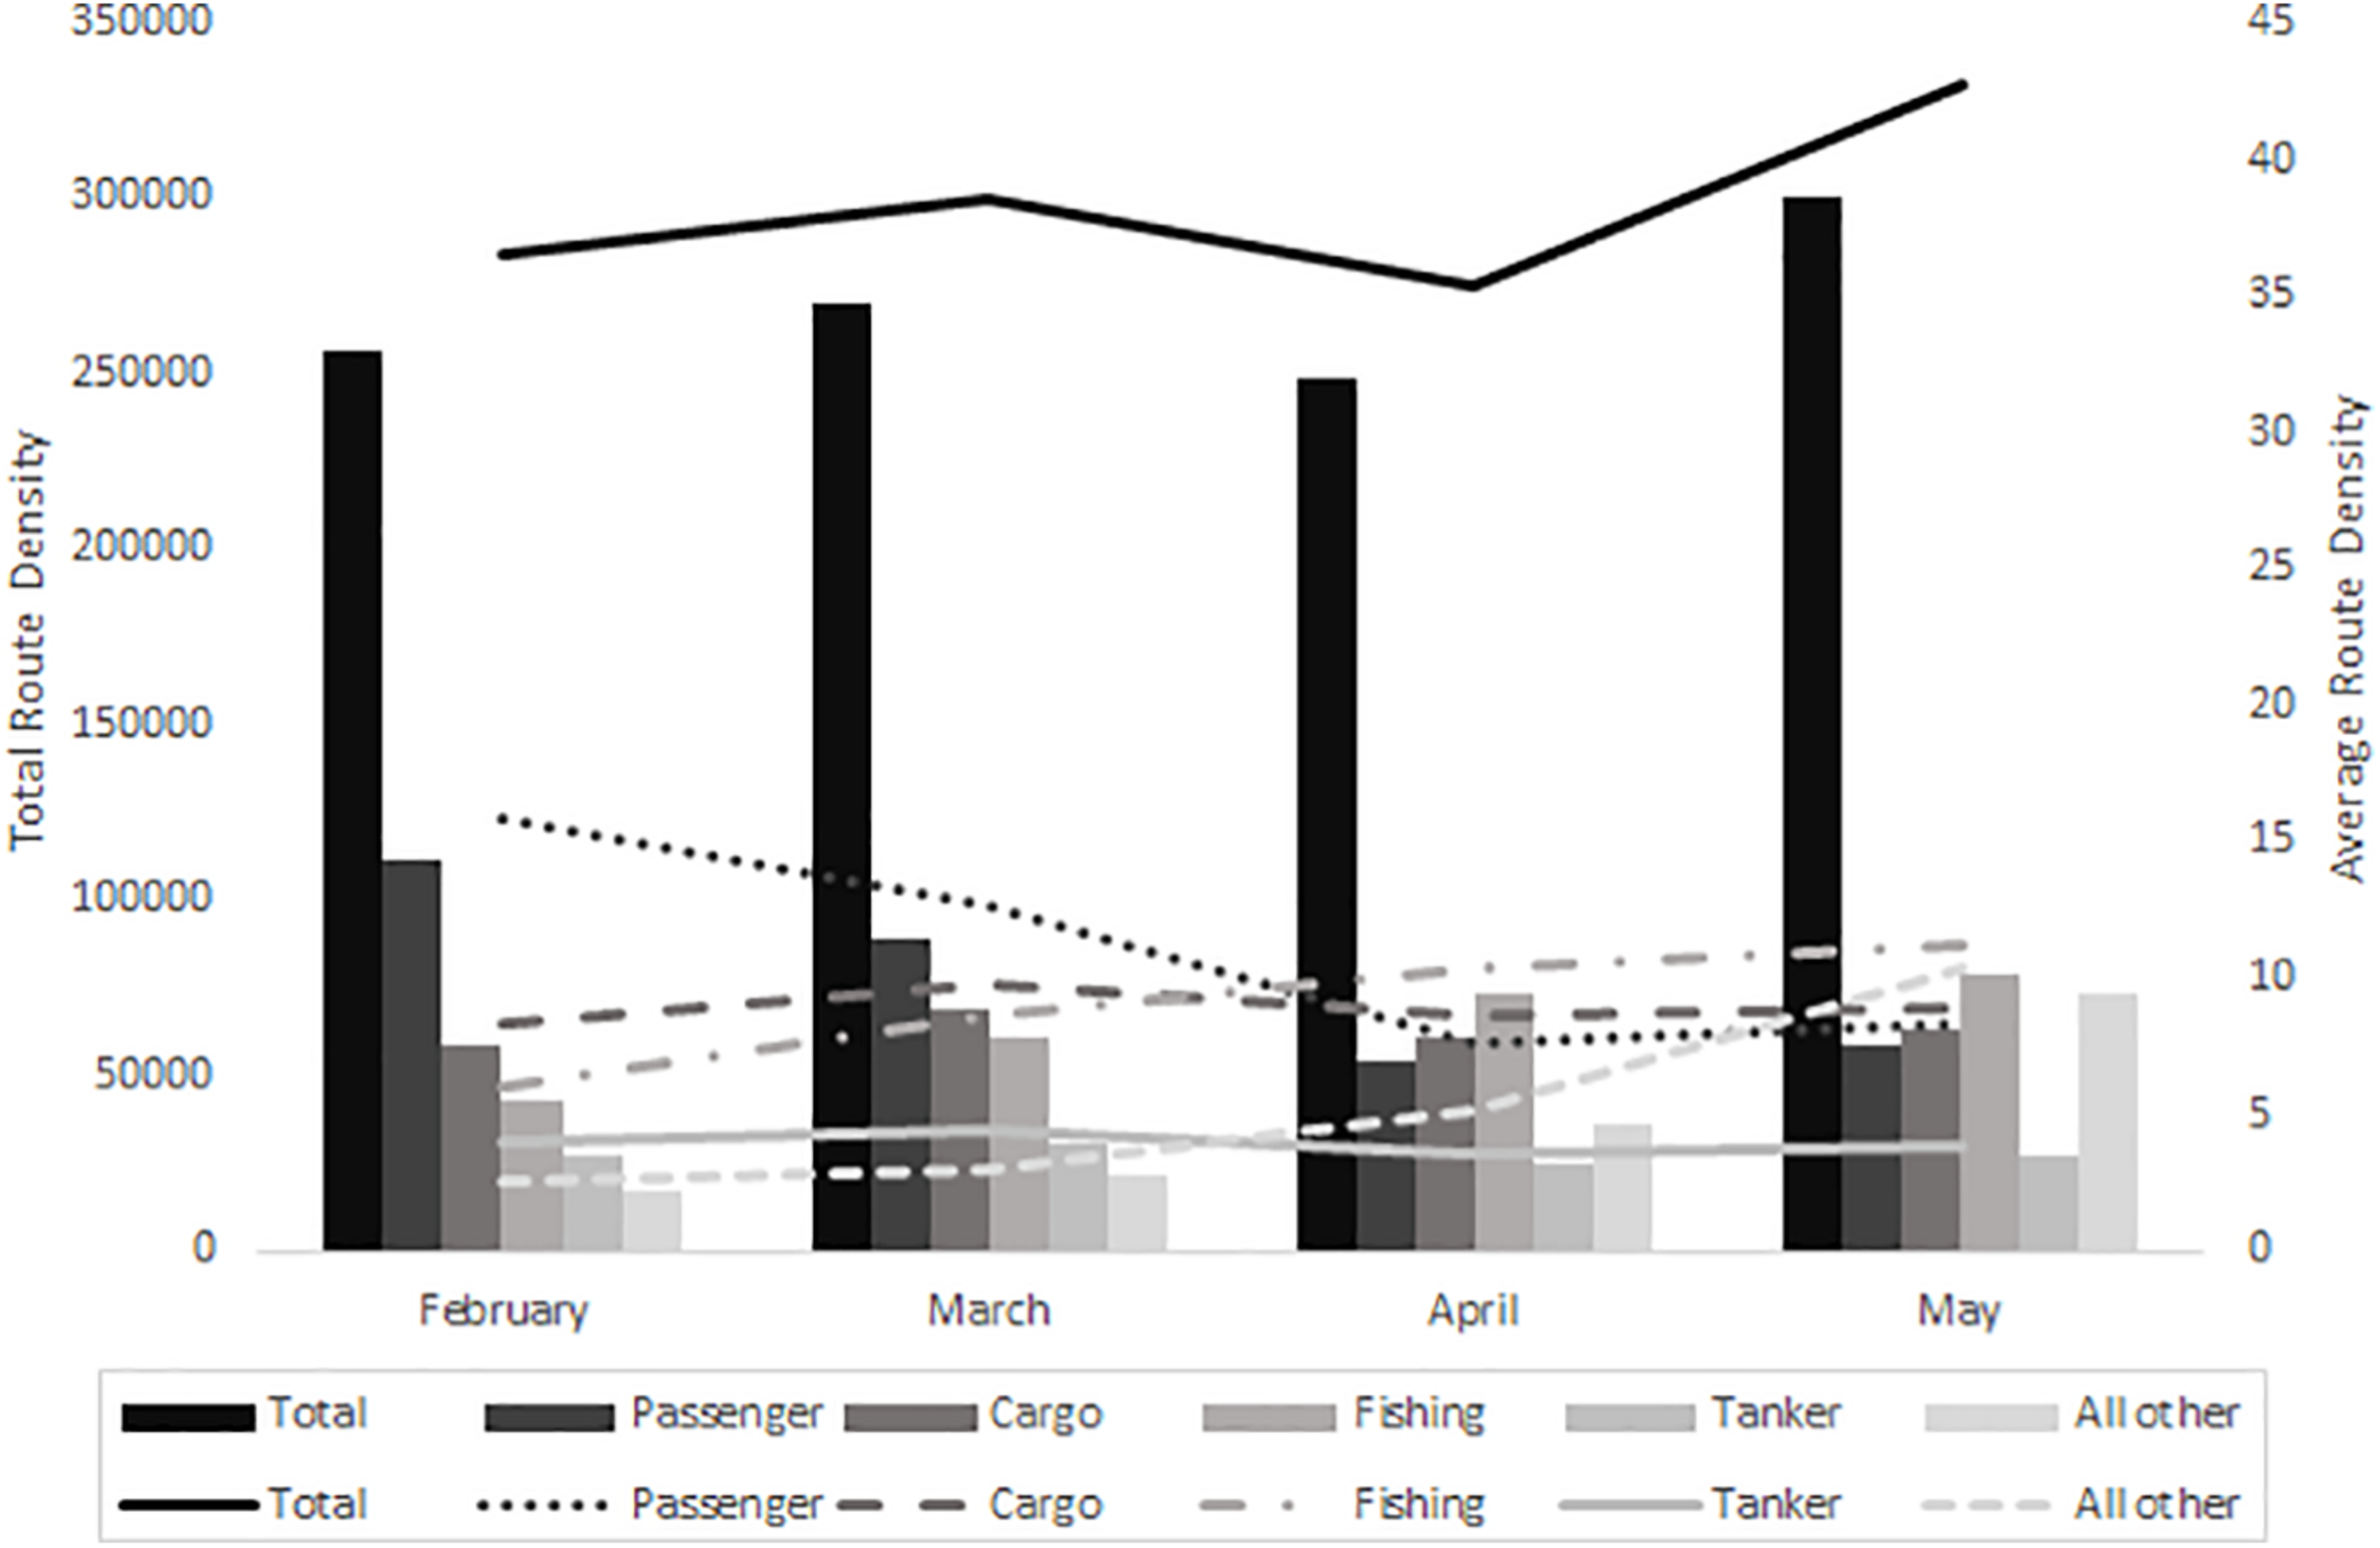
Bar and line diagram showing the total (primary axis) and average (secondary axis) route density (routes per km2) of the total, passenger, cargo, fishing, tanker, and all other types of ships within the 100 km2 area around the Tisler reef.
TABLE 2
| Vessel type | February |
March |
April |
May |
||||
| Total | Av. | Total | Av. | Total | Av. | Total | Av. | |
| Total | 256,452 | 36.57 | 270,384 | 38.56 | 248,565 | 35.5 | 300,288 | 42.82 |
| Passenger | 110,959 | 15.82 | 89,166 | 12.72 | 53,736 | 7.66 | 58,855 | 8.39 |
| Cargo | 58,106 | 8.29 | 68,946 | 9.83 | 60,603 | 8.64 | 62,923 | 8.97 |
| Fishing | 42,398 | 6.05 | 60,431 | 8.61 | 72,694 | 10.4 | 78,666 | 11.21 |
| Tanker | 27,634 | 3.94 | 30,583 | 4.36 | 25,169 | 3.59 | 27,152 | 3.87 |
| All other | 17,355 | 2.47 | 21,258 | 3.03 | 36,363 | 5.18 | 72,692 | 10.36 |
Total and average route density (routes per km2) of the total, passenger, cargo, fishing, tanker, and all other types of vessels within the 100 km2 area around the Tisler reef (Source: EMODnet Human Activities: EMSA Route Density Map).
Statistical Analysis
When comparing the noise levels before vs. after the borders closed and ferry traffic ceased, the difference between hourly median TOB (25–15,849 Hz) ranged from 0.6 to 6.9 dB at night and from 0.8 to 9.8 dB during the day. The shipping noise indicators (63–125 Hz), had a reduction of 8.9 ± 0.9 (MAD) dB during the day and 1.9 ± 0.1 (MAD) dB during the night (Table 3). Before lockdown, the median noise levels were 3.5 ± 2.19 (MAD) dB higher during the day vs. the night. After lockdown, the noise levels were 0.9 ± 0.52 (MAD) dB higher during the day vs. the night (Table 3).
TABLE 3
| NIGHT (20:00:00–06:59:59) |
DAY (07:00:00–19:59:59) |
|||||||||||||||||
| Before border closure |
After border closure |
Before border closure |
After border closure |
|||||||||||||||
| 25th Perc. | Median | ± MAD | 75th Perc. | 25th Perc. | Median | ± MAD | 75th Perc. | ≠ | 25th Perc. | Median | ± MAD | 75th Perc. | 25th Perc. | Median | ± MAD | 75th Perc. | ≠ | |
| 25 Hz | 72.3 | 82.9 | 16.9 | 100.4 | 70.9 | 75.9 | 8.6 | 90.9 | –6.9 | 73.6 | 83.6 | 16.9 | 104.3 | 71.3 | 75.3 | 7.2 | 87.9 | –8.3 |
| 32 Hz | 71.9 | 77.2 | 9.3 | 91.1 | 71.2 | 75.1 | 6.6 | 87.5 | –2.1 | 74.6 | 83.7 | 14.8 | 97.0 | 71.5 | 74.8 | 5.7 | 84.9 | –8.9 |
| 40 Hz | 72.2 | 75.5 | 6.8 | 86.4 | 71.7 | 73.5 | 3.3 | 80.9 | –2.0 | 74.4 | 80.8 | 11.1 | 92.3 | 72.0 | 73.8 | 3.3 | 80.4 | –7.1 |
| 50 Hz | 72.0 | 75.4 | 6.9 | 84.6 | 72.1 | 73.7 | 2.9 | 78.9 | –1.7 | 74.9 | 81.9 | 11.4 | 91.1 | 72.5 | 74.3 | 3.4 | 79.7 | –7.6 |
| 63 Hz | 71.1 | 75.2 | 7.2 | 82.7 | 71.7 | 73.4 | 3.2 | 78.3 | –1.7 | 75.6 | 83.5 | 11.2 | 90.8 | 72.1 | 74.0 | 3.5 | 79.5 | –9.5 |
| 79 Hz | 70.9 | 75.5 | 8.0 | 82.3 | 71.8 | 73.6 | 3.2 | 77.8 | –1.9 | 76.8 | 84.5 | 10.7 | 91.2 | 72.4 | 74.7 | 4.2 | 79.6 | –9.8 |
| 100 Hz | 70.3 | 76.2 | 8.3 | 80.9 | 71.6 | 74.1 | 4.5 | 78.4 | –2.0 | 77.7 | 84.0 | 9.9 | 90.8 | 72.4 | 75.6 | 5.3 | 80.3 | –8.4 |
| 125 Hz | 70.2 | 76.7 | 8.7 | 81.8 | 71.5 | 74.7 | 5.5 | 79.1 | –2.0 | 78.2 | 84.1 | 9.0 | 90.1 | 72.8 | 76.7 | 6.0 | 80.9 | –7.4 |
| 158 Hz | 70.6 | 77.5 | 8.6 | 82.4 | 71.6 | 75.6 | 6.6 | 80.6 | –1.9 | 78.6 | 84.1 | 8.1 | 89.4 | 73.5 | 77.6 | 6.5 | 82.4 | –6.4 |
| 200 Hz | 70.7 | 77.8 | 9.8 | 84.2 | 72.0 | 76.8 | 7.1 | 81.6 | –1.0 | 79.2 | 85.0 | 8.4 | 90.5 | 74.6 | 78.9 | 6.6 | 83.4 | –6.2 |
| 251 Hz | 71.1 | 78.8 | 10.9 | 85.9 | 72.9 | 78.2 | 7.4 | 82.9 | –0.6 | 80.2 | 86.0 | 7.4 | 90.6 | 75.6 | 80.1 | 6.5 | 84.4 | –5.9 |
| 316 Hz | 71.5 | 80.2 | 10.9 | 86.7 | 73.7 | 79.5 | 7.4 | 84.0 | –0.7 | 81.2 | 86.6 | 6.9 | 90.7 | 76.5 | 80.9 | 6.3 | 85.0 | –5.6 |
| 398 Hz | 72.9 | 81.7 | 10.4 | 87.8 | 74.9 | 80.6 | 7.1 | 84.6 | –1.1 | 81.6 | 86.7 | 6.7 | 90.7 | 77.5 | 81.9 | 6.0 | 85.6 | –4.8 |
| 501 Hz | 73.4 | 85.6 | 10.8 | 89.0 | 75.7 | 82.0 | 7.1 | 85.7 | –3.7 | 82.4 | 87.5 | 6.7 | 91.6 | 78.4 | 82.8 | 5.8 | 86.3 | –4.6 |
| 631 Hz | 73.7 | 83.0 | 10.4 | 89.0 | 75.6 | 81.9 | 7.2 | 85.7 | –1.0 | 82.5 | 87.2 | 6.5 | 91.2 | 78.6 | 82.9 | 5.6 | 86.1 | –4.3 |
| 794 Hz | 73.8 | 83.0 | 10.6 | 89.1 | 75.4 | 81.9 | 7.1 | 85.7 | –1.2 | 81.7 | 87.0 | 6.8 | 91.1 | 78.5 | 82.6 | 5.7 | 86.2 | –4.4 |
| 1,000 Hz | 74.3 | 83.2 | 10.4 | 89.2 | 75.3 | 81.7 | 7.3 | 85.8 | –1.5 | 81.3 | 86.7 | 7.1 | 91.1 | 78.5 | 82.7 | 5.6 | 86.1 | –4.0 |
| 1,259 Hz | 74.0 | 83.2 | 10.4 | 89.2 | 75.2 | 81.7 | 7.1 | 85.7 | –1.5 | 80.9 | 86.2 | 7.3 | 90.7 | 78.2 | 85.4 | 5.8 | 86.0 | –0.8 |
| 1,585 Hz | 73.6 | 82.9 | 10.5 | 88.9 | 74.3 | 81.1 | 7.6 | 85.4 | –1.9 | 80.2 | 85.7 | 7.5 | 90.2 | 77.5 | 82.0 | 6.0 | 85.7 | –3.7 |
| 1,995 Hz | 73.3 | 82.7 | 10.6 | 88.8 | 73.8 | 80.8 | 7.7 | 85.2 | –2.0 | 79.3 | 85.4 | 7.8 | 90.1 | 77.0 | 81.5 | 6.1 | 85.4 | –3.8 |
| 2,512 Hz | 73.3 | 82.2 | 10.4 | 88.1 | 73.1 | 79.8 | 7.9 | 84.4 | –2.3 | 78.8 | 84.6 | 7.8 | 89.3 | 76.2 | 80.7 | 6.0 | 84.6 | –3.9 |
| 3,162 Hz | 73.4 | 82.7 | 10.5 | 88.7 | 73.6 | 80.4 | 7.9 | 85.0 | –2.3 | 79.2 | 85.1 | 7.9 | 89.8 | 76.8 | 81.3 | 6.0 | 85.1 | –3.8 |
| 3,981 Hz | 73.0 | 82.1 | 10.4 | 87.9 | 73.0 | 80.0 | 7.9 | 84.4 | –2.1 | 78.3 | 84.5 | 7.9 | 89.0 | 76.5 | 80.9 | 5.9 | 84.6 | –3.6 |
| 5,012 Hz | 72.5 | 81.2 | 10.0 | 86.8 | 72.2 | 78.9 | 7.7 | 83.4 | –2.3 | 77.2 | 83.5 | 7.7 | 87.9 | 75.8 | 79.9 | 5.6 | 83.5 | –3.6 |
| 6,310 Hz | 72.5 | 80.9 | 9.7 | 86.2 | 72.0 | 78.6 | 7.5 | 83.0 | –2.3 | 76.6 | 83.0 | 7.4 | 87.2 | 75.5 | 79.6 | 5.5 | 83.1 | –3.4 |
| 7,943 Hz | 72.6 | 80.3 | 9.2 | 85.6 | 71.8 | 78.2 | 7.3 | 82.6 | –2.1 | 76.0 | 82.3 | 7.3 | 86.5 | 75.0 | 79.1 | 5.5 | 82.6 | –3.2 |
| 10,000 Hz | 72.6 | 79.7 | 8.9 | 84.8 | 71.9 | 77.7 | 7.1 | 82.0 | –2.0 | 75.4 | 81.6 | 6.9 | 85.6 | 74.5 | 78.5 | 5.4 | 82.0 | –3.1 |
| 12,589 Hz | 72.8 | 79.5 | 8.1 | 84.2 | 72.3 | 77.3 | 6.6 | 81.6 | –2.2 | 75.3 | 81.0 | 6.2 | 84.6 | 74.2 | 78.1 | 5.4 | 81.5 | –2.9 |
| 15,849 Hz | 73.1 | 79.2 | 6.6 | 83.0 | 72.5 | 76.8 | 6.1 | 80.8 | –2.3 | 75.1 | 80.4 | 5.0 | 83.1 | 74.0 | 77.4 | 5.0 | 80.7 | –3.0 |
Median noise levels (dB re 1 μPa) of the 1/3 octave bands.
Comparing day and night before (29 January–14 March 2020) and after border closure (15 March –26 May 2020). The 25th and 75th percentile as well as the mean absolute deviation (MAD) are given. The difference (≠) indicates how much the noise levels (dB) have reduced after the border closure between Norway and Sweden because of the COVID-19 pandemic.
During the day, the variable “ferry” and “wind speed” significantly affected the variability in shipping noise indicator levels before border closure, while “wind speed” and “sea level” affected the variability in the noise levels after border closure (Table 4). During the night, “wind speed” and “sea level” affected the variability in the noise levels, although this is not or less significant at the 63 and 79 Hz TOB after border closure (Table 4). However, wind speed had a strong effect on almost all TOB throughout this time series (Figure 4 and Table 4). Before border closure, sea level affected noise levels the least during the day and the most during the night. After border closure, sea level mostly affected the TOB above and below the 251–3981 Hz TOB. The seasonal changes in the wind speed and sea level are given in Table 5.
TABLE 4
| NIGHT (20:00:00–06:59:59) |
DAY (07:00:00–19:59:59) |
|||||||||||||
| Before border closure |
After border closure |
Before border closure |
After border closure |
|||||||||||
| QAIC | Wind speed | Sea level | QAIC | Wind speed | Sea level | QAIC | Ferry | Wind speed | Sea level | QAIC | Ferry | Wind speed | Sea level | |
| 25 Hz | 2.58 | 0.202 | 0.878 | 1.92 | 0.065 | < 0.05 | 2.76 | 0.276 | 0.268 | 0.056 | 1.83 | 0.992 | < 0.05 | <0.001 |
| 32 Hz | 1.72 | 0.473 | 0.693 | 1.51 | < 0.05 | <0.05 | 1.72 | < 0.001 | 0.106 | < 0.05 | 1.41 | 0.95 | < 0.05 | <0.05 |
| 40 Hz | 1.17 | 0.209 | 0.409 | 0.82 | < 0.01 | <0.01 | 1.18 | < 0.001 | <0.01 | < 0.05 | 0.76 | 0.96 | < 0.001 | <0.001 |
| 50 Hz | 0.89 | < 0.01 | 0.168 | 0.6 | 0.053 | < 0.05 | 0.89 | < 0.001 | <0.001 | < 0.05 | 0.57 | 0.938 | < 0.001 | <0.001 |
| 63 Hz | 0.74 | < 0.001 | 0.056 | 0.55 | 0.06 | < 0.01 | 0.78 | < 0.001 | <0.001 | 0.097 | 0.53 | 0.64 | < 0.001 | <0.001 |
| 79 Hz | 0.54 | < 0.001 | <0.05 | 0.45 | 0.219 | 0.09 | 0.71 | < 0.001 | <0.001 | 0.162 | 0.46 | 0.792 | < 0.001 | <0.001 |
| 100 Hz | 0.35 | < 0.001 | <0.001 | 0.41 | < 0.001 | <0.05 | 0.63 | < 0.001 | <0.001 | 0.261 | 0.44 | 0.755 | < 0.001 | <0.001 |
| 125 Hz | 0.28 | < 0.001 | <0.001 | 0.4 | < 0.001 | <0.05 | 0.56 | < 0.001 | <0.001 | 0.432 | 0.46 | 0.833 | < 0.001 | <0.001 |
| 158 Hz | 0.24 | < 0.001 | <0.001 | 0.42 | < 0.001 | <0.05 | 0.49 | < 0.001 | <0.001 | 0.586 | 0.45 | 0.737 | < 0.001 | <0.001 |
| 200 Hz | 0.23 | < 0.001 | <0.001 | 0.4 | < 0.001 | <0.05 | 0.47 | < 0.001 | <0.001 | 0.486 | 0.42 | 0.538 | < 0.001 | <0.001 |
| 251 Hz | 0.23 | < 0.001 | <0.001 | 0.41 | < 0.001 | 0.112 | 0.42 | < 0.001 | <0.001 | 0.697 | 0.39 | 0.691 | < 0.001 | <0.01 |
| 316 Hz | 0.23 | < 0.001 | <0.001 | 0.39 | < 0.001 | 0.376 | 0.37 | < 0.001 | <0.001 | 0.665 | 0.34 | 0.74 | < 0.001 | <0.01 |
| 398 Hz | 0.25 | < 0.001 | <0.01 | 0.38 | < 0.001 | 0.351 | 0.35 | < 0.001 | <0.001 | 0.731 | 0.32 | 0.712 | < 0.001 | <0.05 |
| 501 Hz | 0.24 | < 0.001 | <0.01 | 0.38 | < 0.001 | 0.602 | 0.33 | < 0.001 | <0.001 | 0.73 | 0.29 | 0.884 | < 0.001 | 0.084 |
| 631 Hz | 0.23 | < 0.001 | <0.01 | 0.37 | < 0.001 | 0.884 | 0.31 | < 0.001 | <0.001 | 0.708 | 0.27 | 0.922 | < 0.001 | 0.195 |
| 794 Hz | 0.24 | < 0.001 | <0.01 | 0.36 | < 0.001 | 0.783 | 0.29 | < 0.001 | <0.001 | 0.835 | 0.28 | 0.742 | < 0.001 | 0.668 |
| 1,000 Hz | 0.22 | < 0.001 | <0.01 | 0.35 | < 0.001 | 0.496 | 0.27 | < 0.001 | <0.001 | 0.788 | 0.26 | 0.692 | < 0.001 | 0.861 |
| 1,259 Hz | 0.22 | < 0.001 | <0.01 | 0.36 | < 0.001 | 0.508 | 0.24 | < 0.001 | <0.001 | 0.829 | 0.25 | 0.693 | < 0.001 | 0.861 |
| 1,585 Hz | 0.22 | < 0.001 | <0.01 | 0.34 | < 0.001 | 0.118 | 0.24 | < 0.001 | <0.001 | 0.829 | 0.25 | 0.678 | < 0.001 | 0.283 |
| 1,995 Hz | 0.2 | < 0.001 | <0.01 | 0.33 | < 0.001 | 0.066 | 0.22 | < 0.001 | <0.001 | 0.764 | 0.23 | 0.718 | < 0.001 | 0.237 |
| 2,512 Hz | 0.17 | < 0.001 | <0.01 | 0.3 | < 0.001 | <0.05 | 0.2 | < 0.001 | <0.001 | 0.636 | 0.22 | 0.77 | < 0.001 | 0.221 |
| 3,162 Hz | 0.19 | < 0.001 | <0.01 | 0.3 | < 0.001 | <0.05 | 0.2 | < 0.001 | <0.001 | 0.693 | 0.22 | 0.76 | < 0.001 | 0.15 |
| 3,981 Hz | 0.16 | < 0.001 | <0.01 | 0.27 | < 0.001 | <0.01 | 0.19 | < 0.001 | <0.001 | 0.735 | 0.2 | 0.811 | < 0.001 | 0.086 |
| 5,012 Hz | 0.14 | < 0.001 | <0.01 | 0.23 | < 0.001 | <0.01 | 0.18 | < 0.001 | <0.001 | 0.814 | 0.18 | 0.823 | < 0.001 | <0.05 |
| 6,310 Hz | 0.12 | < 0.001 | <0.01 | 0.21 | < 0.001 | <0.001 | 0.16 | < 0.001 | <0.001 | 0.926 | 0.16 | 0.821 | < 0.001 | <0.05 |
| 7,943 Hz | 0.1 | < 0.001 | <0.01 | 0.18 | < 0.001 | <0.001 | 0.15 | < 0.001 | <0.001 | 0.696 | 0.15 | 0.814 | < 0.001 | <0.01 |
| 10,000 Hz | 0.09 | < 0.001 | <0.01 | 0.15 | < 0.001 | <0.001 | 0.14 | < 0.001 | <0.001 | 0.47 | 0.13 | 0.844 | < 0.001 | <0.001 |
| 12,589 Hz | 0.09 | < 0.001 | <0.05 | 0.12 | < 0.001 | <0.01 | 0.13 | < 0.001 | <0.001 | 0.265 | 0.11 | 0.908 | < 0.001 | <0.001 |
Table showing goodness of fit (QAIC) and the statistical significance (p-values) of the GLM regression analyses of day and nighttime noise levels before (29 January–14 March 2020) and after border closure (15 March–26 May 2020), accounting for the predictor variables ferry, wind speed (m/s), and sea level height (cm).
FIGURE 4
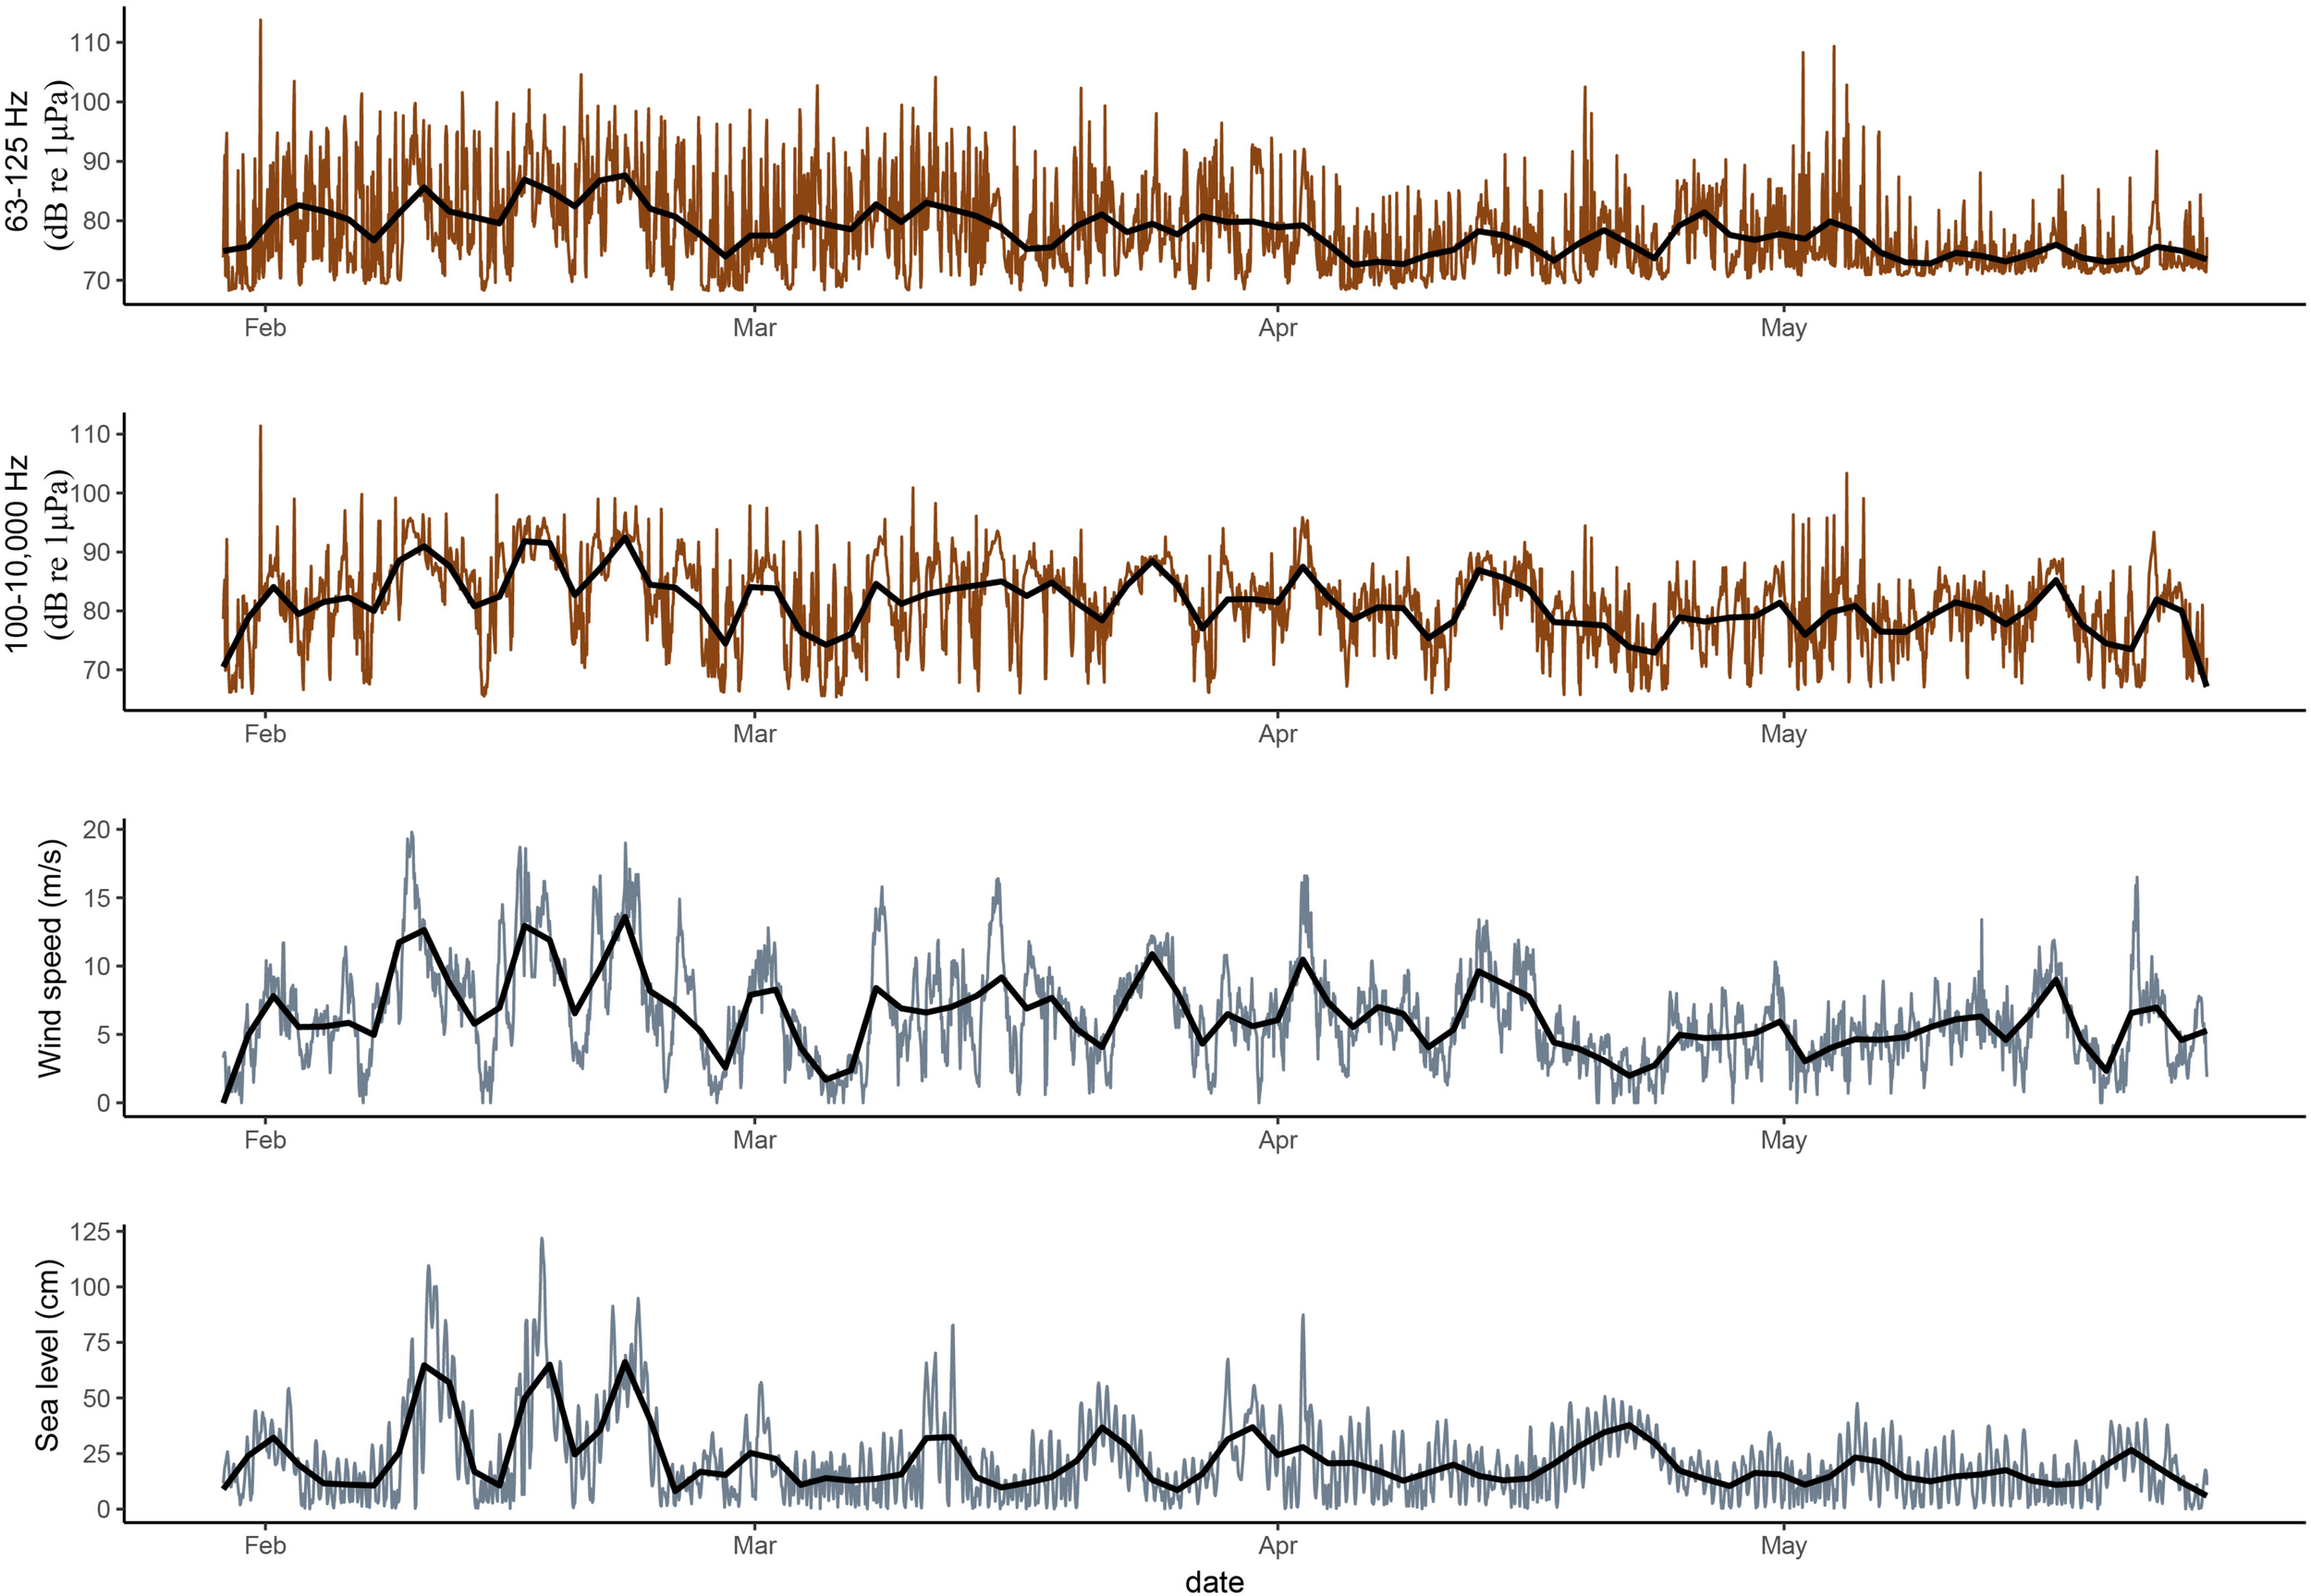
Plots showing the variability in the shipping noise indicators [63–125 Hz TOB sound pressure levels (dB re 1 μPa)], the 100–10,000 Hz TOB sound pressure levels that are more impacted by wind speed (dB re 1 μPa) (Wenz, 1962), wind speed (m/s), and sea level height (cm) between 29 January and 26 May 2020 at the Tisler cold-water coral reef. The brown and grey lines shows the actual data. The black line is a LOESS fitted curve to make the comparison of the trends more intuitive.
TABLE 5
| NIGHT (20:00:00–06:59:59) |
DAY (07:00:00–19:59:59) |
|||||||||
| Before border closure |
After border closure |
≠ | Before border closure |
After border closure |
≠ | |||||
| Median | ± MAD | Median | ± MAD | Median | ± MAD | Median | ± MAD | |||
| Wind speed (m/s) | 6.1 | 4.7 | 5.0 | 2.9 | −1.1 | 6.2 | 4.5 | 5.3 | 2.5 | −0.9 |
| Sea level height (cm) | 18.3 | 16.9 | 17.1 | 10.0 | −1.25 | 19.2 | 18.6 | 16.8 | 10.6 | −2.4 |
The median and the mean absolute deviation (MAD) of the wind speed and sea level height at the Tisler reef downloaded from SMHI(smhi.se).
The ≠ symbol indicates the difference in the wind speed and sea level after border closure.
Diurnal, Weekly, and Monthly Variation
Events with high sound pressure levels at 09:00, 16:00, and 17:00 are visible as high peaks in the diurnal “before border closure” plot (Figure 5A). Lower but still distinct peaks are observed at 07:00, 11:00, 13:00, 14:00, and 19:00. These peaks coincide with the ferry CPA timings. The strong shipping noise-driven diurnal pattern disappears after border closure and manifests itself as a flatter, quieter, curve in the diurnal plot (Figure 5B). The pattern observed during border closure appears more similar to what can be observed during nighttime before border closure.
FIGURE 5
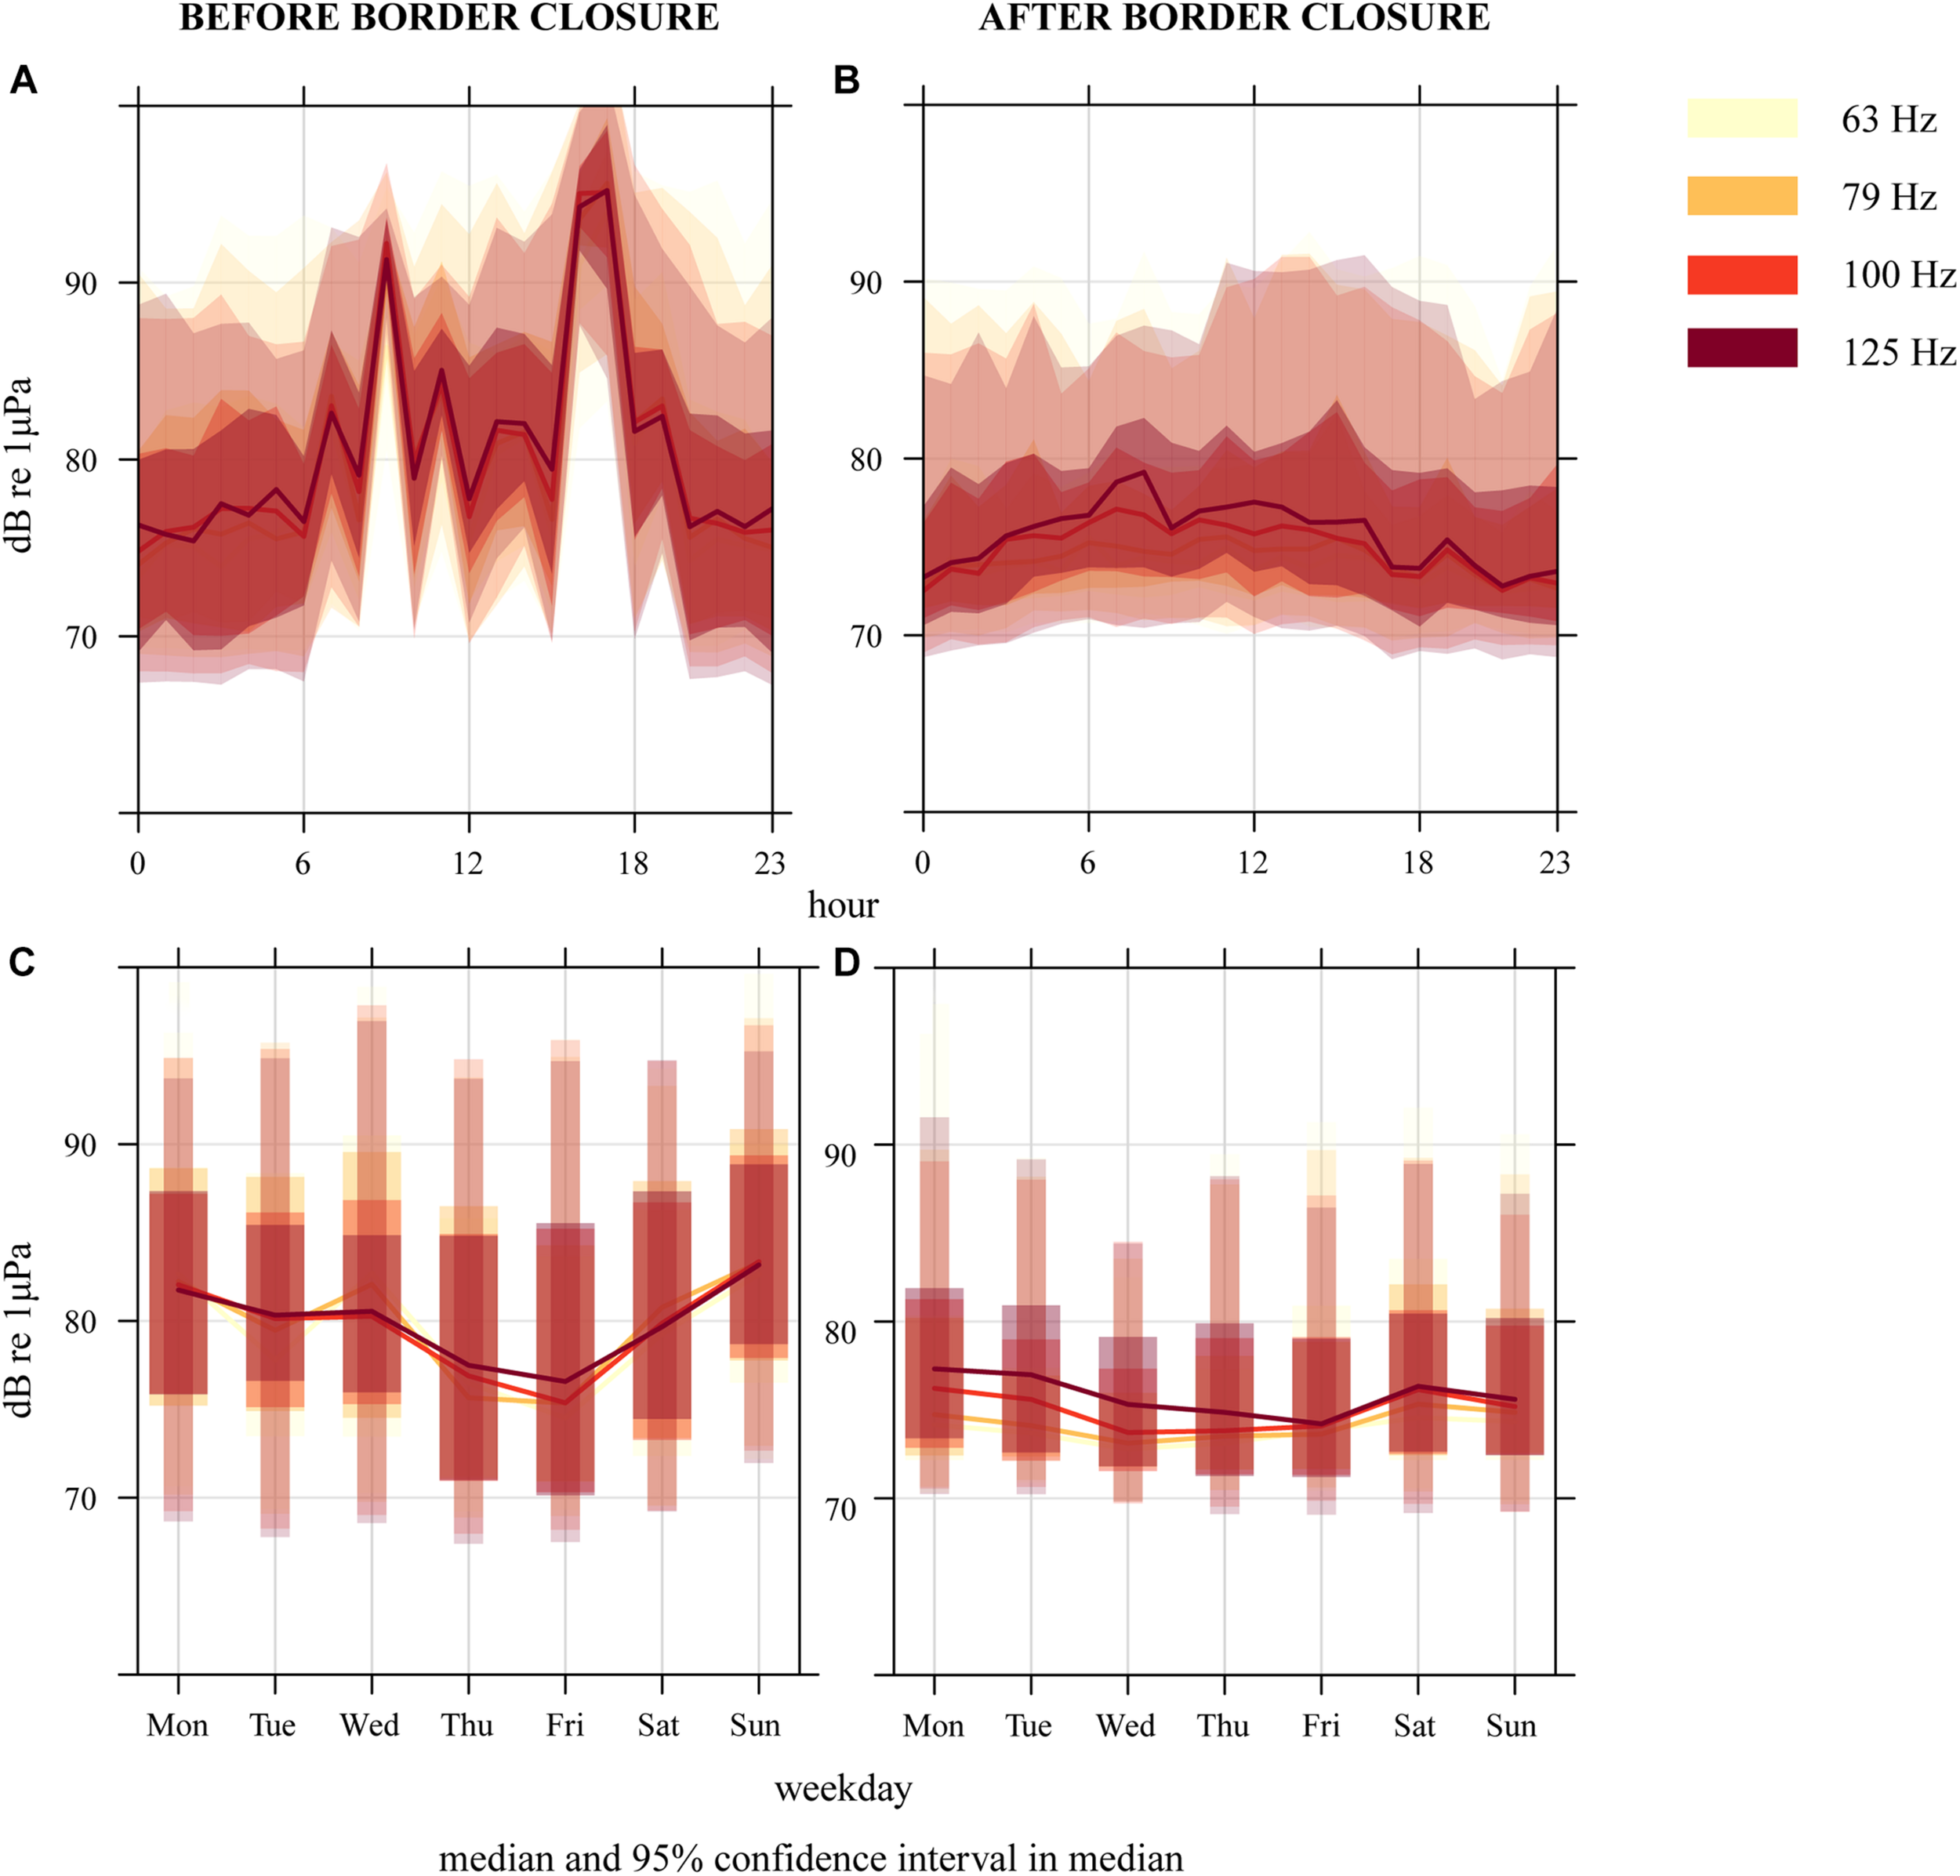
Sound pressure levels in the hourly median 63–125 Hz 1/3 octave frequency bands at the Tisler reef from (A,C) 29 January–14 March 2020 and (B,D) 15 March–26 May 2020. The plot shows the 95% confidence intervals and the median (line), which are calculated through bootstrap simulation, providing the (A,B) diurnal and (C,D) weekly variation of noise levels.
Before border closure, weekly changes in the noise levels indicate higher sound pressure levels on Wednesdays and at the weekends (Figure 5C). A reverse pattern with a slight decrease in the sound levels on Wednesdays and Sundays is observed after border closure, together with a slight increase on Saturdays (Figure 5D).
Discussion
This study shows that the noise levels at the Tisler reef significantly reduced after the international border closed between Norway and Sweden as a consequence of the COVID-19 pandemic. While a seasonal reduction in wind speed and sea level accounted for a decrease in the noise levels at the Tisler reef, the ceasing of ferry traffic greatly reduced the levels of noise pollution at the reef during the day.
Compared to February 2020, the overall vessel route density increased by 15% in May 2020, but passenger vessel route density (i.e., ferry traffic) decreased 20% in March, 52% in April, and 47% in May. The COVID-19 border closure coincides with this reduction in passenger vessel route density. The overall increase in vessel route density from winter to spring can be explained by improved weather conditions making sea-going safer and more appealing for fishing and other vessel types, e.g., recreational vessels such as cruise ships (Robards et al., 2016). Between 1950 and 2007 researchers found that ambient noise levels in the world’s oceans increased as much as 3.3 dB per decade due to an increase in vessel traffic (Andrew et al., 2002). The observed drop in noise levels at the Tisler reef could therefore translate to travelling back more than two decades in time. Ferries have been travelling between Sandefjord (Norway) and Strömstad (Sweden) since (at least) 19642. Even though the larger surrounding area’s overall vessel route density increased over the time period of this study, the drop in the noise levels at the Tisler reef indicates that the soundscape is heavily impacted by shipping noise, which directly over the reef is dominated by the ferries.
Since the ferries do not travel at night, the nighttime noise levels which varied between 73.4 and 85.6 dB re 1 μPa across all the TOB are likely to be more representative of the Tisler reefs’ natural soundscape. The reduction of 1.9 ± 0.11 (MAD) dB in the noise levels during the night after border closure were driven by a seasonal change coupled with a reduction of both the wind speed and sea level height (Figure 4 and Table 5). A decrease in wind speed is typically found in temporal regions when transitioning from winter to spring (Wenz, 1962; Haver et al., 2019). Changes in sea level height can be attributed to short-term variations in waves and tides or flood events associated with winter snow melts or severe storms. At Tisler Reef, there is no strong tidal influence, instead, the water flow is channelled over a sill through the Ytre Hvaler sound, which has a NW–SE orientation (De Clippele et al., 2018). Acoustic Doppler Current Profile (ADCP) measurements from 2006 to 2010 indicated that 43% of the time, the currents flow in a north-west direction and 57% in a south-east direction (De Clippele et al., 2018), which could attribute to the observed changes in the sea level height.
During the day, a much larger reduction of 8.9 ± 0.88 (MAD) dB in the 63–125 Hz TOB was observed after the border closed and ferry traffic ceased. If the nighttime reduction of 1.9 ± 0.11 (MAD) dB, which was driven by seasonal changes, is subtracted from the daytime reduction, we can deduce that the anthropogenic acoustic footprint at the Tisler reef was reduced by 7.0 ± 0.99 (MAD) dB as a consequence of the COVID-19 border closure.
Before border closure, the diurnal pattern was strongly driven by anthropogenic activity, i.e., the ferry traffic over the reef. Anthropogenic diurnal patterns have also, for example, been observed near the shore of North Carolina (Haviland-Howell et al., 2007) and in marine protected areas such as Glacier Bay (Haver et al., 2019). The strong diurnal pattern disappeared during border closure and revealed more subtle changes in noise levels across the frequency bands. Weekly patterns were also observed, particularly during the weekend and on Wednesdays. These were likely linked to variation in the time schedule of vessel traffic further off-shore (Figure 2; Haviland-Howell et al., 2007). In addition, the difference in the noise levels between night and day, were much smaller after border closure (before: 3.5 ± 2.19 dB vs. after: 0.9 ± 0.52 dB). This indicates that the noise levels after border closure will reflect that of a much more natural and “unpolluted” soundscape. However, AIS, current speed, and biological data are needed to fully understand and quantify the changes observed in the Tisler reef’s soundscape.
Although not yet studied in detail, during “business as usual” the increased noise levels at the Tisler Reef caused by the ferry traffic could cause auditory masking (Simpson et al., 2011; Carroll et al., 2017; Stanley et al., 2017), affect individual and social behaviour (Myrberg and Fuiman, 2002), cause physical damage (Le Prell et al., 2012) and negatively affect the physiological functioning of the reef organisms (Nedelec et al., 2016; Simpson et al., 2016). While some studies indicate that fish might be able to habituate to continuous noise exposure (Nedelec et al., 2016; Holmes et al., 2017; Staaterman et al., 2020), this has not been shown for sporadic exposure (e.g., by ferry traffic), which can impact escape and swimming behaviour (Holmes et al., 2017). Regardless of the type of exposure, some reef fish and invertebrates are less mobile or sessile and are less likely to show clear behavioural changes when exposed to noise pollution (Ferrier-pages et al., 2021). While evidence of the effects of noise pollution on tropical coral reef organisms is growing (Ferrier-pages et al., 2021), none is currently available for cold-water coral reef organisms.
Since growing evidence shows that shipping noise can act as a chronic habitat-level stressor, which harms individual animals and ecosystem linkages (e.g. via disrupting predator-prey interactions) (Ferrier-pages et al., 2021), marine protected areas (MPAs), such as the Tisler reef MPA, should include measures for monitoring and mitigating anthropogenic noise (Haren, 2007; Williams et al., 2015). With or without an MPA to protect vulnerable marine ecosystems such as cold-water coral reefs, diverting shipping lanes or using time and area exclusions can help regulate anthropogenic noise threats (Weilgart, 2006). Studies, such as this one, that quantify the extent of the noise generated by individual components of the anthropogenic soundscape, such as shipping, can inform policymakers and stakeholders in developing legal frameworks and highlight the need for better management and technological solutions to mitigate noise pollution impacts on these sensitive marine environments.
Conclusion
A literature search for “cold-water coral” and “deep-sea coral” returned only 15 publications in the year 2000, while in 2020 it returned 253. While advances in technology have enabled us to increase our knowledge on these remote and inaccessible reefs over the last two decades, simultaneously shipping, seismic surveys, oil and gas developments seismic airguns, and military sonar have increased the level of anthropogenic noise in the marine environment (Duarte et al., 2021). The COVID-19 shutdown has significantly reduced anthropogenic noise levels and provided us with the unique opportunity to study relatively unpolluted soundscapes (Derryberry et al., 2020). This study is the first to assess the extent of noise pollution at a cold-water coral reef and provides a baseline to guide us toward more effective management of these ecosystems. Results from “COVID-19 before and after noise pollution experiments” provide valuable insights to understand the extent to which noise pollution affects the functioning of marine ecosystems, especially nearshore, where passenger, fishing, and recreational shipping traffic is denser.
Statements
Data availability statement
The datasets presented in this article are not readily available because the data is part of an ongoing project. Requests to access the datasets should be directed to corresponding author.
Author contributions
LDC: Conceptualization, fieldwork, writing, methodology. DR: Review and editing of the manuscript and methodology. Both authors contributed to the article and approved the submitted version.
Funding
The research leading to the results in this manuscript received funding from the European Union’s Horizon 2020 research and innovation programme ASSEMBLE Plus AmpLOPHELIA project (Grant Agreement No. 730984) conducted in 2020 at Tjärnö marine laboratory (University of Gothenburg, Sweden), the Horizon 2020 ATLAS (Grant Agreement No. 678760) and the Horizon 2020 iAtlantic project (Grant Agreement No. 818123). This manuscript reflects the authors’ view alone, and the European Union cannot be held responsible for any use that may be made of the information contained herein.
Acknowledgments
We thank the crew onboard the RV Nereus and all personnel at Tjärnö who helped us during our stay, the deployment and recovery of the sound recorders. We thank Ann Larsson, Susanna Strömberg, and Tomas Lundälv for their support in the AmpLOPHELIA project. We also thank Ewan Edwards and Jack Gillespie for assisting with the logistics and transportation of the equipment. We would also like to thank the two reviewers whose comments allowed us to greatly improve this manuscript.
Conflict of interest
The authors declare that the research was conducted in the absence of any commercial or financial relationships that could be construed as a potential conflict of interest.
References
1
Addamo A. M. Vertino A. Stolarski J. García-Jiménez R. Taviani M. Machordom A. (2016). Merging scleractinian genera: the overwhelming genetic similarity between solitary Desmophyllum and colonial Lophelia.BMC Evol. Biol.16:108. 10.1186/s12862-016-0654-8
2
Andrew R. K. Howe B. M. Mercer J. A. (2011). Long-time trends in ship traffic noise for four sites off the North American West Coast.J. Acoust. Soc. Am.129642–651. 10.1121/1.3518770
3
Andrew R. K. Howe B. M. Mercer J. A. Dzieciuch M. A. (2002). Ocean ambient sound: comparing the 1960s with the 1990s for a receiver off the California coast.Acoust. Res. Lett. Online365–70. 10.1121/1.1461915
4
Baillon S. Hamel J. F. Wareham V. E. Mercier A. (2012). Deep cold-water corals as nurseries for fish larvae.Front. Ecol. Environ.10:351–356. 10.1890/120022
5
Bassett C. Thomson J. Dahl P. H. Polagye B. (2014). Flow-noise and turbulence in two tidal channels.J. Acoust. Soc. Am.1351764–1774. 10.1121/1.4867360
6
Bolker B. (2020). Dealing with quasi-models in R.Compare15–452.
7
Buhl-Mortensen L. L. Vanreusel A. Gooday A. J. Levin L. A. Priede I. G. Buhl-Mortensen P. et al (2010). Biological structures as a source of habitat heterogeneity and biodiversity on the deep ocean margins.Mar. Ecol. Evol. Perspect.3121–50. 10.1111/j.1439-0485.2010.00359.x
8
Carroll A. G. Przeslawski R. Duncan A. Gunning M. Bruce B. (2017). A critical review of the potential impacts of marine seismic surveys on fish & invertebrates.Mar. Pollut. Bull.1149–24. 10.1016/j.marpolbul.2016.11.038
9
Carslaw D. C. Ropkins K. (2012). Openair - an r package for air quality data analysis.Environ. Model. Softw.252–61. 10.1016/j.envsoft.2011.09.008
10
Cathalot C. Van Oevelen D. Cox T. J. S. Kutti T. Lavaleye M. Duineveld G. et al (2015). Cold-water coral reefs and adjacent sponge grounds: hotspots of benthic respiration and organic carbon cycling in the deep sea.Front. Mar. Sci.2:1–12. 10.3389/fmars.2015.00037
11
Clark M. R. Tittensor D. Rogers A. D. Brewin P. Schlacher T. Rowden A. et al (2006). Seamounts, Deep-Sea Corals and Fisheries: Vulnerability of Deep-Sea Corals to Fishing on Seamounts Beyond Areas of National Jurisdiction.Cambridge: UNEP-WCMC.
12
Davies A. J. Wisshak M. Orr J. C. Murray Roberts J. (2008). Predicting suitable habitat for the cold-water coral Lophelia pertusa (Scleractinia).Deep. Res. Part I Oceanogr. Res. Pap.551048–1062. 10.1016/j.dsr.2008.04.010
13
De Clippele L. H. Huvenne V. A. I. Molodtsova T. N. Roberts J. M. (2019). The diversity and ecological role of non-scleractinian corals (Antipatharia and Alcyonacea) on scleractinian cold-water coral mounds.Front. Mar. Sci.6:184. 10.3389/fmars.2019.00184
14
De Clippele L. H. Huvenne V. A. I. Orejas C. Lundälv T. Fox A. Hennige S. J. et al (2018). The effect of local hydrodynamics on the spatial extent and morphology of cold-water coral habitats at Tisler Reef, Norway.Coral Reefs37253–266. 10.1007/s00338-017-1653-y
15
De Clippele L. H. Rovelli L. Ramiro-Sánchez B. Kazanidis G. Vad J. Turner S. et al (2021). Mapping cold-water coral biomass: an approach to derive ecosystem functions.Coral Reefs40215–231. 10.1007/s00338-020-02030-5
16
de Froe E. Rovelli L. Glud R. N. Maier S. R. Duineveld G. Mienis F. et al (2019). Benthic oxygen and nitrogen exchange on a cold-water coral reef in the North-East Atlantic Ocean.Front. Mar. Sci.6:665. 10.3389/fmars.2019.00665
17
Dekeling R. Tasker M. Ainslie M. Andersson M. André M. Borsani F. et al (2016). “The European marine strategy: noise monitoring in European marine waters from 2014,” in The Effects of Noise on Aquatic Life II, edsPopperA. N.HawkinsA. (New York, NY: Springer), 205–215.
18
Derryberry E. P. Phillips J. N. Derryberry G. E. Blum M. J. Luther D. (2020). Singing in a silent spring: birds respond to a half-century soundscape reversion during the COVID-19 shutdown.Science370575–579. 10.1126/SCIENCE.ABD5777
19
Dobson A. J. Barnett A. G. (2008). Introduction to Generalized Linear Models, 3rd Edn. Boca Raton, FL: Chapman and Hall.
20
Douarin M. Sinclair D. J. Elliot M. Henry L. A. Long D. Mitchison F. et al (2014). Changes in fossil assemblage in sediment cores from Mingulay Reef Complex (NE Atlantic): implications for coral reef build-up.Deep. Res. II Top. Stud. Oceanogr.99286–296. 10.1016/j.dsr2.2013.07.022
21
Duarte C. M. Chapuis L. Collin S. P. Costa D. P. Devassy R. P. Eguiluz V. M. et al (2021). The soundscape of the Anthropocene ocean.Science371:eaba4658. 10.1126/science.aba4658
22
Ferrier-pages C. Leal M. C. Calado R. Schmid D. W. Lecchini D. Allemand D. (2021). Noise pollution on coral reefs? — A yet underestimated threat to coral reef communities.Mar. Pollut. Bull.165:112129. 10.1016/j.marpolbul.2021.112129
23
Fosså J. H. Skjoldal H. R. Grafton R. Q. Hilborn R. Squires D. Tait M. (2010). Handbook of Marine Fisheries Conservation and Management.Oxford: Oxford University Press.
24
Frisk G. V. (2012). Noiseonomics: the relationship between ambient noise levels in the sea and global economic trends.Sci. Rep.2:437. 10.1038/srep00437
25
Garrett J. K. Blondel P. Godley B. J. Pikesley S. K. Witt M. J. Johanning L. (2016). Long-term underwater sound measurements in the shipping noise indicator bands 63 Hz and 125 Hz from the port of Falmouth Bay, UK.Mar. Pollut. Bull.110438–448. 10.1016/j.marpolbul.2016.06.021
26
Guihen D. White M. Lundälv T. (2013). Boundary layer flow dynamics at a cold-water coral reef.J. Sea Res.7836–44. 10.1016/j.seares.2012.12.007
27
Haren A. M. (2007). Reducing noise pollution from commercial shipping in the channel islands national marine sanctuary: a case study in marine protected area management of underwater noise.J. Int. Wildl. Law Policy10153–173. 10.1080/13880290701347432
28
Haver S. M. Fournet M. E. Dziak R. P. Gabriele C. Gedamke J. Hatch L. T. et al (2019). Comparing the underwater soundscapes of four U.S. National Parks and marine sanctuaries.Front. Mar. Sci.6:500. 10.3389/fmars.2019.00500
29
Haviland-Howell G. Frankel A. S. Powell C. M. Bocconcelli A. Herman R. L. Sayigh L. S. (2007). Recreational boating traffic: a chronic source of anthropogenic noise in the Wilmington, North Carolina Intracoastal Waterway.J. Acoust. Soc. Am.122151–160. 10.1121/1.2717766
30
Hennige S. J. Morrison C. L. Form U. Büscher J. Kamenos N. Roberts J. M. (2014). Self-recognition in corals facilitates deep-sea habitat engineering.Sci. Rep.4:6782. 10.1038/srep06782
31
Hennige S. J. Wicks L. C. Kamenos N. A. Perna G. Findlay H. S. Roberts J. M. (2015). Hidden impacts of ocean acidification to live and dead coral framework.Proc. Biol. Sci.282:20150990. 10.1098/rspb.2015.0990
32
Henry L. A. Davies A. J. Roberts J. M. (2010). Beta diversity of cold-water coral reef communities off western Scotland.Coral Reefs29427–436. 10.1007/s00338-009-0577-6
33
Henry L. A. Navas J. M. Hennige S. J. Wicks L. C. Vad J. Roberts J. M. (2013). Cold-water coral reef habitats benefit recreationally valuable sharks.Biol. Conserv.16167–70. 10.1016/j.biocon.2013.03.002
34
Henry L. A. Stehmann M. F. W. De Clippele L. Findlay H. S. Golding N. Roberts J. M. (2016). Seamount egg-laying grounds of the deep-water skate Bathyraja richardsoni.J. Fish Biol.891473–1481. 10.1111/jfb.13041
35
Hildebrand J. A. (2009). Anthropogenic and natural sources of ambient noise in the ocean.Mar. Ecol. Prog. Ser.3955–20. 10.3354/meps08353
36
Holmes L. J. McWilliam J. Ferrari M. C. O. McCormick M. I. (2017). Juvenile damselfish are affected but desensitize to small motor boat noise.J. Exp. Mar. Bio. Ecol.49463–68. 10.1016/j.jembe.2017.05.009
37
Johnson M. Partan J. Hurst T. (2013). Low complexity lossless compression of underwater sound recordings.J. Acoust. Soc. Am.1331387–1398. 10.1121/1.4776206
38
Kazanidis G. Henry L. A. Roberts J. M. Witte U. F. M. (2016). Biodiversity of Spongosorites coralliophaga (Stephens, 1915) on coral rubble at two contrasting cold-water coral reef settings.Coral Reefs35193–208. 10.1007/s00338-015-1355-2
39
K. Lisa Yang Center for Conservation Bioacoustics (2019). Raven Pro: Interactive Sound Analysis Software (Version 1.6.1) [Computer Software]. Ithaca, NY: The Cornell Lab of Ornithology. Available online at: http://ravensoundsoftware.com/
40
Lavaleye M. Duineveld G. Lundälv T. White M. Guihen D. Kiriakoulakis K. et al (2009). Cold-water corals on the Tisler reef preliminary observations on the dynamic reef environment.Oceanography2276–84.
41
Le Prell C. G. Henderson D. Fay R. R. (2012). Noise-Induced Hearing Loss.Berlin: Springer.
42
Maier S. R. Kutti T. Bannister R. J. Fang J. K. H. van Breugel P. van Rijswijk P. et al (2020). Recycling pathways in cold-water coral reefs: use of dissolved organic matter and bacteria by key suspension feeding taxa.Sci. Rep.10:9942. 10.1038/s41598-020-66463-2
43
McCullagh P. Nelder J. (1989). Generalised Linear Models, 2nd Edn. Boca Raton, FL: Chapman and Hall.
44
McKenna M. F. Ross D. Wiggins S. M. Hildebrand J. A. (2012). Underwater radiated noise from modern commercial ships.J. Acoust. Soc. Am.13192–103. 10.1121/1.3664100
45
Merchant N. D. Brookes K. L. Faulkner R. C. Bicknell A. W. J. Godley B. J. Witt M. J. (2016). Underwater noise levels in UK waters.Sci. Rep.6:36942. 10.1038/srep36942
46
Mienis F. van der Land C. de Stigter H. C. van de Vorstenbosch M. de Haas H. Richter T. et al (2009). Sediment accumulation on a cold-water carbonate mound at the Southwest Rockall Trough margin.Mar. Geol.26540–50. 10.1016/j.margeo.2009.06.014
47
Mueller C. E. Larsson A. I. Veuger B. Middelburg J. J. Van Oevelen D. (2014). Opportunistic feeding on various organic food sources by the cold-water coral Lophelia pertusa.Biogeosciences11, 123–133. 10.5194/bg-11-123-2014
48
Morato T. González-Irusta J. M. Dominguez-Carrió C. Wei C. L. Davies A. Sweetman A. K. et al (2020). Climate-induced changes in the suitable habitat of cold-water corals and commercially important deep-sea fishes in the North Atlantic.Glob. Chang. Biol.262181–2202. 10.1111/gcb.14996
49
Myrberg A. A. Fuiman L. A. (2002). The Sensory World of Coral Reef Fishes.Amsterdam: Elsevier.
50
Nedelec S. L. Mills S. C. Lecchini D. Nedelec B. Simpson S. D. Radford A. N. (2016). Repeated exposure to noise increases tolerance in a coral reef fish.Environ. Pollut.216428–436. 10.1016/j.envpol.2016.05.058
51
Peng C. Zhao X. Liu G. (2015). Noise in the sea and its impacts on marine organisms.Int. J. Environ. Res. Public Health1212304–12323. 10.3390/ijerph121012304
52
Piercy J. J. B. Codling E. A. Hill A. J. Smith D. J. Simpson S. D. (2014). Habitat quality affects sound production and likely distance of detection on coral reefs.Mar. Ecol. Prog. Ser.51635–47.
53
R Development Core Team (2010). R: A Language and Environment for Statistical Computing.Vienna: R Foundation for Statistical Computing.
54
Robards M. D. Silber G. K. Adams J. D. Arroyo J. Lorenzini D. Schwehr K. et al (2016). Conservation science and policy applications of the marine vessel Automatic Identification System (AIS)-A review.Bull. Mar. Sci.9275–103. 10.5343/bms.2015.1034
55
Roberts J. M. Wheeler A. J. Freiwald A. (2006). Reefs of the deep: the biology and geology of cold-water coral ecosystems.Science312543–547. 10.1126/science.1119861
56
Roberts J. M. Wheeler A. J. Freiwald A. Cairns S. D. (2009). Cold-Water Corals: The Biology and Geology of Deep-Sea coral Habitats.Cambridge: Cambridge University Press.
57
Rovelli L. Attard K. M. Bryant L. D. Flögel S. Stahl H. Roberts J. M. et al (2015). Benthic O2 uptake of two cold-water coral communities estimated with the non-invasive eddy correlation technique.Mar. Ecol. Prog. Ser.52597–104. 10.3354/meps11211
58
Simmonds M. P. Dolman S. J. Jasny M. Parsons E. C. M. Weilgart L. Wright A. J. et al (2014). Marine noise pollution - increasing recognition but need for more practical action.J. Ocean Technol.971–90.
59
Simpson S. D. Radford A. N. Holles S. Ferarri M. C. Chivers D. P. McCormick M. I. et al (2016). “Small-boat noise impacts natural settlement behavior of coral reef fish larvae,” in The Effects of Noise on Aquatic Life II, edsPopperA.HawkinsA. (Berlin: Springer), 1041–1048.
60
Simpson S. D. Radford A. N. Tickle E. J. Meekan M. G. Jeffs A. G. (2011). Adaptive avoidance of reef noise.PLoS One6:e16625. 10.1371/journal.pone.0016625
61
Staaterman E. Gallagher A. J. Holder P. E. Reid C. H. Altieri A. H. Ogburn M. B. et al (2020). Exposure to boat noise in the field yields minimal stress response in wild reef fish.Aquat. Biol.2993–103. 10.3354/ab00728
62
Stanley J. A. Van Parijs S. M. Hatch L. T. (2017). Underwater sound from vessel traffic reduces the effective communication range in Atlantic cod and haddock.Sci. Rep.7:14633. 10.1038/s41598-017-14743-9
63
Strasberg M. (1979). Nonacoustic noise interference in measurements of infrasonic ambient noise.J. Acoust. Soc. Am.66:1487.
64
Sundahl H. Buhl-Mortensen P. Buhl-Mortensen L. (2020). Distribution and suitable habitat of the cold-water corals Lophelia pertusa, Paragorgia arborea, and Primnoa resedaeformis on the Norwegian continental shelf.Front. Mar. Sci.7:213. 10.3389/fmars.2020.00213
65
Sweetman A. K. Thurber A. R. Smith C. R. Levin L. A. Mora C. Wei C.-L. et al (2017). Major impacts of climate change on deep-sea benthic ecosystems.Elem. Sci. Anth.5:4. 10.1525/elementa.203
66
Tasker M. L. Amundin M. Andre M. Hawkins A. Lang W. Merck T. et al (2010). MSFD Task Group 11 Report: Underwater Noise and Other Forms of Energy. European Commission Joint Research Centre/ICES Report EUR 24341. Luxembourg: Joint Research Centre.
67
Thomson D. J. M. Barclay D. R. (2020). Real-time observations of the impact of COVID-19 on underwater noise.J. Acoust. Soc. Am.1473390–3396. 10.1121/10.0001271
68
Van der Land C. Eisele M. Mienis F. de Haas H. Hebbeln D. Reijmer J. J. G. et al (2014). Carbonate mound development in contrasting settings on the Irish margin.Deep. Res. II Top. Stud. Oceanogr.99297–306. 10.1016/j.dsr2.2013.10.004
69
van Oevelen D. Duineveld G. Lavaleye M. Mienis F. Soetaert K. Heip C. H. R. (2009). The cold-water coral community as hotspot of carbon cycling on continental margins: a food-web analysis from Rockall Bank (northeast Atlantic).Limnol. Oceanogr.541829–1844. 10.4319/lo.2009.54.6.1829
70
Wagner H. Purser A. Thomsen L. Jesus C. C. Lundälv T. (2011). Particulate organic matter fluxes and hydrodynamics at the Tisler cold-water coral reef.J. Mar. Syst.8519–29. 10.1016/j.jmarsys.2010.11.003
71
Weilgart L. S. (2006). “Managing noise through marine protected areas around global hot spots,” in Paper Presented at the 58th Annual Meeting of the International Whaling Commission Scientific Committee 12 (New York, NY: IWC).
72
Wenz G. M. (1962). Acoustic ambient noise in the ocean: spectra and sources.J. Acoust. Soc. Am.341936–1956. 10.1121/1.1909155
73
Wheeler A. J. Bett B. J. Billett D. S. M. Masson D. Mayor D. (2005). The impact of demersal trawling on northeast Atlantic deepwater coral habitats: the case of the Darwin Mounds, United Kingdom.Am. Fish. Soc. Symp.41807–817.
74
Wheeler A. J. Beyer A. Freiwald A. de Haas H. Huvenne V. A. I. Kozachenko M. et al (2007). Morphology and environment of cold-water coral carbonate mounds on the NW European margin.Int. J. Earth Sci.9637–56. 10.1007/s00531-006-0130-6
75
Wickham H. (2011). Ggplot2.Wiley Interdiscip. Rev. Comput. Stat.3180–185. 10.1002/wics.147
76
Williams R. Erbe C. Ashe E. Clark C. W. (2015). Quiet(er) marine protected areas.Mar. Pollut. Bull.100154–161. 10.1016/j.marpolbul.2015.09.012
77
Wisshak M. Freiwald A. Lundälv T. Gektidis M. (2005). “The physical niche of the bathyal Lophelia pertusa in a non-bathyal setting: Environmental controls and palaeoecological implications,” in Cold-Water Corals and Ecosystems, edsFreiwaldA.RobertsJ. M. (Berlin: Springer), 979–1001.
Summary
Keywords
COVID-19, cold-water coral reef, passive acoustic monitoring, noise pollution, soundscape, passenger vessels, marine ecosystem
Citation
De Clippele LH and Risch D (2021) Measuring Sound at a Cold-Water Coral Reef to Assess the Impact of COVID-19 on Noise Pollution. Front. Mar. Sci. 8:674702. doi: 10.3389/fmars.2021.674702
Received
01 March 2021
Accepted
20 May 2021
Published
24 June 2021
Volume
8 - 2021
Edited by
Edward Urban, Scientific Committee on Oceanic Research, United States
Reviewed by
Mike Van Der Schaar, Universitat Politecnica de Catalunya, Spain; Matthew Wale, Edinburgh Napier University, United Kingdom
Updates
Copyright
© 2021 De Clippele and Risch.
This is an open-access article distributed under the terms of the Creative Commons Attribution License (CC BY). The use, distribution or reproduction in other forums is permitted, provided the original author(s) and the copyright owner(s) are credited and that the original publication in this journal is cited, in accordance with accepted academic practice. No use, distribution or reproduction is permitted which does not comply with these terms.
*Correspondence: Laurence H. De Clippele, laurence.de.clippele@gmail.com
This article was submitted to Marine Ecosystem Ecology, a section of the journal Frontiers in Marine Science
Disclaimer
All claims expressed in this article are solely those of the authors and do not necessarily represent those of their affiliated organizations, or those of the publisher, the editors and the reviewers. Any product that may be evaluated in this article or claim that may be made by its manufacturer is not guaranteed or endorsed by the publisher.