 Ting Gu
 Dai Jia1,2†
 Guicheng Zhang
 Yuqiu Wei
 Jun Sun
- 1Research Centre for Indian Ocean Ecosystem, Tianjin University of Science and Technology, Tianjin, China
- 2Tianjin Key Laboratory of Marine Resources and Chemistry, Tianjin University of Science and Technology, Tianjin, China
- 3Animal, Plant and Foodstuffs Inspection Center, Tianjin Customs, Tianjin, China
- 4Yellow Sea Fisheries Research Institute, Chinese Academy of Fishery Sciences, Qingdao, China
- 5College of Marine Science and Technology, China University of Geosciences, Wuhan, China
Nitrous oxide (N2O) is a powerful greenhouse gas that degrades ozone. Hypoxia and ocean acidification are becoming more intense as a result of climate change. The former stimulates N2O emissions, whereas the effects of the latter on N2O production vary by the ocean. Hypoxia and ocean acidification may play a critical role in the evolution of future oceanic N2O production. However, the interactive effects of hypoxia and ocean acidification on N2O production remain unclear. We conducted a research cruise in the Bohai Sea of China to assess the occurrence of ocean acidification in the seasonal oxygen minimum zone of the sea and further conducted laboratory incubation experiments to determine the effects of ocean acidification and hypoxia on N2O production. When pH decreased by 0.25, N2O production decreased by 50.77 and 72.38%, respectively. In contrast, hypoxia had a positive impact; when dissolved oxygen (DO) decreased to 3.7 and 2.4 mg L−1, N2O production increased by 49.72 and 278.68%, respectively. The incubation experiments demonstrated that the coupling of ocean acidification and hypoxia significantly increased N2O production, but, individually, there was an antagonistic relationship between the two. Structural equation modeling showed that the total effects of hypoxia treatment on N2O production changes weakened the effects of ocean acidification, with overall positive effects. Generally speaking, our results suggest that N2O production from the coastal waters of the Bohai Sea may increase under future climate change scenarios due to increasingly serious ocean acidification and hypoxia working in combination.
Introduction
Nitrous oxide (N2O) is an important greenhouse gas with a warming effect 265 times that of carbon dioxide (CO2) (Stocker et al., 2013) and with the ability to destroy atmospheric ozone through photochemical reactions, resulting in significant impacts on global climate change (Crutzen and Ehhalt, 1977; Freing et al., 2012). N2O emissions from oceans are the second-largest natural source of atmospheric N2O and account for ~30% of total natural emissions (Bange, 2006), particularly N2O emissions from the upper ocean (Nevison et al., 1995), making oceans important contributors to global climate regulation (Qin, 2014). However, N2O emissions are not uniformly distributed in the upper ocean due to complicated marine environments. Moreover, the effects of global climate change, including ocean acidification, temperature rise, and oxygen depletion, are likely to disrupt the balance (Codispoti, 2010).
Marine ecosystems play an important role in regulating global climate change through their strong regulatory capacity (Naqvi et al., 1998). Offshore low-oxygen areas are often caused by an increase in the flux of land-based nutrients into the sea and the eutrophication of estuaries and inshore waters. Seasonal stratification of seawater further hinders the transfer of oxygen from the upper layer of seawater to the bottom, producing seasonal variability in offshore hypoxic zones (Zhai et al., 2012; Zhang et al., 2016). Since hypoxic environments can stimulate the production and release of N2O, hypoxic zones are hot spots for global marine N2O emissions, affecting local and global climate. These areas have become an important subject of research into N2O emission fluxes and mechanisms in minimum-oxygen zones within open oceans (Naqvi et al., 2000; Kalvelage et al., 2013; Arévalo-Martínez et al., 2015; Babbin et al., 2015; Ji et al., 2015; Kock et al., 2016; Trimmer et al., 2016).
The increase in global temperature due to the enhanced greenhouse effect has been balanced by the exchange of ~25% of anthropogenic CO2 into the oceans (Le Quéré et al., 2014). Ocean acidification is the result of the ocean hosting excess CO2, leading to changes in the carbonate system of upper ocean water (Orr et al., 2005). Over the past 20 years, this has resulted in a decrease in seawater pH of ~0.0011–0.0024 units per year, with the average marine pH being ~0.1 unit lower than before the Industrial Revolution (Stocker et al., 2013). Current research on biogeochemical cycling processes has shown that increasing pCO2 and subsequent pH decline in the oceans are expected to affect microbial nutrient cycling directly and indirectly, for example, by increasing Trichodesmium-fixed N2 and CO2 (Hutchins et al., 2007) and changing ammonia-oxidizing archaea (AOA) abundance that indirectly alters N2O emissions (Rees et al., 2016). Beman et al. (2011) studied changes in the nitrification rate under ocean acidification, showing that the nitrification rate decreased significantly while the pH dropped to the predicted value (ΔpH = 0.2) of the future ocean. The N2O produced by nitrification could be reduced by 0.06–0.83 Tg N year−1 in the next 20–30 years under future ocean acidification. However, predictions of changing N2O production in ocean acidification scenarios should also consider the effects of ocean acidification on denitrification. Although increasing CO2 could have a negative effect on denitrification (Wan et al., 2016), it remains unclear how ocean acidification affects N2O production.
Most known coastal anoxic areas appear in semi-enclosed areas prone to water stratification (Naqvi et al., 2010). The Bohai Sea of China, a shallow semi-enclosed inland sea, is typical of such eutrophic water bodies (Li et al., 2015). Rapid industrial and agricultural development in the region has resulted in high nutrient input into the Bohai Sea, such that the nitrogen and phosphate content exceeds Chinese standards and the eutrophic area has continuously increased (Liu and Yin, 2010). Zhai et al. (2012) and Zhang et al. (2016) found low DO and pH over a wide range of the bottom of Bohai Sea, including a total area with DO <3.0 mg L−1 of ~4.2 × 10³ km2. These spatial characteristics are consistent with a double-center cold-water structure (Lin et al., 2006; Zhou et al., 2009).
In this study, we designed a laboratory incubation experiment, investigating the effects of ocean acidification and hypoxia on seawater N2O production in Bohai Bay, and then conducted aggregated boosted tree (ABT) and structural equation model (SEM) analyses to examine potential factors affecting N2O production. This study was designed to verify two hypotheses: (1) Ocean acidification alone (Acid) reduces seawater N2O production, while both hypoxia alone (Hyp) and ocean acidification with hypoxia (Acid + Hyp) conditions increase seawater N2O production, and (2) hypoxia and ocean acidification change N2O production by altering seawater properties rather than directly affecting N2O production. A better understanding of changes in N2O production and its mechanisms in the Bohai Sea hypoxic zone under future ocean acidification can provide data for improved prediction models.
Materials and Methods
Sample Collection and Experimental Manipulation
A marine survey was conducted in August 2017 (Figure 1). Seawater depth at sampling stations ranged from 6 to 27 m, with the deepest at station A5 (Figure 1). Seawater samples for N2O, pH, and DO were collected, using 5-L Niskin bottles, and vertical profiles of DO and pH were measured simultaneously with the Maestro multiparameter sensor (RBR Maestro 3). Temperature and salinity sensors were calibrated prior to the survey, and DO and pH sensor data were corrected by measured data before use. Samples for the incubation experiment were calibrated on December 21, 2017, at 117°48′11″E, 38°58'41″N (station A: relatively low high-quality exogenous substance input) and 117°43′23″E, 39°553″N (station B: relatively high quality of exogenous substance input because of human activity, especially nitrogen). The 5-L polycarbonate culture bottles filled with seawater were airtight and were kept in the dark for 2 h when transporting back to the laboratory. Experiments were performed with the experimental platform already set up and four target pCO2 and oxygen levels, with triplicate samples per treatment (Figure 1, Table 1). All treatments were manipulated by gentle bubbling via plastic diffusers at uniform rates with commercially prepared air (CO2:O2 mixture) using acid-washed tubing. The bottle caps were customized for gas inlet/outlet and connected to the air mixture. The experiments were equilibrated for 6 h, distributed in 5-L polycarbonate bottles, sealed for 64 h, and maintained in a laboratory incubator at in situ temperature (15°C) in the dark (Table 1). Seawater CO2 parameters were verified by measuring pH and dissolved inorganic carbon (DIC).
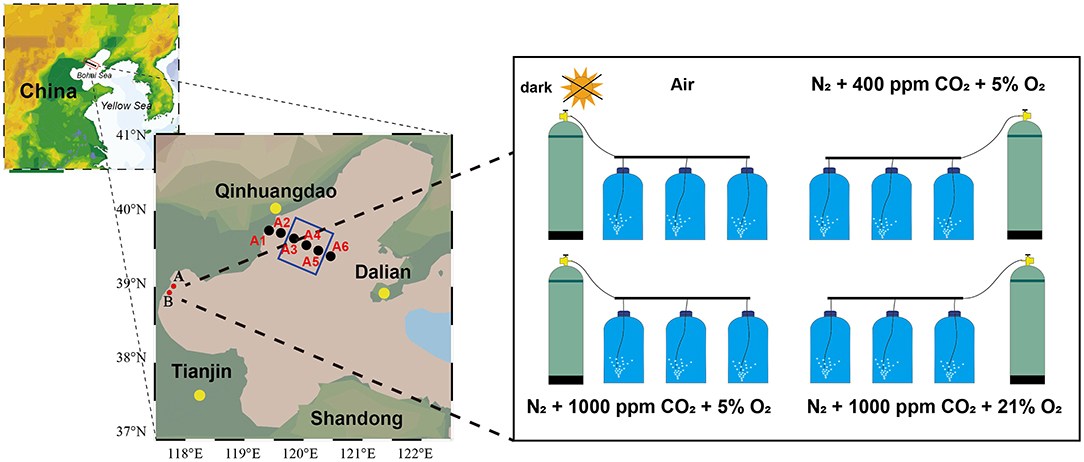
Figure 1. Location of the study area and incubation setup. Black dots indicate sampling sites during Bohai Sea cruises, red dots indicate hatchery experiment sampling sites, and the blue square indicates the hypoxia zone [defined as dissolved oxygen (DO) <3 mg L−1 by Zhai et al., 2012].
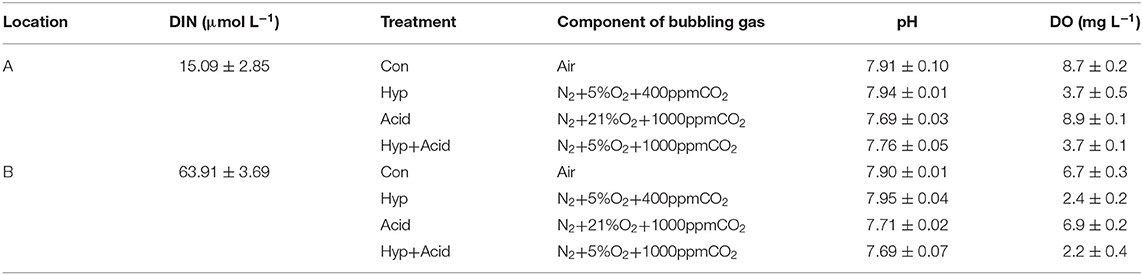
Table 1. Overview of experiments, including sampling locations, treatments (Con, control; Hyp, hypoxia; Acid, acidification; Hyp+Acid, combination of hypoxia and acidification), and components of bubbling gas, pH, and dissolved oxygen (DO).
N2O Analysis
Triplicate samples were collected using acid-cleaned Tygon tubing by siphoning from 5-L incubation bottles into acid-washed 60-ml glass vials. Samples were allowed to overflow for two times the volume of the bottle to eliminate air bubbles. Samples were treated with 0.1 ml of saturated mercuric chloride and sealed with butylene rubber stoppers and an aluminum crimp seal. The rubber plug of the sample bottle was first penetrated by an injection syringe; then, 5.0-ml-high purity N2 (> 99.999%) was injected into the bottle with an airtight syringe. At the same time, 5.0 ml of the sample was discharged from the bottle through the syringe to form headspace in the bottle. The bottle was then shaken for 30 min and balanced for 2 h at room temperature. A subsample of the equilibrated headspace was manually injected into a gas chromatograph (GC) with electron capture detection (SHIMADZU GC-2010 Plus), equipped with an HP-Plot/column (J and WGC Columns, Agilent Technologies, USA). The GC was calibrated daily with three different concentrations of standard gases (291, 617, and 4,980 ppbv N2O/N2, Research Institute of China National Standard Materials). The N2O concentrations in the samples were calculated using the solubility function of Weiss and Price (1980). The detection limit for N2O analysis was 1.0 nmol L−1, and the precision was ~2%.
Ancillary Measurements
Dissolved oxygen samples were transferred, stored, and analyzed using the Winkler method (Grasshoff et al., 1999). The relative standard deviation of the three samples was 2%. The pH of the collected samples was measured in situ. A Shimadzu TOC-L analyzer was used to repeat the sample three times in the laboratory, and the DIC concentrations of all repeat subsamples were measured. Water samples for nutrient analysis were filtered through 0.45-μm acetate cellulose membrane filters. The filtrates were poisoned with HgCl2 and stored in the dark at 4°C. Nutrients, including ammonium (), nitrate (), and nitrite (), were determined using a Technicon AA3 Auto-Analyzer (Bran+Luebbe) according to classical colorimetric methods (Wu et al., 2019). , , and were measured using the indophenol blue method, the copper–cadmium column reduction method, and the phosphor-molybdate complex method, respectively.
Statistical Analysis
Repeated two-way multivariate ANOVA (two-way MANOVA) with IBM SPSS Statistics software (version 23.0) was used to examine the effects of treatments and their interactions on N2O production during incubation. Pearson correlation coefficients were used to evaluate the relationships between N2O production and relevant physical and chemical indicators. This analysis was conducted using the “corrplot” package (Simko, 2017) for R statistical software (version 4.0.3, R Core Team, 2020). ABT modeling was used to explain the relative influence of related parameters on N2O production using the “gbmplus” package in R (De'ath, 2007). SEM was used to assess the relative direct and indirect impacts of ocean acidification and hypoxia on N2O production (Alsterberg et al., 2013; Shi et al., 2016; Zhang et al., 2019; Wang et al., 2020). The SEM fit was evaluated using the chi-square test (χ2), comparative fit index (CFI), root mean square error of approximation (RMSEM), and other parameters.
Results
Vertical and Horizontal Profiles of Seawater Chemical Properties
The sea surface temperature (SST) was horizontally stable at ~28°C across the entire sampling area. Vertical temperature profiles showed an obvious cold water mass in the bottom layer of A3, A4, and A5, implying an obvious thermocline in the middle layer. Vertical density profiles closely mirrored those of temperature, implying that the latter was the dominant factor controlling the former. In contrast, the halocline was much weaker, and the bottom-surface difference in salinity was mostly <1 across the vertical profile. Chlorophyll a showed little vertical variation but increased toward the land, with a maximum concentration of 17.5 μg L−1 at A1.
Vertical profiles of DO and pH showed similar stratification patterns, with the surface and bottom layers being uniform or having weak gradients, but the middle layer having rapid changes (Figure 2). DO and pH were higher in the surface layer than in the bottom layer. As for oxygen, A3, A4, and A5 were located in the oxygen minimum zone (O2 <3.0 mg L−1), with the bottom of A3 having the lowest oxygen concentration and highest N2O concentration (37.5 nmol L−1). High N2O production was accompanied by ocean acidification and hypoxia. The maximum N2O patterns were consistent with rapid changes in DO and pH.
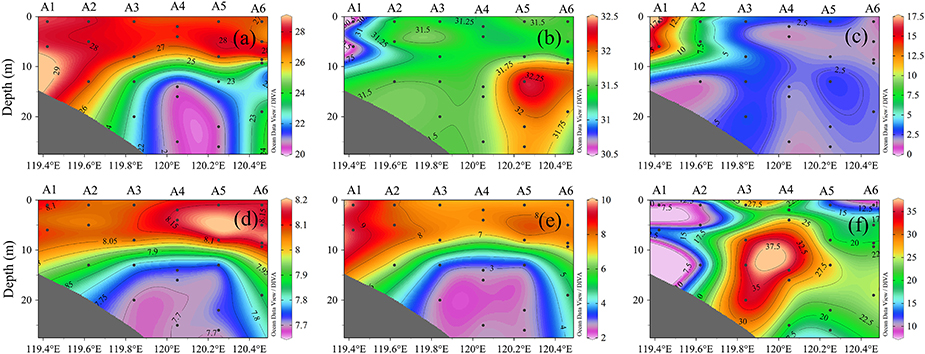
Figure 2. Vertical profiles of (a) temperature, (b) salinity, (c) chlorophyll a, (d) pH, (e) DO, and (f) N2O at stations A1–A6.
Seawater Chemical Properties After Incubation
Seawater that received the Hyp and Acid treatments differed in pH, DIC, DO, particulate organic carbon and nitrogen [particulate organic carbon (POC) and particulate organic nitrogen (PON)], and various inorganic nitrogen forms (, , and ) after 64 h of incubation (Tables 2A,B). For the four treatment groups, the concentrations of seawater -N and -N at Dongjiang port were four to five times higher than that at the Hongxing wharf. In addition, Hyp produced the highest -N and -N. For -N, all treatment groups were higher than the ambient control (Con), but, for -N, all treatment groups performed the same except for Acid (Figure 3). Compared with the Con, DO in Hyp at the Dongjiang port and the Hongxing wharf reached 3.7 and 2.4 mgL−1, respectively, while pH for that group at the Dongjiang port and the Hongxing wharf reached 7.69 and 7.71, respectively.
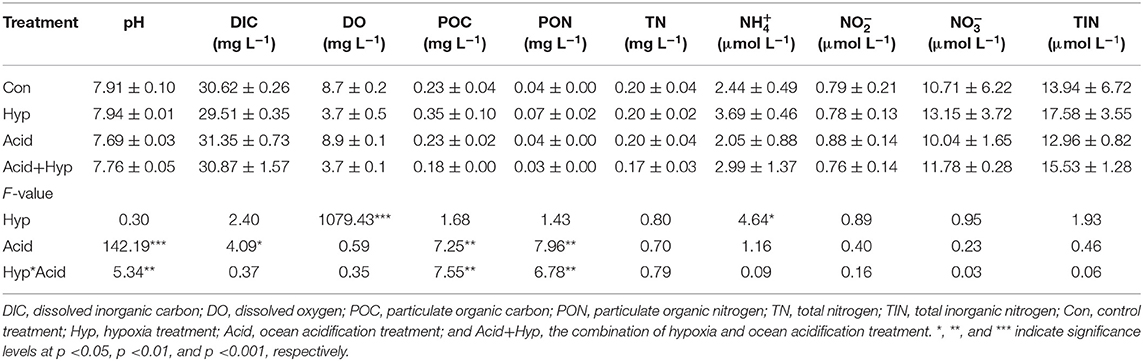
Table 2A. Effects of ocean acidification and hypoxia on chemical properties of seawater samples at the Dongjiang port.
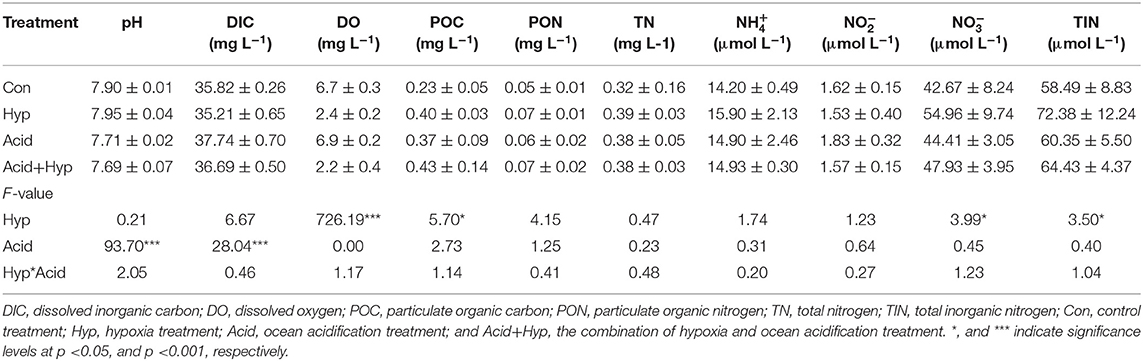
Table 2B. Effects of ocean acidification and hypoxia on water chemical properties at the Hongxing wharf.
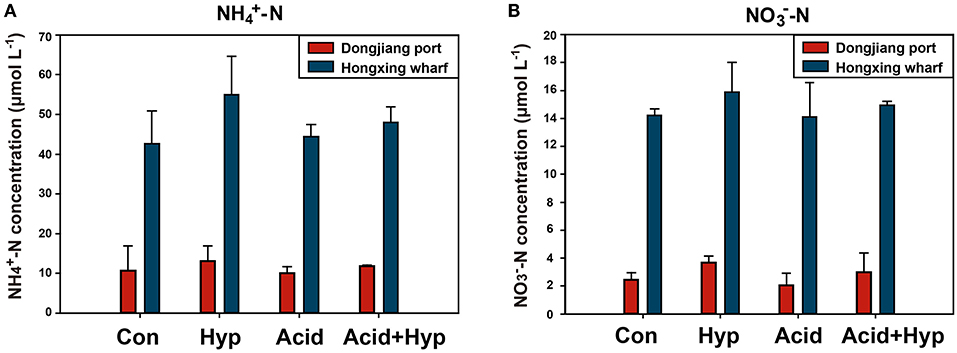
Figure 3. Concentrations of (A) ammonium and (B) nitrate for different incubation treatments (Con, control; Hyp, hypoxia; Acid, acidification; Acid+Hyp, the combination of hypoxia and acidification).
At the Dongjiang port, Hyp had a significant effect on DO (p < 0.001) and -N (p < 0.01) concentrations, while Acid had a significant effect on pH, POC, and PON (p < 0.05). At the Hongxing wharf, Hyp had a significant effect on DO (p < 0.001) and -N (p < 0.05) concentrations, while Acid had a significant effect on pH and DIC concentrations (p < 0.001). Significantly, interactive effects between Acid and Hyp on pH, POC, and PON (p < 0.05) were identified by a two-way MANOVA.
N2O Concentrations in Incubated Seawater Samples
After incubation, N2O production showed strong variability between the different treatments (Figure 4). First, both Hyp and Acid treatment had significant effects on N2O potential production from different anthropogenic nitrogen input regions. Hyp had a positive effect on N2O potential production compared with Acid; the higher the anthropogenic nitrogen input, the greater was the effect. Relative to Con, Acid resulted in mean N2O production, dropping from 2.72 to 1.34 nmol L−1 at the Dongjiang port and from 23.09 to 6.38 nmol L−1 at the Hongxing wharf, while the observed N2O concentrations decreased by 50.77 and 72.38%, respectively. Also, relative to Con, Hyp resulted in mean N2O production, increasing from 2.72 to 4.08 nmol L−1 at the Dongjiang port and from 23.09 to 110.78 nmol L−1 at the Hongxing wharf, while the observed N2O concentrations increased by 49.72 and 278.68%, respectively (Figure 4, Table 3). Similar to Hyp, Hyp+Acid significantly increased N2O potential production (compared with Con) from 2.72 to 3.17 nmol L−1 at the Dongjiang port and from 23.09 to 58.68 nmol L−1 at the Hongxing wharf, while the observed N2O concentrations increased by 16.23 and 96.38%, respectively (Figure 4A). As expected, regions with high anthropogenic nitrogen inputs responded more to different treatments, mainly because these inputs increased substrate concentrations for nitrification and denitrification, and nitrogen utilization increased (Figure 4).
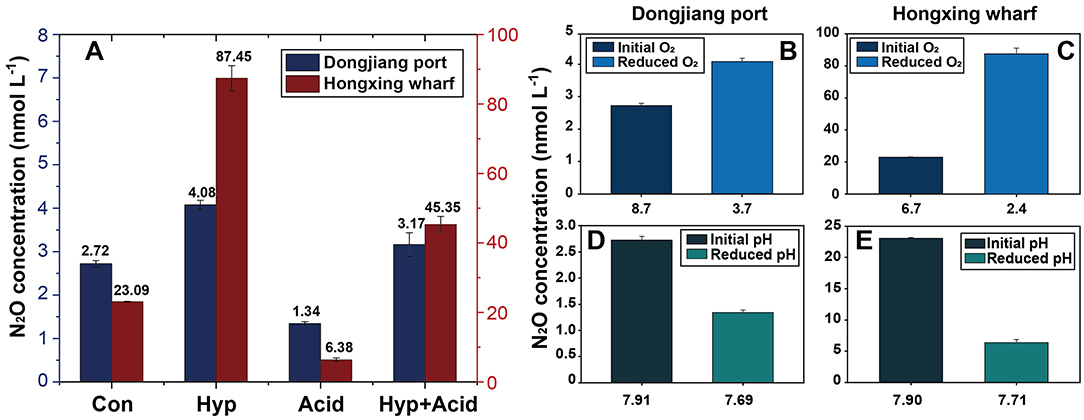
Figure 4. Treatment effects on N2O concentration in the seawater samples (A), changes of reduced O2 on N2O concentration (B,C), changes of reduced pH on N2O concentration (D,E), Con, control; Hyp, hypoxia treatment; Acid, ocean acidification treatment; Aci+Hyp, the combination of hypoxia and ocean acidification treatment.
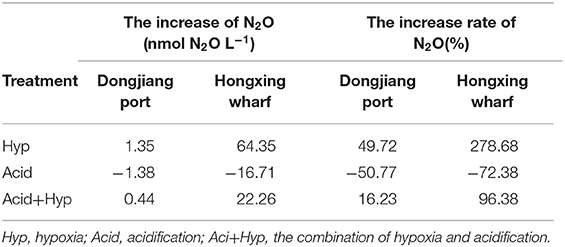
Table 3. Increase in, and the increased rate of, N2O under different treatments at the Dongjiang port and the Hongxing wharf.
Relationships Between N2O Concentration and Relative Parameters
Pearson's correlation analysis showed significant variability between different anthropogenic nitrogen input seawater responses to different treatments (Figure 5). There was a significant positive correlation between N2O concentration and -N at the Dongjiang port (p < 0.001), indicating that the N2O in this region was mainly produced by nitrification, which was consistent with results from the open ocean (Beman et al., 2011). Seawater pH and DO were positively and negatively correlated with N2O concentration, respectively, consistent with our first hypothesis. However, at the Hongxing wharf, the results were different; there was a significant positive correlation between N2O concentration and -N (p < 0.05), and DO was significantly correlated with N2O concentration (p < 0.001) (Figure 5). DO, pH, and DIC accounted for 31.3, 25.1, and 18.2%, respectively, of the relative influencing factors for N2O potential production at the Dongjiang port much larger than for the other parameters. Similarly, DO, pH, and DIC accounted for 47.9, 17.5, and 14.5%, respectively, of the relative influencing factors for N2O potential production at the Hongxing wharf (Figure 6). This result indicated that changes in DO, pH, and DIC might be responsible for the increase in N2O potential production. Overall, hypoxia and acidification are likely to change the future patterns of ocean N2O potential production.
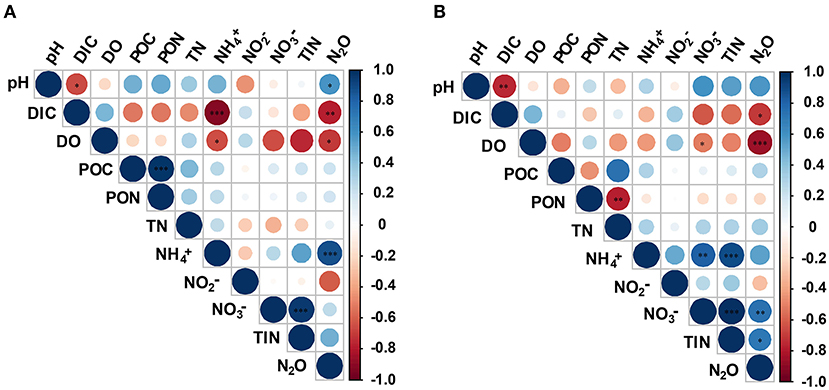
Figure 5. Correlation analysis between environmental parameters and N2O potential production for (A) the Dongjiang port and (B) the Hongxing wharf. Circle colors and sizes represent Pearson's correlation coefficients (r). *, **, and ***indicate significance levels at p < 0.05, p < 0.01, and p < 0.001, respectively. DIC, dissolved inorganic carbon; DO, dissolved oxygen; POC, particulate organic carbon; PON, particulate organic nitrogen; TN, total nitrogen; TIN, total inorganic nitrogen.
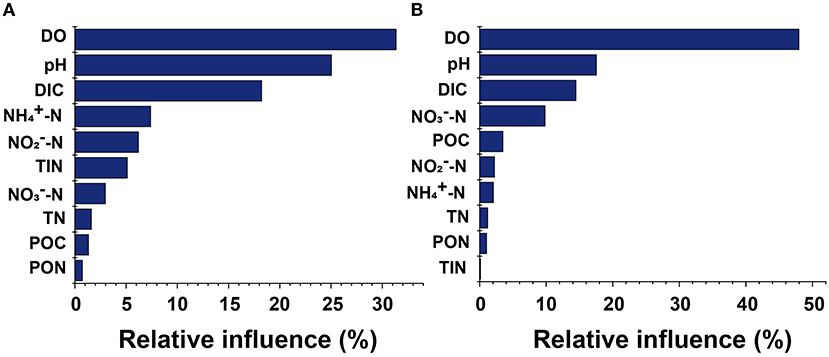
Figure 6. Relative influences of parameter contributions to seawater N2O potential production for (A) the Dongjiang port and (B) the Hongxing wharf. DIC, dissolved inorganic carbon; DO, dissolved oxygen; POC, particulate organic carbon; PON, particulate organic nitrogen; TN, total nitrogen; TIN, total inorganic nitrogen.
The SEM also showed strong variability between different anthropogenic nitrogen input seawater responses to different treatments (Figure 7). The total effect of ocean acidification and hypoxia on seawater N2O potential production at the Hongxing wharf was greater than at the Dongjiang port, which may be related to the -N wastewater discharged by humans. These results showed that the overall effect of hypoxia on seawater N2O potential production was positive, while ocean acidification was negative, in agreement with our incubation experiments. SEM also confirmed the regulatory effect of inorganic nutrients on the effects of hypoxia and ocean acidification on seawater N2O potential production.
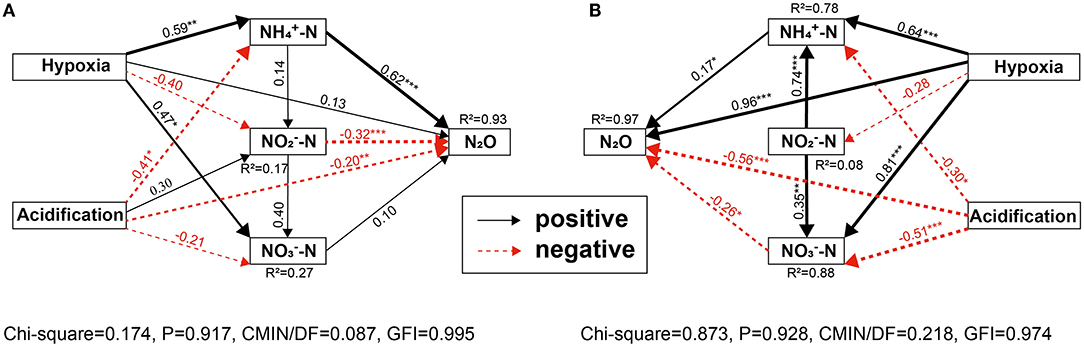
Figure 7. (A,B) SEM analysis examining the effects of ocean acidification and hypoxia on N2O potential production for (A) Dongjiang port; (B) Hongxing watrf. Solid black and red arrows indicate significant positive and negative effects, and gray lines indicate non-significant coefficients paths. *, **, and ***indicate significance levels at p < 0.05, p < 0.01, and p < 0.001, respectively. R2-values associated with response variables represent the proportion of variation explained by the relationship with other variables. Values associated with arrows represent standardized path coefficients.
Discussion
Potential Factors for Reducing N2O Concentration From Ocean Acidification
Our results showed that CO2-driven ocean acidification reduced N2O potential production in seawater. In the polar Atlantic Ocean, N2O production was sensitive to pH; when pH decreased by 0.06–0.4, N2O production decreased by 2.4–44% (Rees et al., 2016). The generation of seawater N2O under normal oxygen conditions has always been considered a product of nitrification (Beman et al., 2011). Previous studies suggested that ocean acidification would lead to a decrease in the ammonia oxidation rate, and reducing seawater pH also suppressed seawater N2O emissions (Beman et al., 2011). Sample collection for the incubation experiments was poured from the closed water sampler and immediately kept in the dark, and we assumed that the sampling process and phytoplankton had little influence on NH3 or . Since it has been shown that the composition of nitrifying bacterial communities can resist changes in ocean acidification, the observed N2O concentration changes seem more likely to be related to changes in the :NH3 equilibrium (Hutchins et al., 2009; Beman et al., 2011). pH may play an indirect role in controlling N2O potential production because it changes the chemical speciation of : NH3 covaries with other factors. NH3 acts as a substrate for nitrification (Ward, 2008). According to the equilibrium equation of Bell et al. (2008), a decrease in seawater pH from 8.1 to 7.8 will lead to a 50% decrease in NH3 concentration under constant temperature (22°C) and salinity (Wyatt et al., 2010). Using that equation, we estimated the NH3 concentrations based on the calculated pKa values, pH, and concentrations measured in situ. A pKa fixed value of 9.25 suggested that NH3 typically accounted for 6.3% of the total NHx. Beman et al. (2011) found significant correlations between the percentage changes in NH3, pH, and ammonium oxidation rates (Hutchins et al., 2009) and (Kitidis et al., 2011) between pH and ammonium oxidation. We showed a similar relationship between the absolute values of pH and N2O and the correlation between N2O and NH3 in the incubation experiments (Figure 8) (R2 = 0.63, p < 0.05) as a result of the induced shift in the : NH3 ratio. Our results indicated that changes in pH of 0.25 in the coastal waters of the Bohai Sea may lead to decreases in N2O potential production of 50.77 and 72.38% due to a reduced NH3 regime of 33.8 and 40.2%, respectively.
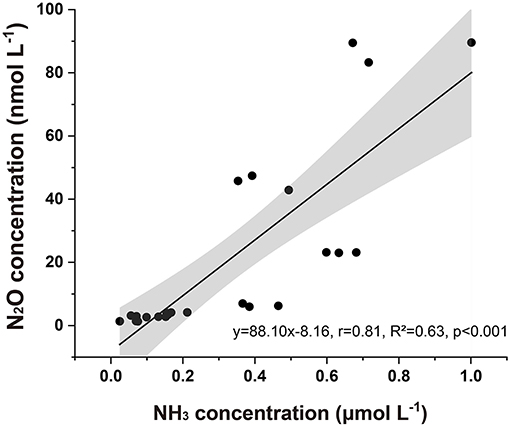
Figure 8. Seawater N2O concentration associated with estimated NH3 concentration after incubation. The gray area represents a 95% confidence interval.
In contrast, Breider et al. (2019) examined the response of N2O production from nitrification to acidification in a series of incubation experiments conducted in the subtropical and subarctic western North Pacific, showing that, when the pH decreased, the N2O production rate significantly increased during the nitrification process, while the nitrification rate remained stable or decreased. We suggest two possible explanations for this difference. First, despite the beginning oxygen of Acid being comparable to the surrounding oxygen concentration, after 64 h, the oxygen centralization in the incubation bottles might have slightly diminished, hindering nitrification, on the other hand, according to Ji et al. (2018), when O2> 6 μmol L−1 was 98% and showed complete inhibition on N2O production from and reduction. The oxygen consumed by our incubation process is limited and does not make the oxygen in the incubation bottles reach the threshold value of denitrification, ultimately leading to a reduction in N2O potential production. Second, the methods of acidification treatment were different between the two studies. They used HCl solutions and aerated the system with different concentrations of combined CO2 and O2 to achieve acidification (Breider et al., 2019). We changed the system pH and altered the seawater carbonate system, affecting N2O potential production. In addition, pH reduction had a greater effect on N2O in the anthropogenic nitrogen input samples, which may have been related to the high -N in human wastewater discharge.
As ocean acidification intensifies, N2O production decreases, indicating that future ocean acidification is likely to reduce ocean N2O potential production, resulting in negative feedback relative to global warming (Beman et al., 2011). Beman et al. (2011) estimated that an observed reduction in nitrification rates of 3–44% would result in a reduction in global N2O production of 0.06–0.83 Tg N/year over the next 20–30 years. Codispoti (2010) adopted a similar approach and assuming that 50% of the global ocean source of N2O was 3.8 Tg Nyear−1. For the less anthropogenic nitrogen input area (pH decreased by 0.25), the estimated reduction of marine N2O sources was ~0.96 year−1. For the large anthropogenic nitrogen input area (pH decreased by.25), the estimated reduction of marine N2O sources was ~1.38 year−1.
Effect of Hypoxia on N2O Potential Production
The potential production of N2O increased significantly with decreasing DO concentration. Although the regulatory effect of oxygen on N2O production in the ocean is widely accepted in principle [~100 papers cite Goreau et al. (1980) on N2O production in the ocean], to the best of our knowledge, there have been few studies on the effect of oxygen on N2O production in Bohai Bay. Due to eutrophication and environmental degradation, seasonal oxygen shortages in this location may expand in the future. Our results showed a non-linear relationship between N2O concentration and O2 concentration, with the former increasing as the latter decreases (Figure 9A). The basic linear relationship of ΔN2O/AOU is often used to simulate the distribution of N2O in the ocean, in which the slope value of ΔN2O–AOU is regarded as the N2O yield from nitrification, indicating the amount of N2O produced per amount of O2 consumed (Nevison et al., 2003). This theory varies widely (0.08–0.31 nmol N2O per mmolO2), making it difficult to capture the full dynamics of N2O production in hypoxic water (Nevison et al., 2003). Trimmer et al. also proposed a mixed-effects model, which points out that, between 1 and 30 mmol L−1 O2 concentration, a decrease in O2 concentration leads to a clear exponential increase in N2O (Yoshida et al., 1984); this is comparable to our results.
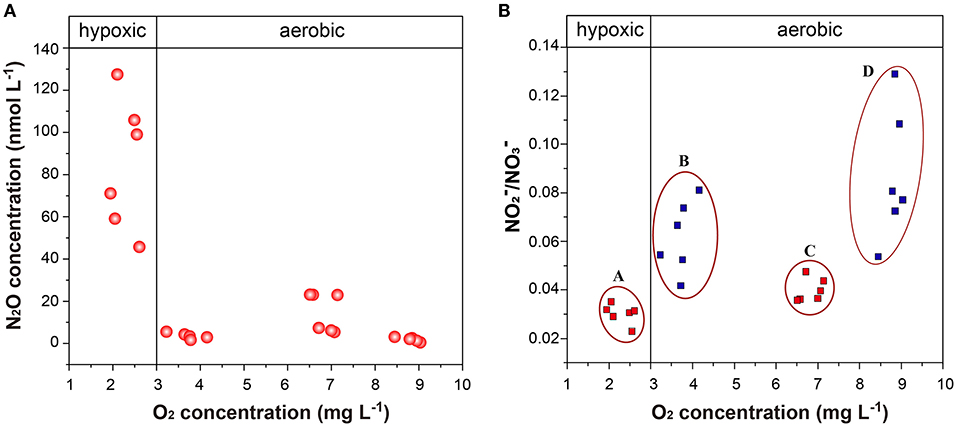
Figure 9. (A,B) O2 concentration vs. N2O concentration and / after incubation for (A) high anthropogenic nitrogen input seawater under Hyp; (B) low anthropogenic nitrogen input seawater under Hyp; (C) high anthropogenic nitrogen input seawater under Con; and (D) low anthropogenic nitrogen input seawater under Con. Con, control; Hyp, hypoxia; Acid, acidification; Aci+Hyp, the combination of hypoxia and acidification.
Both high and low anthropogenic nitrogen input seawater under Hyp resulted in a decreased / ratio after incubation (Figure 9B). We speculate that nitrification and denitrification may occur together with a decrease in oxygen concentration (even when the oxygen concentration does not reach complete denitrification), and as is the basis for both nitrification and denitrification (Wilson et al., 2014), the consumption of is greater than production. This is similar to Ji et al. (2018), whose 15N tracer incubation experiments showed that denitrification was the dominant source of N2O production in the anoxic and the peripheral suboxic waters, because rates of N2O production from and reduction were 10- to 100-fold higher than N2O production from oxidation. Our results also support this view, indicating that oxygen concentration in the oxycline supports nitrification and denitrification, resulting in maximum N2O concentration.
Direct vs. Indirect Effects of Ocean Acidification and Hypoxia on Inorganic Nitrogen and N2O Potential Production
Our second hypothesis was that hypoxia and ocean acidification changed N2O potential production by altering seawater properties rather than directly affecting N2O production. DO, pH, and DIC were the key factors affecting N2O potential production (Figure 6). SEM also showed strong variability among different anthropogenic nitrogen input seawater responses to different treatments. These results suggested a role for the indirect effects of ocean acidification and hypoxia on inorganic nitrogen and N2O potential production in coastal marine systems. Ocean acidification may directly or indirectly affect N2O potential production through a variety of mechanisms, including AOA abundance (Rees et al., 2016) and nitrification rates (Beman et al., 2011). In the Dongjiang port, both hypoxia and ocean acidification had direct effects on seawater N2O potential production (Hypoxia → N2O, path coefficients >0.10, but P < 0.05; acidification → N2O, path coefficients >0.10 and P > 0.05) but indirect effects via -N, -N, and -N (Figure 9A). Hypoxia increased -N and -N, which, in turn, increased N2O potential production, while hypoxia also reduced -N and increased N2O potential production. Thus, the total effect of hypoxia on seawater N2O potential production was positive (0.67). Ocean acidification reduced -N and -N, which, in turn, reduced N2O potential production, and ocean acidification also increased -N and reduced N2O potential production. Thus, the total effects of ocean acidification on seawater N2O potential production were negative (0.57). Hypoxia increased, whereas ocean acidification reduced, seawater N2O potential production via direct effects (Figure 9A).
Interestingly, the direct and indirect effects of hypoxia treatment on changes in N2O potential production counteracted the effects of ocean acidification. As hypoxia and ocean acidification increased N2O potential production, the negative effects of ocean acidification were canceled, and the total effects were positive (0.10). The situation seems to have changed at the Hongxing wharf, where both hypoxia and ocean acidification had significant direct effects on seawater N2O potential production (Hypoxia → N2O, path coefficients >0.10 and P < 0.05; acidification → N2O, path coefficients >0.10 and P > 0.05), with indirect effects via -N (Figure 9B). Hypoxia increased -N and -N, which, in turn, increased N2O potential production. Thus, the total effect of hypoxia on seawater N2O potential production was positive (0.86). Ocean acidification reduced -N and -N, which, in turn, reduced N2O potential production. Thus, the total effects of ocean acidification on seawater N2O potential production were negative (0.48). Ocean acidification reduced -N and -N, which, in turn, reduced N2O potential production. Hypoxia increased, whereas ocean acidification reduced seawater N2O potential production via direct effects (Figure 9B). Interestingly, the direct and indirect effects of hypoxia treatment on changes in N2O potential production counteracted the effects of ocean acidification. As hypoxia and ocean acidification increased N2O potential production, the negative effects of ocean acidification were canceled, and the total effects were positive (0.38).
The causes of hypoxia and acidification at the bottom of the Bohai Sea are very complex, including the coupling of physical, chemical, and biological processes, the most important of which is caused by the oxygen consumption of biological processes. It is well-known that DO in seawater is significantly related to photosynthesis and the decomposition of organic matter in phytoplankton. The photosynthesis of phytoplankton within the euphotic layer results in high dissolved oxygen. In situ biological production, especially that driven by nitrification, is commonly considered to be the major mechanism of N2O production in the ocean (Naqvi et al., 2010). The formation of a seawater thermocline limits the exchange of DO from the surface to the bottom, a key physical mechanism of the oxycline in the Bohai Sea. Seasonal seawater stratification prevents the bottom N2O from being transported upward, such that nitrification and denitrification occur together, leading to the accumulation of N2O. Generally, phytoplankton blooms occur in spring with increasing temperature and light intensity in the Bohai Sea. The concentration of chlorophyll a reaches its highest level in summer with coefficients sunlight and terrestrial nutrient input (Liu and Yin, 2010). Therefore, due to the propagation of phytoplankton in nutrient-rich layers from spring to summer, the deposition of organic matter and aerobic decomposition provides the basis for hypoxia occurrence at the bottom during summer. This limitation of oxygen supply further increases the pressure of bottom mineralization, exacerbating bottom hypoxia and leading to denitrification. Aerobic decomposition of organic matter increases the pCO2 of the underlying seawater and increases acidification. Our experimental results showed that ocean acidification can attenuate N2O potential production in the OMZ, which may also be an important reason for the lower concentration of N2O at the bottom layer than in the middle layer.
Our experiments also showed that the coupling of ocean acidification and hypoxia increased N2O production in coastal water columns. The decrease in oxygen levels (Gruber, 2011; Gattuso et al., 2015) and the decrease in organic matter output to the deep sea due to ocean acidification (Gehlen et al., 2011, due to reduction in ballast effects) both affect N2O generation and atmospheric release. Hypoxia stimulates seawater N2O potential production with positive feedback effects on global warming, and ocean acidification weakens the increase in N2O caused by hypoxia. Previous studies argued that the occurrence of seasonal hypoxia in the Bohai Sea is often accompanied by ocean acidification (Riebesell and Gattuso, 2015; Wei et al., 2019; Zhai et al., 2019; Song et al., 2020), but the results show that hypoxia and ocean acidification are antagonistic to each other and that artificial nitrogen input can amplify this change. This finding provides a basis for more accurate estimations of offshore greenhouse gas production models.
Conclusions
Ocean acidification and hypoxia decreased and increased N2O potential production, respectively. Incubation experiments showed that the combination of ocean acidification and hypoxia significantly increased N2O potential production, but, individually, there was an antagonistic relationship between the two. Seawater pH, DIC, DO, -N, and TIN were the primary predictors of sensitivity to N2O potential production. SEM analysis showed that the direct and indirect effects of hypoxia treatment on N2O potential production changes counteracted the effects of ocean acidification treatment. As hypoxia and ocean acidification together increased N2O potential production, the negative effects of ocean acidification were canceled out, resulting in overall positive effects. Generally speaking, our results showed that N2O potential production from coastal waters of the Bohai Sea may increase under future climate change scenarios by enhancing both ocean acidification and hypoxia. Future research should focus on whether these experimental results could be extrapolated to directly assess the response between in situ N2O potential production and climate change. Moreover, further attention should be paid to areas with high anthropogenic nitrogen input.
Data Availability Statement
The original contributions presented in the study are included in the article/supplementary material, further inquiries can be directed to the corresponding author/s.
Author Contributions
JS designed the study. TG and DJ performed the experiments. TG, DJ, XM, LP, YW and JS analyzed the data. GZ provided the nutrient data. TG, DJ and JS wrote the manuscript with input from all authors.
Funding
This research was financially supported by the National Key Research and Development Project of China (2019YFC1407803), the National Natural Science Foundation of China (42006174 and 41876134). This work was also supported by the Changjiang Scholar Program of Chinese Ministry of Education (T2014253) to JS and the Scientific Research Project of Tianjin Municipal Education Commission (2017KJ012) and the Open Fund of Tianjin Key Laboratory of Marine Resources and Chemistry (201901) to DJ and Key Laboratory of Integrated Marine Monitoring and Applied Technologies for Harmful Alga Blooms Open Project (MATHAB201829).
Conflict of Interest
The authors declare that the research was conducted in the absence of any commercial or financial relationships that could be construed as a potential conflict of interest.
Publisher's Note
All claims expressed in this article are solely those of the authors and do not necessarily represent those of their affiliated organizations, or those of the publisher, the editors and the reviewers. Any product that may be evaluated in this article, or claim that may be made by its manufacturer, is not guaranteed or endorsed by the publisher.
Acknowledgments
We are grateful to all laboratory colleagues for their help with this study and the writing of this paper.
References
Alsterberg, C., Eklof, J. S., Gamfeldt, L., Havenhand, J. N., and Sundback, K. (2013). Consumers mediate the effects of experimental ocean acidification and warming on primary producers. Proc. Natl. Acad. Sci. U.S.A. 110, 8603–8608. doi: 10.1073/pnas.1303797110
Arévalo-Martínez, D. L., Kock, A., Löscher, C. R., Schmitz, R. A., and Bange, H. W. (2015). Massive nitrous oxide emissions from the tropical South Pacific Ocean. Nat. Geosci. 8, 530–533. doi: 10.1038/ngeo2469
Babbin, A. R., Bianchi, D., Jayakumar, A., and Ward, B. B. (2015). Rapid nitrous oxide cycling in the suboxic ocean. Science 348, 1127–1129. doi: 10.1126/science.aaa8380
Bange, H. W. (2006). New directions: the importance of oceanic nitrous oxide emissions. Atmos. Environ. 40, 198–199. doi: 10.1016/j.atmosenv.2005.09.030
Bell, T. G., Johnson, M. T., Jickells, T. D., and Liss, P. S. (2008). Ammonia/ammonium dissociation coefficient in seawater: a significant numerical correction. Environ. Chem. 4, 183–186. doi: 10.1071/EN07032
Beman, J. M., Chow, C. E., King, A. L., Feng, Y., and Fuhrman, J. A. (2011). Global declines in oceanic nitrification rates as a consequence of ocean acidification. Proc. Natl. Acad. Sci. U.S.A. 108, 208–213. doi: 10.2307/25770752
Breider, F., Yoshikawa, C., Makabe, A., Toyoda, S., Wakita, M., Matsui, Y., et al. (2019). Response of N2O production rate to ocean acidification in the western North Pacific. Nat. Clim. Change 9, 954–958. doi: 10.1038/s41558-019-0605-7
Codispoti, L. A. (2010). Interesting times for marine N2O. Science 327, 1339–1340. doi: 10.1126/science.1184945
Crutzen, P. J., and Ehhalt, D. (1977). Effects of nitrogen fertilizers and combustion on the stratospheric ozone layer. Ambio, 6, 112–117.
De'ath, G. (2007). Boosted trees for ecological modeling and prediction. Ecology 88, 243–251. doi: 10.2307/27651085
Freing, A., Wallace, D., and Bange, H. W. (2012). Global oceanic production of nitrous oxide. Philos. Trans. R. Soc. B Biol. Sci. 367, 1245–1255. doi: 10.1098/rstb.2011.0360
Gattuso, J.-P., Magnan, A., Bille, R., Cheung, W. W. L., and Howes, E. L. (2015). Contrasting futures for ocean and society from different anthropogenic CO2 emissions scenarios. Science 349, 4722–4722. doi: 10.1126/science.aac4722
Gehlen, M., Gruber, N., and Skaland, R. (2011). Biogeochemical consequences of ocean acidification and feedbacks to the earth system. doi: 10.1093/oso/9780199591091.003.0017
Goreau, T. J., Kaplan, W. A., Wofsy, S. C., Mcelroy, M. B., and Watson, S. W. (1980). Production of and N2O by nitrifying bacteria at reduced concentrations of oxygen. Appl. Environ. Microbiol. 40, 526–532. doi: 10.1016/0141-4607(80)90006-2
Grasshoff, K., Kremling, K., and Ehrhardt, M. (1999). Methods of Seawater Analysis. Weinheim: Verlag Chemie. doi: 10.1002/9783527613984
Gruber, N. (2011). Warming up, turning sour, losing breath: ocean biogeochemistry under global change. Philos. Trans. R. Soc. A Math. Phys. Eng. Sci. 369, 1980–1996. doi: 10.1098/rsta.2011.0003
Hutchins, D. A., Fu, F.-X., Zhang, Y., Warner, M. E., Feng, Y., Portune, J. K., et al. (2007). CO2 control of Trichodesmium N2 fixation, photosynthesis, growth rates, and elemental ratios: implications for past, present, and future ocean biogeochemistry. Limnol. Oceanogr. 52, 1293–1304. doi: 10.4319/lo.2007.52.4.1293
Hutchins, D. A., Mulholland, M. R., and Fu, F. X. (2009). Nutrient cycles and marine microbes in a CO2-enriched ocean. Oceanography 22, 128–145. doi: 10.5670/oceanog.2009.103
Ji, Q., Babbin, A. R., Jayakumar, A., Oleynik, S., and Ward, B. B. (2015). Nitrous oxide production by nitrification and denitrification in the Eastern Tropical South Pacific oxygen minimum zone. Geophys. Res. Lett. 42, 10755–10764. doi: 10.1002/2015gl066853
Ji, Q., Buitenhuis, E., Suntharalingam, P., Sarmiento, J. L., and Ward, B. B. (2018). Global nitrous oxide production determined by oxygen sensitivity of nitrification and denitrification. Glob. Biogeochem. Cycles 32, 1790–1802. doi: 10.1029/2018gb005887
Kalvelage, T., Lavik, G., Lam, P., Contreras, S., Arteaga, L., Löscher, C. R., et al. (2013). Nitrogen cycling driven by organic matter export in the South Pacific oxygen minimum zone. Nat. Geosci. 6, 228–234. doi: 10.1038/NGEO1739
Kitidis, V., Laverock, B., McNeill, L. C., Beesley, A., Cummings, D., Tait, K., et al. (2011). Impact of ocean acidification on benthic and water column ammonia oxidation. Geophys. Res. Lett. 38:21603. doi: 10.1029/2011GL049095
Kock, A., Arévalo-Martínez, D. L., Löscher, C. R., and Bange, H. W. (2016). Extreme N2O accumulation in the coastal oxygen minimum zone off Peru. Biogeosciences 13, 827–840. doi: 10.5194/bg-13-827-2016
Le Quéré, C., Peters, G. P., Andres, R. J., Andrew, R. M., Boden, T., Ciais, P., et al. (2014). Global carbon budget 2013. Earth Syst. Sci. Data Discuss. 6, 689–760. doi: 10.5194/essdd-6-689-2013
Li, Y., Wolanski, E., and Zhang, H. (2015). What processes control the net currents through shallow straits? A review with application to the Bohai Strait, China. Estuar. Coast. Shelf Sci. 158, 1–11. doi: 10.1016/j.ecss.2015.03.013
Lin, X., Xie, S.-P., Chen, X., and Xu, L. (2006). A well-mixed warm water column in the central Bohai Sea in summer: effects of tidal and surface wave mixing. J. Geophys. Res. 111:C11. doi: 10.1029/2006jc003504
Liu, H., and Yin, B. (2010). Numerical investigation of nutrient limitations in the Bohai Sea. Mar. Environ. Res. 70, 308–317. doi: 10.1016/j.marenvres.2010.06.003
Naqvi, S. W. A., Bange, H. W., Farías, L., Monteiro, P. M. S., Scranton, M. I., and Zhang, J. (2010). Marine hypoxia/anoxia as a source of CH4 and N2O. Biogeosciences 7, 2159–2190. doi: 10.5194/bg-7-2159-2010
Naqvi, S. W. A., Jayakumar, D. A., Narvekar, P. V., Naik, H., Sarma, V. V., D'Souza, W., et al. (2000). Increased marine production of N2O due to intensifying anoxia on the Indian continental shelf. Nature 408, 346–349. doi: 10.1038/35042551
Naqvi, S. W. A., Yoshinari, T., Jayakumar, D. A., Altabet, M. A., Narvekar, P. V., Devol, A. H., et al. (1998). Budgetary and biogeochemical implications of N2O isotope signatures in the Arabian Sea. Nature 394, 462–464. doi: 10.1038/28828
Nevison, C., Butler, J. H., and Elkins, J. W. (2003). Global distribution of N2O and the ΔN2O-AOU yield in the subsurface ocean. Glob. Biogeochem. Cycles 17, 1119. doi: 10.1029/2003GB002068
Nevison, C. D., Weiss, R. F., and Erickson, D. J. III. (1995). Global oceanic emissions of nitrous oxide. J. Geophys. Res. Oceans 100, 15809–15820. doi: 10.1029/95jc00684
Orr, J. C., Fabry, V. J., Aumont, O., Bopp, L., Doney, S. C., Feely, R. A., et al. (2005). Anthropogenic ocean acidification over the twenty-first century and its impact on calcifying organisms. Nature 437, 681–686. doi: 10.1038/nature04095
Qin, D. H. (2014). Climate change science and sustainable development. Prog. Geogr. 33, 874–883. doi: 10.11820/dlkxjz.2014.07.002
Rees, A. P., Brown, I. J., Jayakumar, A., and Ward, B. B. (2016). The inhibition of N2O production by ocean acidification in cold temperate and polar waters. Deep Sea Res. II Top. Stud. Oceanogr. 127, 93–101. doi: 10.1016/j.dsr2.2015.12.006
Riebesell, U., and Gattuso, J. P. (2015). Lessons learned from ocean acidification research. Nat. Clim. Change 5, 12–14. doi: 10.1038/nclimate2456
Shi, Z., Xu, X., Souza, L., Wilcox, K., Jiang, L., Xia, J., et al. (2016). Dual mechanisms regulate ecosystem stability under decade-long warming and hay harvest. Nat. Commun. 7:11973. doi: 10.1038/ncomms11973
Song, G., Zhao, L., Chai, F., Liu, F., Li, M., Xie, H., et al. (2020). Summertime oxygen depletion and acidification in Bohai sea, China. Front. Mar. Sci. 7:252. doi: 10.3389/fmars.2020.00252
Stocker, T. F., Qin, D., Plattner, G. K., Tignor, M., Allen, S. K., Boschung, J., et al. (2013). The Physical Science Basis. Contribution of Working Group I to the Fifth Assessment Report of the Intergovernmental Panel on Climate Change. Computational Geometry.
Trimmer, M., Chronopoulou, P.-M., Maanoja, S. T., Upstill-Goddard, R. C., Kitidis, V., and Purdy, K. J. (2016). Nitrous oxide as a function of oxygen and archaeal gene abundance in the North Pacific. Nat. Commun. 7:13451. doi: 10.1038/ncomms13451
Wan, R., Chen, Y., Zheng, X., Su, Y., and Li, M. (2016). Effect of CO2 on microbial denitrification via inhibiting electron transport and consumption. Environ. Sci. Technol. 50, 9915–9922. doi: 10.1021/acs.est.5b05850
Wang, J., Cui, W., Che, Z., Liang, F., Wen, Y., Zhan, M., et al. (2020). Effects of synthetic nitrogen fertilizer and manure on fungal and bacterial contributions to N2O production along a soil acidity gradient. Sci. Tot. Environ. 753:142011. doi: 10.1016/j.scitotenv.2020.142011
Ward, B. (2008). “Nitrification in marine systems,” in Nitrogen in the Marine Environment, 2nd Edn, eds G. C. Douglas, A. B. Deborah, R. M. Margaret, and J. C. Edward (Academic Press) 199–261. doi: 10.1016/B978-0-12-372522-6.00005-0
Wei, Q., Wang, B., Yao, Q., Xue, L., Sun, J., Xin, M., et al. (2019). Spatiotemporal variations in the summer hypoxia in the Bohai Sea (China) and controlling mechanisms. Mar. Pollut. Bull. 138, 125–134. doi: 10.1016/j.marpolbul.2018.11.041
Weiss, R. F., and Price, B. A. (1980). Nitrous oxide solubility in water and seawater. Mar. Chem. 8, 347–359. doi: 10.1016/0304-4203(80)90024-9
Wilson, S. T., del Valle, D. A., Segura-Noguera, M., and Karl, D. M. (2014). A role for nitrite in the production of nitrous oxide in the lower euphotic zone of the oligotrophic North Pacific Ocean. Deep Sea Res. I Oceanogr. Res. Pap. 85, 47–55. doi: 10.1016/j.dsr.2013.11.008
Wu, C., Kan, J., Liu, H., Pujari, L., Guo, C., Wang, X., et al. (2019). Heterotrophic bacteria dominate the diazotrophic community in the Eastern Indian Ocean (EIO) during Pre-Southwest Monsoon. Microb. Ecol. 78, 804–819. doi: 10.1007/s00248-019-01355-1
Wyatt, N. J., Kitidis, V., Woodward, E. M. S., Rees, A. P., Widdicombe, S., and Lohan, A. M. (2010). Effects of high CO2 on the fixed nitrogen inventory of the Western English Channel. J. Plank. Res. 32, 631–641. doi: 10.1093/plankt/fbp140
Yoshida, N., Hattori, A., Saino, T., Matsuo, S., and Wada, E. (1984). 15N/14N ratio of dissolved N2O in the eastern tropical Pacific Ocean. Nature 307, 442–444. doi: 10.1038/307442a0
Zhai, W., Zhao, H., Su, J., Liu, P., Li, Y., Zheng, N., et al. (2019). Emergence of summertime hypoxia and concurrent carbonate mineral suppression in the central Bohai sea, China. J. Geophys. Res. Biogeosci. 124, 2768–2785. doi: 10.1029/2019JG005120
Zhai, W., Zhao, H., Zheng, N., and Xu, Y. (2012). Coastal acidification in summer bottom oxygen-depleted waters in northwestern–northern Bohai Sea from June to August in 2011 (in Chinese). Chin Sci Bull. 57, 753–758. doi: 10.1007/s11434-011-4949-2
Zhang, H., Li, Y., Tang, C., Zou, T., Yu, J., and Guo, K. (2016). Spatial characteristics and formation mechanisms of bottom hypoxia zone in the Bohai Sea during summer (in Chinese). Chin Sci Bull. 61, 1612–1620. doi: 10.1360/N972015-00915
Zhang, Y., Zhang, N., Yin, J., Yang, F., Zhao, Y., Jiang, Z., et al. (2019). Combination of warming and N inputs increases the temperature sensitivity of soil N2O emission in a Tibetan alpine meadow. Sci. Tot. Environ. 704:135450. doi: 10.1016/j.scitotenv.2019.135450
Keywords: ocean acidification, hypoxia, N2O emission, Bohai Sea, oxygen minimum zone
Citation: Gu T, Jia D, Ma X, Peng L, Zhang G, Wei Y, Lou T and Sun J (2021) Hypoxia-Enhanced N2O Production Under Ocean Acidification in the Bohai Sea. Front. Mar. Sci. 8:695105. doi: 10.3389/fmars.2021.695105
Received: 14 April 2021; Accepted: 22 June 2021;
Published: 23 July 2021.
Edited by:
Yunping Xu, Shanghai Ocean University, ChinaReviewed by:
Kunpeng Zang, Zhejiang University of Technology, ChinaXiao Ma, GEOMAR Helmholtz Center for Ocean Research Kiel, Germany
Copyright © 2021 Gu, Jia, Ma, Peng, Zhang, Wei, Lou and Sun. This is an open-access article distributed under the terms of the Creative Commons Attribution License (CC BY). The use, distribution or reproduction in other forums is permitted, provided the original author(s) and the copyright owner(s) are credited and that the original publication in this journal is cited, in accordance with accepted academic practice. No use, distribution or reproduction is permitted which does not comply with these terms.
*Correspondence: Jun Sun, cGh5dG9wbGFua3RvbkAxNjMuY29t; Tingting Lou, bG91dGluZ3RpbmdndWNhc0AxMjYuY29t
†These authors have contributed equally to this work