 Lu-Chi Chen1,2
 Jinn-Shing Weng3
 Muhamad Naimullah2Po-Yuan Hsiao2Chen-Te Tseng4
 Kuo-Wei Lan2,5*
 Che-Chen Chuang6
- 1Penghu Marine Biology Research Center, Fisheries Research Institute, Council of Agriculture, Executive Yuan, Penghu, Taiwan
- 2Department of Environmental Biology and Fisheries Science, College Science and Resources, National Taiwan Ocean University, Keelung, Taiwan
- 3Coastal and Offshore Resources Research Center, Fisheries Research Institute, Council of Agriculture, Executive Yuan, Kaohsiung, Taiwan
- 4Fisheries Research Institute, Council of Agriculture, Executive Yuan, Keelung, Taiwan
- 5Center of Excellence for Oceans, National Taiwan Ocean University, Keelung, Taiwan
- 6Fisheries Research Institute, Kinmen County Government, Kinmen, Taiwan
This study investigated the relationship of the catch rates (CRs) of Spanish mackerel (Scomberomorus commerson) with oceanographic factors in the waters around Taiwan by using high-resolution fishery and environmental data for the period 2011–2016. The investigation results revealed that trammel nets accounted for 69.79% of the total catch of S. commerson and were operated mostly in the Taiwan Strait (TS). We noted seasonal variations in the distribution of high CRs. These CRs were observed in the southwestern TS, including the waters along the southwestern coast of Taiwan and around the Penghu Islands, and extended to the Taiwan Bank during autumn; they increased in winter. To predict the spatial and temporal patterns of Spanish mackerel density and their relationship with oceanographic and spatiotemporal variables, generalized additive models were used. These models explained 48.4% of the total deviance, which was consistent with the assumed Gaussian distribution. Moreover, all variables examined were significant CR predictors (p < 0.05). Latitude and longitude were the key factors influencing the spatiotemporal distribution of S. commerson, and sea surface chlorophyll a concentration was a key oceanographic factor. Observing projected changes in El Niño/Southern Oscillation events for S. commerson revealed that CRs were higher and distributed further southward during La Niña events than during other events. We inferred that the S. commerson distribution gradually moved toward the southwest with the northeast monsoon, which was enhanced during La Niña in winter.
Introduction
The waters around Taiwan (hereafter abbreviated as WT) are affected by several currents, including the China Coastal Current, Kuroshio Current, Kuroshio Branch Current, and South China Sea Surface Current (Jan et al., 2002, 2006). Moreover, the fluctuation of these currents is strongly influenced by the seasonal monsoons and varied topography; consequently, the currents change the oceanographic conditions in the WT in different seasons (Lan et al., 2020b; Tseng et al., 2020). Biogeographically, the Taiwan Strait (TS) and waters off eastern Taiwan are migration routes for numerous pelagic fish species; therefore, their ecosystem dynamics and biogeochemical and physical processes vary substantially in space and time (Liao et al., 2018; Ju et al., 2020; Lin et al., 2020). The WT constitute excellent spawning, feeding, and overwintering habitats (Hsu et al., 2007; Madigan et al., 2016; Hsiao et al., 2021). Overall, these unique features contribute to the abundant and multiple living fishery resources in the coastal waters off Taiwan, rendering these waters a valuable fishing ground (Wang et al., 2013; Lan et al., 2014).
Scomberomorus species, which include the narrow-barred Spanish mackerel (Scomberomorus commerson), Japanese Spanish mackerel (Scomberomorus niphonus), and spotted Spanish mackerel (Scomberomorus koreanus), are crucial commercial species in the WT (Lin et al., 2020; Weng et al., 2020). According to the life-history features of Scomberomorus spp., the swimming dispersal of larvae and adults of these species is extensive, ensuring connectivity among stocks and causing genetic homogenization across distant populations (Shoji and Tanaka, 2005; Shui et al., 2009; Weng et al., 2020). Among these species, S. commerson is the most commonly caught, which accounts for 80% of the total production of Scomberomorus species in Taiwan (Figure 1; Fisheries Agency, 2019). S. commerson is a high-migration species and epipelagic predator that is extensively distributed in the Indo-Pacific region, from shallow coastal waters to the edge of the continental shelf at depths of 10–70 m (McPherson, 1985; Randall, 1995; Collette, 2001).
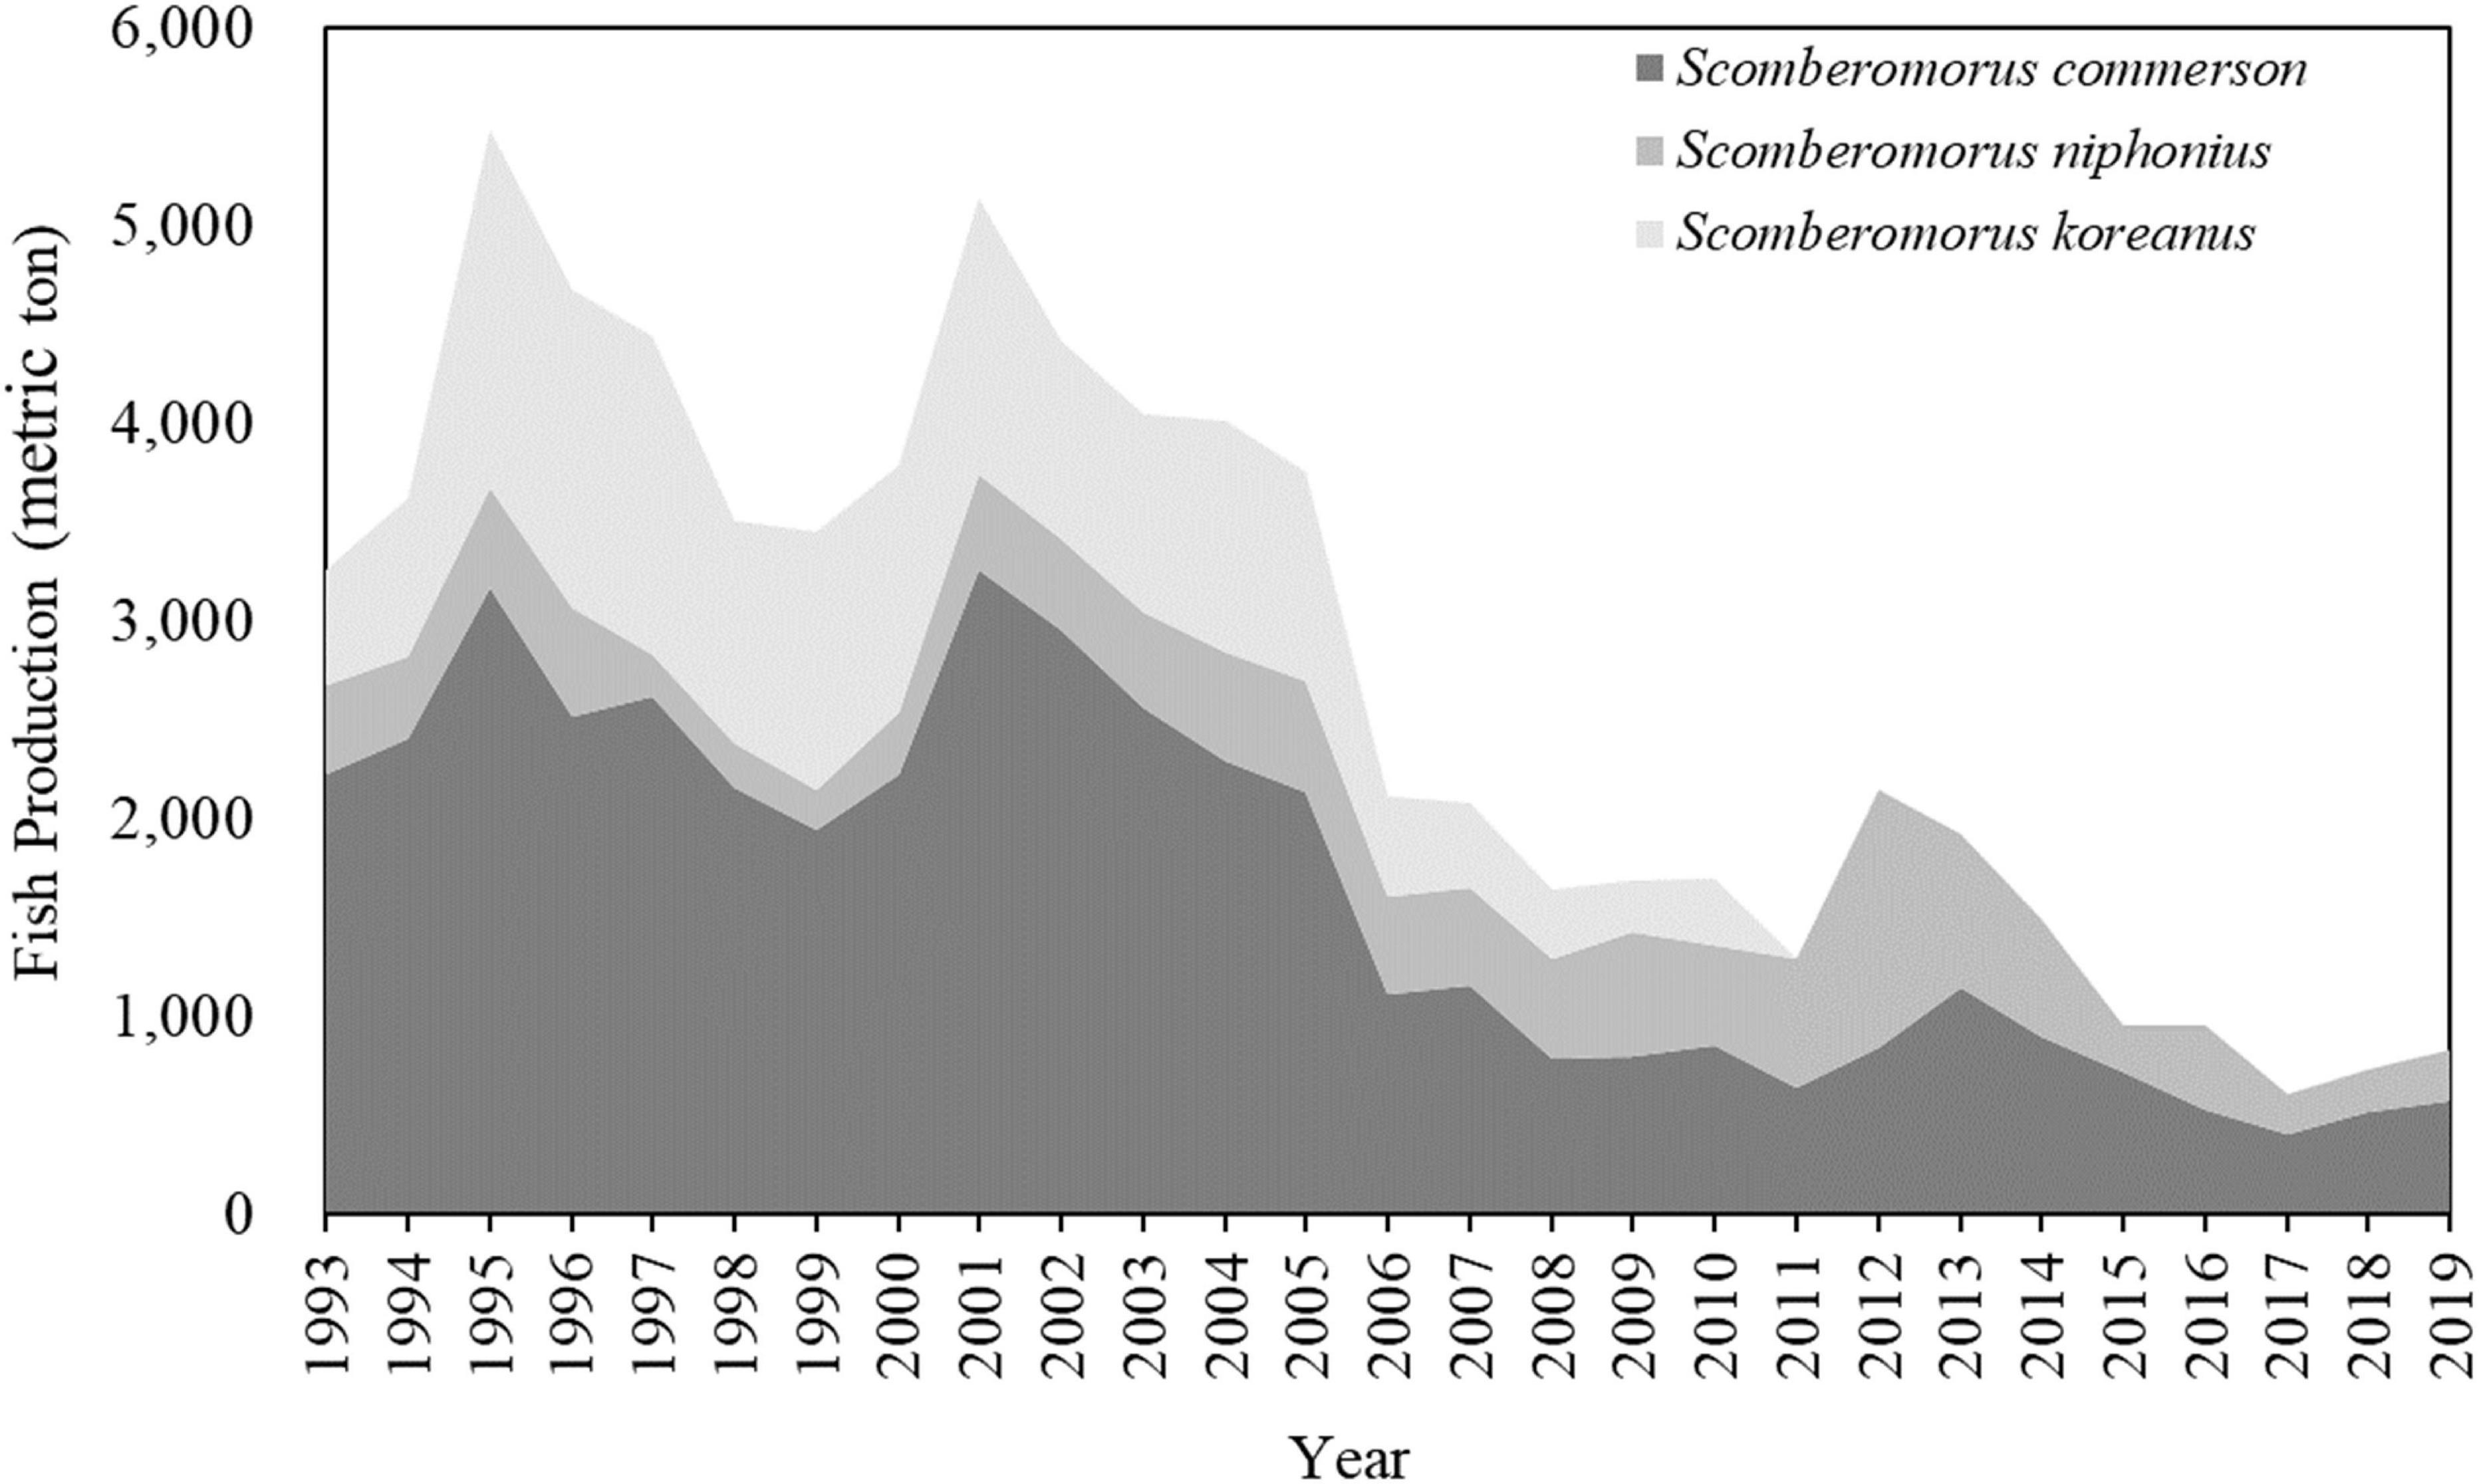
Figure 1. Annual trends of total catch of Scomberomorus species in the WT from 1993 to 2019. (Data source: Fisheries Agency, Council of Agriculture in Taiwan).
Trammel nets, longlines, and trolling lines are primarily used for catching S. commerson in the WT (Fisheries Agency, 2019). In recent years, numerous challenges have been countered in the production of Scomberomorus species, and the catch of S. commerson decreased from 6600 metric tons in 2002 to 508 metric tons in 2018 (Figure 1). This dramatic decline might be due to the high demand, unregulated fishing practices, or overexploitation of these species. Ju et al. (2020) evaluated the stock status of S. commerson under fishing pressure in the WT and found that three stocks had collapsed. S. commerson species were classified as highly susceptible to the high levels of exploitation in the waters off eastern Taiwan (Lin et al., 2020). Furthermore, climate-driven environmental variability has long been recognized as another factor affecting fishery resources and continues to be critical in the WT (Lan et al., 2017; Ho et al., 2018; Ju et al., 2020).
The catch of S. commerson is significantly related to sea surface temperature (SST) changes; the recommended SST and salinity for achieving optimal S. commerson catch rates (CRs) are 14–31°C and 23–35 psu, respectively (Niamaimandi et al., 2015; Nguyen and Nguyena, 2017). Several studies have suggested that chlorophyll-a concentrations and sea surface height (SSH) influence the distribution patterns of pelagic fish species and the variability of pelagic fish species abundance (Hazen et al., 2013; Liao et al., 2018; Lan et al., 2020a). Furthermore, changes in marine environments affect fishery resources at different spatial and temporal scales (Bell et al., 2013; Hazen et al., 2013; Liao et al., 2018). The most extensively studied climatic events affecting fish include those on interannual and decadal scales, such as the El Niño/Southern Oscillation (ENSO) and Pacific Decadal Oscillation, which can cause SST changes on different time scales in the western Pacific Ocean (Bell et al., 2013; Lan et al., 2014, 2017; Wu et al., 2020). ENSO events also exert a major influence on the wind stress of monsoons in the WT, and they engender changes in SST and upwelling intensity on an interannual scale (Kuo and Ho, 2004; Hong et al., 2011). Moreover, habitat changes may exert multiple economic effects on coastal communities through reduced availability of ecosystem services, such as fishery landings and ecotourism (Hazen et al., 2013).
Species distribution models (SDMs) have been extensively used to predict the distribution of a species under climate change; they have also been used to assess the past distribution of a species by analyzing evolutionary relationships and the management of the species’ habitat (Su et al., 2011; Asch et al., 2018). In addition, computer algorithms based on such models have been applied to predict the spatiotemporal habitat distribution of a species by using environmental data and to explore spatiotemporal variations in species and environments. Generalized additive models (GAMs) are among the most commonly used SDMs (Hastie and Tibshirani, 1990), which are nonparametric extensions of generalized linear models (Nelder and Wedderburn, 1972). GAMs enable the incorporation of smoothing functions to model the nonlinear effect of continuous explanatory variables. They can be used to effectively determine the multiple nonlinear relationships between covariates and response variables in a semiparametric manner (Hastie and Tibshirani, 1990). Moreover, GAMs can determine highly nonlinear and nonmonotonic relationships between responses and sets of explanatory variables (Wood, 2006); accordingly, such models are ideal for expressing underlying relationships in ecological systems. Numerous studies have applied GAMs to predict the spatial distribution of fishing grounds for a single species or the distribution of fisheries’ resources (Su et al., 2011; Solanki et al., 2017; Liao et al., 2018; Wang et al., 2020).
In the literature, data on the relationship between the distribution of S. commerson and environmental variations are limited because high-resolution fishery data are insufficient. To address this gap in the literature, the present study collected high-spatial-resolution catch and effort data to investigate the temporal and spatial variations in fishing grounds and CRs of S. commerson in relation to oceanographic conditions. The study also explored the mechanisms underlying the ENSO events that influence the interannual CRs and spatiotemporal distribution of this species. Estimating the preferred environmental conditions of crucial commercial species is critical for determining their migratory patterns, and it is an essential step toward the ecosystem-based management of fisheries.
Materials and Methods
Spanish Mackerel Fishery Data
Daily high-resolution fishery data for S. commerson were collected from the voyage data recorders and logbooks of fishing vessels operating in the WT from 2011 to 2016. The fishery data comprised daily operating positions for 0.1° spatial grids, including latitude and longitude information, fishing dates, fishing methods, working hours, and total catch (kg) of S. commerson.
To determine the fishery dynamics and spatiotemporal variation of S. commerson in the WT, this study calculated the annual catch percentage of each fishing method. According to the data, S. commerson are mainly caught using trammel nets; therefore, the monthly observed CRs of trammel nets were calculated for individual 0.1° spatial grids across the study region by using the following equation:
where i represents the latitude and j represents the longitude of each 0.1° spatial grid.
The spatial distributions of catch percentages associated with the various fishing methods and seasonal CRs were mapped using Quantum GIS version 3.6 (QGIS Development Team, 2019). Moreover, the longitudinal and latitudinal gravitational centers of the observed CRs (G) were estimated using monthly longitudinal and latitudinal locations of the fishing vessels (L) and monthly observed CRs (Lehodey et al., 1997) as follows:
where i and j denote the latitude and longitude, respectively.
Environmental Data
Remote sensing data of SST, sea surface chlorophyll-a (CHL), sea surface salinity (SSS), and SSH in the WT were collected. Satellite-derived SST data were extracted from National Oceanic and Atmospheric Administration (NOAA) Advanced Very-High-Resolution Radiometer (AVHRR) SST images with a spatial resolution of 1.1 km. The NOAA High-Resolution Picture Transmission data, including the AVHRR scenes, were received at the ground station of National Taiwan Ocean University. Daily CHL data were downloaded with a spatial resolution of 1.1 km from the National Aeronautics and Space Administration’s Ocean Color Web (National Aeronautics and Space Administration [NASA], 2017). The SSS and SSH data were downloaded with a 0.08° spatial resolution from the Asia Pacific Data Research Center.1 Both types of data were obtained from the HYbrid Coordinate Ocean Model (HYCOM). To compensate for missing data due to cloud coverage, this study constructed monthly averaged composite maps of the remotely sensed environmental data to fit the fishery data by using Interactive Data Language (version 7.0).
Statistical Models for Spatial and Temporal Predictions of Catch Rates
To analyze the relationships between environmental variation and CR, statistical models were used to predict the spatiotemporal pattern of Spanish mackerel density. SDMs were developed, and on the basis of these models, GAMs were developed to examine potential seasonal fishing grounds. The GAMs were constructed through R (version 3.6; R Core Team, 2018) by using the GAM function of the “mgcv” package. The observed CRs constituted the response variable, and spatiotemporal factors (year, month, longitude, and latitude) and environmental factors (SST, SSH, SSS, and CHL) constituted the predictor variables. The GAMs can be expressed as follows:
where a0 is a constant and s(xi) is a spline smoothing function for each model covariate xn or the interaction between two covariates. All covariates were considered to be continuous, and the effective degrees of freedom were estimated for each main factor. Because the log-link function cannot handle zeros, we added a constant value of 0.1 (c) to all CRs; this value is commonly used in CR standardization processes (e.g., Manuder and Punt, 2004; Lan et al., 2018, 2021). Time and location were treated as interaction terms to account for the possible interannual variability engendered by environmental spatial distribution variations.
The model with the optimal conformation was selected using a stepwise procedure that was based on the lowest value of Akaike’s information criterion (AIC), and the p-value for the final set of variables was lower than 0.05. The selected GAMs were used to predict the relative abundance of S. commerson in the WT from 2011 to 2016. Furthermore, this study applied the Oceanic Niño Index (ONI) as the primary indicator for monitoring El Niño and La Niña alternating phases and examined how the climate variability in ENSO events affects the variation of S. commerson. The ONI was downloaded from the Climate Prediction Center of the National Weather Service (National Oceanic and Atmosphere Administration).
Results
Spatiotemporal Distribution of Scomberomorus commerson in the Waters Around Taiwan
The spatial distribution of catch percentages of S. commerson caught using different fishing methods revealed that trammel nets and longlines accounted for a wider distribution among all fisheries (Figure 2). Longlines were mostly operated off eastern Taiwan, whereas trammel nets were mostly operated in the TS. Of the annual total catch of S. commerson, trammel nets accounted for 69.79 ± 11.98% and longlines accounted for only 12.71 ± 4.48% (Figure 3).
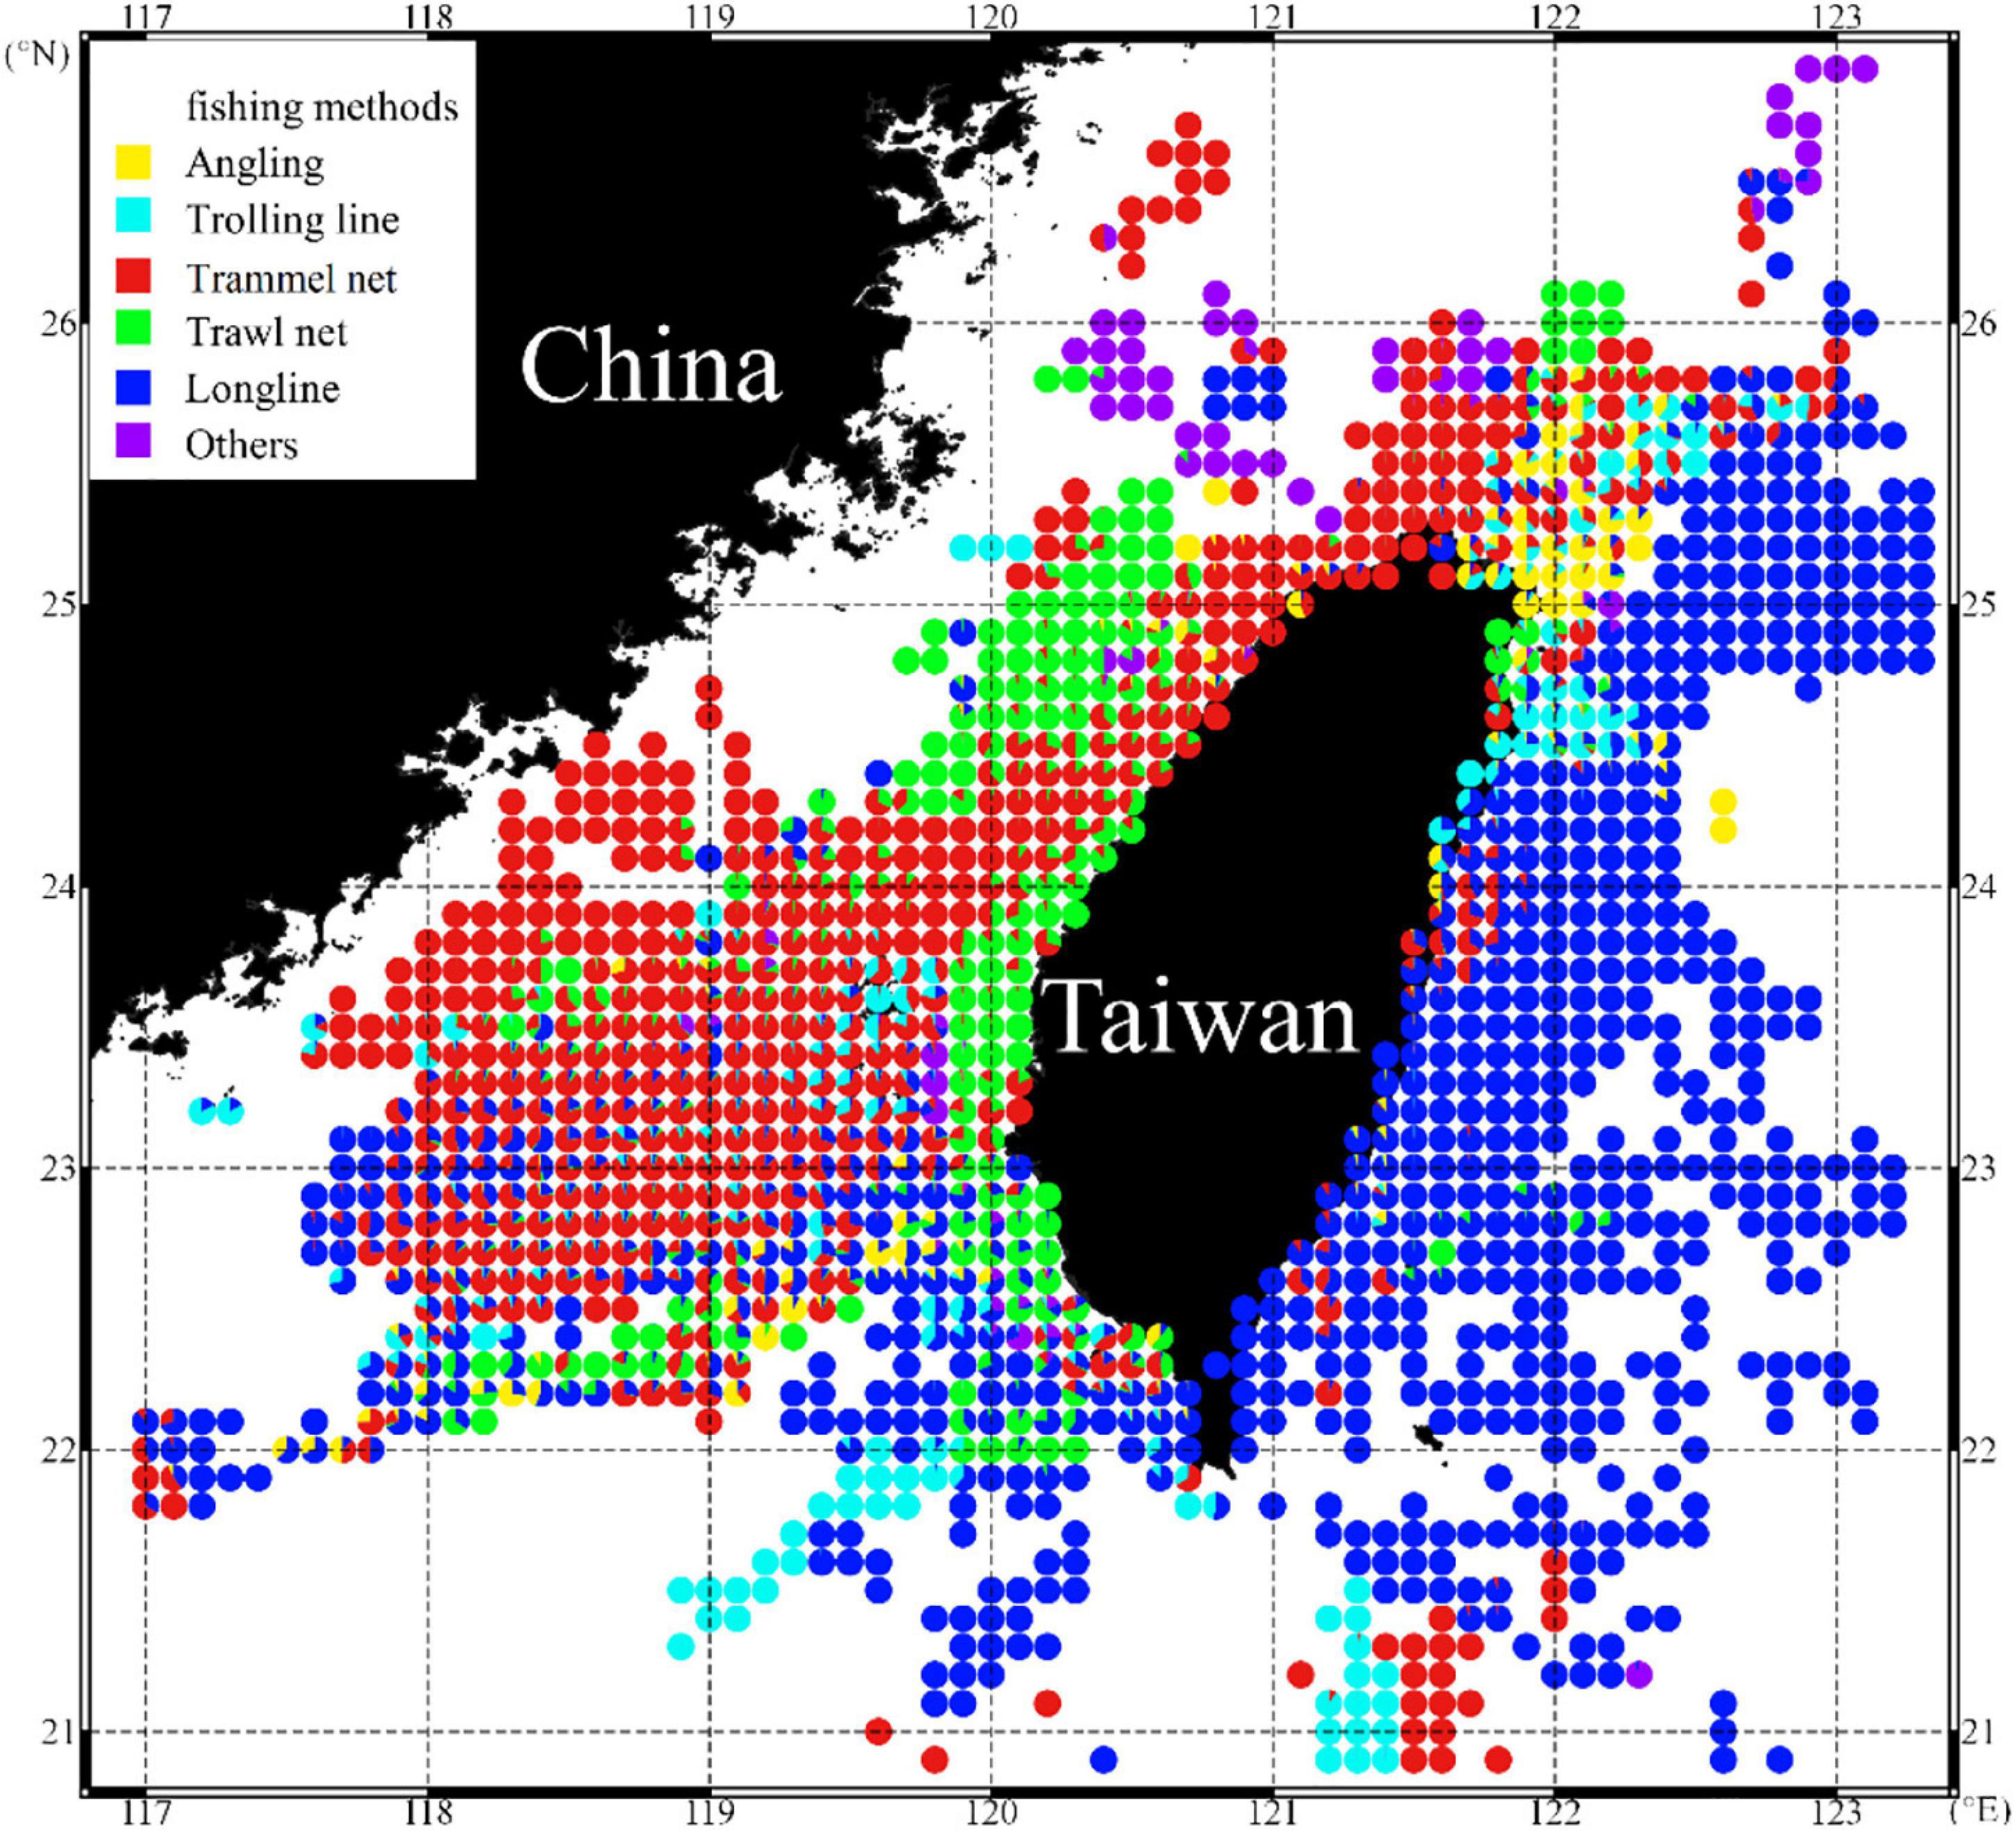
Figure 2. Spatial distribution of S. commerson caught using various fishing methods in the WT during 2011–2016.
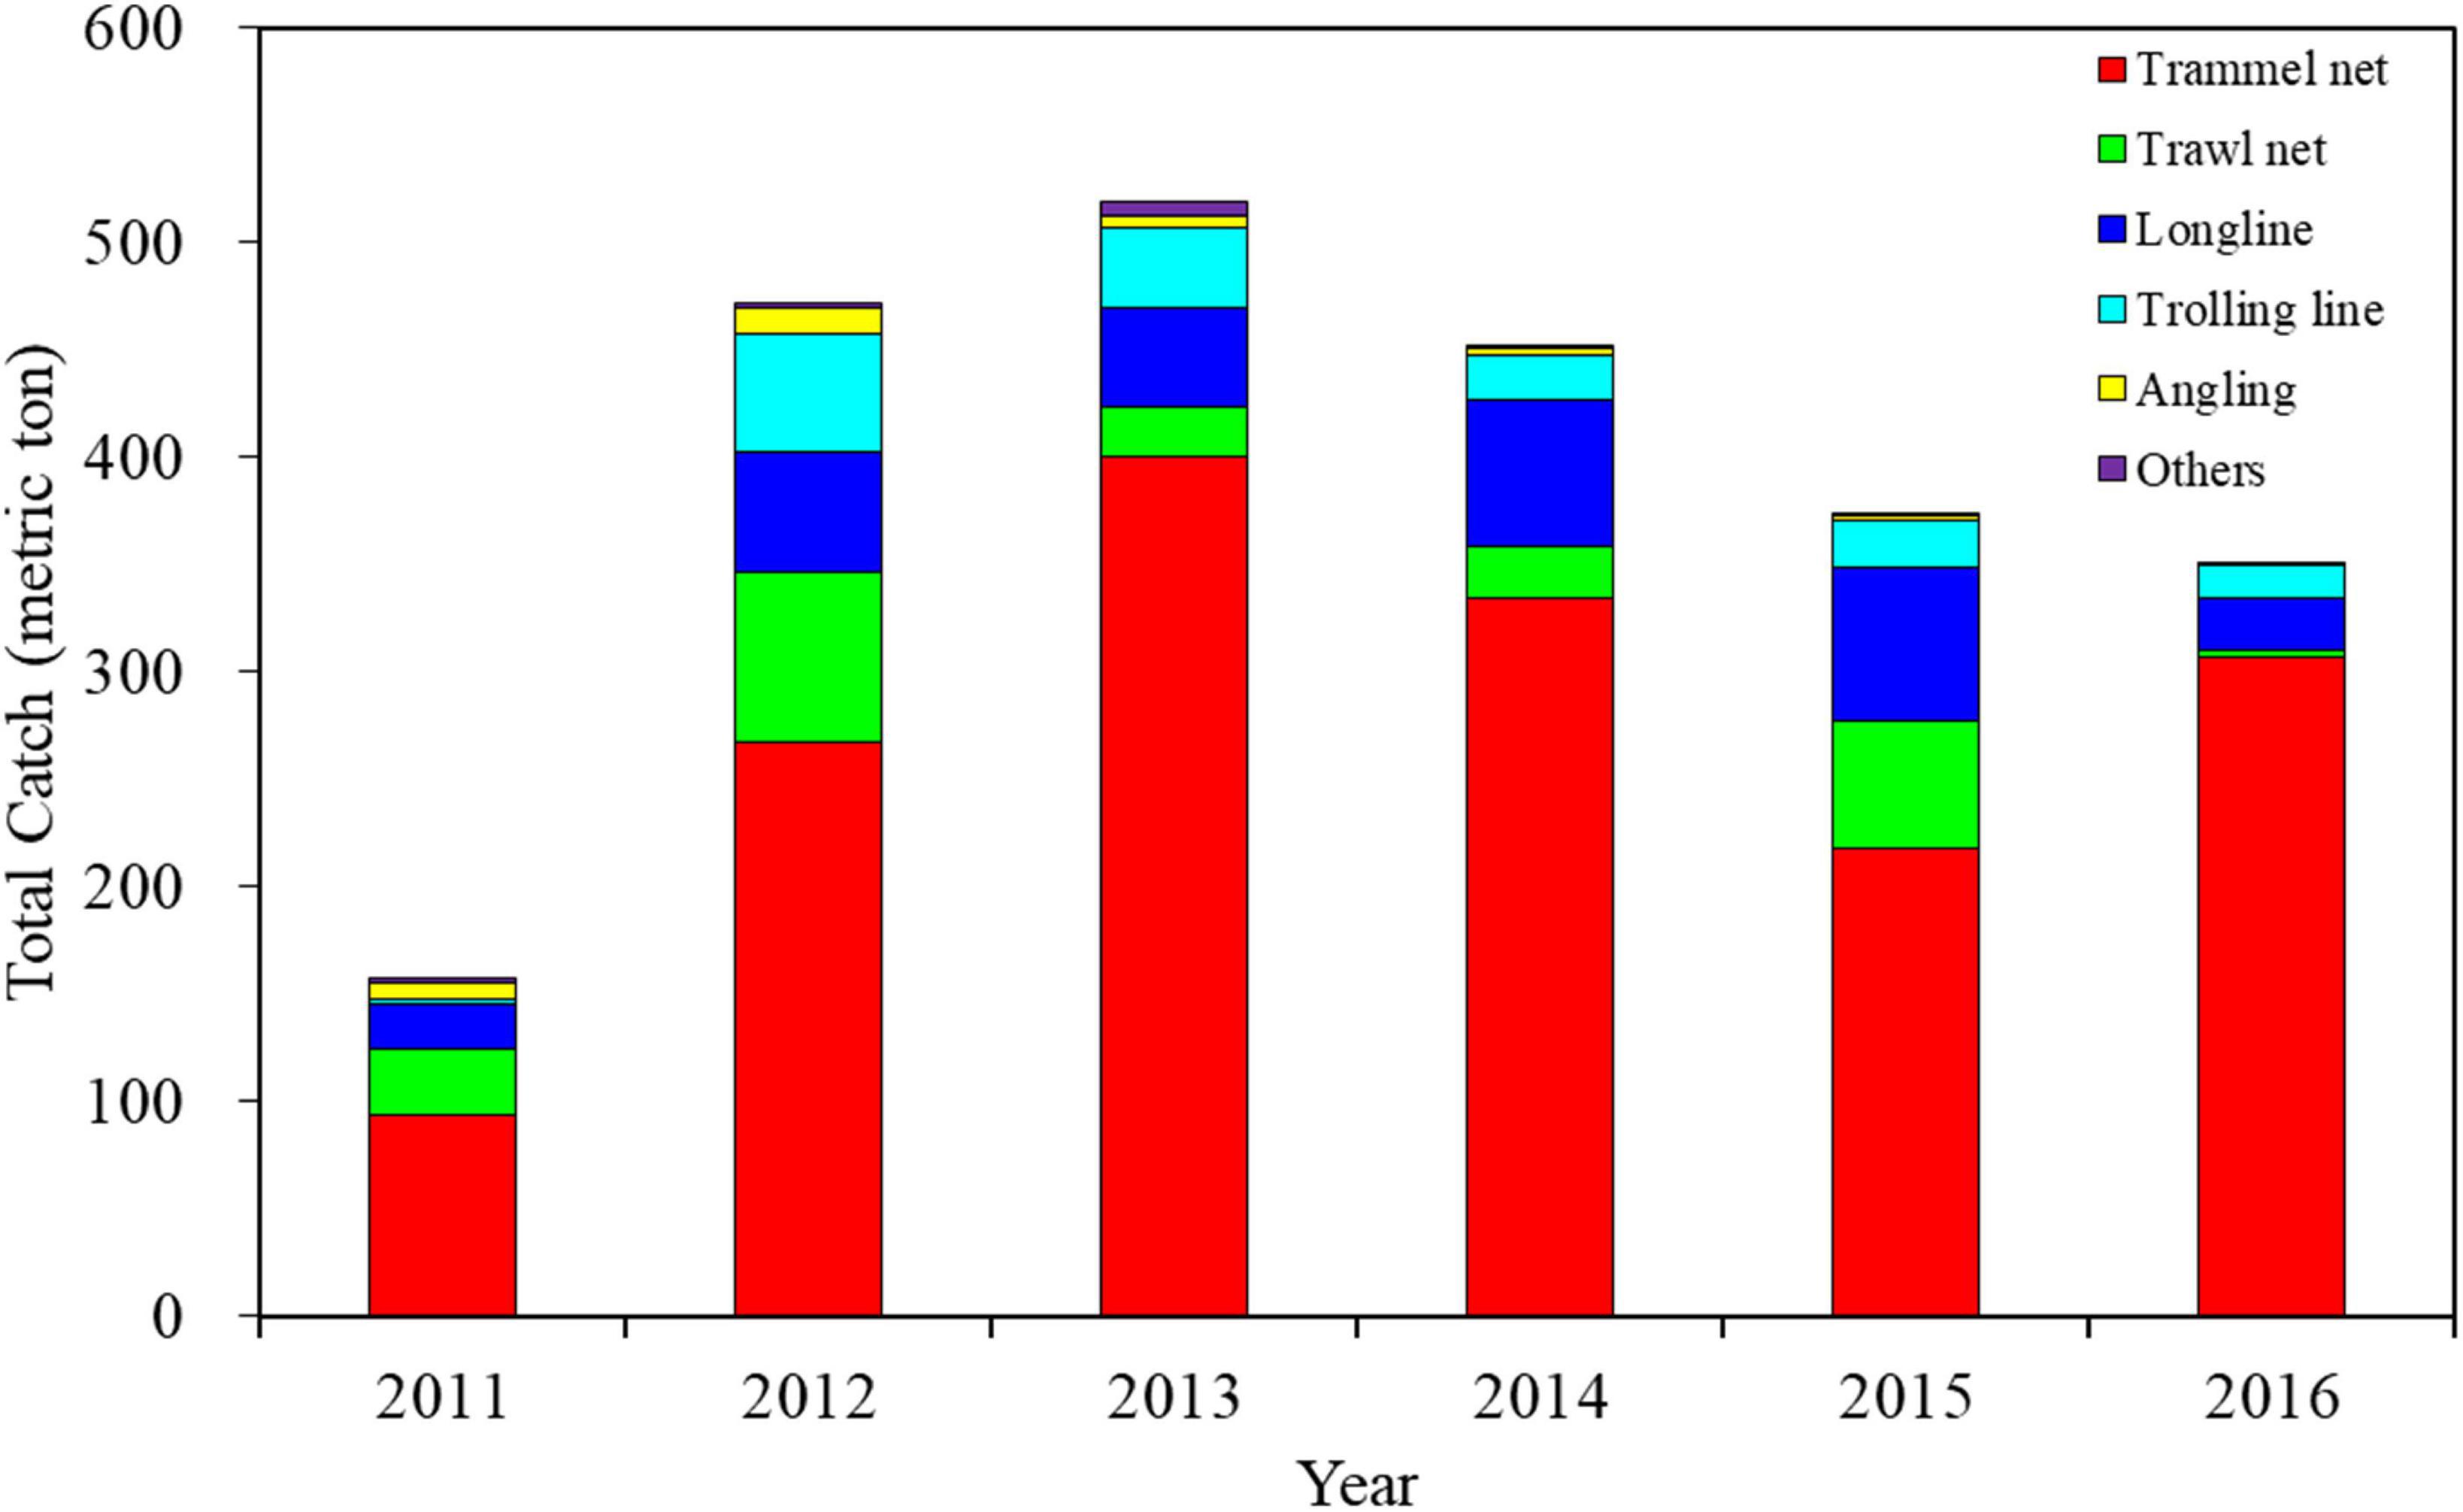
Figure 3. Annual catch trends of S. commerson caught using different fishing methods in the WT during 2011–2016. (Data source: Taiwan Ocean Conservation and Fisheries Sustainability Foundation).
Accordingly, this study analyzed the influence of trammel nets on the distributions of and relationship between CR and environmental factors. Concerning the seasonal mean spatial distributions of CRs associated with trammel nets, the results indicated that higher CRs were mainly distributed around the southwestern waters of the TS during autumn; these CRs increased during winter but decreased gradually during spring and summer (Figure 4).
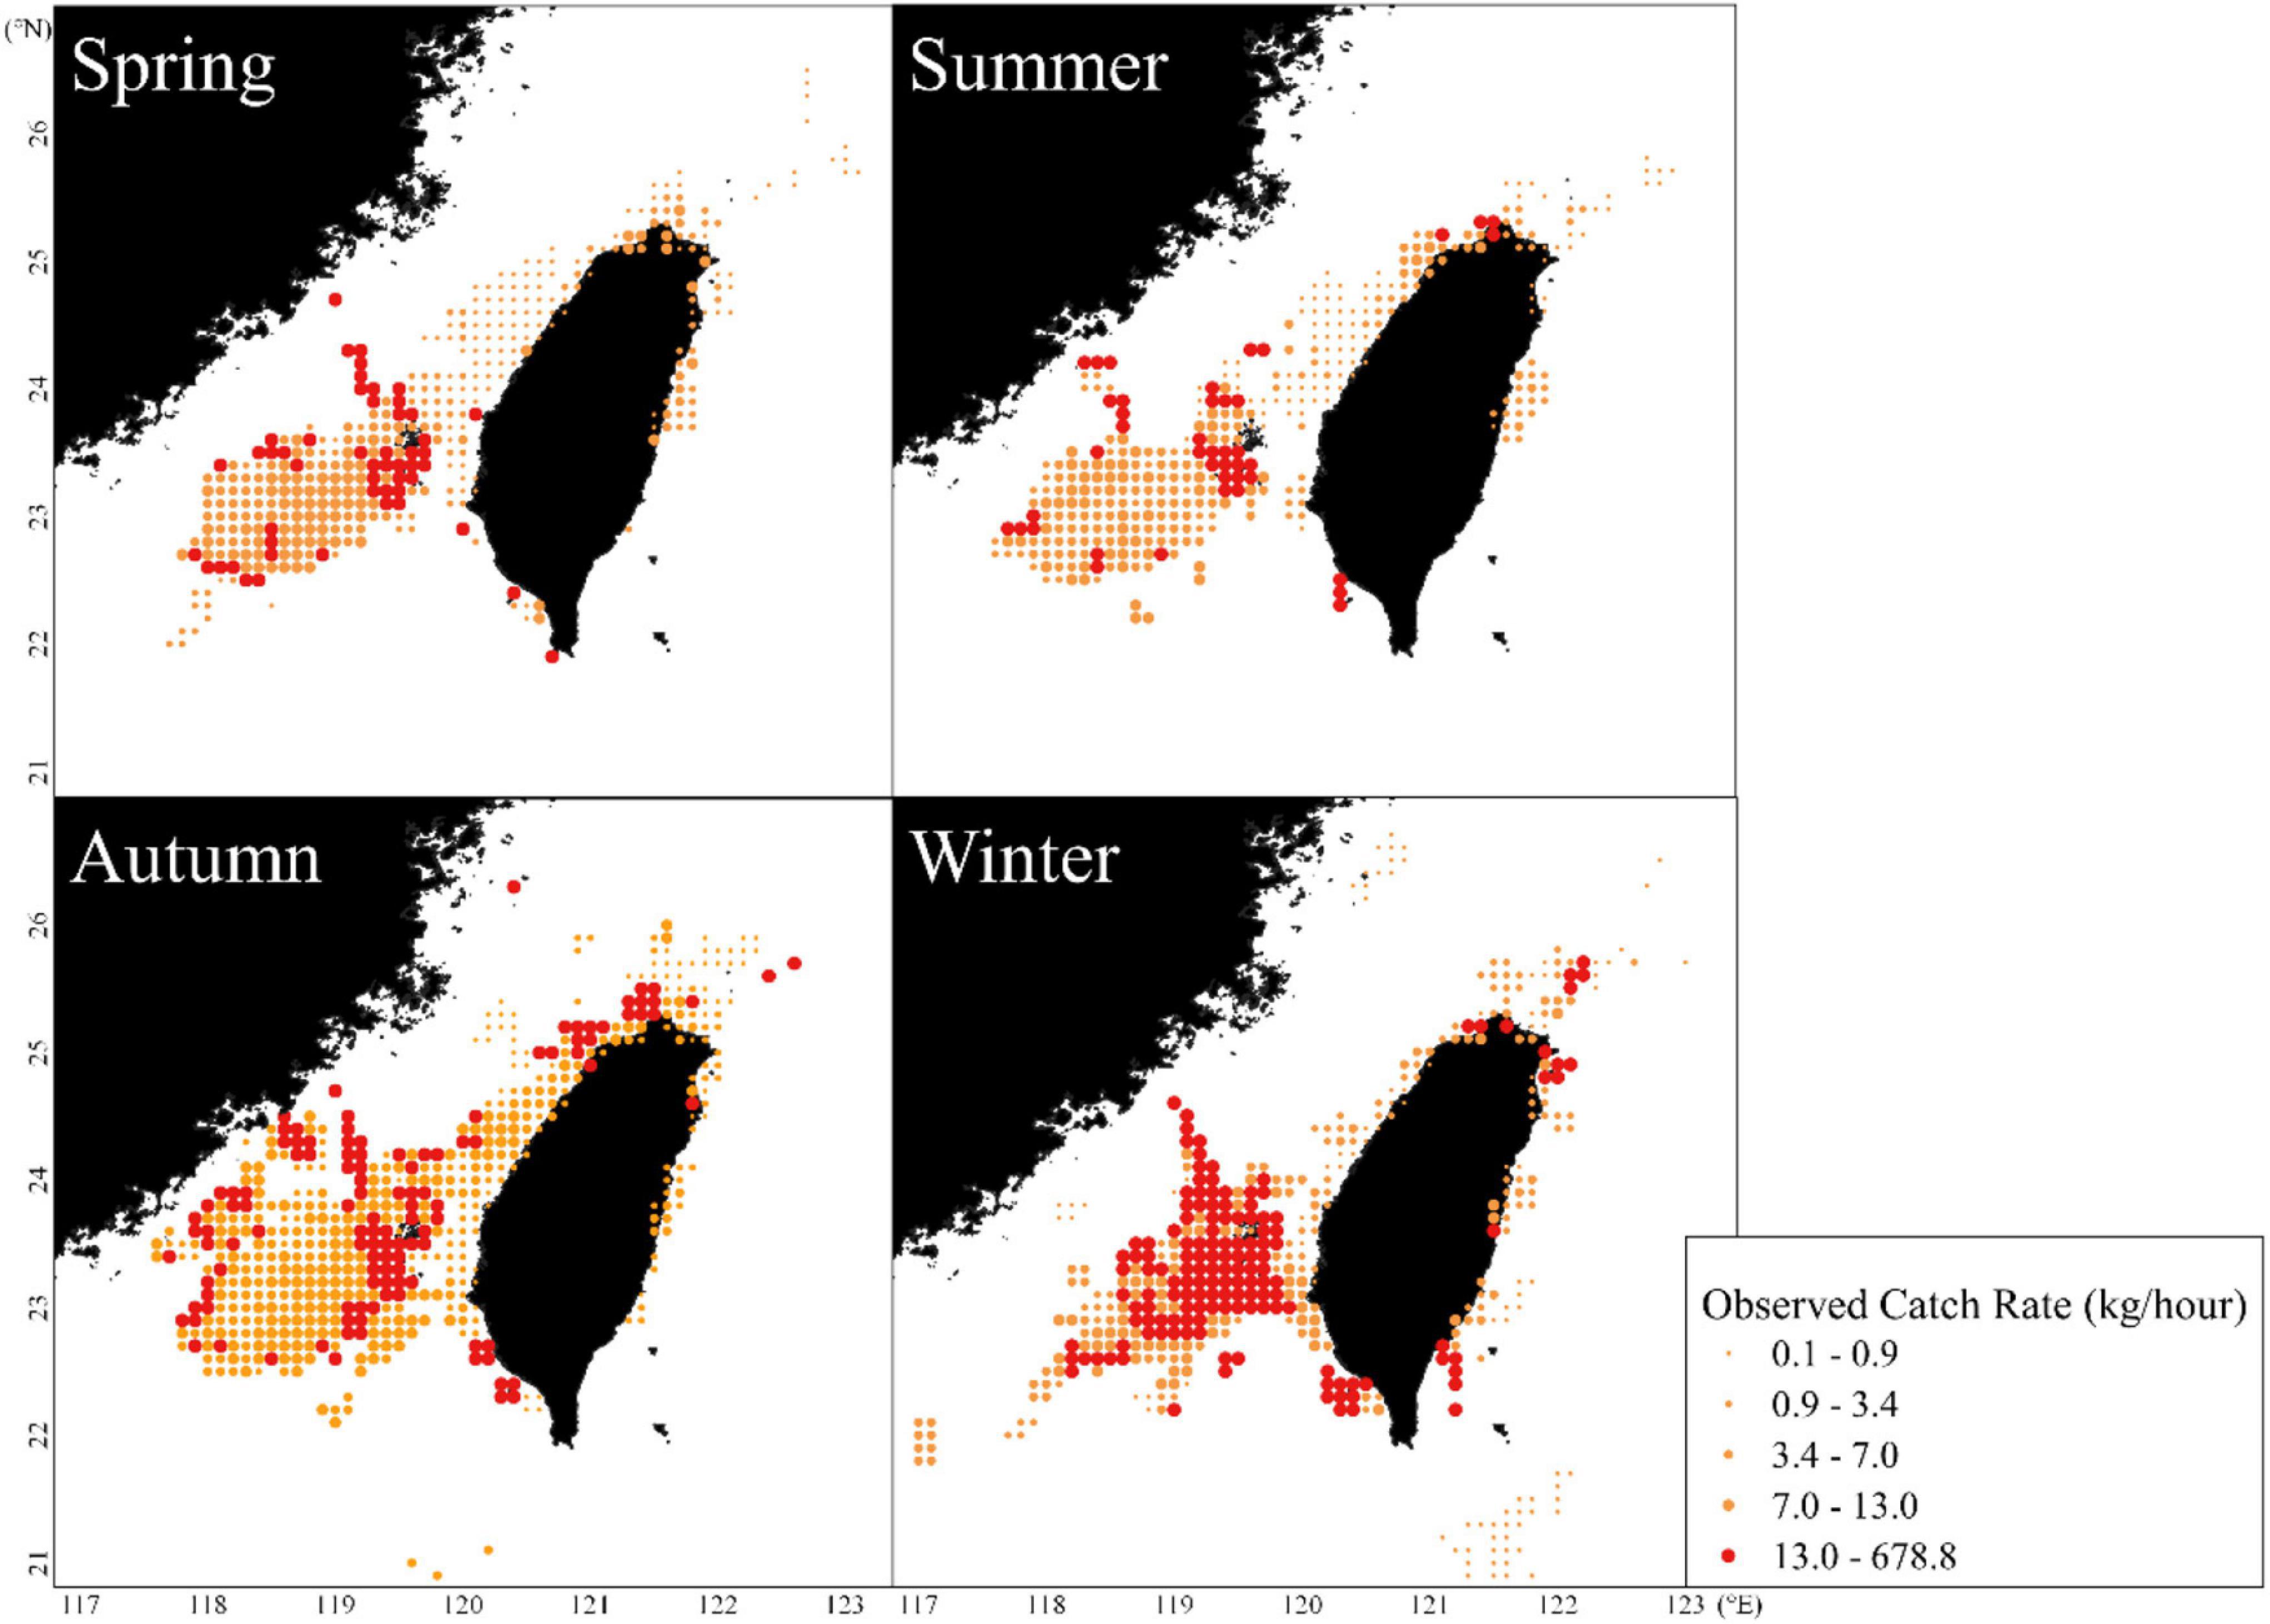
Figure 4. Seasonal mean observed catch rates of S. commerson caught using trammel nets in the WT during 2011–2016.
Time-Series Variation of Catch Rates and Fishing Locations of Trammel Nets
The time series of the monthly catches and trammel net CRs for S. commerson during 2011–2016 revealed that the most catches and highest CRs occurred in autumn and winter (Figure 5). The highest catch and CR occurred in January 2013 (nearly 130 metric tons and 28.64 kg/h, respectively). The lowest catch and CR occurred in July 2011 (0.43 metric tons) and May 2011 (0.91 kg/h), respectively. These results indicate that the major fishing season for S. commerson in the WT begins in early autumn and ends in winter. Trammel fisheries are distributed around the WT and are used year round, with some seasonal variation.
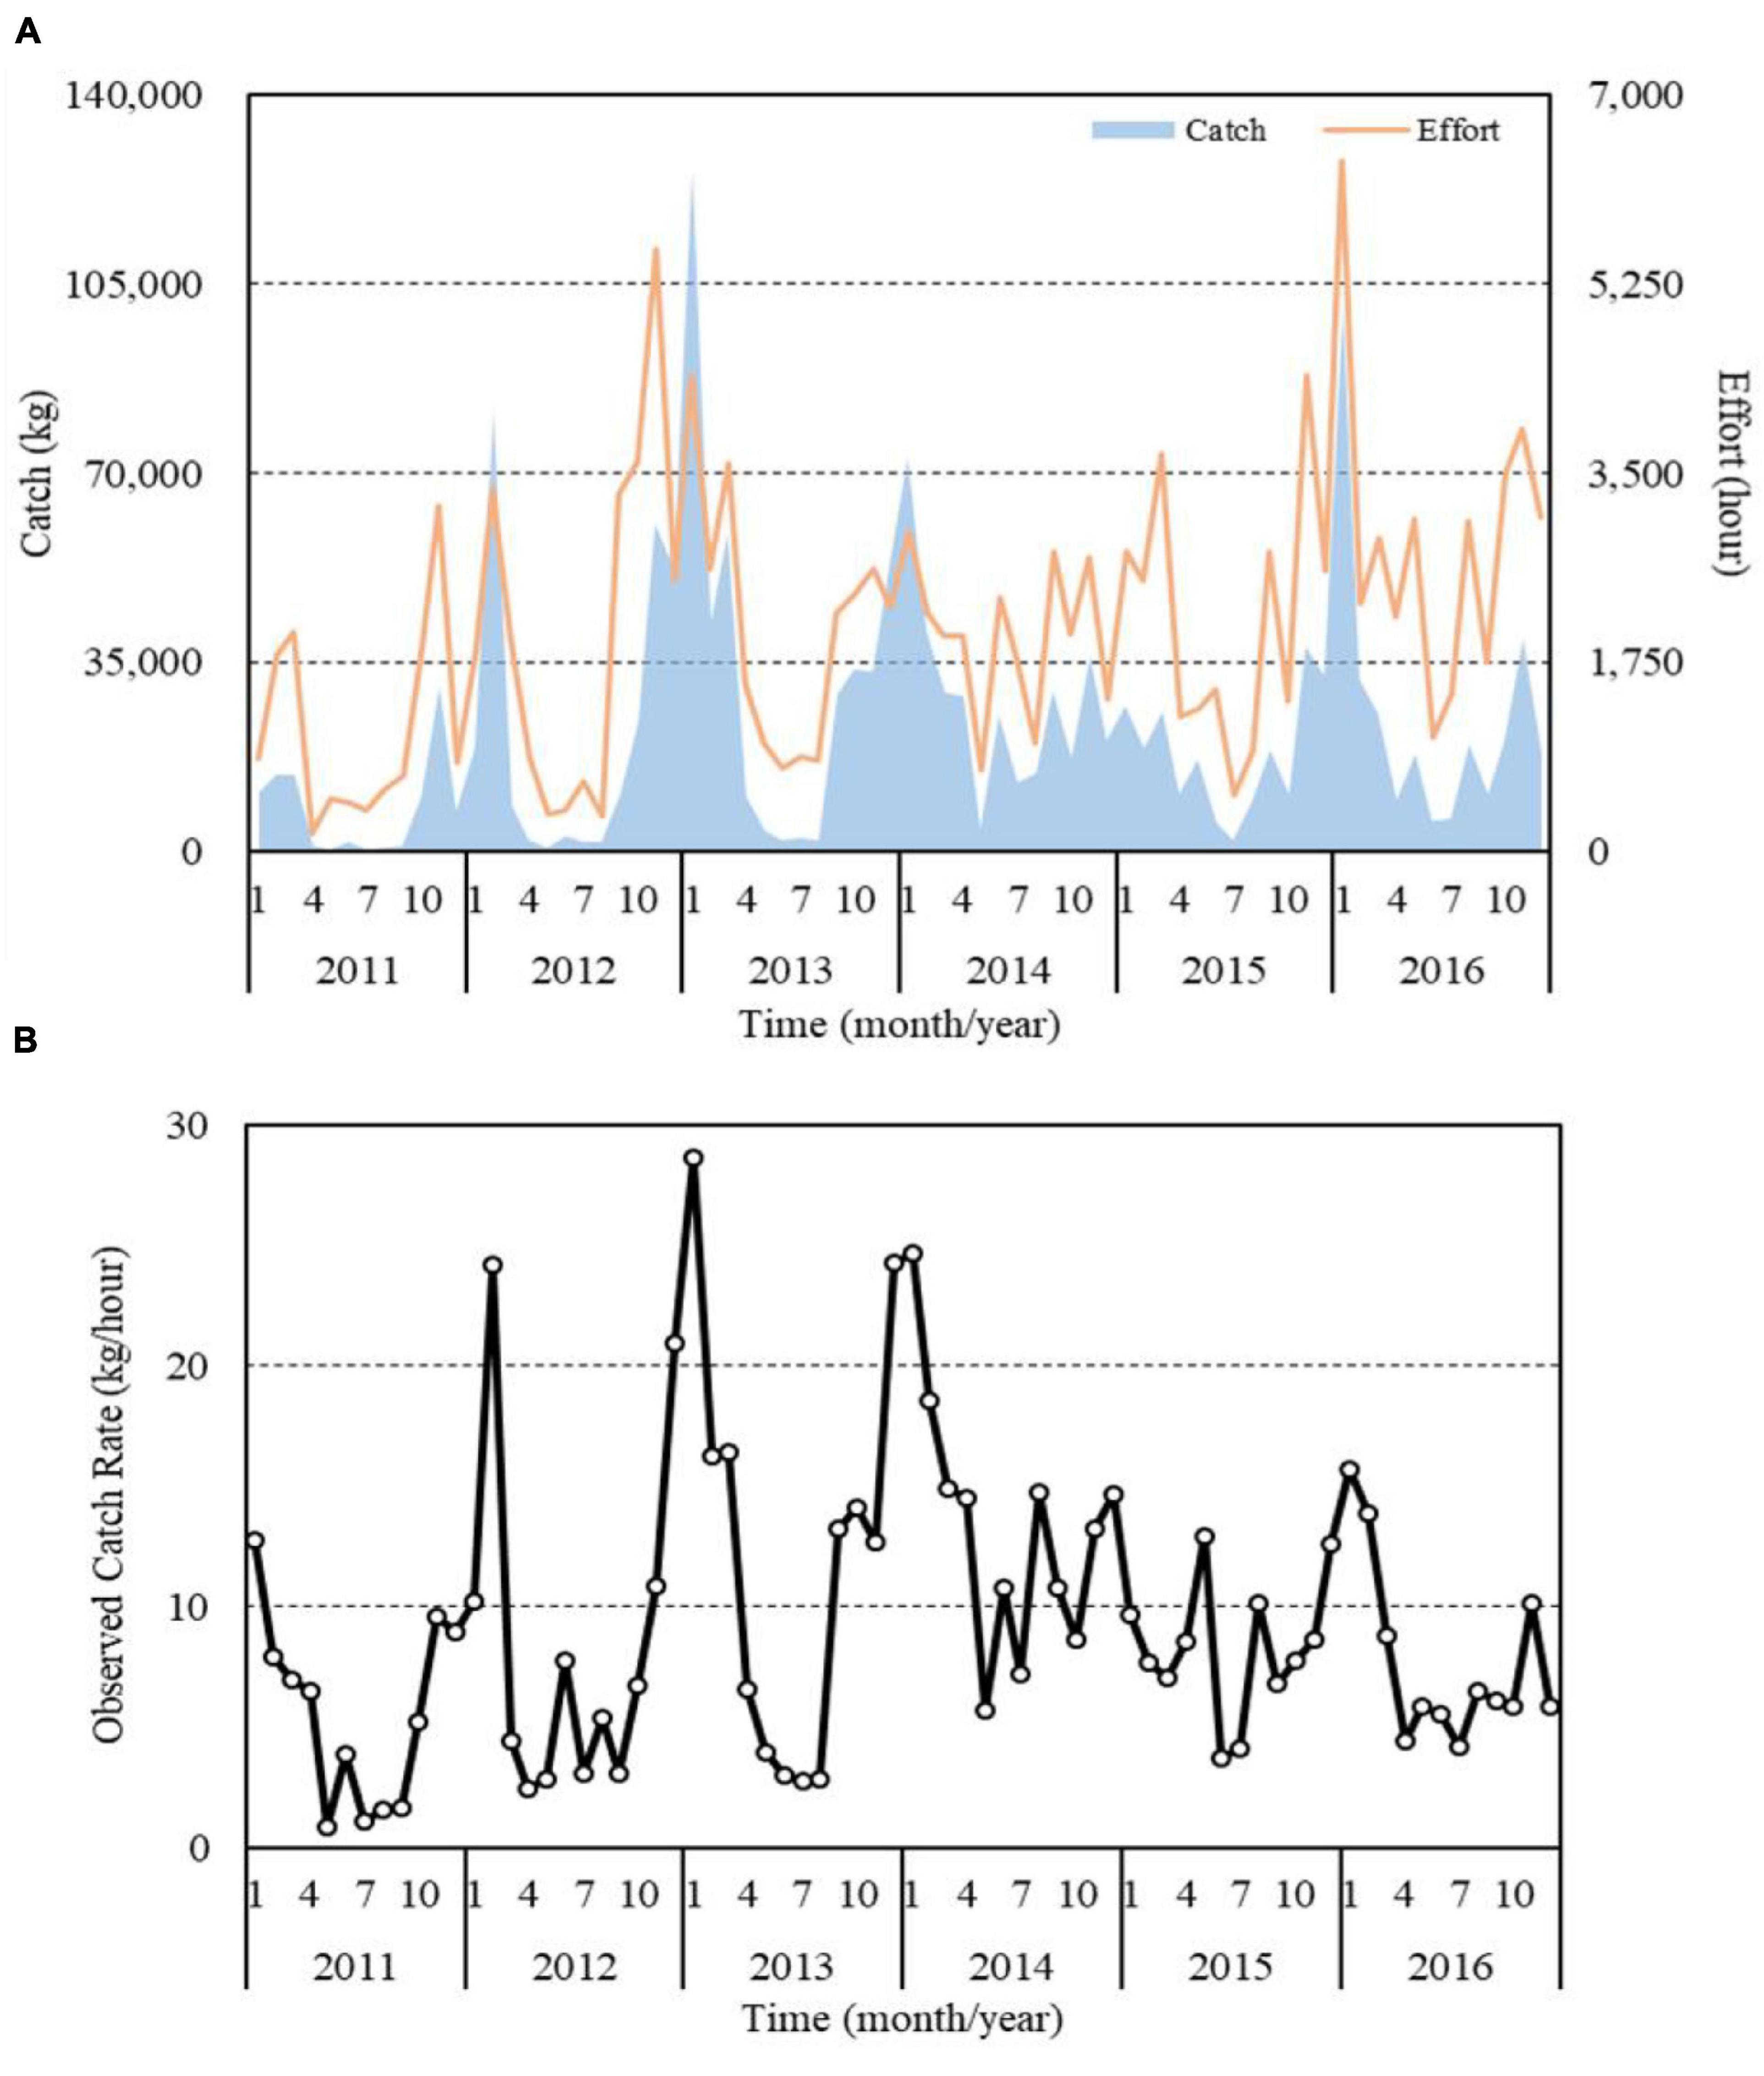
Figure 5. Monthly catch, effort (A), and observed CRs (B) of S. commerson caught using trammel nets in the WT during 2011–2016.
The monthly latitudinal and longitudinal G of the CRs revealed seasonal variations, and the latitudinal and longitudinal G gradually moved from northern and western areas (23.7°N, 119.81°E) in summer to southern and eastern areas (23.35°N, 119.66°E) in winter (Figure 6). By contrast, the latitudinal and longitudinal G of the CRs exhibited no obvious variations from 2014 to 2015.
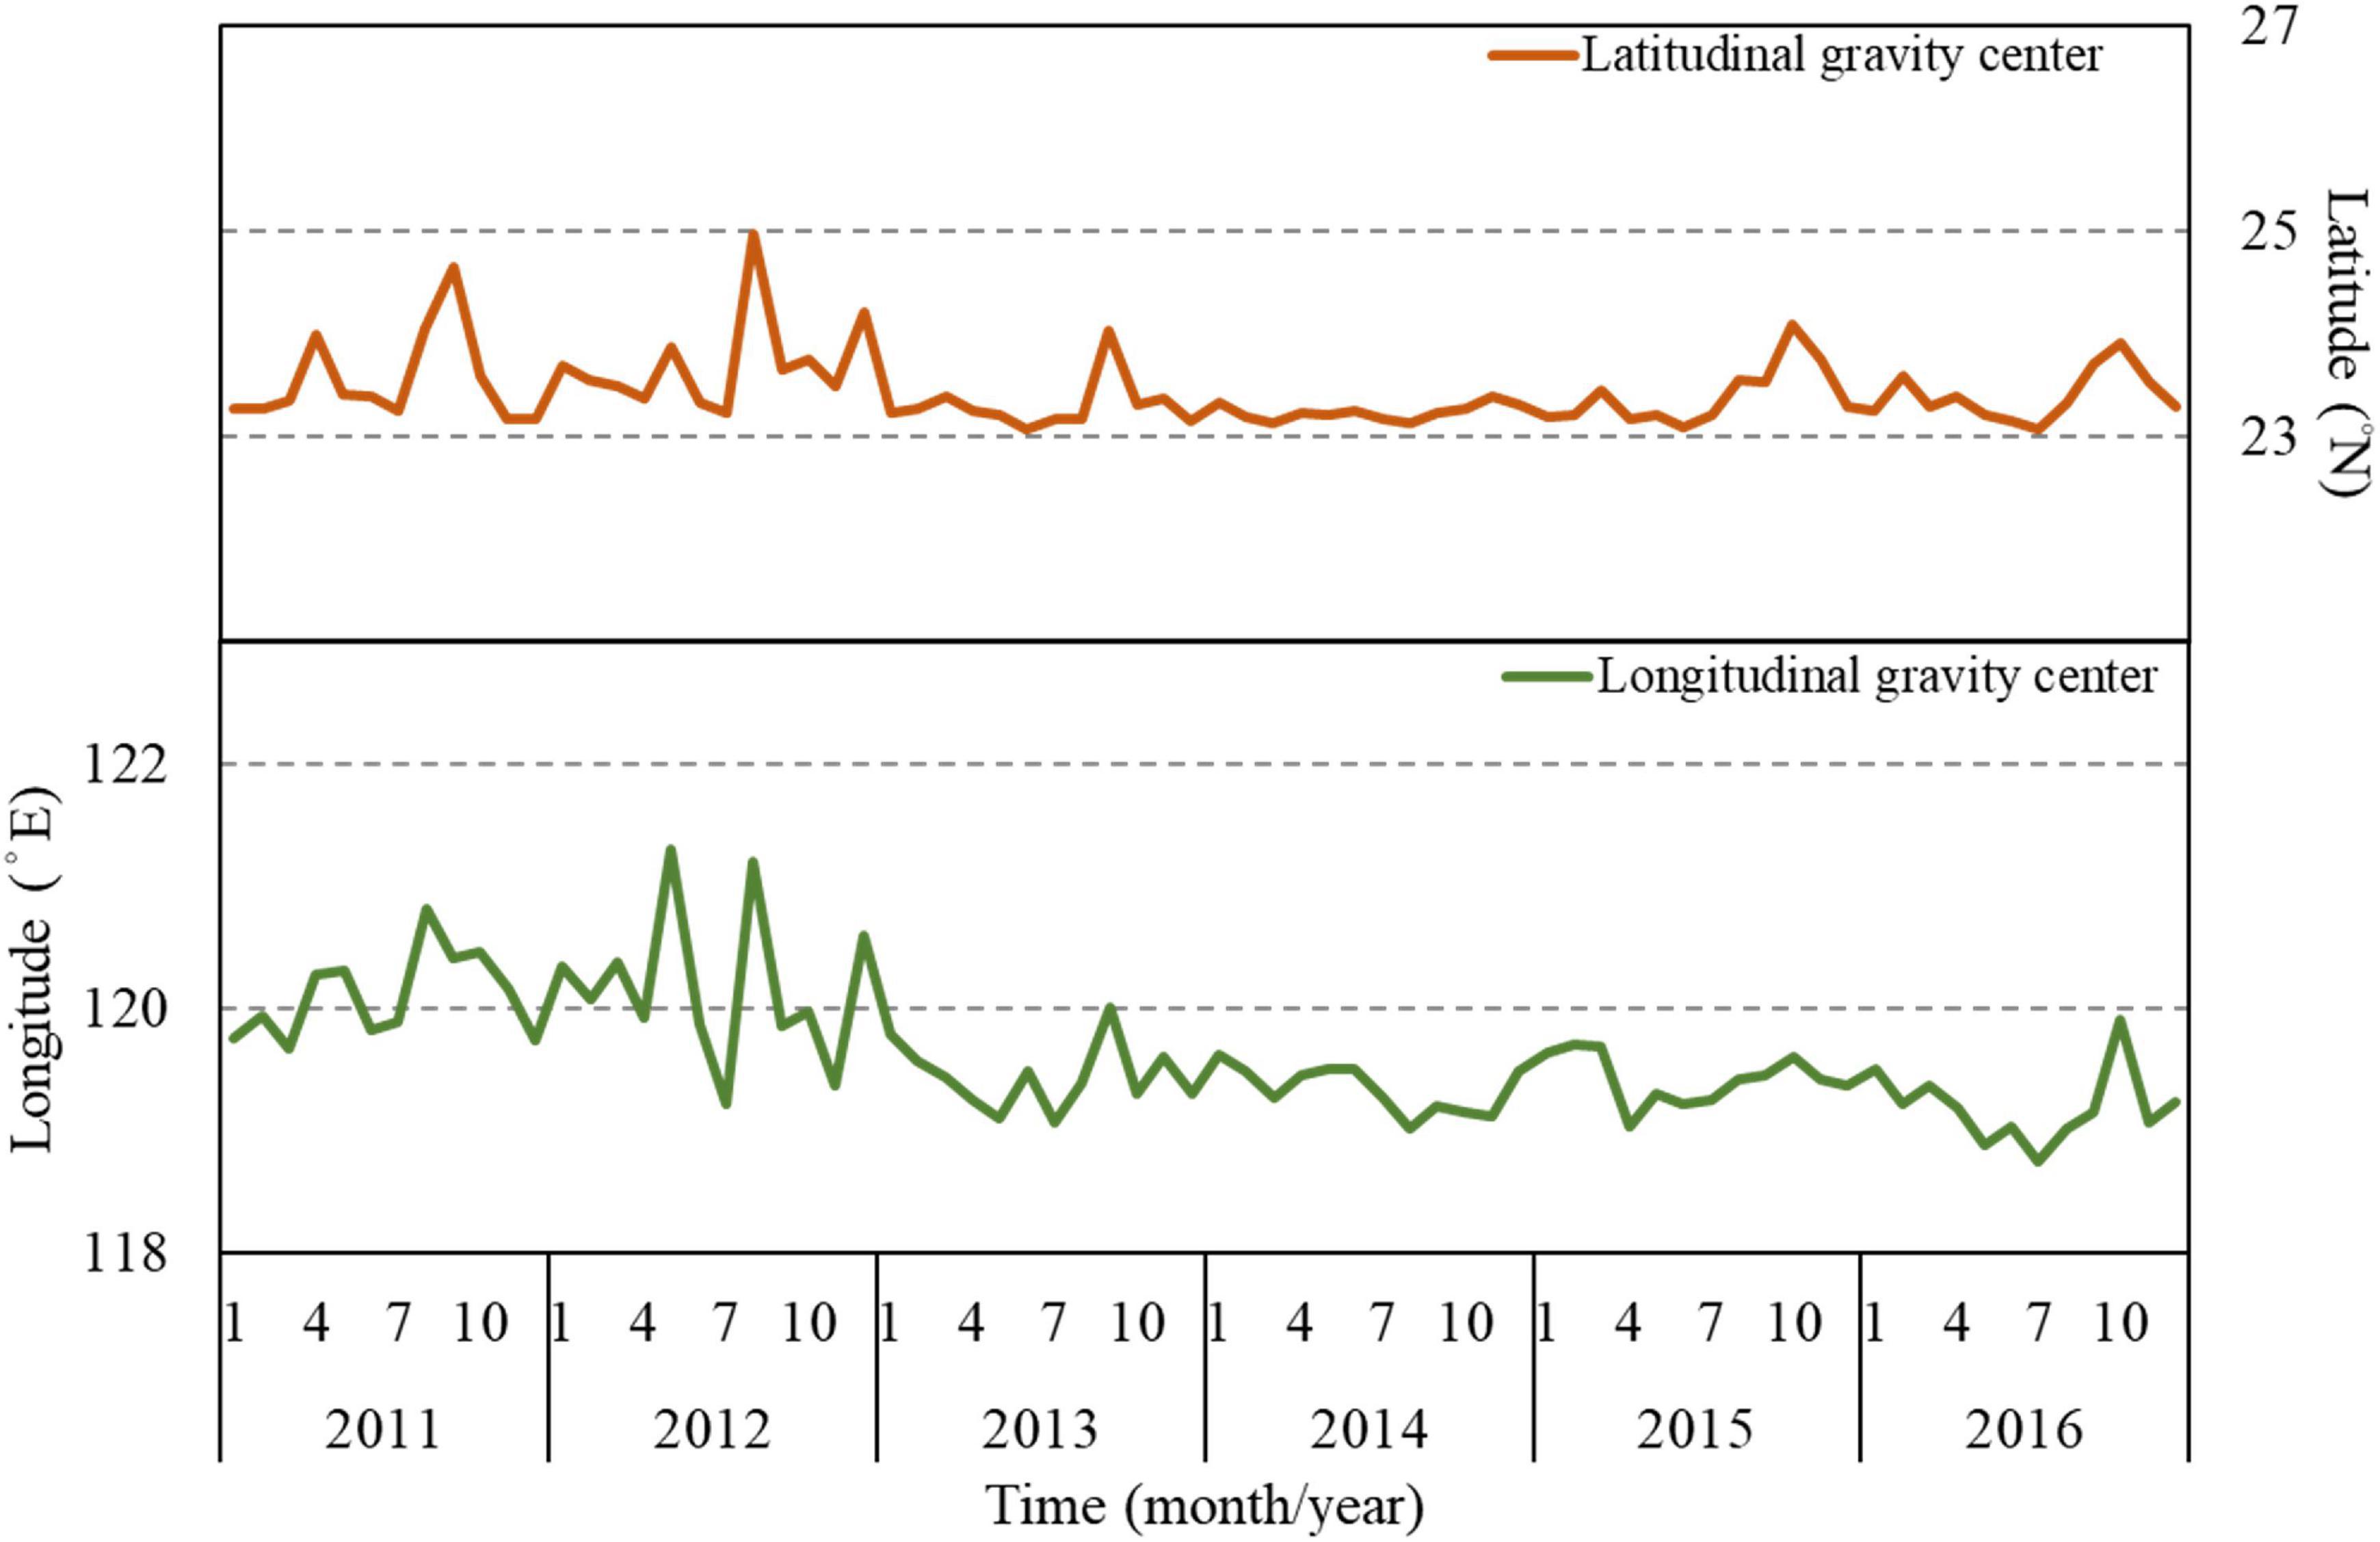
Figure 6. Monthly mean trends of longitudinal (°N) and latitudinal (°E) gravitational centers of observed CRs (G) of S. commerson in the WT.
Environmental Effect on the Catch Rates of Scomberomorus commerson
Our analyses included a total of 8,859 data points regarding S. commerson catch. Concerning the environmental variables affecting the CR of S. commerson, the selected GAMs explained 48.4% of the deviance. Normal quantile–quantile plots (Figure 7A) indicated that the distributions of the residuals for the selected GAMs adequately conformed to the assumed Gaussian distribution.
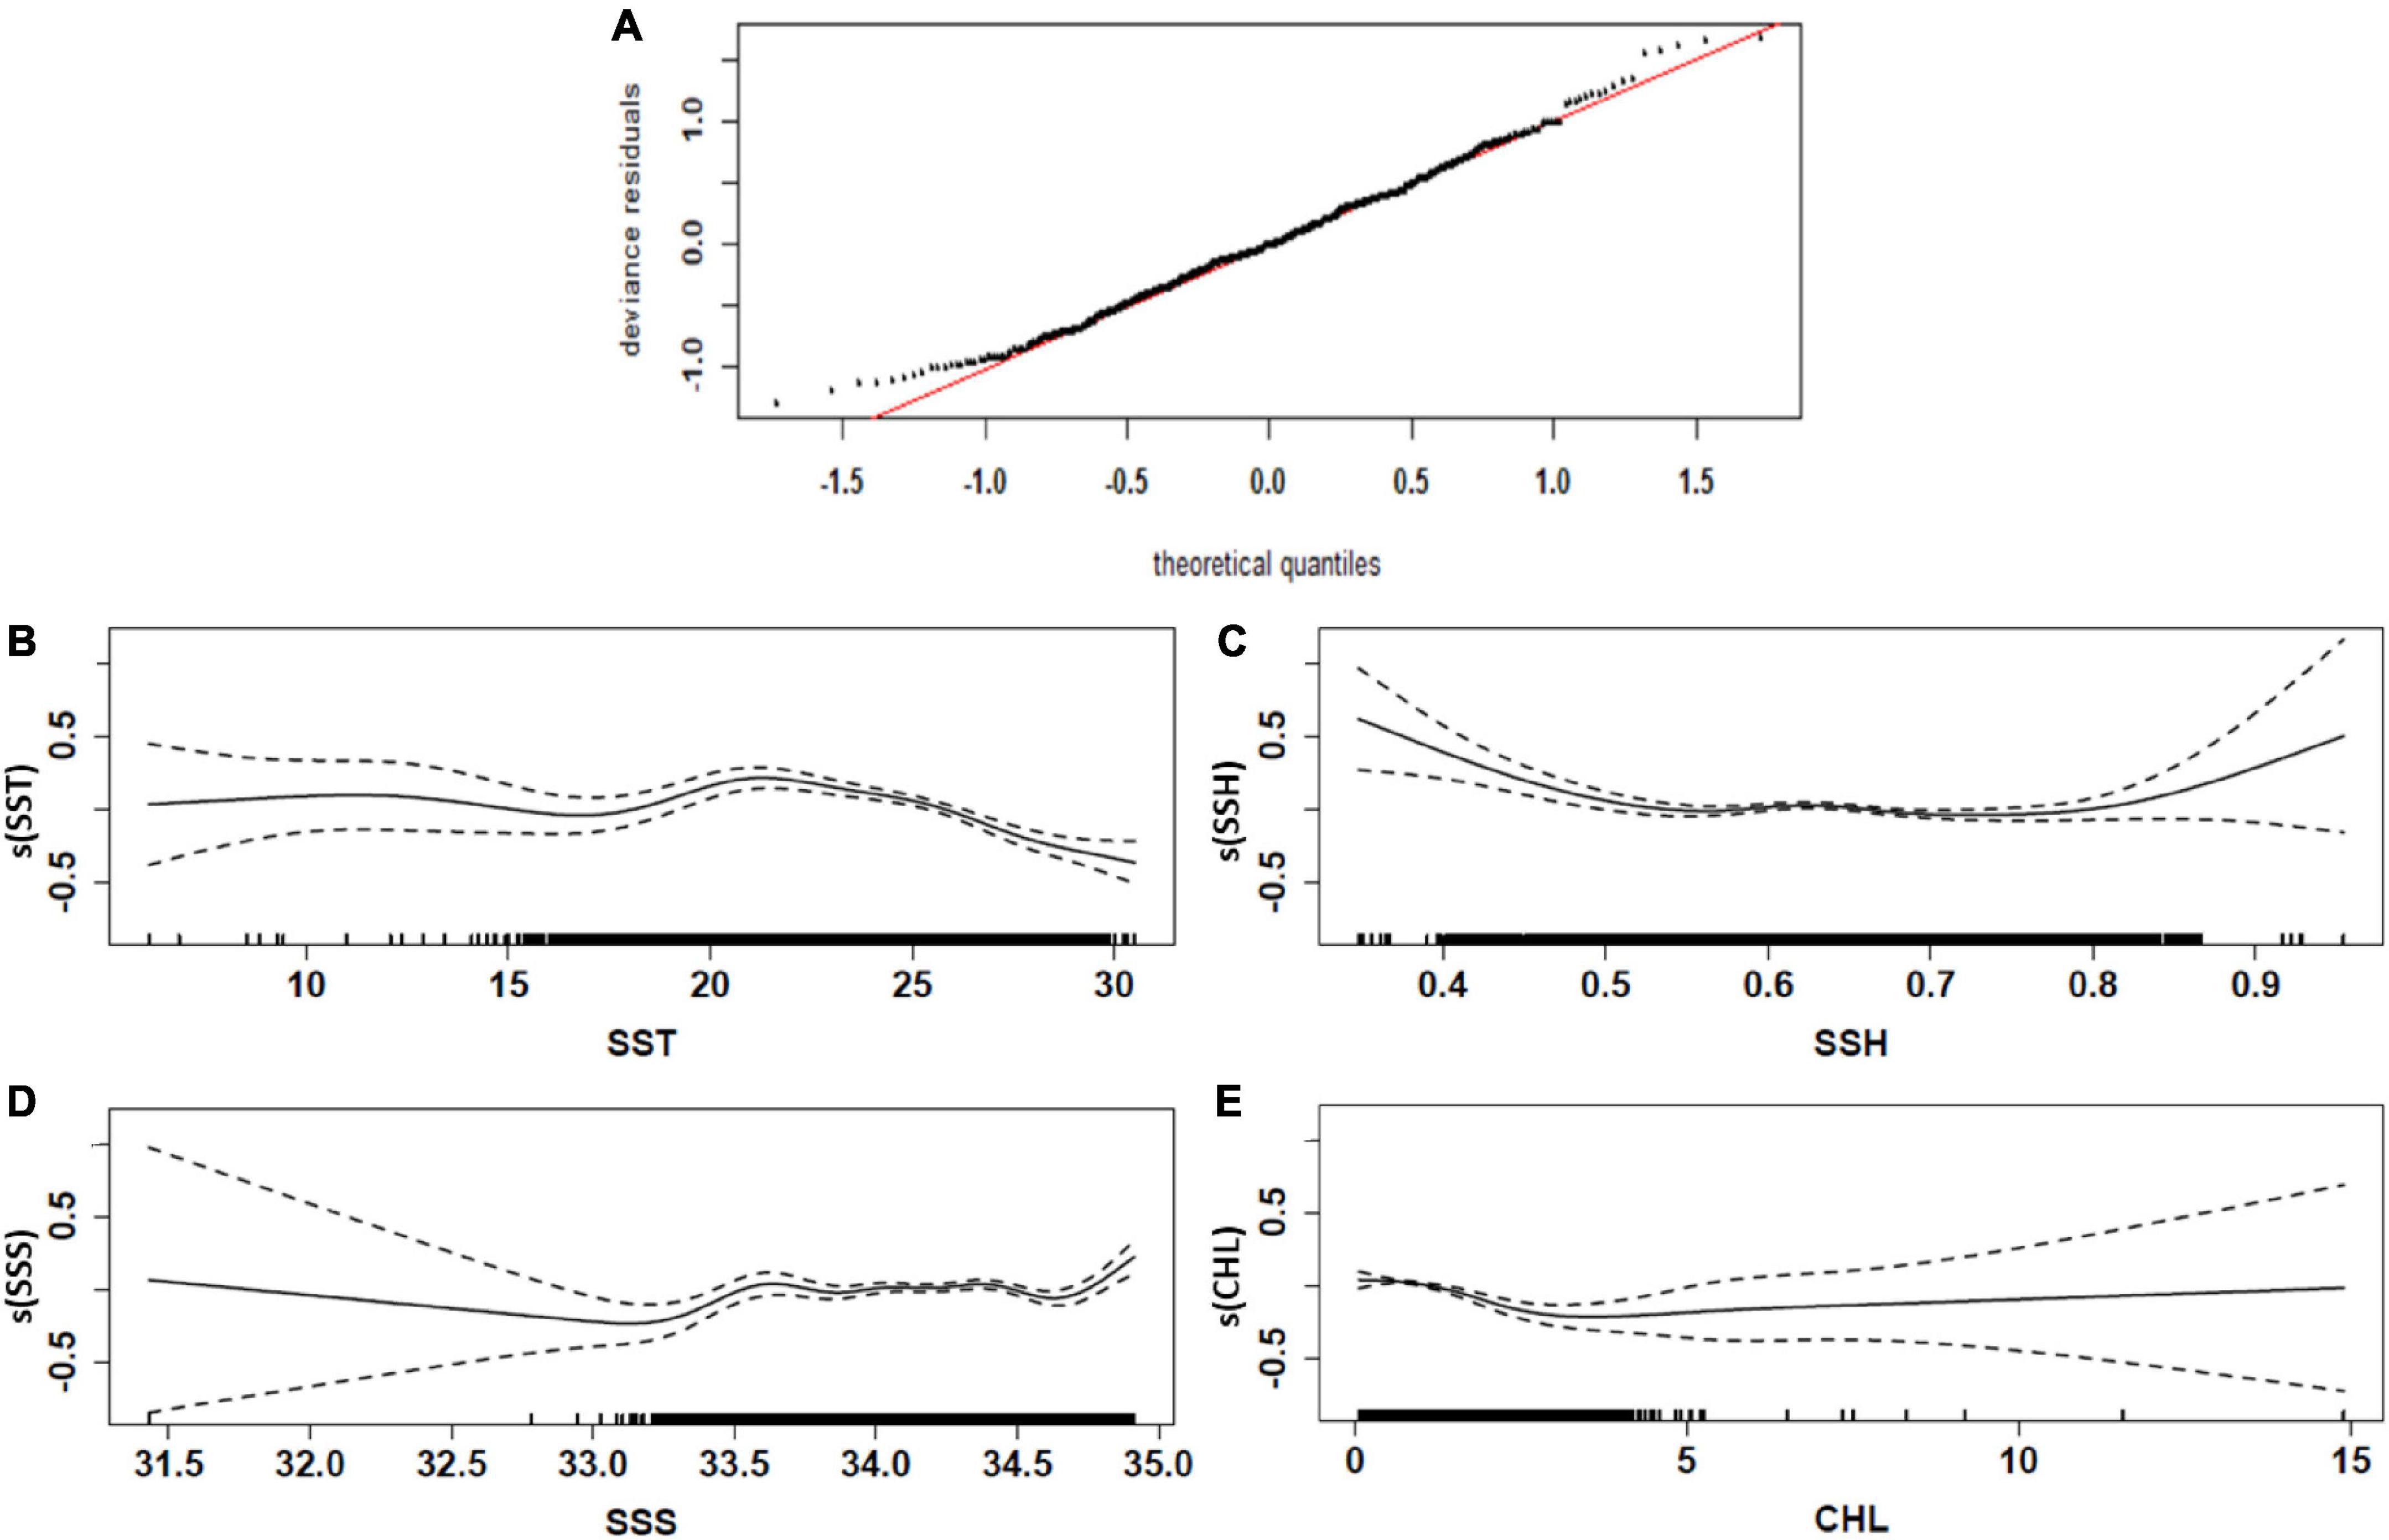
Figure 7. Quantile–quantile plots (A) and effects of environmental factors on the CRs of S. commerson (B–E) in the WT. The black dotted and solid lines denote the fitted GAM function and 95% confidence interval, respectively. The relative density of data points is indicated by the rug plot on the x-axis, and the y-axis represents the results obtained after smoothing the fitted values; furthermore, s(xn) represents a spline smoothing function for each model covariate xn. [Relationship between environmental factors and the CRs (logarithmic scale, log10) of S. commerson].
The addition of predictor variables at different levels increased the explained deviance, which was attributed to the decreased AIC value (Table 1). The results revealed that the oceanographic and spatiotemporal variables significantly affected the CRs of S. commerson (p < 0.01). The interaction of year and month with latitude (24.2 and 26.2%, respectively) and that of longitude with latitude (29.8%) explained a large proportion of the variance in CR. High CRs were observed in the southwest part of the TS (Figure 8C; 22°–25°N, 118–120°E) during the major fishing season: early autumn to winter (Figure 8B). Analyzing annual variation data indicated that the high CRs in the south of the TS (Figure 8A; 22°N–25°N) decreased from 2013 to 2015.
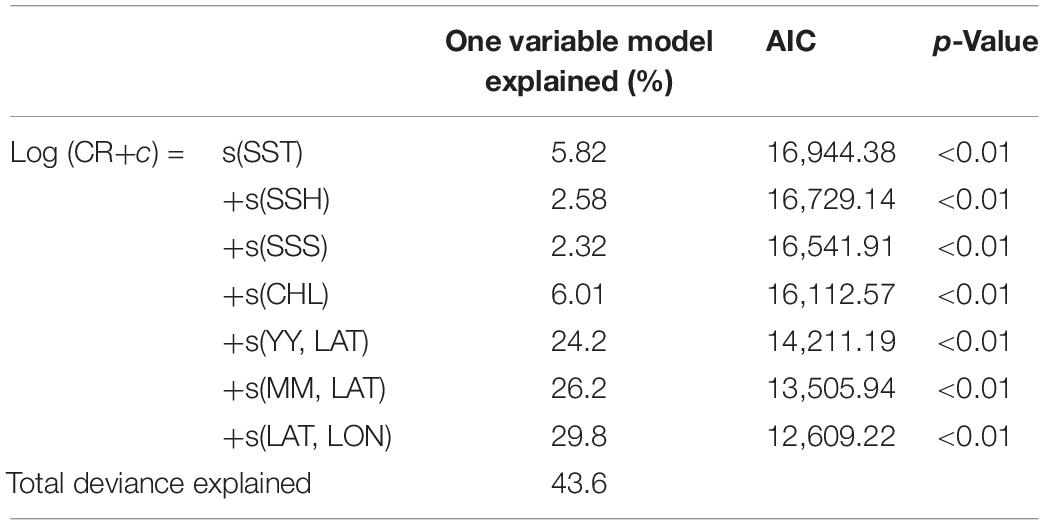
Table 1. Individual and total deviance explained and Akaike’s information criterion value in the model with the optimal conformation, as determined using a stepwise procedure.
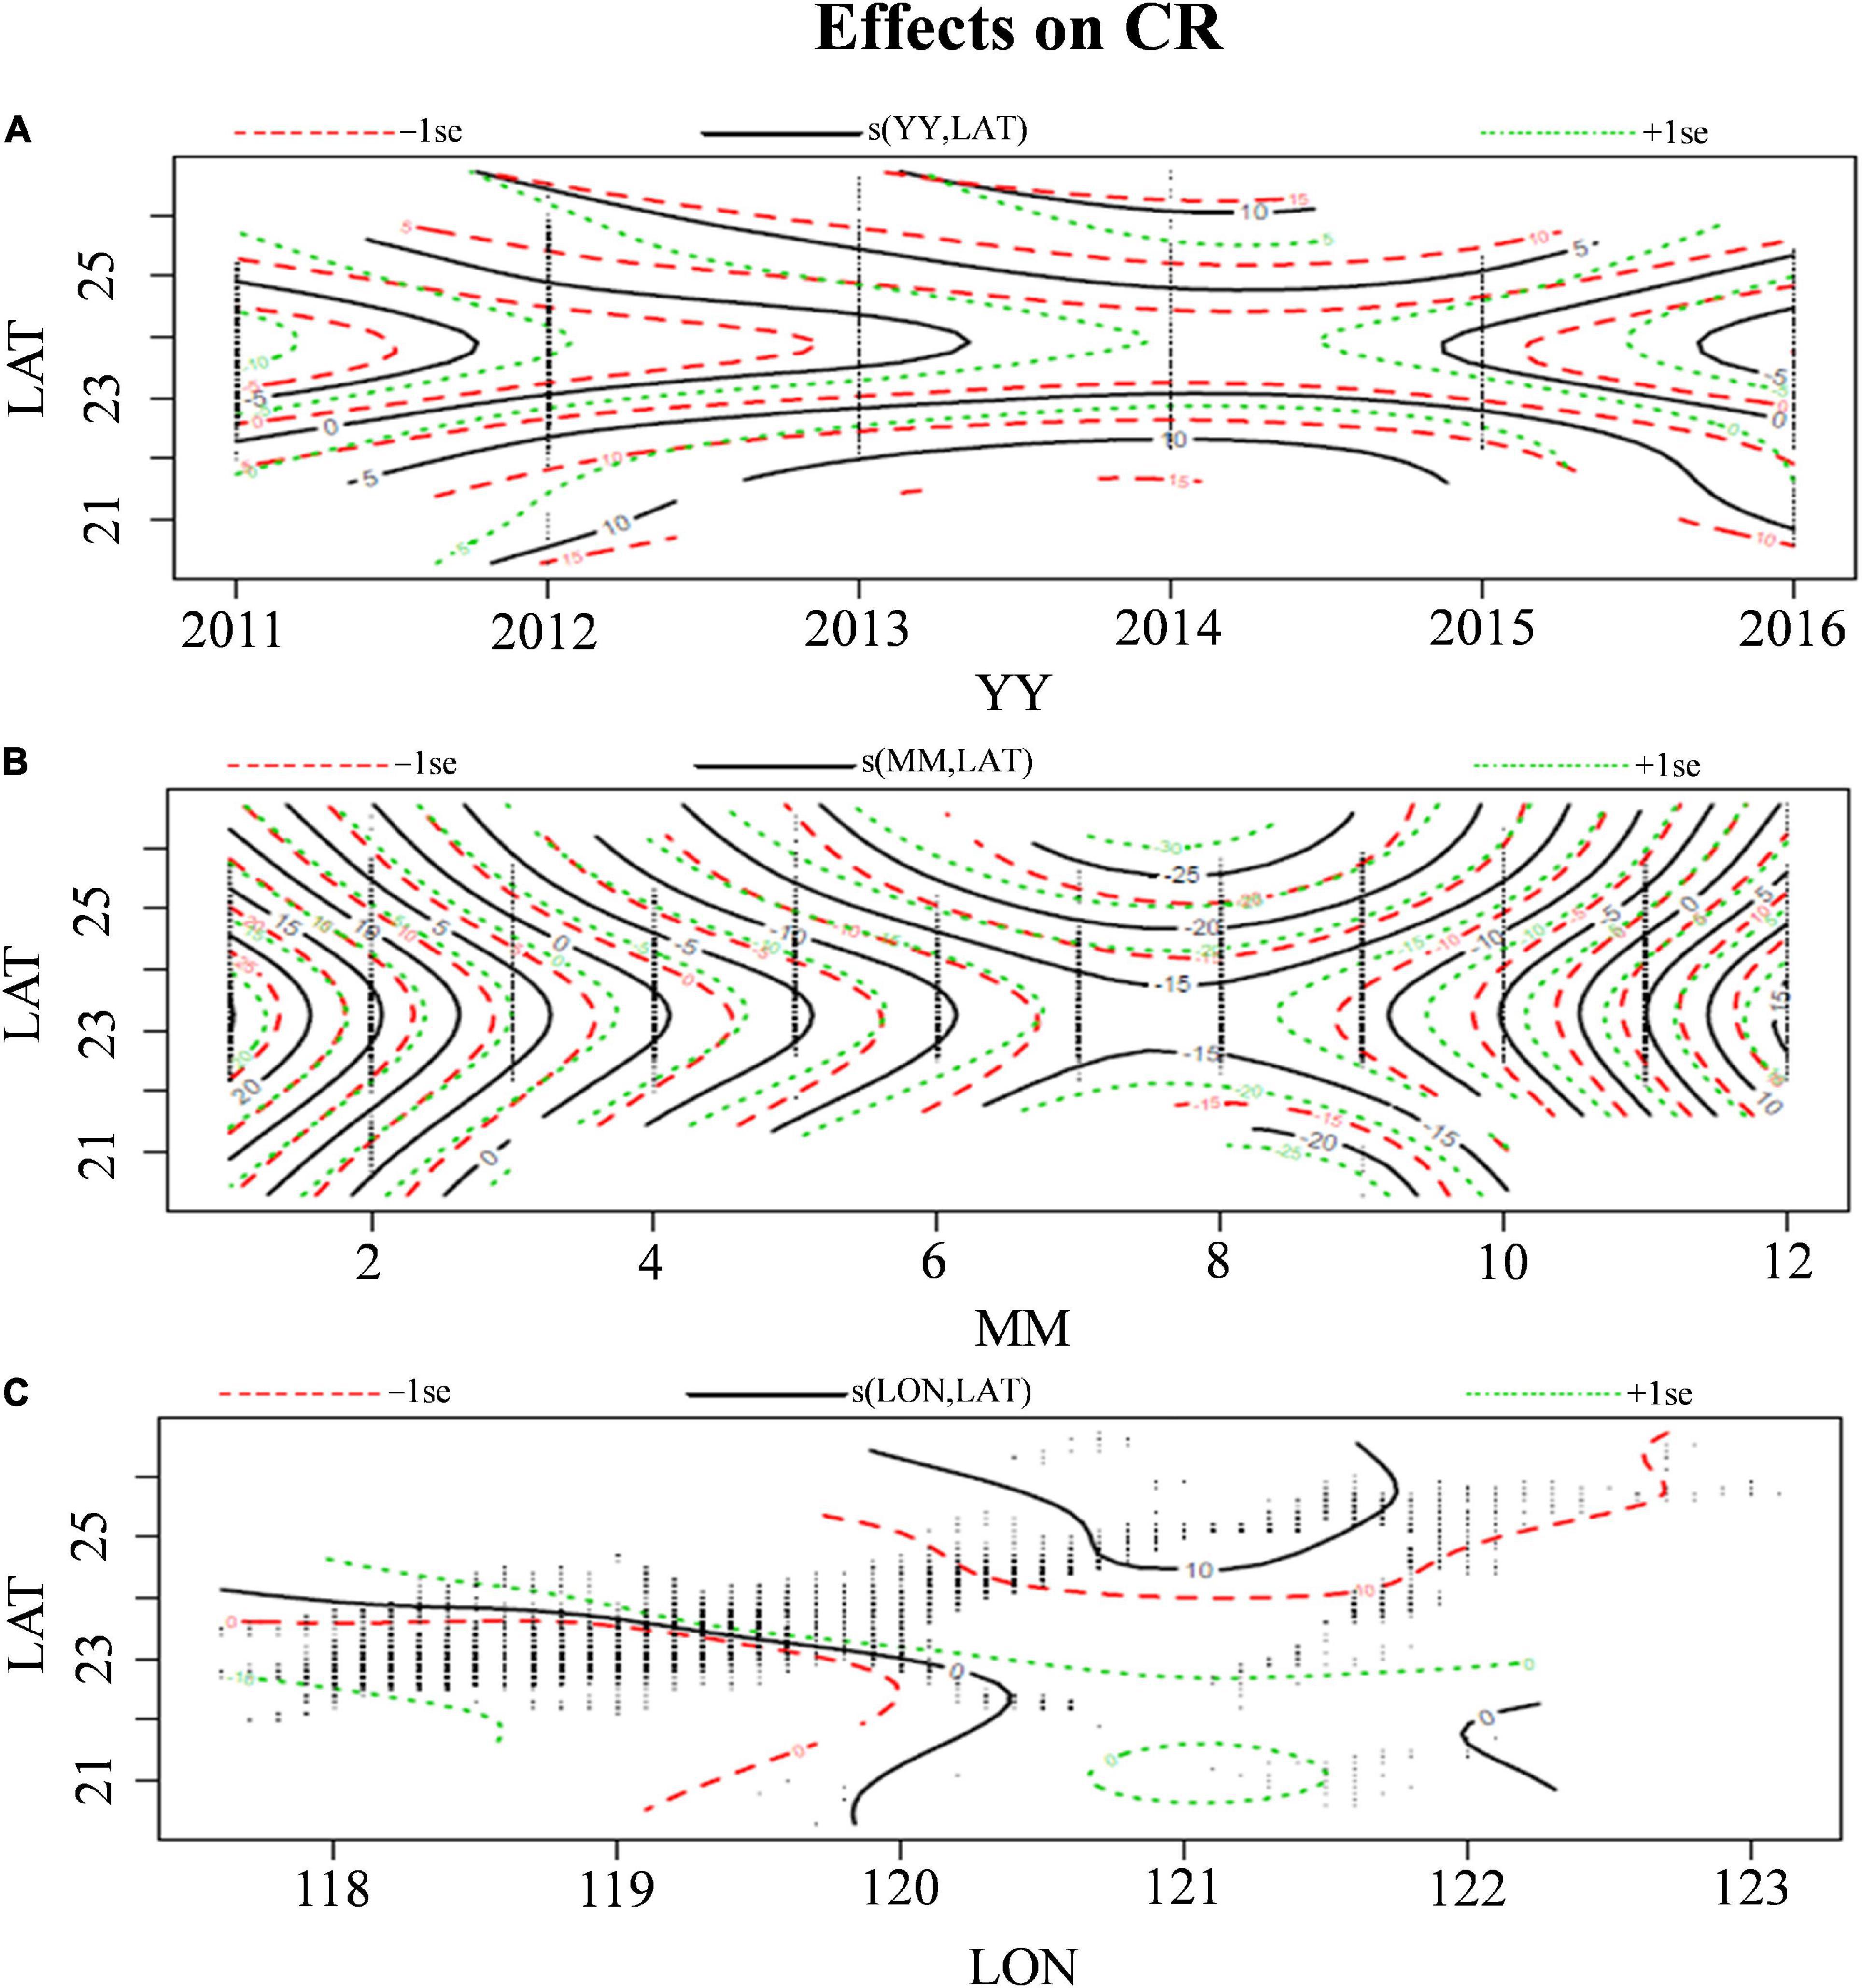
Figure 8. Effects of spatiotemporal interactive factors (A–C) on the CRs of S. commerson in the WT. The solid black contour line indicates the spatiotemporal effects on CRs; a positive value indicates a increasing CR, and a negative value indicates a decreasing CR in the corresponding time–space information. The green and red dotted contour lines indicate the ±1 standard error of the solid black contour line. The black dot indicated the intersect location for corresponding to spatial–temporal raw data.
Regarding the oceanographic variables, CHL explained the largest proportion of the variance in CR, followed by SST, SSH, and SSS (Table 1). The results also revealed that high CRs were positively associated with SSTs of approximately 20–25°C, CHL concentrations of 1–2 mg/m3, SSHs of approximately 0.6–0.7 m, and SSSs of >34.0 psu (Figures 7B–E). SST and CHL were the main variables determining the distribution of S. commerson; specifically, the abundance of S. commerson decreased as the SST and CHL concentration increased.
Projected Changes in El Niño/Southern Oscillation Events on the Fishing Grounds
The GAM results regarding annual variations revealed that the high CRs in the south of the TS (Figure 8A) decreased from 2013 to 2015 during El Niño events (Figure 9B). A box plot of the CRs in winter during various ENSO events indicated the same pattern (Figure 9A). The CR was observed to be 27.01 ± 37.6 kg/h during La Niña events (2011 and 2012), and it decreased to 17.61 ± 30.08 kg/h during El Niño events (2015 and 2016). Therefore, the CRs differed significantly between the various ENSO events (p < 0.05). To examine the effect of ENSO events on the CRs and distribution of S. commerson, this study used the optimal model to predict CRs during winter for the 2011–2016 period. This study also compared the spatial distributions of the predicted CRs for S. commerson during the El Niño events in January and February 2016 with those during the La Niña events in January and February 2012, and the results are presented in Figure 10. During the La Niña events, high CRs (>7 kg/h) were distributed southward, which extended south of 22°N. By contrast, during the El Niño events, high CRs were distributed mostly toward the north of 22°N.
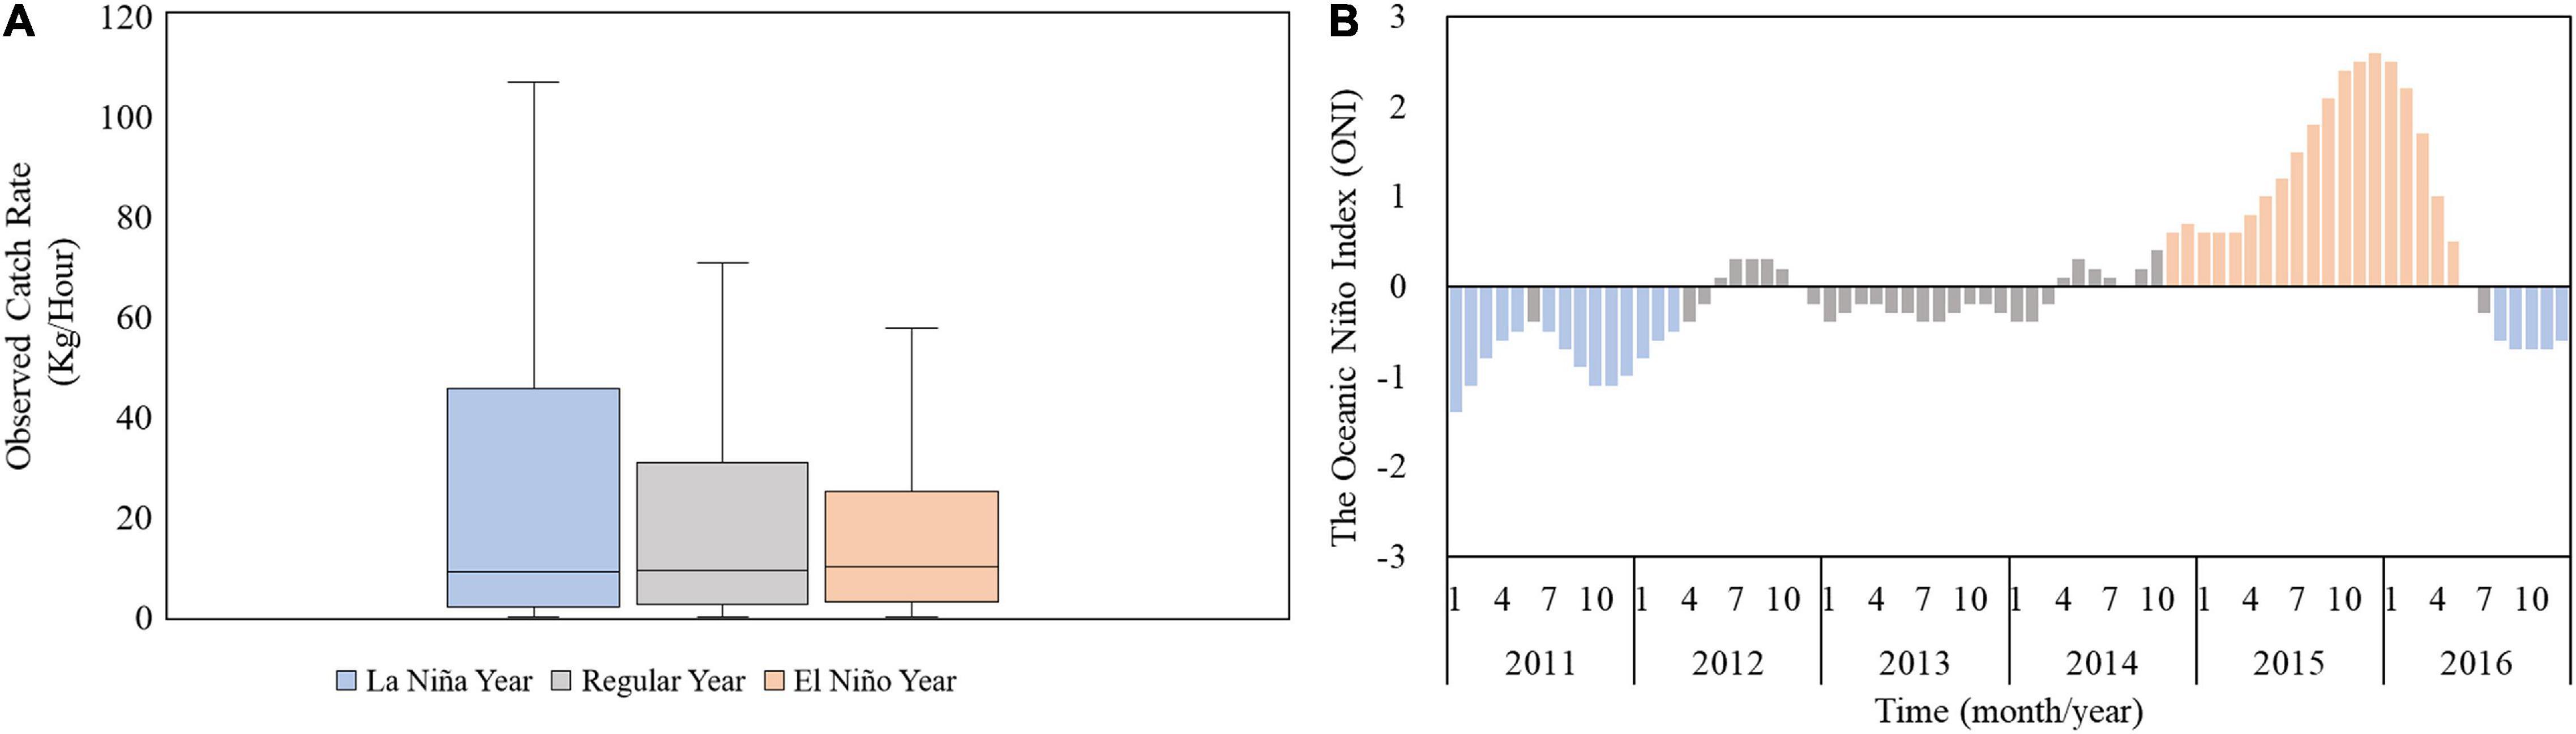
Figure 9. (A) Box plot of observed CRs during La Niña years (2011 and 2012), normal years (2013 and 2014), and El Niño years (2015 and 2016). (B) Bar chart of ONI from 2011 to 2016.
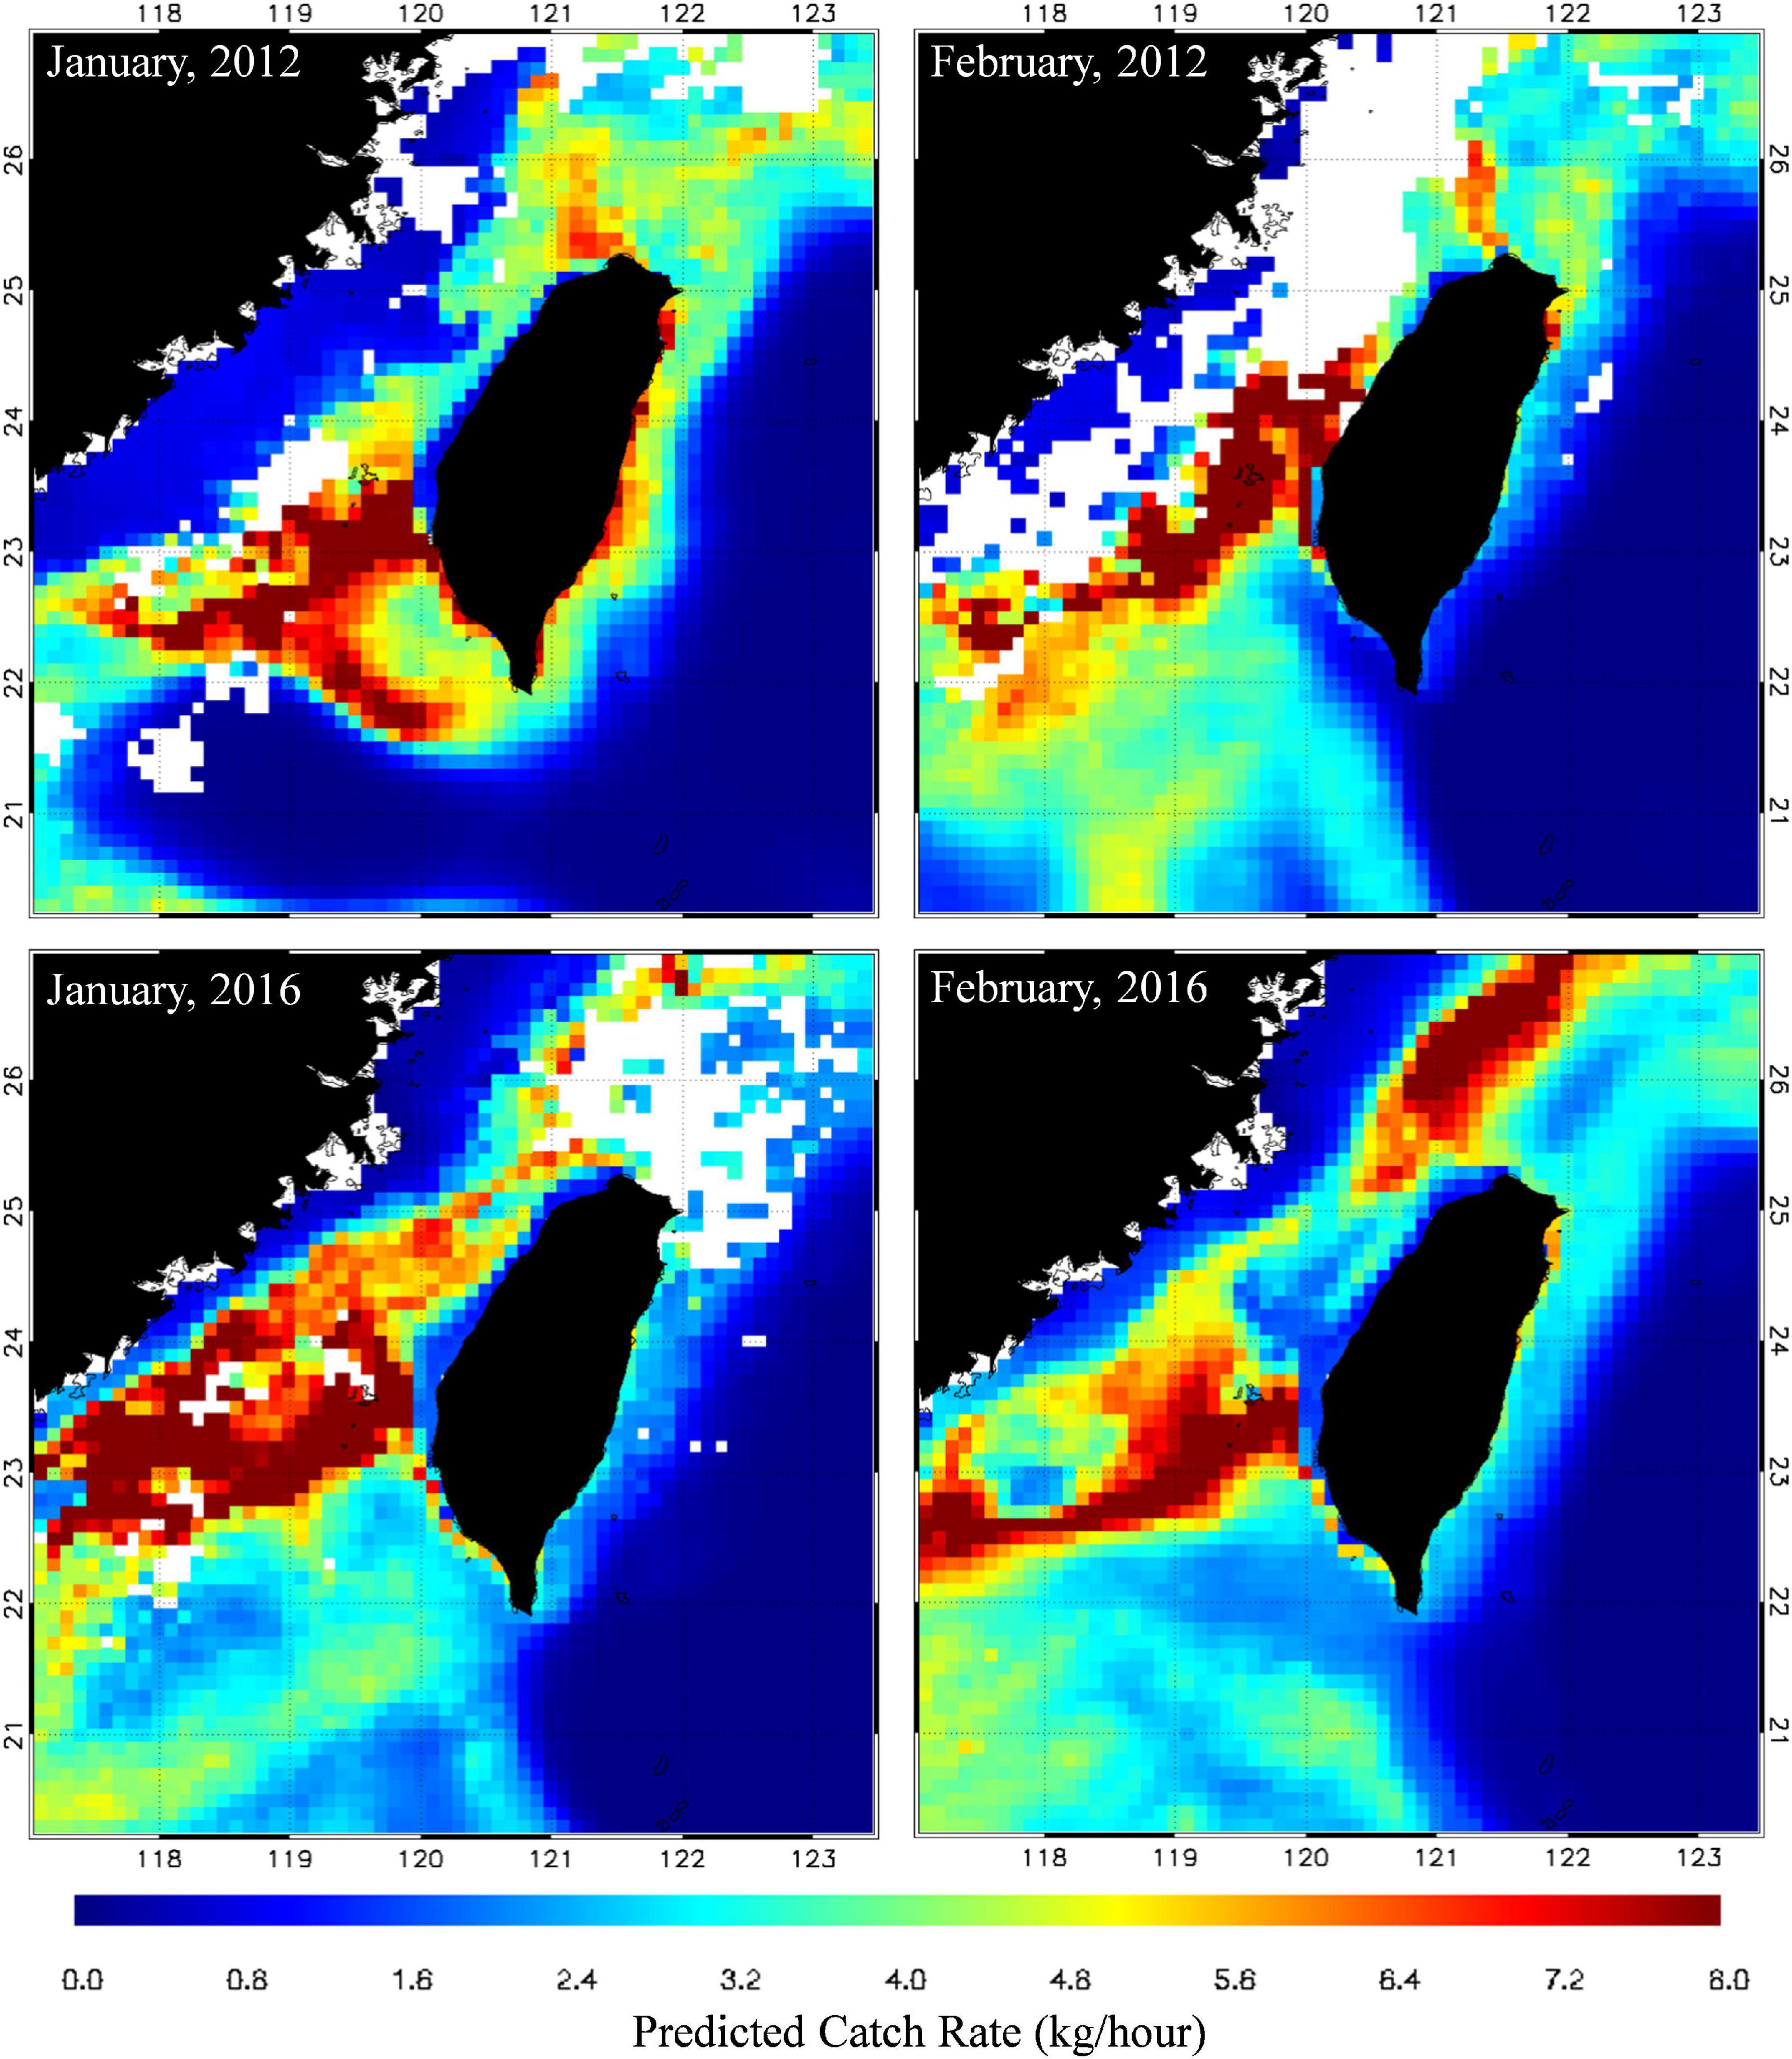
Figure 10. Spatial distributions of predicted CRs of S. commerson in the winters of 2012 (La Niña) and 2016 (El Niño).
Discussion
Using daily catch data for S. commerson along with vessel data recorder data, this study investigated the spatiotemporal variations of fishing grounds in relation to oceanographic conditions in the WT. Trammel nets are operated mostly in the TS, whereas longlines are operated off eastern Taiwan. Moreover, Weng et al. (2020) revealed that S. commerson are caught using drift gill nets and trolling lines in the Taiwan Bank. Trammel nets are composed of single, double, or triple layers of netting kept vertical by floats on the headrope and weights on the groundrope (Karakulak and Erk, 2008). According to the results of a bathymetric survey in the WT, the average water depths in eastern areas exceed 2,000 m, but those in western areas are less than 50 m that is, the water depth off eastern Taiwan is obviously more than that of western Taiwan (Liu et al., 1998). Therefore, the use of trammel nets in the waters off western Taiwan is highly efficient. Through the analysis of vessel operational data and bathymetric data, this study demonstrated that various fishing methods are used to effectively catch S. commerson in the WT. Although the data on trammel nets were only used to determine the relationship between the CRs of S. commerson and the oceanographic factors, the commercial catch data for S. commerson included data on various fishing methods (gears). The differences in effort among the considered fishing methods may explain the variations of the calculated CRs; however, it may incorrectly attributed varying catchability to differences in the abundance of fishery resources (Punt et al., 2000; Manuder and Punt, 2004). Bishop (2006) described an estimation model that accounts for variations in catchability and can thus aid in identifying unidimensional indices to represent variables that reflect aspects of an underlying domain. The effort data (working hours) used in this study were collected from voyage data recorders. Thus, subsequent studies should eliminate bias due to confounding among the various methods (gears).
This study revealed seasonal variations in the spatial distribution of S. commerson, which was distributed from northern and western areas in summer to southern and eastern areas in winter. Tseng et al. (1971) speculated that S. commerson may move southeast from the north in the TS in winter. The present study also indicated that the distribution patterns of S. commerson changed with seasonal progression. The WT are strongly influenced by the East Asian monsoon; therefore, wind stress explains a majority of the transport reversals (Kuo and Ho, 2004; Hong et al., 2011). The mixed China coastal water, with its low temperature and low salinity, is conveyed by the northeast monsoon–driven flow to the northern TS in winter (Jan et al., 2002; Hong et al., 2011). In this study, the GAM results reveal relatively high CRs at SSTs of 20–25°C during autumn and winter (the major fishing season). Thus, we suggest that S. commerson migrate abundantly into the TS from early winter to late spring by following the mixed China coastal water; subsequently, they migrate northward and southward as the SST gradually increases.
During autumn, high CRs were distributed widely across the southwestern TS, including in the waters along the southwestern coast of Taiwan and between the Penghu Islands and the Taiwan Bank, and concentrated gradually in winter. Previous studies on upwelling in the TS have reported that upwelling is a year-round phenomenon, with the degree of upwelling varying in the water around the Penghu Islands and Taiwan Bank (Lan et al., 2009; Hong et al., 2011; Hsiao et al., 2021). Fronts and mesoscale eddies are formed in the Taiwan Bank through the interaction of different water masses and monsoons, which all influence larval species due to the dispersion and convergence of nutrients (Zhang et al., 2014; Hsiao et al., 2021). Hsiao et al. (2021) revealed that the fishery resource structures in the frontal habitat of the Taiwan Bank are supported by both warm- and cold-water species, including S. commerson. Weng et al. (2020) reported the presence of hydrated and postovulatory oocytes for S. commerson in the central TS, implying that this area could be a spawning ground for this species. Thus, the aggregative response of biological interactions links primary productivity (PP) and top predators could be feeding and spawning grounds for S. commerson among different seasons in the upwelling of southwestern TS.
The GAM results revealed that CHL and SST were the dominant environmental factors affecting the CRs. The spawning season of S. commerson was estimated to be from March through August in the TS, and the SST might influence the species’ gametogenesis, gonad atresia, and spawning behavior (Lam, 1983; Weng et al., 2020). The area between the Taiwan Bank and the Penghu Islands is a major upwelling region and key fishing ground for S. commerson. The thermal fronts in the Taiwan Bank are characterized by two frontal belts on the northern and southern edges. A previous study indicated that the formation of the thermal front along the southern edge is linked to the interaction between topography and upwelling phenomena and that the thermal front along the northern edge may be tidally generated (Chang et al., 2006). In the present study, we determined that physical oceanographic elements such as SSH can influence the degree of productivity of S. commerson habitats. SSH reflects oceanic features such as current dynamics, fronts, eddies, and convergences (Lan et al., 2017). Our study demonstrated that the highest CRs corresponded to the areas with SSTs of 20–25°C, CHL concentrations of 1–2 mg/m3, SSHs of 0.6–0.7 m, and SSSs of 34.0–34.5 psu. These areas are potential habitats for S. commerson and their prey because of their physical oceanographic structure. Nutrients are supplied by the year-round upwelling of the southwestern TS, and the CHL pattern in the frontal region varies with the supply of nutrient-rich water from subsurface upwelling (Lan et al., 2009). Our findings are similar to those of a study on S. commerson in the northern Persian Gulf and Java Sea, which observed that S. commerson is sensitive to SSTs ranging from 13 to 29°C, SSSs ranging from 23 to 35 psu, and low CHL concentrations (Collette and Russo, 1979; Niamaimandi et al., 2015; Harahap et al., 2020).
Numerous studies have identified a positive correlation between the abundance of marine species and CHL. However, we found that the abundance of S. commerson decreased as the CHL concentration increased. Previous studies have also identified a negative correlation between abundance and CHL. Lan et al. (2012) revealed that the catch per unit effort of yellowfin tuna (Thunnus albacares) increased as the CHL concentration decreased. Su et al. (2011) reported that the likelihood of a nonzero blue marlin (Makaira nigricans) catch increased with the CHL concentration but that the CRs decreased. Lee et al. (2019) found that Bull sharks (Carcharhinus leucas) were present when CHL with low level. CHL concentrations in early stage prior to the present abundance index possibly influenced the CRs, and this time-lag phenomenon could be related to differences in trophic level species transformation (Lan et al., 2012). In addition, PP is an essential measure of an ocean’s capacity to transform carbon dioxide into particulate organic carbon at the base of the food web and is an effective predictor of the potential yield of the world’s oceans. Studies (Chassot et al., 2007, 2010) have suggested that PP is a key factor in the variation in biological resources at each trophic level. We used CHL as a phytoplankton biomass index rather than PP. Although CHL exhibited similar features to PP in the study area, CHL data derived from satellites should be analyzed by reparametrizing the original relationships on the basis of in situ data (Lan et al., 2020b). Therefore, PP could be incorporated into models to explore the relationship between the CRs of S. commerson and oceanographic factors.
Generalized additive models could aid in exploring the possible responses of a highly migratory species such as S. commerson to oceanographic variables. Spatial and temporal variables are essential to GAMs because they can be used to determine whether changes in the CRs of a species are related to environmental variables, spatiotemporal variables, or interactive variables. Our results suggest that CR assessment models that incorporate spatiotemporal and environmental variables can be used to identify the possible effects of such variables on the distribution of S. commerson. In addition, climate variability may lead to variations in the distribution of S. commerson. Climate-driven environmental variabilities of ENSO are pivotal factors affecting the intensity of upwelling regions in the southwestern TS (Wu et al., 2020; Hsiao et al., 2021). Variations in fishery resource structures and the spatial distribution of pelagic species are also influenced by ENSO events in the Taiwan Bank and change the upwelling size during summer (Hsiao et al., 2021). Moreover, the northeast monsoons in the TS are stronger during La Niña winters than during other seasons, increasing the intensity of variations in hydrographic features relative to those observed during El Niño events (Lan et al., 2014; Wu et al., 2020). The monthly spatial and temporal predictions for S. commerson during winter revealed that the CRs were higher and distributed further south during La Niña events. This study compared the 20°C isotherms obtained for the winters of 2012 (La Niña) and 2016 (El Niño). As displayed in Figure 11, the 20°C isotherms were located further north during the El Niño winter and extended south of the TS during the La Niña winter. We inferred that S. commerson was concentrated in the southwest when the northeast monsoon intensified during the La Niña winter and that the S. commerson population dispersed toward the northeast when the northeast monsoon weakened.
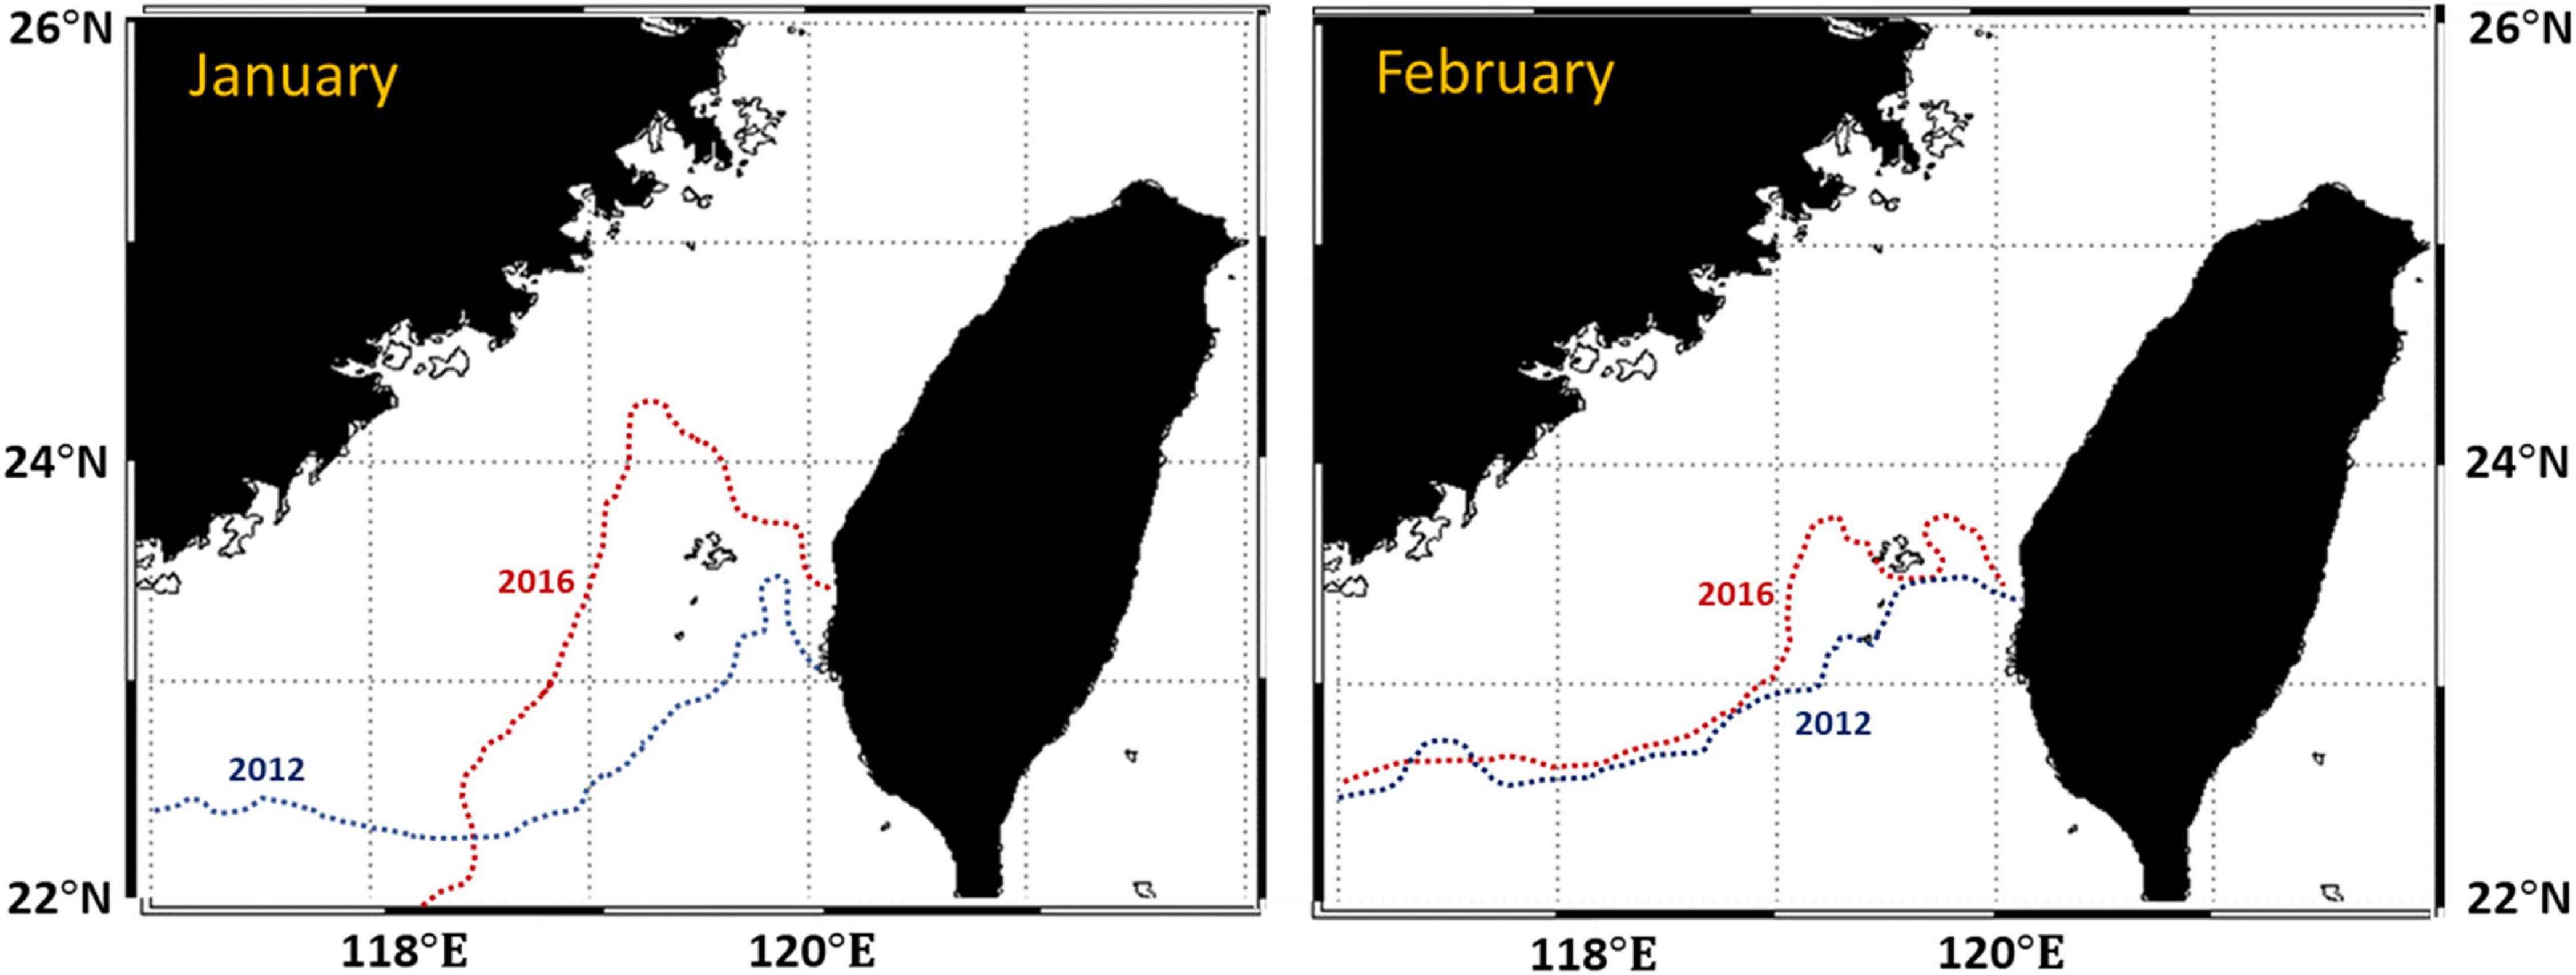
Figure 11. Contours of 20°C isotherms in the TS during the winters of 2012 (La Niña) and 2016 (El Niño).
The Gulf Cooperation Council, a regional intergovernmental union, developed several regulations for S. commerson fisheries, such as license requirements, bans on fishing during certain periods, mesh size limitations, landing size requirements, and restrictions on time at sea. Numerous studies have investigated S. commerson in this region and proposed suggestions for the management of resources (Dudley et al., 1992; Meriem et al., 2006; Roa-Ureta et al., 2019). However, information regarding the population dynamics, age, growth, and reproduction of the fish in our study area is required to formulate regulations for individual or regional management. In addition, approaches to managing fishery resources must account for factors that influence the spatial distribution of the fish. Oceanographic variations associated with regional and global phenomena, such as ENSO events, result in large-scale shifts in the dynamics and distribution of highly migratory species. Therefore, comprehensively reviewing the results of related studies and investigating unexplored topics are crucial for the formulation of effective management strategies.
Conclusion
This study combined daily high-resolution fishery data with environmental data by using GAMs to preliminarily analyze the relationship between the CRs of S. commerson and environmental factors. Using these data, we applied the models to effectively predict the distribution of S. commerson in the WT under the effects of ENSO events. Analyzing fishery dynamics indicated that trammel nets accounted for most of the catch of S. commerson in the WT. Trammel nets are operated mostly in the TS, whereas longlines are operated off eastern Taiwan. The overall CRs of S. commerson in the WT increased from early autumn to the end of winter relative to those in the other seasons. Relatively high CRs were concentrated in the waters off southwestern Taiwan, including the waters along the southwestern coast of Taiwan and between the Penghu Islands and the Taiwan Bank. All environmental factors significantly influenced the CRs of S. commerson and exhibited seasonal variations. CHL and SST were the most influential environmental factors in the WT and could be related to the spawning behavior of this species.
Examining the projected changes in ENSO events for S. commerson in our study revealed that the fishing conditions and fishing grounds were affected during different phases. However, comprehensively determining the fishery dynamics would require long-term and systematically recorded catch data, which can further reveal the degree of influence of variations in environmental characteristics under climate change on specific species. Moreover, interspecific relationships must be considered because such relationships may affect the fishing conditions of single species. The movements and distributions of top predators are governed by bottom-up processes and direct environmental effects (e.g., physiological tolerance to anoxia and thermal preferences; Lan et al., 2021). Top marine predators can have high phenotypic plasticity and adaptive capabilities that mitigate the effects of climate change on them; however, climate change may still affect these predators through their prey (Hazen et al., 2013). Hence, understanding how low-trophic marine ecosystems are related to each life stage of S. commerson can help researchers clearly understand the mechanism through which climate change influences the distribution and abundance of S. commerson. Future research should thus apply additional long-term oceanographic variables and prey species in different prediction models, considering the influence of interspecific relationships.
Data Availability Statement
The datasets presented in this article are not readily available because due to legal restrictions imposed by the government of Taiwan in relation to the “Personal Information Protection Act,” data cannot be made publicly available. Requests for data can be sent as a formal proposal to the FA, COA (http://www.fa.gov.tw/). Requests to access the datasets should be directed to http://www.fa.gov.tw/.
Author Contributions
L-CC: formal analysis, data curation, and writing – original draft preparation. K-WL: conceptualization, methodology, writing – review and editing, and supervision. P-YH and MN: software and visualization. J-SW and C-TT: data curation and supervision. C-CC: formal analysis. All authors have read and approved the published version of the manuscript.
Funding
This study was financially supported by Taiwan’s Council of Agriculture (109AS-1.1.5-ST-aC) and the National Science Council (MOST 108-2611-M-019-007 and MOST 109-2611-M-019-007).
Conflict of Interest
The authors declare that the research was conducted in the absence of any commercial or financial relationships that could be construed as a potential conflict of interest.
Publisher’s Note
All claims expressed in this article are solely those of the authors and do not necessarily represent those of their affiliated organizations, or those of the publisher, the editors and the reviewers. Any product that may be evaluated in this article, or claim that may be made by its manufacturer, is not guaranteed or endorsed by the publisher.
Acknowledgments
We give special thanks to Director General J.-R. Chen and Chief H.-J. Hsieh of the Fisheries Research Institute for their support and guidance. We are also grateful to P.-H. Huang and Y.-L. Wu of National Taiwan Ocean University for their help with this article.
Footnotes
References
Asch, R. G., Cheung, W. W. L., and Reygondeau, G. (2018). Future marine ecosystem drivers, biodiversity, and fisheries maximum catch potential in Pacific Island countries and territories under climate change. Mar. Policy 88, 285–294. doi: 10.1016/j.marpol.2017.08.015
Bell, J. D., Ganachaud, A., Gehrke, P. C., Griffiths, S. P., Hobday, A. J., Hoegh-Guldberg, O., et al. (2013). Mixed responses of tropical Pacific fisheries and aquaculture to climate change. Nat. Climate Change 3, 591–599. doi: 10.1038/NCLIMATE1838
Bishop, J. (2006). Standardizing fishery-dependent catch and effort data in complex fisheries with technology change. Rev. Fish Biol. Fish. 16, 21–38. doi: 10.1007/s11160-006-0004-9
Chang, Y., Shimada, T., Lee, M. A., Lu, H. J., Sakaida, F., and Kawamura, H. (2006). Wintertime sea surface temperature fronts in the Taiwan Strait. Geophys. Res. Lett. 33:L23603. doi: 10.1029/2006GL027415
Chassot, E., Bonhommeau, S., Dulvy, N. K., Mélin, F., Watson, R., Gascuel, D., et al. (2010). Global marine primary production constrains fisheries catches. Ecol. Lett. 13, 195–505. doi: 10.1111/j.1461-0248.2010.01443.x
Chassot, E., Mélin, F., Watson Le Pape, O., and Gascuel, D. (2007). Bottom-up control regulates fisheries production at the scale of eco-regions in European seas. Mar. Ecol. Prog. Series 343, 45–505. doi: 10.3354/meps06919
Collette, B. B. (2001). “Scombridae. tunas (also, albacore, bonitos, mackerels, seerfishes, and wahoo),” in FAO Species Identification Guide for Fishery Purposes. The Living Marine Resources of the Western Central Pacific. Bony Fishes Part 4 (Labridae to Latimeriidae), Estuarine Crocodiles, eds K. E. Carpenter and V. Niem (Rome: FAO), 3721–3756.
Collette, B. B., and Russo, J. L. (1979). “An introduction to the Spanish mackerels Genus scomberomorus,” in Proceedings of the Colloquium on the Spanish and king mackerel resources of the Gulf of Mexico, (Ocean Springs, MS: Gulf States Marine Fisheries Commission),
Dudley, R., Aghanashinikar, A. P., and Brothers, E. B. (1992). Management of the Indo-Pacific Spanish mackerel (Scomberomorus commerson) in Oman. Fish. Res. 15, 17–43. doi: 10.1016/0165-7836(92)90003-C
Fisheries Agency (2019). Taiwan Fisheries Yearbook. Available online at: https://www.fa.gov.tw/cht/PublicationsFishYear/index.aspx
Harahap, S. A., Syamsuddin, M. L., and Purba, N. P. (2020). Range of sea surface temperature and chlorophyll-α values based on mackerel catches in the northern waters of West Java, Indonesia. AACL Bioflux 13, 2265–2272.
Hazen, E. L., Jorgensen, S., Rykaczewski, R. R., Bograd, S. J., Foley, D. G., Jonsen, I. D., et al. (2013). Predicted habitat shifts of Pacific top predators in a changing climate. Nat. Climate Change 3, 234–238. doi: 10.1038/nclimate1686
Ho, C. H., Lur, H. S., Yao, M. H., Liao, F. C., Lin, Y. T., Yagi, N., et al. (2018). The impact on food security and future adaptation under climate variation: a case study of Taiwan’s agriculture and fisheries. Mitigation Adaptation Strategies Global Change 23, 311–347. doi: 10.1007/s11027-017-9742-3
Hong, H. S., Chai, F., Zhang, C. Y., Huang, B. Q., Jiang, Y. W., and Hu, J. Y. (2011). An overview of physical and biogeochemical processes and ecosystem dynamics in the Taiwan Strait. Continental Shelf Res. 31, 3–12. doi: 10.1016/j.csr.2011.02.002
Hsiao, P. Y., Shimada, T., Lan, K. W., Lee, M. A., and Liao, C. H. (2021). Assessing summertime primary production required in changed marine environments in upwelling ecosystems around the Taiwan Bank. Remote Sensing 13:765. doi: 10.3390/rs13040765
Hsu, C. C., Han, Y. S., and Tzeng, W. N. (2007). Evidence of flathead mullet Mugil cephalus L. spawning in Waters Northeast of Taiwan. Zool. Stud. 46, 717–725.
Jan, S., Sheu, D. D., and Kuo, H. M. (2006). Water mass and throughflow transport variability in the Taiwan Strait. J. Geophys. Research-Oceans 111:C12012. doi: 10.1029/2006JC003656
Jan, S., Wang, J., Chern, C. S., and Chao, S. Y. (2002). Seasonal variation of the circulation in the Taiwan Strait. J. Mar. Systems 35, 249–268.
Ju, P. L., Tian, Y. J., Chen, M. R., Yang, S. Y., Liu, Y., Xing, Q. W., et al. (2020). Evaluating stock status of 16 commercial fish species in the coastal and offshore waters of Taiwan using the CMSY and BSM methods. Front. Mar. Sci. 7:618. doi: 10.3389/fmars.2020.00618
Karakulak, F. S., and Erk, H. (2008). Gill net and trammel net selectivity in the northern Aegean Sea. Turkey. Sci. Mar. 72, 527–540. doi: 10.3989/scimar.2008.72n3527
Kuo, N. J., and Ho, C. R. (2004). ENSO effect on the sea surface wind and sea surface temperature in the Taiwan Strait. Geophys. Res. Lett. 31:L13309. doi: 10.1029/2004GL020303
Lam, T. J. (1983). “Environmental influences on gonadal activity in fish,” in Fish Physiology, eds W. S. Hoar, D. J. Randall, and E. M. Donaldson (New York, NY: Academic Press, Inc).
Lan, K. W., Chou, C. P., Lee, M. A., and Vayghan, A. H. (2018). Association between the interannual variation in the oceanic environment and catch rates of bigeye tuna (Thunnus obesus) in the Atlantic ocean. Fish. Oceanogr. 27, 1–13. doi: 10.1111/fog.12259
Lan, K. W., Kawamura, H., Lee, M. A., Chang, Y., Chan, J. W., and Liao, C. H. (2009). Summertime sea surface temperature fronts associated with upwelling around the Taiwan Bank. Continental Shelf Res. 29, 903–910. doi: 10.1016/j.csr.2009.01.015
Lan, K. W., Nishida, T., Lee, M. A., Lu, H. J., Huang, H. W., Chang, S. K., et al. (2012). Influence of the marine environment variability on the yellowfin tuna (Thunnus albacares) catch rate by the Taiwanese longline fishery in the Arabian Sea, with special reference to the high catch in 2004. J. Mar. Sci. Technol. 20, 514–524. doi: 10.6119/JMST-011-0506-1
Lan, K. W., Lee, M. A., Zhang, C. I., Wang, P. Y., Wu, L. J., and Lee, K. T. (2014). Effects of climate variability and climate change on the fishing conditions for grey mullet (Mugil cephalus L.) in the Taiwan Strait. Climatic Change 126, 189–202. doi: 10.1007/s10584-014-1208-y
Lan, K. W., Lian, L. J., Li, C. H., Hsiao, P. Y., and Cheng, S. Y. (2020b). Validation of a primary production algorithm of vertically generalized production model derived from multi-satellite data around the waters of Taiwan. Remote Sensing 12:1627. doi: 10.3390/rs12101627
Lan, K. W., Chang, Y. J., and Wu, Y. L. (2020a). Influence of oceanographic and climatic variability on the catch rate of yellowfin tuna (Thunnus albacares) cohorts in the Indian Ocean. Deep-Sea Res. Part II: Top. Stud. Oceanography 175:104681. doi: 10.1016/j.dsr2.2019.104681
Lan, K. W., Wu, Y. L., Chen, L. C., Naimullah, M., and Lin, T. H. (2021). Effects of climate change in marine ecosystems based on the spatiotemporal age structure of top predators: a case study of bigeye tuna in the Pacific Ocean. Front. Mar. Sci. 8:614594. doi: 10.3389/fmars.2021.614594
Lan, K. W., Zhang, C. I., Kang, H. J., Wu, L. J., and Lian, L. J. (2017). Impact of fishing exploitation and climate change on the grey mullet (Mugil cephalus L.) stock in the Taiwan Strait. Mar. Coastal Fish. 9, 271–281. doi: 10.1080/19425120.2017.1317680
Lee, K. A., Smoothey, A. F., Harcourt, R. G., Roughan, M., Butcher, P. A., and Peddemors, V. M. (2019). Environmental drivers of abundance and residency of a large migratory shark, Carcharhinus leucas, inshore of a dynamic western boundary current. Mar. Ecol. Prog. Series 622, 121–137. doi: 10.3354/meps13052
Lehodey, P., Bertignac, M., Hampton, J., Lewis, A., and Picaut, J. (1997). El Niño Southern Oscillation and tuna in the western Pacific. Nature 389, 715–718. doi: 10.1038/39575
Liao, C. H., Lan, K. W., Ho, H. Y., Wang, K. Y., and Wu, Y. L. (2018). Variation in the catch rate and distribution of swordtip squid (Uroteuthis edulis) associated with factors of the oceanic environment in the southern East China. Mar. Coastal Fish. 10, 452–464. doi: 10.1002/mcf2.10039
Lin, C. Y., Wang, S. P., Chiang, W. C., Griffiths, S., and Yeh, H. M. (2020). Ecological risk assessment of species impacted by fisheries in waters off eastern Taiwan. Fish. Manag. Ecol. 27, 345–356. doi: 10.1111/fme.12417
Liu, C. S., Liu, S. Y., Lallemand, S. E., Lundberg, N., and Reed, D. L. (1998). Digital elevation model offshores Taiwan and its tectonic implications. Terrestrial Atmospheric Oceanic Sci. 9, 705–738.
Madigan, D. J., Chiang, W. C., Wallsgrove, N. J., Popp, B. N., Kitagawa, T., Choy, C. A., et al. (2016). Intrinsic tracers reveal recent foraging ecology of giant Pacific bluefin tuna at their primary spawning grounds. Mar. Ecol. Prog. Series 553, 253–266. doi: 10.3354/meps11782
Manuder, M. N., and Punt, A. E. (2004). Standardizing catch and effort data: a review of recent approaches. Fish. Res. 70, 141–159. doi: 10.1016/j.fishres.2004.08.002
McPherson, G. R. (1985). Development of the northern Queensland mackerel fishery. Australian Fish. 44, 15–17.
Meriem, S. B., Al-Marzouqi, A., and Al-Mamry, J. (2006). Fisheries exploitation pattern of narrow-barred Spanish mackerel, Scomberomorus commerson, in Oman and potential management options. J. Appl. Lchthyol. 22, 218–224. doi: 10.1111/j.1439-0426.2006.00739.x
National Aeronautics and Space Administration [NASA] (2017). Moderate-Resolution Imaging Spectroradiometer (MODIS) Aqua Data. Maryland, MD: NASA.
Nelder, J. A., and Wedderburn, R. W. N. (1972). Generalized linear models. J. R. Statist. Soc. A 135, 370–384.
Nguyen, K. Q., and Nguyena, V. Y. (2017). Changing of sea surface temperature affects catch of spanish mackerel Scomberomorus Commerson in the set-net fishery. Fish. Aquaculture J. 8:1000231. doi: 10.4172/2150-3508.1000231
Niamaimandi, N., Kaymaram, F., Hoolihan, J. P., Mohammadi, G. H., and Fatemi, S. M. R. (2015). Population dynamics parameters of narrow-barred Spanish mackerel, Scomberomorus commerson (Lacèpéde, 1800), from commercial catch in the northern Persian Gulf. Global Ecol. Conserv. 4, 666–672. doi: 10.1016/j.gecco.2015.10.012
Punt, A. E., Walker, T. I., Taylor, B. L., and Pribac, F. (2000). Standardization of catch and effort data in a spatially-structured shark fishery. Fish. Res. 45, 129–145.
QGIS Development Team (2019). QGIS 3.6 Noosa. 2019. Available online at: https://qgis.org/en/site (accessed 30 September, 2019).
Roa-Ureta, R. H., Lin, Y. J., Rabaoui, L., Al-Abdulkader, K., and Qurban, M. A. (2019). Life history traits of the narrow-barred Spanish mackerel (Scomberemorus commerson) across jurisdictions of the southeast Arabian Peninsula: implications for regional management policies. Regional Stud. Mar. Sci. 31:100797. doi: 10.1016/j.rsma.2019.100797
Shoji, J., and Tanaka, M. (2005). Distribution, feeding condition, and growth of Japanese Spanish mackerel (Scomberomorus niphonius) larvae in the Seto Inland Sea. Fish. Bull. Natl. Oceanic Atmospheric Administration 103, 371–379.
Shui, B. N., Han, Z. Q., Gao, T. X., Miao, Z. Q., and Takashi, Y. (2009). Mitochondrial DNA variation in the East China Sea and Yellow Sea populations of Japanese Spanish mackerel Scomberomorus niphonius. Fish. Sci. 75, 593–600. doi: 10.1007/s12562-009-0083-3
Solanki, H. U., Bhatpuria, D., and Chauhan, P. (2017). Applications of generalized additive model (GAM) to satellite-derived variables and fishery data for prediction of fishery resources distributions in the Arabian sea. Geocarto Int. 32, 30–43. doi: 10.1080/10106049.2015.1120357
Su, N. J., Sun, C. L., Punt, A. E., Yeh, S. Z., and DiNardo, G. (2011). Modelling the impacts of environmental variation on the distribution of blue marlin, Makaira nigricans, in the Pacific Ocean. ICES J. Mar. Sci. 68, 1072–1080. doi: 10.1093/icesjms/fsr028
Tseng, H. C., You, W. L., Huang, W., Chung, C. C., Tsai, A. Y., Chen, T. Y., et al. (2020). Seasonal variations of marine environment and primary production in the Taiwan Strait. Front. Mar. Sci. 7:38. doi: 10.3389/fmars.2020.00038
Tseng, W. Y., Chen, C. H., Hu, S. H., Chen, G. S., and Pao, W. H. (1971). Preliminary study on Spanish mackerel of Taiwan. Bull. Taiwan Fish. Res. Institute 18, 89–114.
Wang, T. W., Chan, T. Y., and Chan, B. K. K. (2013). Diversity and community structure of decapod crustaceans at hydrothermal vents and nearby deep-water fishing grounds Off Kueishan Island, Taiwan: a high biodiversity deep-sea area in the NW pacific. Bull. Mar. Sci. 89, 505–528. doi: 10.5343/bms.2012.1036
Wang, Y. F., Yao, L. J., Chen, P. M., and Yu Jing Wu, Q. (2020). Environmental influence on the spatiotemporal variability of fishing grounds in the Beibu Gulf, South China Sea. J. Mar. Sci. Eng. 8:957. doi: 10.3390/jmse8120957
Weng, J. S., Wu, S. F., Lo, Y. S., Shiao, J. C., Lee, M. A., Liu, K. M., et al. (2020). Reproductive biology of the narrow-barred Spanish mackerel (Scomberomorus commerson) in the central Taiwan Strait, western Pacific. Deep-Sea Res. Part II: Top. Stud. Oceanography 175:104755. doi: 10.1016/j.dsr2.2020.104755
Wu, Y. L., Lee, M. A., Chen, L. C., Chan, J. W., and Lan, K. W. (2020). Evaluating a Suitable Aquaculture site selection model for cobia (Rachycentron canadum) during extreme events in the inner Bay of the Penghu Islands. Taiwan. Remote Sensing 12:2689. doi: 10.3390/rs12172689
Keywords: catch rate, Spanish mackerel, generalized additive model, fishing dynamic, environmental factor, climatic variability, waters around Taiwan
Citation: Chen L-C, Weng J-S, Naimullah M, Hsiao P-Y, Tseng C-T, Lan K-W and Chuang C-C (2021) Distribution and Catch Rate Characteristics of Narrow-Barred Spanish Mackerel (Scomberomorus commerson) in Relation to Oceanographic Factors in the Waters Around Taiwan. Front. Mar. Sci. 8:770722. doi: 10.3389/fmars.2021.770722
Received: 04 September 2021; Accepted: 29 November 2021;
Published: 15 December 2021.
Edited by:
Inna Senina, Collecte Localisation Satellites (CLS), FranceReviewed by:
Guillaume Briand, Collecte Localisation Satellites (CLS), FranceAnindya Wirasatriya, Diponegoro University, Indonesia
Copyright © 2021 Chen, Weng, Naimullah, Hsiao, Tseng, Lan and Chuang. This is an open-access article distributed under the terms of the Creative Commons Attribution License (CC BY). The use, distribution or reproduction in other forums is permitted, provided the original author(s) and the copyright owner(s) are credited and that the original publication in this journal is cited, in accordance with accepted academic practice. No use, distribution or reproduction is permitted which does not comply with these terms.
*Correspondence: Kuo-Wei Lan, a3dsYW5AbWFpbC5udG91LmVkdS50dw==