 Deguang Sun
 Xueyou Zhou
 Xue Sun
 Nianjun Xu
- Key Laboratory of Marine Biotechnology of Zhejiang Province, School of Marine Sciences, Ningbo University, Ningbo, China
With the expansion of seaweed culture and changes in the global climate, large quantities of new seaweed germplasm are urgently needed. It is important to elucidate the process of reproductive development and its regulatory mechanism in seaweed. Gracilariopsis lemaneiformis (Rhodophyta) has an essential economic and ecological value, for example, as a raw material for agar extraction and abalone feed. Here, four phases (I to IV) of G. lemaneiformis tetrasporophyte development were analyzed using physiological assays and transcriptome technologies. The results showed that photosynthetic capacity increased during the period from tetraspore formation to the release (Phase II, III and IV). According to transcriptome results, the expression levels of genes associated with light harvesting, photosynthesis, and carbon fixation pathways were significantly upregulated during tetraspore formation and release. Meanwhile, the expression levels of genes encoding starch and trehalose synthesis enzymes in starch and sucrose metabolism were enhanced during tetraspore formation and release, suggesting that G. lemaneiformis requires more energy supply during reproductive development, and that trehalose-6-phosphate may also act as a signaling molecule to induce tetraspore formation. In addition, genes encoding antioxidant enzymes (APX, TRX, GR, TR, PRX, and CAT) were significantly upregulated during tetraspore formation. These results may help us to understand the transition from nutritional to reproductive development and the molecular mechanism of G. lemaneiformis tetrasporogenesis, which is vital for the development of new germplasm and promoting the growth of the seaweed culture industry.
1. Introduction
Gracilariopsis lemaneiformis (Rhodophyta) is an economically important seaweed that is widely distributed along subtropical and temperate coasts, and the agar extracted from it is an indispensable raw material for modern industry. G. lemaneiformis contains a variety of bioactive ingredients such as polysaccharides, essential amino acids, vitamins, and dietary fiber (Liao et al., 2015; Wang et al., 2022), which have antitumor, antioxidant, and immune regulation functions and have extremely high nutritional value (Jiang et al., 2014; Kang et al., 2017; Fang et al., 2021). Additionally, G. lemaneiformis can effectively absorb carbon, nitrogen, and phosphorus from the environment and promote oxygen enrichment in the ocean. This helps oceans achieve carbon neutrality and reduces eutrophication and deoxygenation—reductions that are crucial for preserving the natural balance of oceans (Gao et al., 2021).
Similar to the majority of multicellular red algae, G. lemaneiformis has a complicated life history with a typical triphasic life cycle that includes tetrasporophyte, carposporophyte, and gametophyte phase (Garcia-Jiménez and Robaina, 2015). The outer cortical cells in the tetrasporophyte generation enlarge and transform into tetrasporangium mother cells. The mature tetrasporangia, with darker pigmentation and a diameter of more than 20 μm, are scattered over the whole surface of the algal branch; meiotic division then forms four tetraspores arranged in a cross shape, which are subsequently released to develop into female and male gametophytes after maturation (Xu et al., 2008).
Understanding macroalgal life cycles and reproduction is difficult because of the complexity and diversity of macroalgal life histories, but this understanding is crucial for maintaining and increasing population sizes as well as for sustainable seaweed exploitation (Liu et al., 2017). Past studies have focused on germ cell morphology and postfertilization development. For instance, the ultrastructure of tetrasporogenesis and carposporophyte postfertilization development have been investigated in the red algae Osmundea spectabilis and Nienburgia andersoniana, respectively (Delivopoulos, 2002; Delivopoulos, 2003). In a study of the reproductive development of G. lemaneiformis, a detailed description of the reproductive structure and fertilization process was provided (Xu et al., 2008). The optimal conditions for the development and release of G. lemaneiformis tetrasporophytes under laboratory conditions and the photosynthetic capacity of different generations of branches were also determined (Wang et al., 2010; Zhou et al., 2013). The developmental process of tetrasporophytes were divided into four phases—Phase I (immature phase), Phase II (pre-maturation phase), Phase III (fully mature phase) and Phase IV (postmaturation phase), based on the degree of epidermal cell development, and these findings have provided the background for an in-depth study of tetrasporogenesis in G. lemaneiformis (Wang et al., 2016).
RNA sequencing (RNA-seq) has become an important tool for studying phyology with the advancement of bioinformatics. Time-series transcriptomics has been utilized to investigate the molecular basis of single monospore formation and release in Phycocalida chauhanii, which provided the groundwork for identifying key genes involved in the formation of single monospores (Zhang et al., 2021). In Neopyropia yezoensis, the molecular differences between archespores and conchospores have been compared using Smart-seq2 techniques, and the molecular mechanisms driving the rapid vegetative growth of archespores have been revealed (He et al., 2021). RNA sequencing has contributed to the clarifying of the molecular mechanisms of sporulation in algae, yet few studies have been conducted relating to the molecular mechanisms of tetrasporogenesis in G. lemaneiformis.
To clarify the molecular regulatory mechanism of tetrasporogenesis in G. lemaneiformis, physiological parameters and transcriptome profiles were determined, and the changes during the transition from nutritional to reproductive growth were analyzed. The results show that photosynthesis, carbon fixation and antioxidation are closely linked to tetraspore formation. These findings provide a basis for elucidating the process and mechanism of tetrasporogenesis and for germplasm breeding.
2. Materials and methods
2.1. Algal culture and morphology observation
Wild-type G. lemaneiformis was harvested from Zhanshan Bay, Qingdao, China (36° 03′ N, 120° 22′ E) in October 2021 and transported to the laboratory on ice. In the laboratory, the thalli were washed with sterile seawater to remove sediment and epiphytes. Healthy algae were then selected and cultured for 1 week in sterile seawater enriched with Provasoli medium under the following conditions: 23°C, salinity 25, a photoperiod of 12 h light:12 h dark and a light intensity of 30 μmol photons m-2 s-1. The development of tetrasporophytes on the epidermis of the thalli was observed under light microscope and the different developmental phase of the thalli were selected for subsequent experiments according to the delimitation method of Wang et al. (2016).
2.2. Phycobiliprotein content calculation
The levels of phycoerythrin (PE) and phycocyanin (PC) were determined with reference to the method of Chen et al. (2022). Approximately 0.1 g of fresh algae was ground with liquid nitrogen and extracted with 5 ml of 50 mM phosphate-buffered saline (PBS, pH 6.8). After 2 h of reaction, the mixture was centrifuged at 8,000 ×g for 20 min, and the supernatant was analyzed using a spectrophotometer.
2.3. Chlorophyll fluorescence parameter measurement
Chlorophyll fluorescence was measured using a Photon Systems Instruments (PSI) fluorometer (AquaPen-C, Photo System Instruments, Drasov, Czechia). The actual photochemical efficiency (Fv'/Fm') and photochemical quenching coefficient (Qp) were measured after 15 min of dark adaptation. The relative electron transfer rate (rETR) was measured at different photosynthetically active radiation (PAR) levels (10, 20, 50, 100, 300, and 500 μmol photons m−2 s−1) and then the light use efficiency (LEU, α) was calculated using OriginPro 9 (OriginLab) software according to the method of Jiang et al. (2022).
2.4. Antioxidant enzyme activities and MDA content determination
For determination of superoxide dismutase (SOD), peroxidase (POD), and catalase (CAT) enzymatic activities, approximately 0.1 g of fresh seaweed was ground in liquid nitrogen, extracted in 50 mM PBS buffer (pH 7.8), and centrifuged at 8,000 ×g for 10 min and the supernatant was used to determine SOD, POD, and CAT activities by assay kits (Comin Bio, Suzhou, China) according to the manufacturer’s instructions. For the determination of malondialdehyde (MDA) content, approximately 0.1 g of fresh seaweed was ground in liquid nitrogen and extracted with trichloroacetic acid, centrifuged at 8,000 ×g for 10 min and then measured using the MDA assay kit (Jiancheng Bio, Nanjing, China).
2.5. RNA isolation and cDNA library construction
Total RNA was extracted using an RNeasy Plant Mini Kit (Qiagen, Shanghai, China) in accordance with the manufacturer’s recommendations. The quality of RNA was assessed with the Agilent Bioanalyzer 2100 (Agilent, Santa Clara, CA, United States) and quantified with the NanoDrop ND 1000 Spectrophotometer (Agilent, Santa Clara, CA, United States). Using the mRNA library preparation kit (MGIEasy™, MGI, Shenzhen, China), 12 complementary DNA (cDNA) libraries were constructed. The poly-A mRNA was isolated from total RNA by using OligodT magnetic beads, which were then cleaved into fragments with interrupted buffer. Reverse transcription was performed using random primers N6 on target RNA fragments to generate double-stranded cDNA (ds-cDNA). Then the ds-cDNA was ligated with adaptors and amplified with PCR. A single-stranded DNA library was produced by cyclizing single-stranded DNA with a bridge primer after PCR products had been heat-denatured into single strands.
2.6. Transcriptome sequencing and differentially expressed gene analysis
RNA-seq was performed on the DNA nanoball sequencing (DNBSEQ) platform at the Wuhan Genomic Institution (BGI, Shenzhen, China). Read filtering and unigene annotations were performed using SOAPnuke software (BGI, Shenzhen, China). To acquire clean reads, adaptor sequences, reads with an unknown base N content larger than 10%, and low-quality reads (bases with quality values below 15 are higher than 50% of the total number of bases) were all eliminated (Cock et al., 2010). Clean reads were mapped with the reference transcript using Bowtie2 (Langmead and Salzberg, 2012) and gene and transcript expression values were determined using RNA-Seq by Expectation Maximization (RSEM) (Dewey and Bo, 2011). With the DESeq method, differentially expressed genes (DEGs) were identified, and genes with adjusted p values for false discovery rate (FDR, q-values) ≤0.001 and Log2 (fold change) ≥1 were identified. Kyoto Encyclopedia of Genes and Genomes (KEGG) Orthology-Based Annotation System (KOBAS) 2.0 was used to produce a corrected p value, which was the Q value (Mao et al., 2005). All DEGs were analyzed using Gene Ontology (GO) and the KEGG databases. Significant enrichment was determined for the GO terms and enrichment analysis with a Q value of 0.05.
2.7. Verification of RNA-seq data by quantitative real-time PCR
To validate the RNA-seq results, eight genes were randomly chosen for quantitative real-time PCR (qRT‐PCR). Following the manufacturer’s instructions, single-stranded cDNA was synthesized by reverse transcription using the Perfectstart Uni RT & qPCR Kit (TransGen, Beijing, China). On an ABI7500 qRT‐PCR System (Applied Biosystems, Foster City, CA, United States), qPCR was carried out using a reaction system of 20 μl of PerfectStart Green qPCR SuperMix (TransGen, Beijing, China). The relative expression levels of genes were calculated using the 2−ΔΔCT method with the β-actin gene as the respective reference gene using three separate biological replicates. The qRT-PCR primers are listed in Supplementary Table 1.
2.8. Statistical analysis
The data are provided as the mean and standard deviation and were analyzed by Statistical Product and Service Solutions (SPSS) 22.0 software. Additionally, the data were assessed using one-way analysis of variance (ANOVA) and Duncan’s multiple range test, with a significance threshold of 0.05.
3. Results
3.1. Morphological changes during tetraspore formation
Previous studies have divided the G. lemaneiformis process of tetraspore formation and release into four phases based on the state of the tetrasporangium (Wang et al., 2016). In this study, microscopic observation of epidermal cells was used to determine the developmental stage of the thalli (Figure 1). Phase I was the immature phase, where the epidermal cells were closely arranged, the tetrasporangium had not yet begun to form, and all thalli that had not developed reproductively were in this stage (Figure 1A). Phase II was the prematuration phase, when a large number of tetrasporangia cells began to form but had not yet started to released tetraspores, and was a process that lasts for approximately two weeks (Figure 1B). Phase III was the full maturation phase, when tetraspores began to be released, leaving a large number of holes on the surface of the thalli; this was a process that lasts for approximately two weeks (Figure 1C). Phase IV was the postmaturation phase, when the release of the tetraspores was complete and a large number of holes remained on the surface of the thalli, this stage lasted for approximately four weeks (Figure 1D). The thalli whose surfaces matched the characteristics from Phase I (no tetrasporangium), Phase II (tetrasporangium formed but not tetraspores released), Phase III (approximately 50% of tetraspores released and a large number of holes left behind) and Phase IV (completion of tetraspore release and a large number of holes left behind) were selected for subsequent experiments.
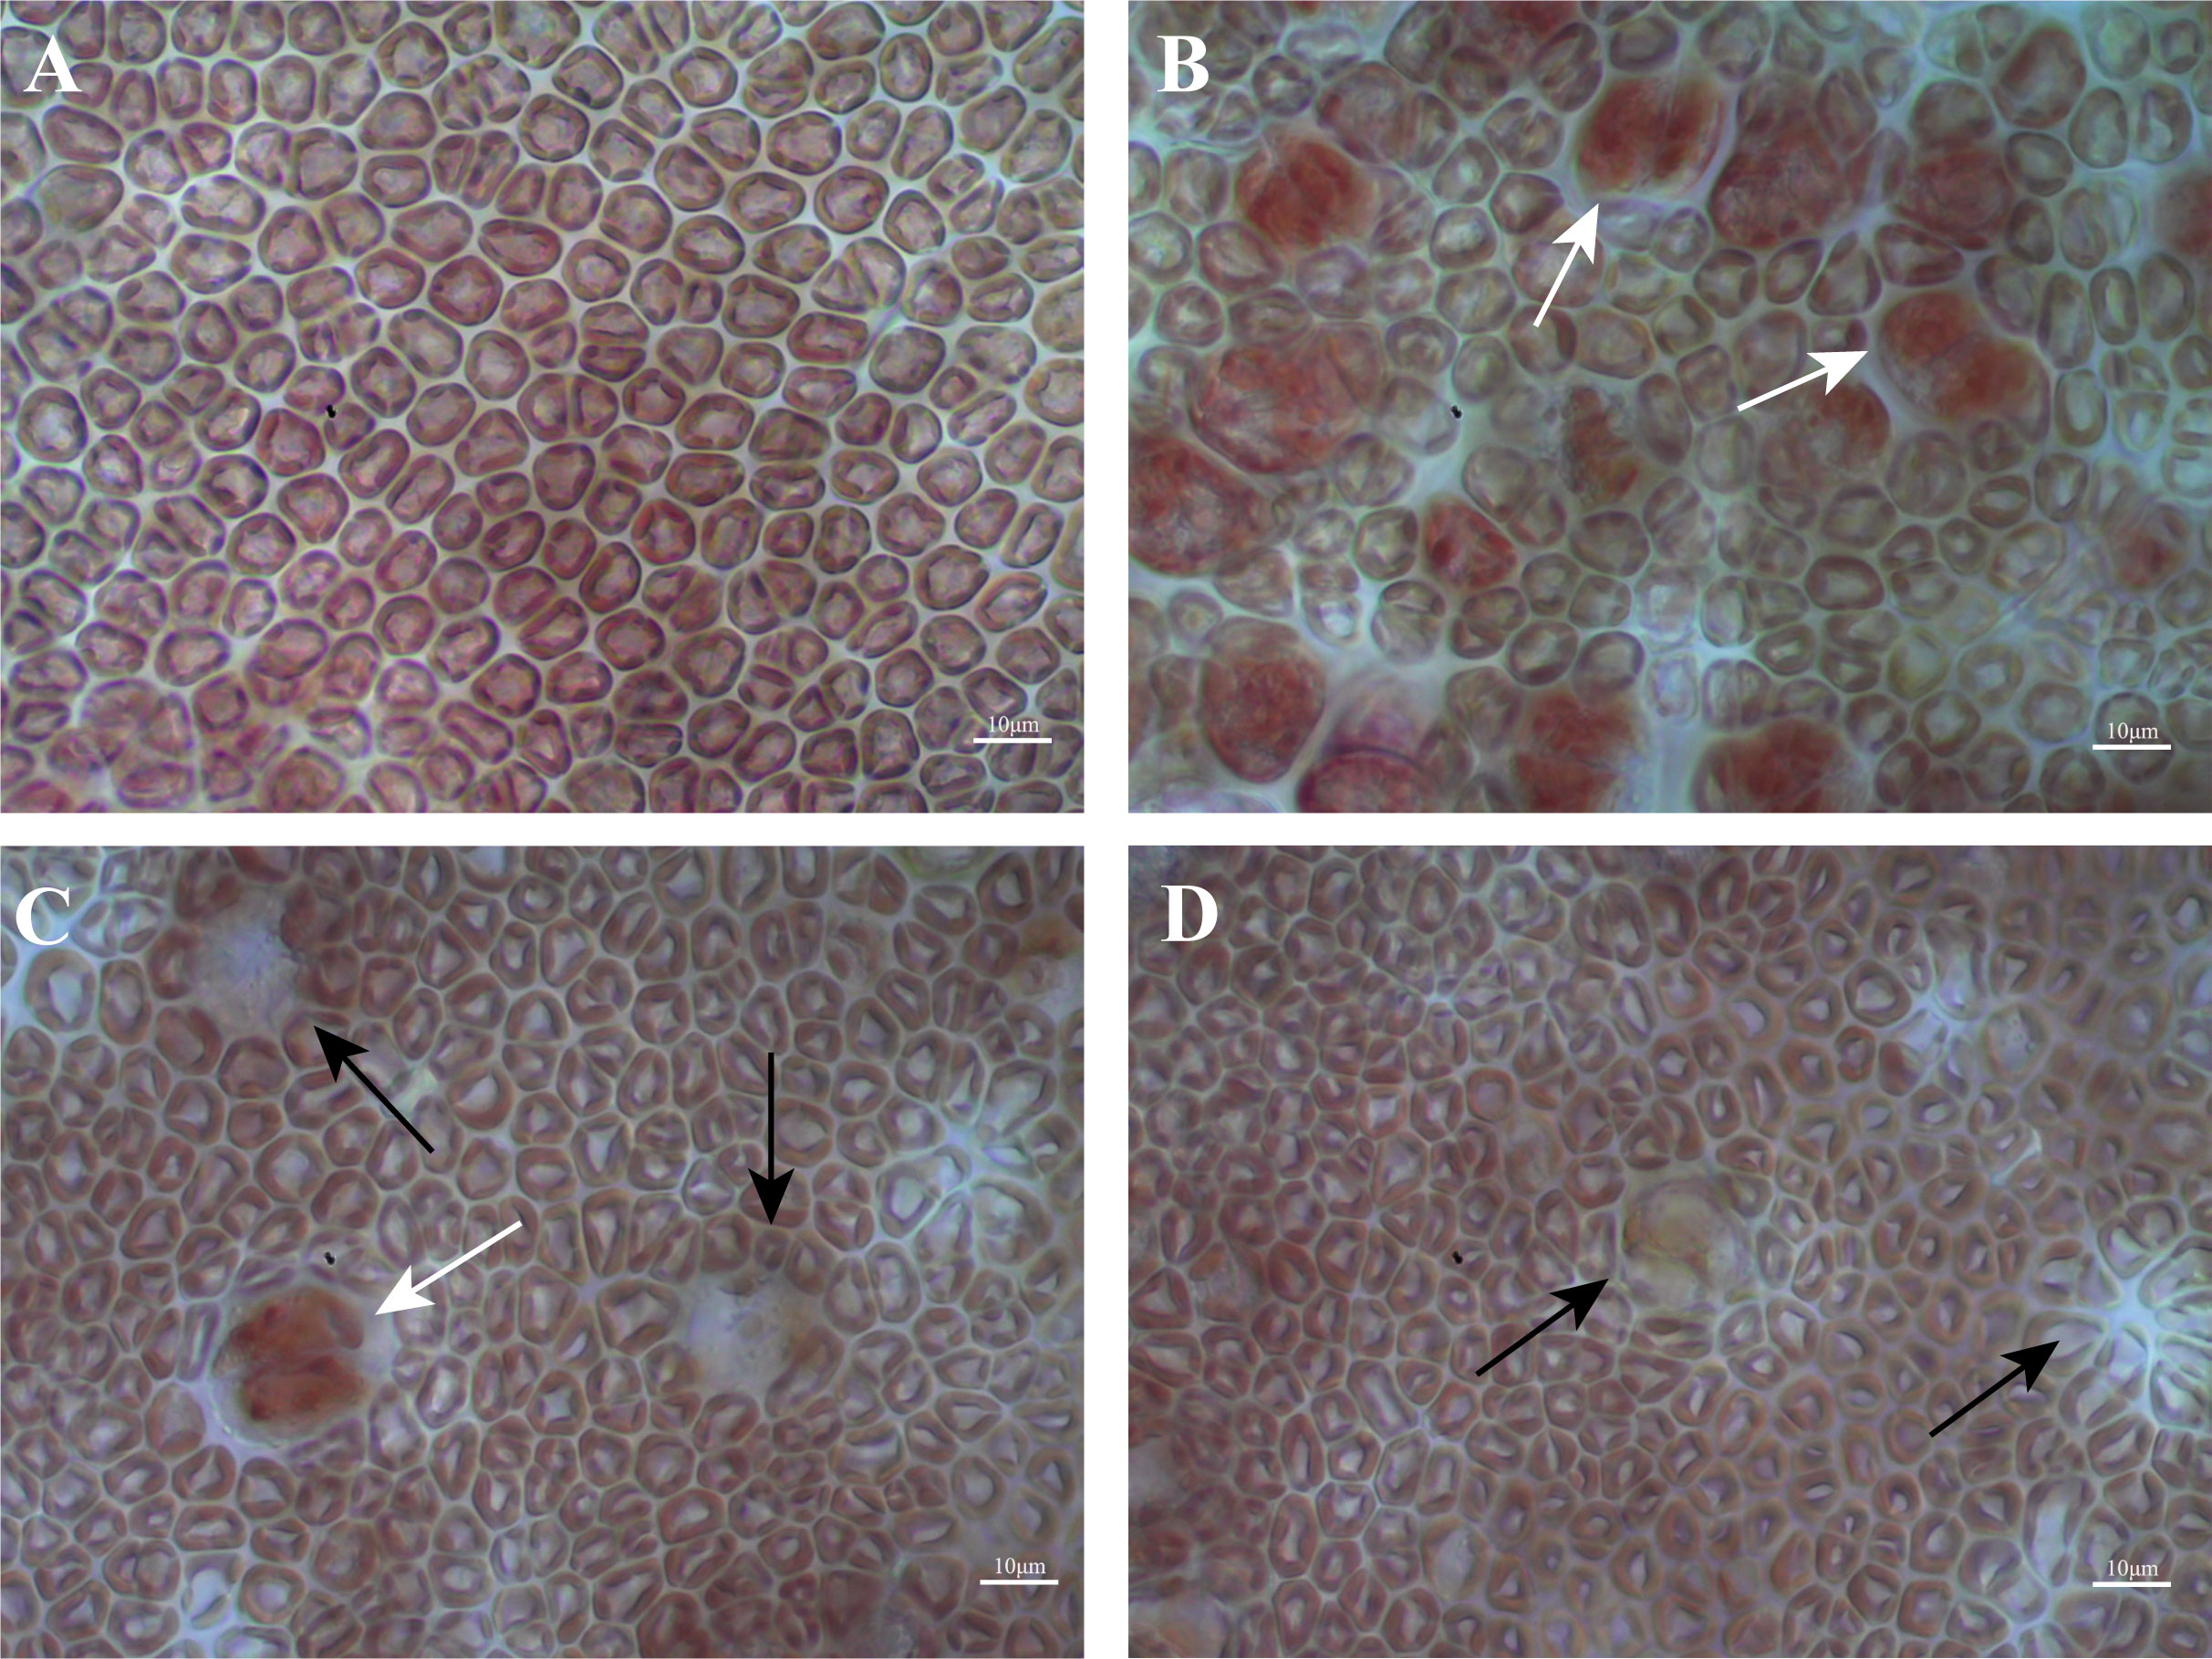
Figure 1 Four phases in the development of the tetrasporangium of G. lemaneiformis. (A) Phase I; (B) Phase II; (C) Phase III; (D) Phase IV. Scale bars represent 10 μm. The red arrows indicate tetrasporangium, white arrows indicate holes left after tetraspore release.
3.2. Changes in phycobiliprotein levels and chlorophyll fluorescence parameters
To investigate the changes in photosynthesis during tetraspore formation, we measured phycobiliprotein levels and chlorophyll fluorescence parameters during the four phases. The results showed that the PE content was higher in Phase IV than in Phases I, II and III (Figure 2A), and that the PC content was not different among the four phases (Figure 2B). The actual electron photosynthetic efficiency (Fv’/Fm’) was markebly increased in Phases II and IV compared to the Fv’/Fm’ in Phase I, yet it did not change in Phase III (Figure 2C). This indicates enhanced photosynthesis with the development of tetrasporophyte formation. The trends in Qp and Fv’/Fm’ were consistent across the four phases, but the differences were not significant in Phases II and IV (Figure 2D). It is possible that increased light loss during photosynthesis was the cause of the opposite trend in α, which was decreased in Phases II and IV (Figure 2E).
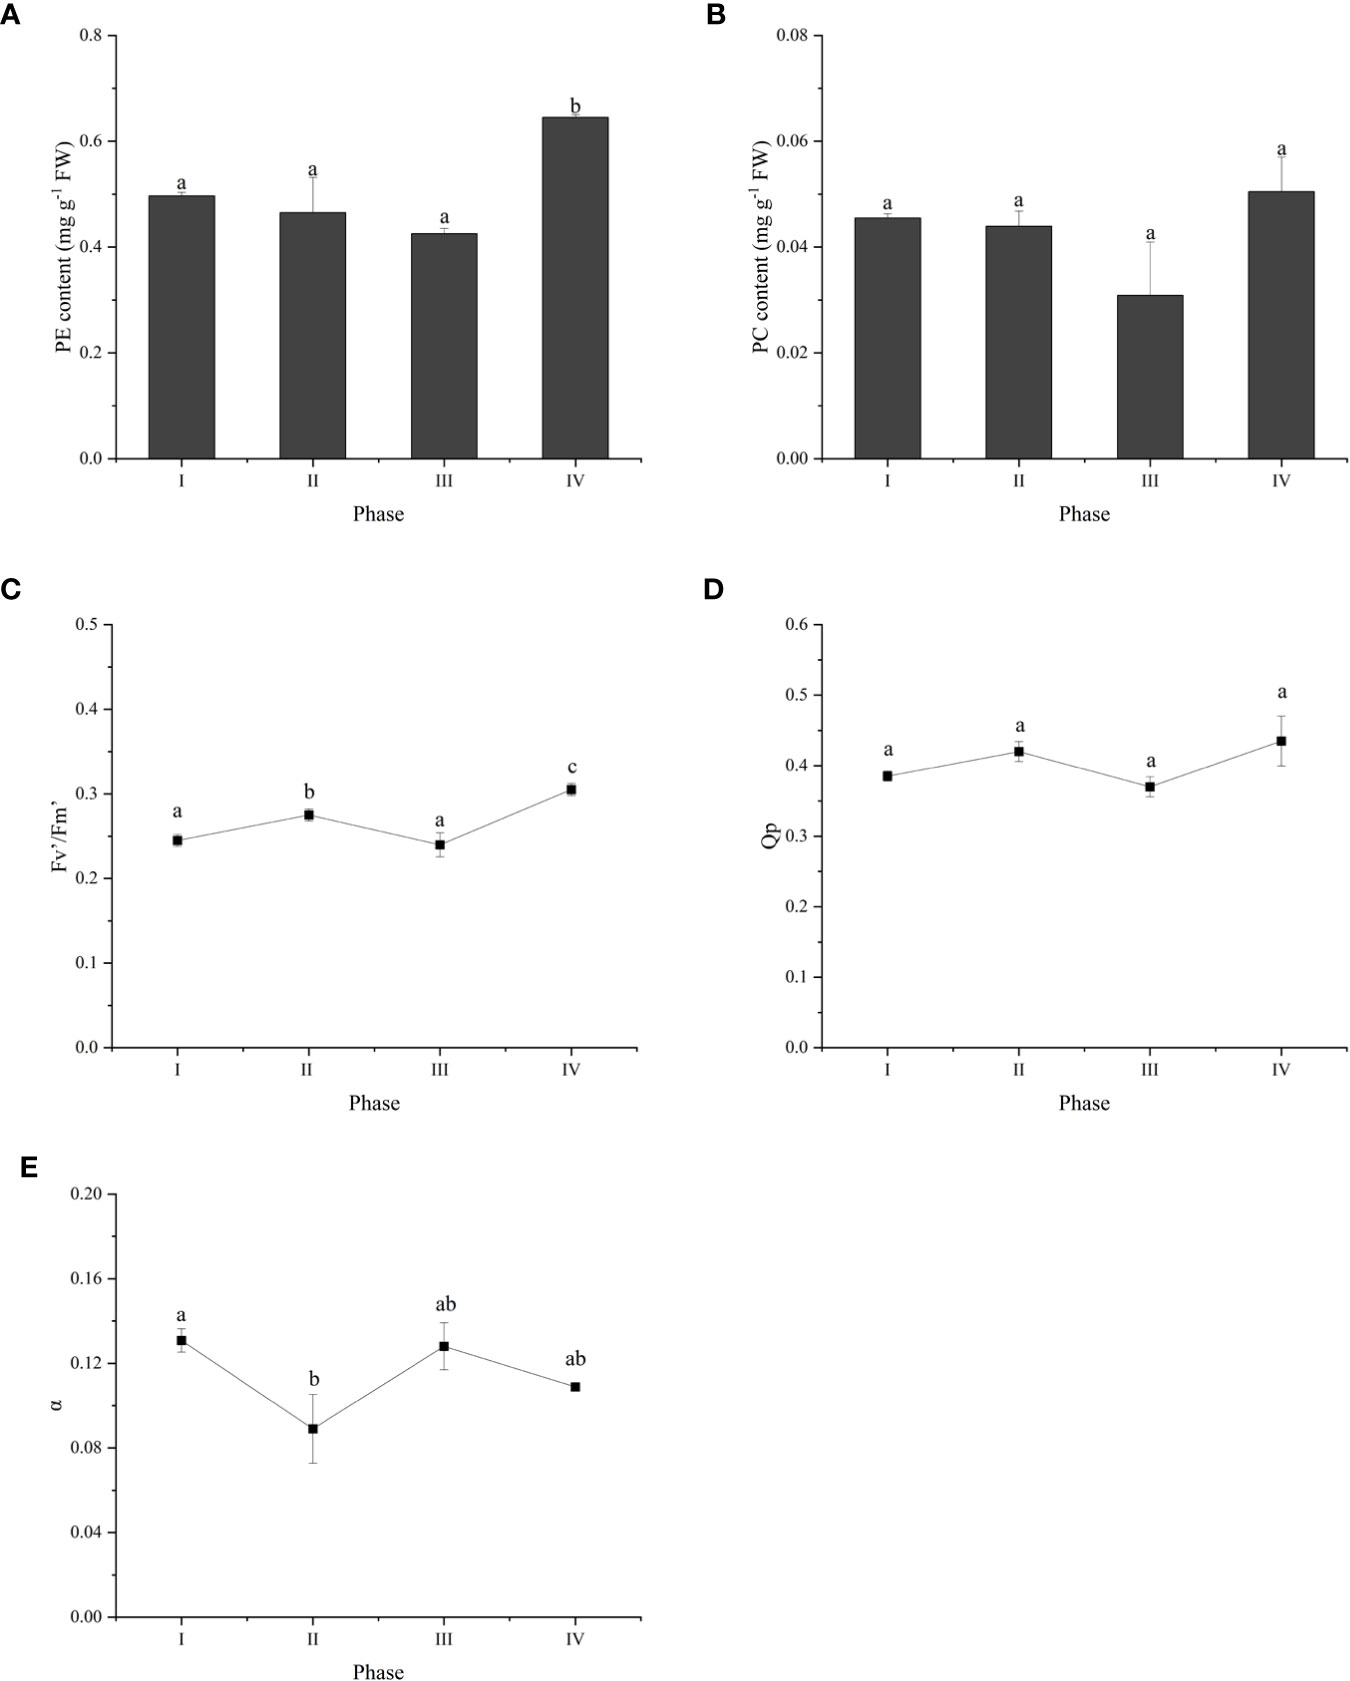
Figure 2 Overview of photosynthetic physiology parameters during tetraspore formation in G. lemaneiformis. (A) PE content; (B)PC content; (C) Fv’/Fm’; (D) Qp; (E) α. Different letters indicate significant differences (p < 0.05).
3.3. Antioxidant enzyme activities and MDA content
To investigate the thallus response to reactive oxygen species (ROS) during tetraspore formation, the changes in the activities of three antioxidant enzymes were examined. The results showed that SOD activity was activated, with 63.1%, 24.3% and 34.9% higher activity in Phases II, III and IV, respectively, than in Phase I (Figure 3A). POD activity was increased by 39.1% and 49.0% in Phases III and IV, respectively (Figure 3B). The CAT activity significantly increased in Phase IV, while there was no change from Phases I to III (Figure 3C). Meanwhile, compared to Phase I, Phases II to IV had significantly increased MDA content (Figure 3D). These results suggest that tetraspore formation and release in G. lemaneiformis are related to oxidative stress.
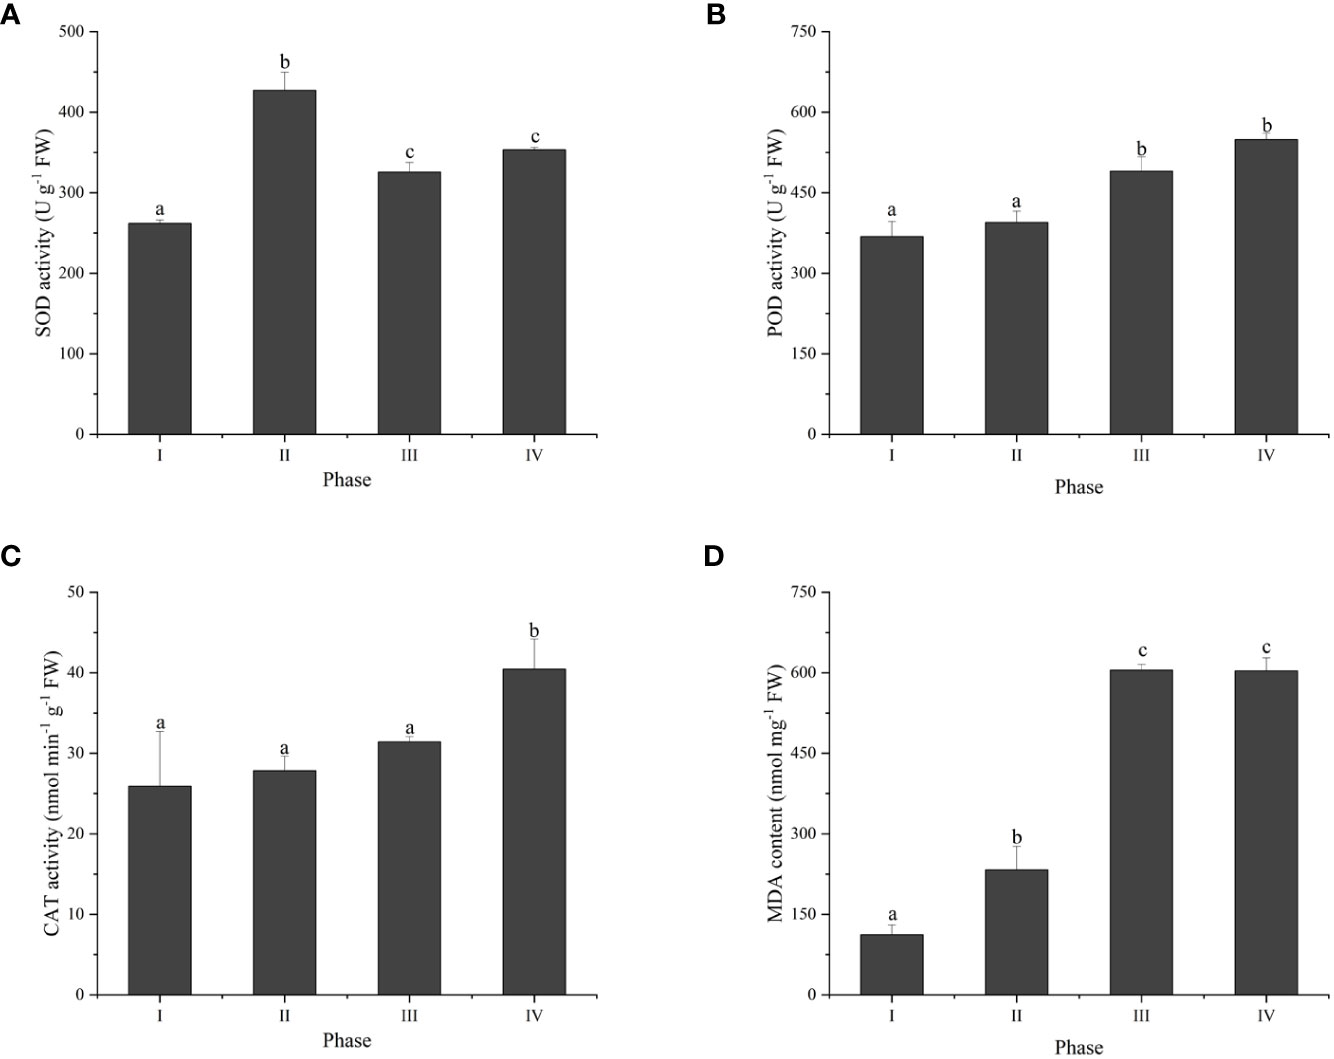
Figure 3 The antioxidant activity and MDA content in different phases of tetraspore formation in G. lemaneiformis. (A) Superoxide dismutase (SOD) activities; (B) Peroxidase (POD) activities; (C) Catalase (CAT) activities; and (D) MDA content. Data presented are the means ± SDs from three independent experiments, and different letters indicate a significant difference (p < 0.05).
3.4. Transcriptome de novo assembly and gene functional annotation
To elucidate the molecular mechanism of tetraspore formation in thalli, RNA-seq analysis was carried out on the thalli of four phases of G. lemaneiformis tetraspore formation. Using the Beijing Genomics Institute Sequencing (BGISEQ) platform to analyze the RNA samples, it was found that a total of 12 samples generated clean reads between 21.61 and 21.69 after data filtering. Additionally, 41,099 unigenes were obtained in total. Supplementary Table S2 provides details on the transcriptome sequencing and de novo assembly of the 12 samples. All the assembled unigenes were searched by the Basic Local Alignment Search Tool (BLAST) against the public KEGG, GO, Non-Redundant (NR), Nucleotide (NT), SwissProt, Protein Family (Pfam), and Eukaryotic Orthologous Groups (KOG) databases with an E-value threshold of 10-5. Among the 40,997 unigenes annotated in at least one database, 25,510 unigenes were annotated throughout all databases (Supplementary Table S3).
3.5. Identification and validation of differentially expressed genes
Principal component analysis (PCA) was performed to describe transcriptome differences at different developmental phases, and Phases I, II, and IV could be clearly separated from each other, while there was partial overlap between Phases II and III, indicating that Phase II and III were relatively close in development (Figure 4A). The four phases of G. lemaneiformis development were examined using the transcriptome. The results revealed that a total of 10947 unigenes, including 6069 upregulated and 4878 downregulated unigenes, were differentially expressed between Phase I and II. Between Phase II and III, 7124 unigenes showed differential expression, including 3928 upregulated and 3196 downregulated unigenes. There were 12154 unigenes between Phases III and IV, including 6547 upregulated and 5607 downregulated genes (Figures 4B-D). In addition, between Phase I and Phase III/IV, there were 11386/14744 unigenes (Supplementary Figure 1). Eight unigenes were randomly chosen from the DEGs for RT‐PCR analysis in order to confirm the accuracy of the RNA-seq results. The expression patterns of these eight unigenes were largely in agreement with the RNA-seq results (Supplementary Figure 2).
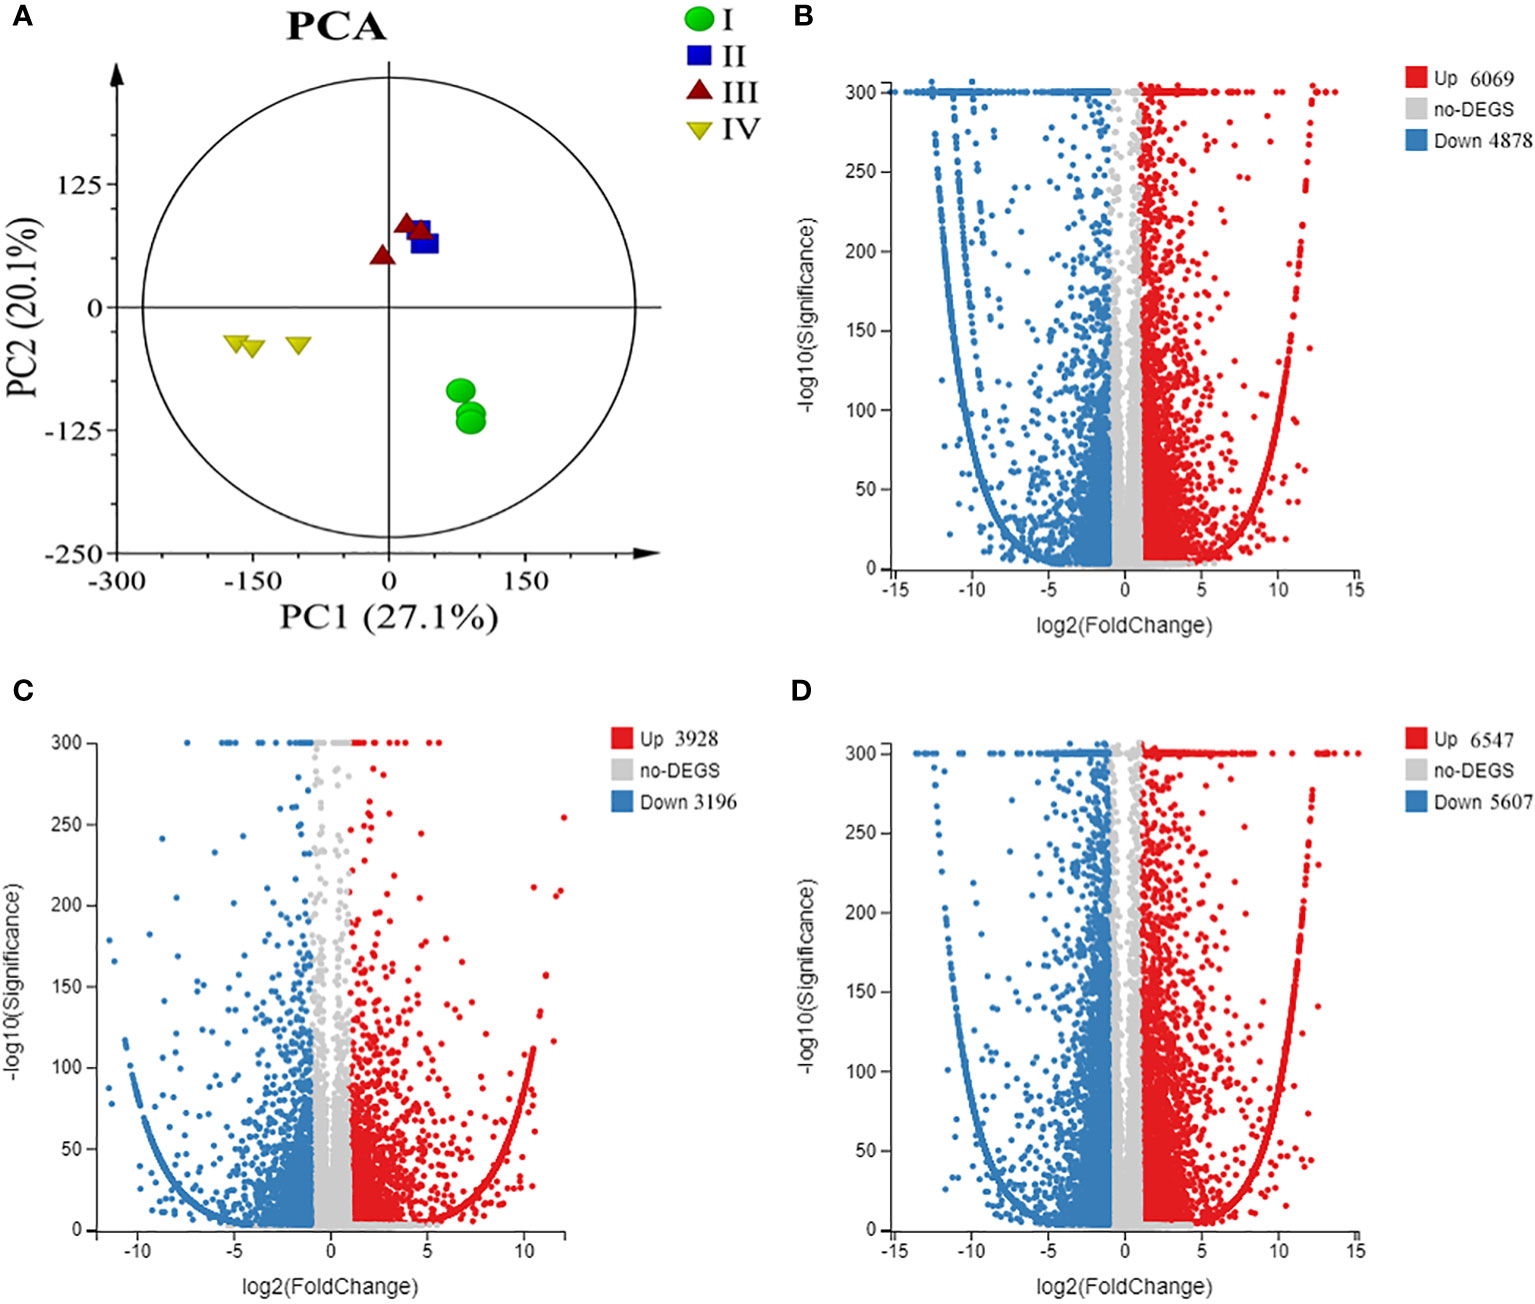
Figure 4 Overview of transcriptome changes in tetraspore formation of G. lemaneiformis. (A) Principle component analysis (PCA) of transcriptome of G. lemaneiformis; (B) Volcano map of differentially expressed genes (DEGs) between Phase I and Phase II; (C) Volcano map of DEGs between Phase II and Phase III; (D) Volcano map of DEGs between Phase III and Phase IV.
3.6. Enrichment analysis of differentially expressed genes
GO analysis showed that these differentially expressed genes were annotated into three main functional categories—molecular function, cellular component and biological process—with the majority classified as cellular anatomical entity, catalytic activity, binding, cellular process and metabolic process. The KEGG classification showed that DEGs were mainly classified into global and overview maps, carbohydrate metabolism, translation, folding, sorting and degradation, amino acid metabolism, transcription and transport and catabolism (Supplementary Figure 3).
GO and KEGG enrichment analyses were carried out to analyze the function of the DEGs, and GO enrichment showed that in the comparison between Phases I and II, the processes in which the DEGs were significantly enriched were those related to photosynthesis light harvesting, carbohydrate metabolic process and the membrane. In the comparison between Phases II and III, the processes in which the DEGs were significantly enriched were response to oxidative stress, reactive oxygen species metabolic process and cytochrome complex assembly. In the Phase III and IV comparison, the processes in which the DEGs were significantly enriched were photosynthesis, photosynthesis light harvesting, photosynthesis light reaction, and signaling. Overall, the GO enrichment analysis of the DEGs showed that they were primarily associated with photosynthesis, carbon metabolism and oxidative stress. Correspondingly, KEGG enrichment analysis was also carried out, and between Phases I and II, the processes in which the DEGs were significantly enriched were those related to photosynthesis-antenna proteins, carbon fixation in photosynthetic organisms, carbon metabolism and starch and sucrose metabolism pathways. In Phase III and IV, the processes in which the DEGs were significantly enriched were those involved in photosynthesis-antenna proteins, alpha-linolenic acid metabolism, linoleic acid metabolism and starch and sucrose metabolism. There was no pathway of enrichment between Phase II and III (Figure 5).
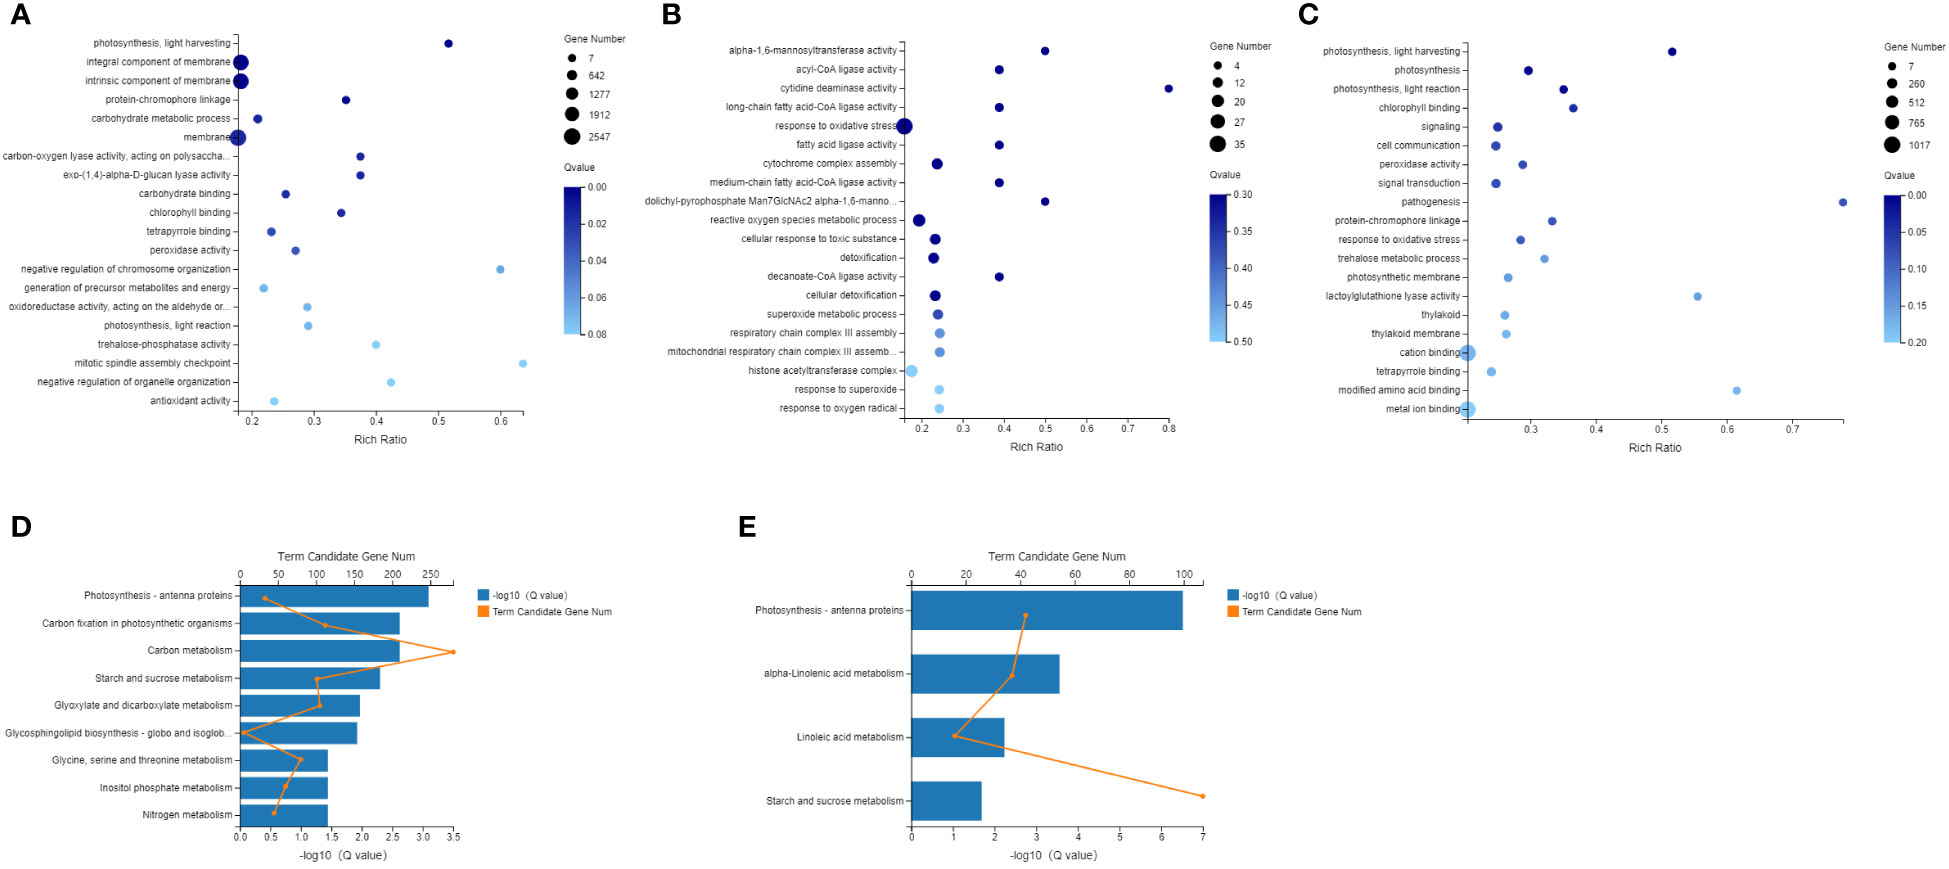
Figure 5 Enriched GO terms and KEGG pathway of differentially expressed genes (DEGs) (A) Enriched GO terms of DEGs, Phase II vs Phase I; (B) Enriched GO terms of DEGs, Phase III vs Phase II; (C) Enriched GO terms of DEGs, Phase IV vs Phase IIII; (D) Enriched KEGG pathways of DEGs, Phase II vs Phase I; (E) Enriched KEGG pathways of DEGs, Phase IV vs Phase III.
37. Functional analysis of differentially expressed genes
3.7.1. DEGs involved in photosynthesis
Red algae can collect light energy more effectively due to the existence of both phycobilisomes and light-harvesting complexes (LHCs), which function as light-trapping antenna proteins for photosynthesis (Bhattacharya et al., 2013). Compared to Phase I, Phases II and IV had upregulated DEGs involved in the formation of the phycobilisomes. Among the DEGs, those encoding phycocyanobilin lyase subunit alpha (CpcE) were upregulated in two phases, while those encoding allophycocyanin beta subunit (ApcB), phycobilisome core linker protein (ApcC) and phycocyanin-associated rod linker protein (CpcC) were only upregulated in Phase IV. Light-harvesting chlorophyll protein complex I (LHCI) consists of the light-harvesting complex I chlorophyll a/b binding protein 1-4 (Lhca1-4) (Lokstein et al., 2021). Compared to Phase I, Phases II, III, and IV had upregulated DEGs encoding Lhca1 and Lhca4; moreover, these DEGs were expressed at higher levels in Phase IV than in Phases II and III (Figure 6A, Supplementary Table S4). Interestingly, Lhca1/4 can form dimers in plants that can produce the characteristic long-wavelength fluorescence emission of plant photosystem I (PSI) at low temperatures (Croce and van Amerongen, 2013).
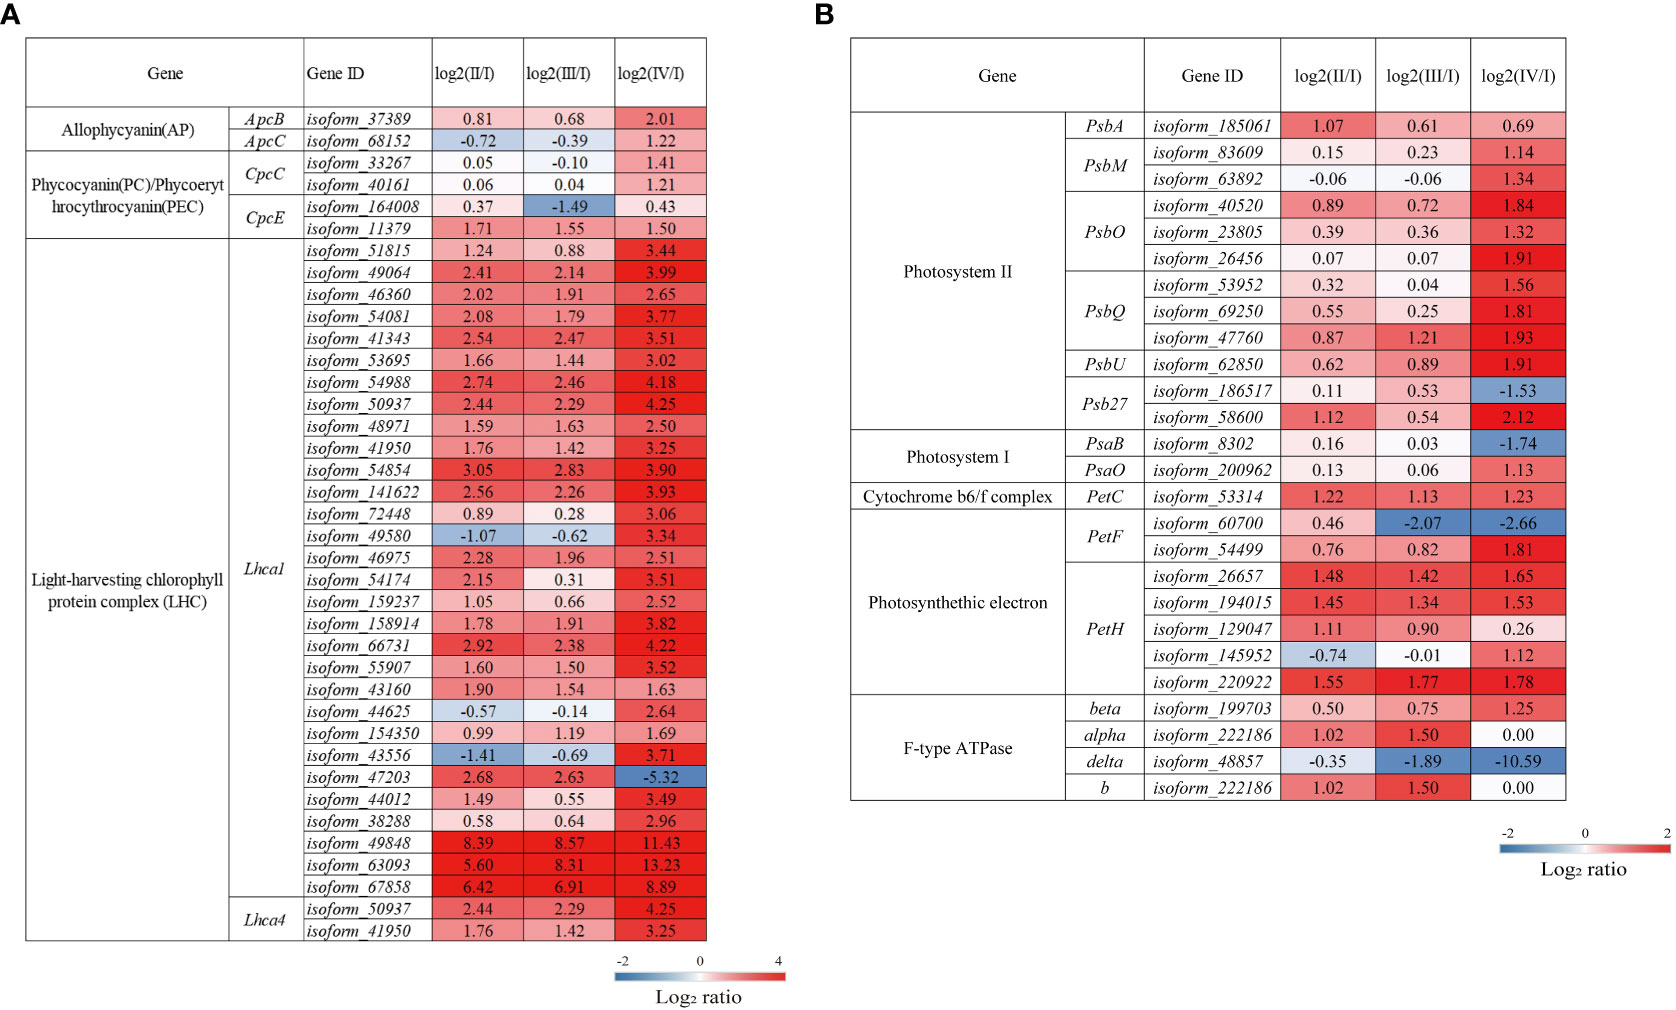
Figure 6 The transcriptomic changes in genes associated with photosynthesis-antennal proteins. (A) and photosynthesis (B) in the tetraspore formation of G. lemaneiformis between different phases. Red and blue gradients indicate the upregulation and downregulation of unigenes with the adjusted p value <0.001 and |log2ratio| > 1, separately, while white represents no significant difference.
The photosynthetic electron transport chain consists of a series of reaction center complexes, including photosystems I/II, the cytochrome b6/f complex, photosynthetic electron transport, and F-type ATP synthase. As shown in Figure 6B and Supplementary Table S4, most of the DEGs encoding photosynthetic reaction complexes were upregulated in Phases II, III, and IV. The DEGs associated with photosystem II (PSII) encoding the PII P680 reaction center D1 protein (PsbA), an essential component of the PSII electron transport core (Cardona et al., 2018), were significantly upregulated in Phase II. DEGs encoding PSII PsbM protein (PsbM), PSII oxygen-evolving enhancer protein 1 (PsbO) and protein 2 (PsbQ) are significantly upregulated at Phase IV, PsbM functions to ensure the formation and stabilization of PSII dimers (Kawakami et al., 2011). PsbO and PsbQ are involved in the release of oxygen and electron donors during photosynthesis (Kentaro and Takumi, 2016; Zhang et al., 2017) and play an important role in stabilizing the structure of the PSII light-harvesting complex (LHC) II supercomplex in higher plants (Ifuku et al., 2011). In the cytochrome b6/f complex and in photosynthetic electron transport, DEGs encoding the cytochrome b6/f complex iron-sulfur subunit (PetC) and ferredoxin-NADP+ reductase (PetH) are significantly upregulated in Phases II, III, and IV; the electron transport chain forms most of the DEGs involved in the formation of the F-type ATPase, which were also significantly upregulated in these three phases and ultimately affects the synthesis of ATP (Davis and Kramer, 2020). Overall, the results suggest that photosynthesis is enhanced during tetraspore formation Phases II to IV, with the most pronounced effects found in Phase IV in G. lemaneiformis.
3.7.2. DEGs involved in carbon and carbohydrate metabolism
Significant enrichment in carbon metabolism during G. lemaneiformis tetraspore formation was observed, mainly in the following KEGG pathways: carbon fixation in photosynthetic organisms, sucrose and starch synthesis, and biosynthesis of amino acids (Figure 5). Compared to Phase I, Phases II, III and IV had significantly upregulated DEGs encoding rubisco (rbcL), phosphoglycerate kinase (PGK), glyceraldehyde-3-phosphate dehydrogenase (NADP+) (GAPA), fructose-bisphosphate aldolase (ALDO), fructose-1,6-bisphosphatase (FBP), transketolase (tktA), sedoheptulose-bisphosphatas, ribose-5-phosphate isomerase A (rpiA) and phosphoribulokinase (PRK) in the photosynthetic carbon fixation pathway were significantly upregulated in Phase II, III and IV compared to Phase I. In addition, DEGs encoding PGK, ALDO, FBP, rpiA, and PRK had lower levels of expression in Phase IV than in Phase II and III, and their carbon assimilation efficiency may have been lower than in Phases II and III (Figure 7, Supplementary Table S5). Overall, there was an increase in CO2 fixation and glyceraldehyde-3-phosphate synthesis during the process of tetraspore formation and release.
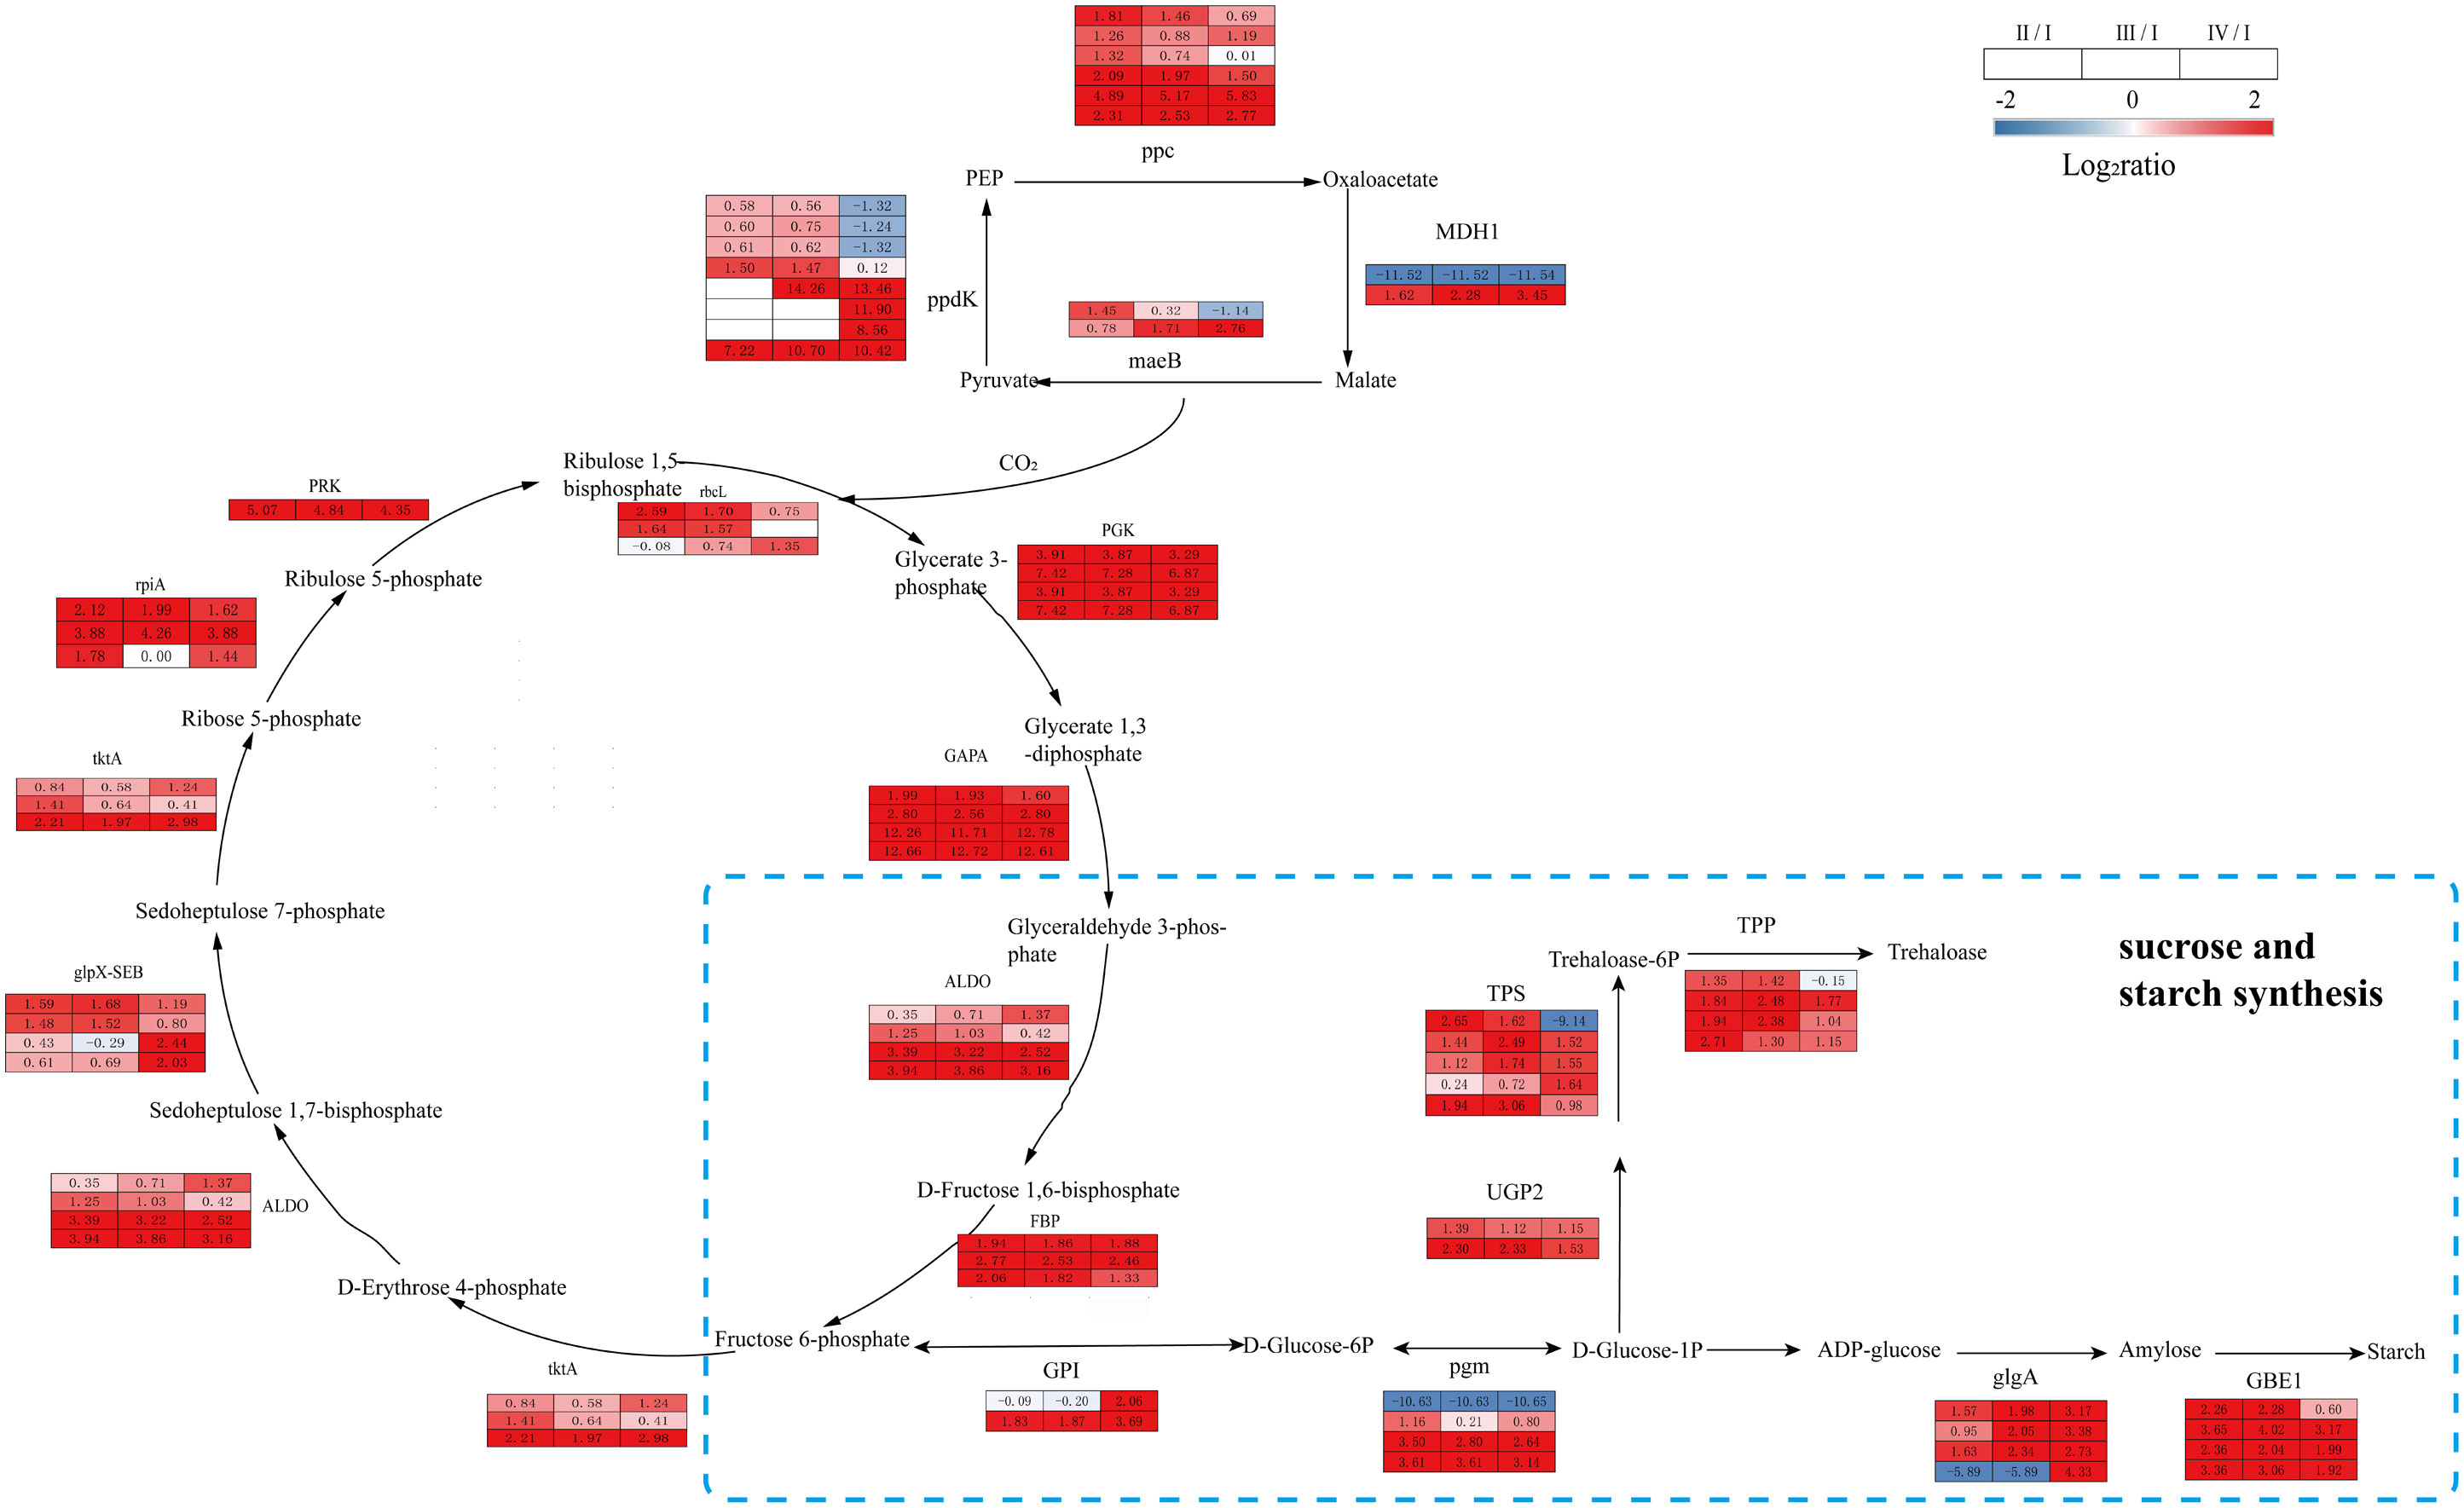
Figure 7 The transcriptomic changes with carbon fixation metabolism and sucrose and starch synthesis in the tetraspore formation of G. lemaneiformis between different phases. Red and blue gradients indicate the upregulation and downregulation of unigenes with the adjusted p value <0.001 and |log2ratio| > 1, separately, while white represent no significant difference.
Glyceraldehyde-3-phosphate is a raw material for glycolysis; moreover, the fructose-6-phosphate produced is precursor for further anabolism such as starch synthesis (Tamminen et al., 2018). The gene expression levels of phosphoglucomutase (pgm), starch synthase (glgA), and 1,4-alpha-glucan branching enzyme (GBE1), which are involved in starch synthesis, were consistently upregulated in Phases II, III, and IV. In addition, the expression of the genes encoding UTP-glucose-1-phosphate uridylyltransferase (UGP2), trehalose-6-phosphate synthase (TPS) and trehalose-6-phosphate phosphatase (TPP) was consistently upregulated in Phases II, III, and IV (Figure 7, Supplementary Table S5). DEGs were also consistently upregulated at these three phases. This implies a possible accumulation in the starch and trehalose content. As the main energy substance of the plants, starch provides sufficient energy for tetraspore formation and release. The synthetic precursor of trehalose, trehalose-6-phosphate (T6P), is an important signaling molecule in plants (Fichtner et al., 2020), and the TPS gene that catalyzes its synthesis can induce its transition from vegetative development to reproductive development in Arabidopsis thaliana (Dijken et al., 2004). Increased expression of the TPS gene indicates that trehalose and its signaling pathway are actively involved in the development of tetraspores.
The DEGs for amino acids synthesis in different phases revealed in the present study are shown in Supplementary Table S6. Compared to Phase I, Phases II through IV had, respectively, 13 (11 upregulated), 12 (11 upregulated), and 18 (11 upregulated) DEGs that were involved in the generation of histidine (His) from fructose-6-phosphate. Glycerate-3P from glycolysis can synthesize glycine (Gly) and serine (Ser), and there were 12 (8 upregulated), 9 (5 upregulated) and 17 (11 upregulated) DEGs involved in this process in Phases II, III and IV respectively. Additionally, 16 (15 upregulated), 14 (11 upregulated) and 14 (10 upregulated) DEGs were involved in the conversion of pyruvate to glutamate (Glu), glutamine (Gln) and ornithine (Orn) in Phase II, III and IV, respectively. In addition, DEGs were upregulated in Phases II, III and IV during the conversion of oxaloacetate to aspartic acid (Asp) and asparagine (Asn). In conclusion, the expression levels of most of the genes for the synthesis of Asp, Asn, Gly, Ser, Glu, Gln, His, and Orn were significantly promoted in Phase II, III, and IV.
3.7.3. DEGs involved in antioxidant system
Transcriptome analysis revealed that DEGs encoding antioxidant enzymes were significantly altered during tetrasporophyte development. Relatived to Phase I, Phase II had significantly upregulated DEGs encoding ascorbate peroxidase (APX,1 upregulated), peroxiredoxin (PRX, 11 upregulated, 3 down regulated), thioredoxin (TRX, 1 upregulated), glutathione reductase (GR, 4 upregulated), CAT (2 upregulated) and thioredoxin reductase (TR, 1 upregulated) were significantly upregulated in Phase II. DEGs encoding APX (1 upregulated), PRX (6 upregulated, 1 down regulated), TRX (1 upregulated), GR (2 upregulated) and CAT (3 upregulated) were significantly upregulated in Phase III. The expression of DEGs encoding APX (3 upregulated, 2 down regulated), peroxiredoxin (PRX, 10 upregulated, 2 down regulated), TRX (8 upregulated, 1 down regulated) and GR (3 upregulated) was higher in Phase IV. However, SOD and POD showed different expression patterns in the 3 phases (Figure 8, Supplementary Table S7). These data suggest that most genes encoding antioxidant enzymes were significantly upregulated in Phases II, III, and IV.
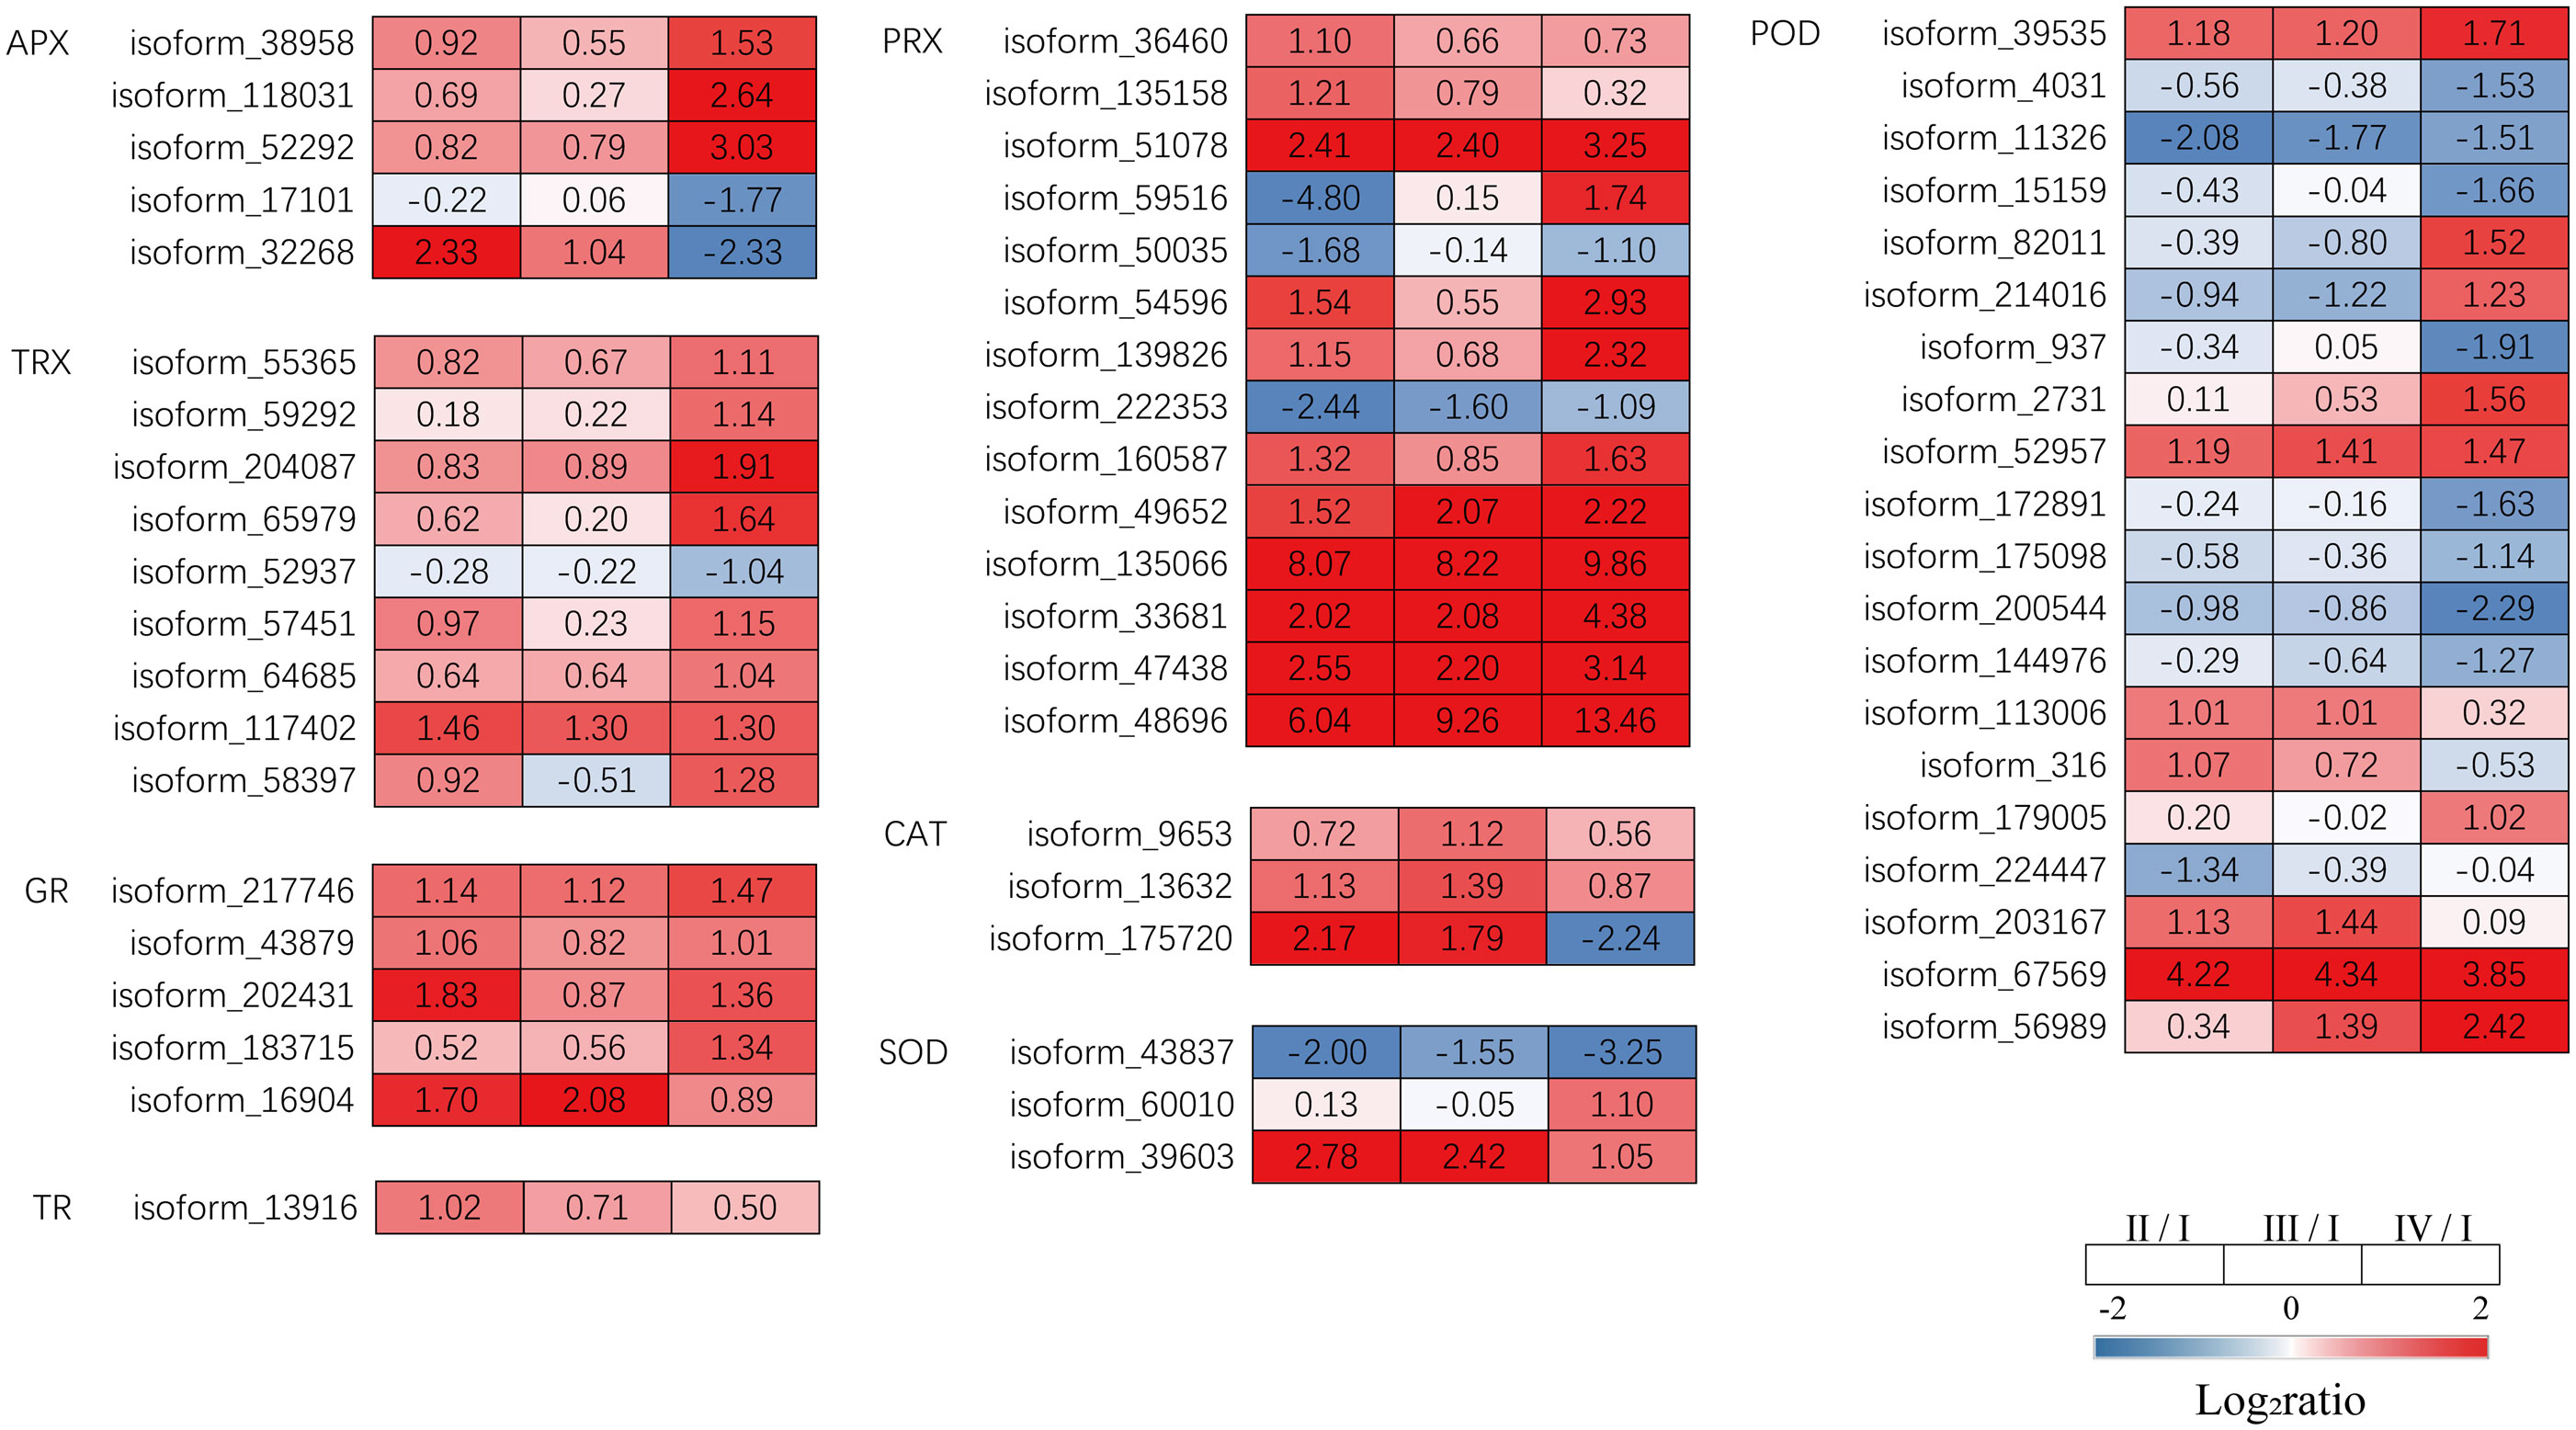
Figure 8 The transcriptomic changes with the antioxidant system in the tetraspore formation of G. lemaneiformis between different phases. Red and blue gradients indicate the upregulation and downregulation of unigenes with the adjusted p value<0.001 and |log2ratio|>1, separately, while white represent no significant difference.
3.7.4. DEGs involved in riboflavin synthesis
Riboflavin plays an important role in plant growth and development and is a precursor to a variety of essential cofactors for metabolic processes. In this study, genes involved in the riboflavin biosynthetic pathway were upregulated in Phases II, III, and IV. These genes included DEGs encoding GTP cyclohydrolase II/3,4-dihydroxy 2-butanone 4-phosphate synthase (ribBA), 5-amino-6 (5-phospho-D-ribitylamino) uracil phosphatase (PYRP2), 6,7-dimethyl-8-ribityllumazine synthase (ribH), and 6,7-dimethyl-8-ribityllumazine synthase (ribE). RibBA has both GTP cyclic hydrolase and dihydroxybutyrone phosphate synthase activities and can catalyze the synthesis of riboflavin from GTP and ribonucleoside 5-phosphate. The DEGs encoding ribBA, PYRP2 and ribH were upregulated in Phases II and III compared to Phase I and were upregulated in Phase IV in ribBA and ribE (Figure 9, Supplementary Table S8). The above results suggest that riboflavin may be involved in the formation and release of G. lemaneiformis tetraspores.
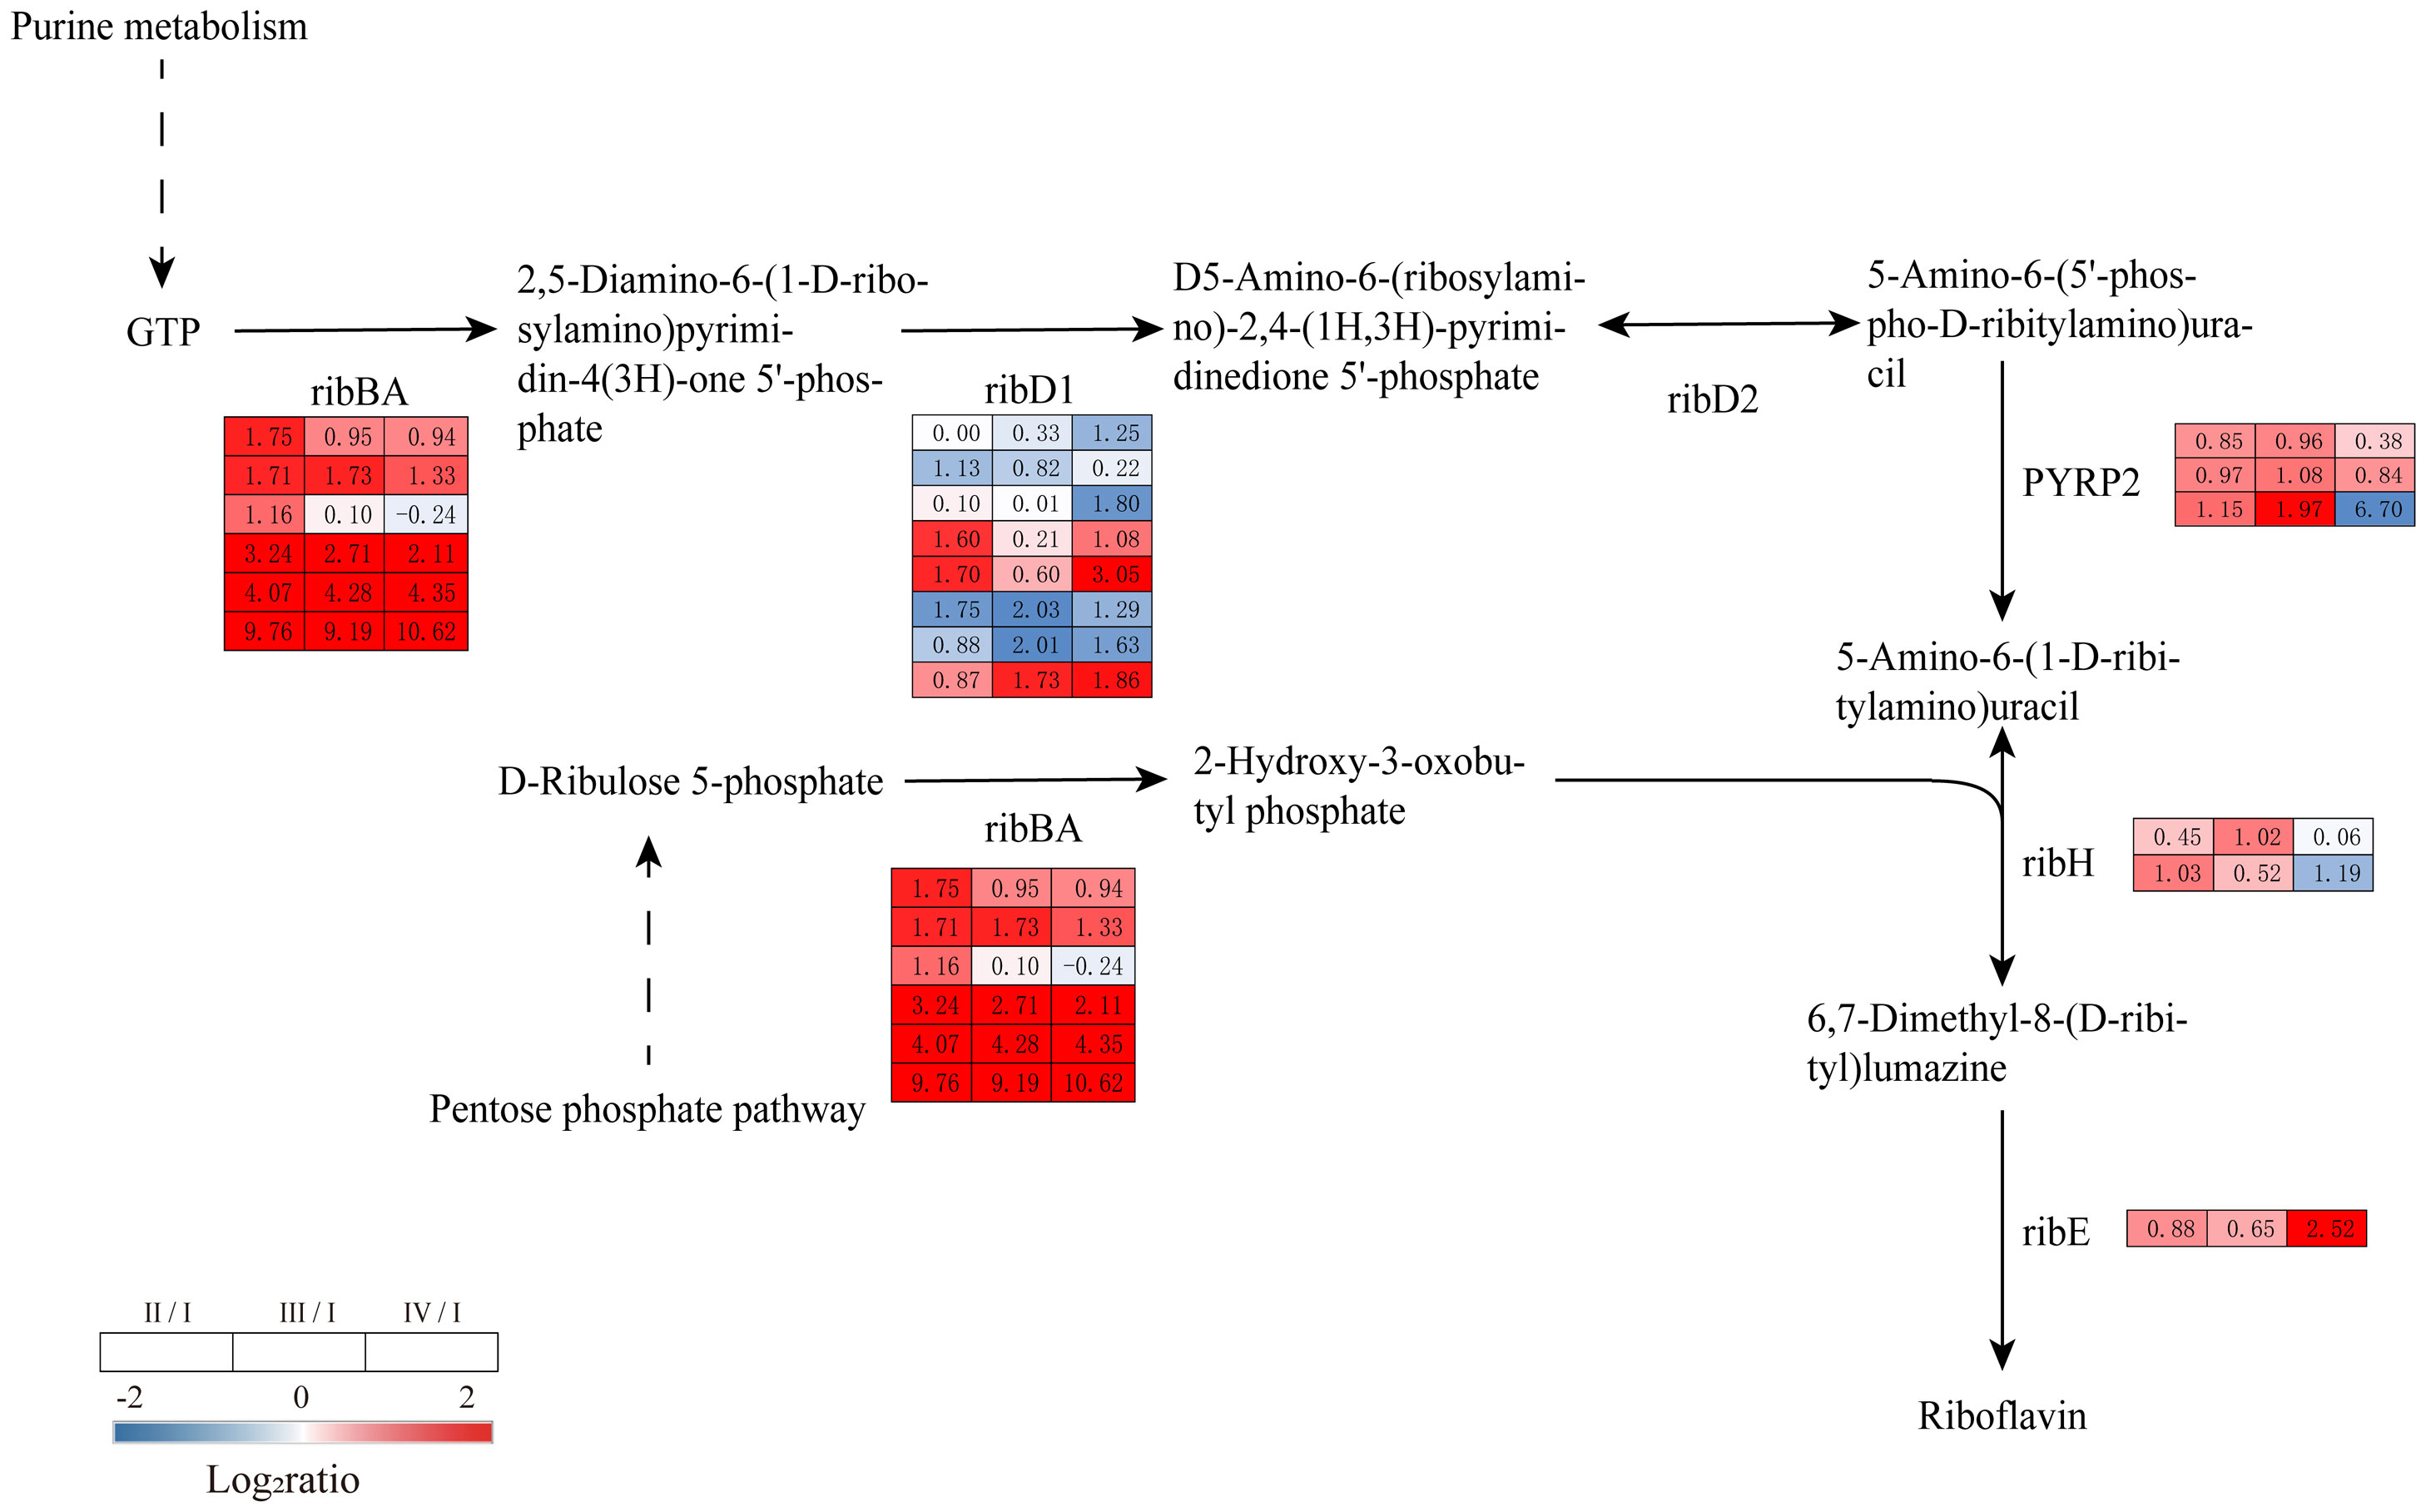
Figure 9 The transcriptomic changes with riboflavin metabolism in the tetraspore formation of G. lemaneiformis between different phases. Red and blue gradients indicate the upregulation and downregulation of unigenes with the adjusted p value<0.001 and |log2ratio|>1, separately, while white represent no significant difference.
4. Discussion
Red algae have a complex life history, and the transition from trophic growth to reproductive development is a key event in that life history (Suda and Mikami, 2020). Molecular mechanisms of spore formation during the reproductive development of the red algae N. yezoensis and P. chauhanii have been reported. However, research on the molecular regulatory mechanisms involved in the formation and release of G. lemaneiformis tetraspores and the response patterns of algae thalli is lacking. In this study, physiological parameters such as chlorophyll fluorescence and antioxidant activity were measured at different phases of tetrasporophyte development. According to the RNA-seq results, a series of metabolic pathways such as photosynthesis, antioxidant system, carbon metabolism and riboflavin biosynthesis were activated during tetrasporophyte development.
4.1. Changes in photosynthesis during the spore formation
Photosynthesis is the process by which green plants, algae and cyanobacteria use solar energy to produce carbohydrates from carbon dioxide and water (Rehman et al., 2016). In photosynthesis, antenna proteins are responsible for capturing light energy and transferring its excitation to the photosystem II (PS II) core complex, where it is converted to chemical energy with the release of oxygen (Lv et al., 2015; Li et al., 2020). Phycobilisomes are the main light-harvesting antennae in red algae, which mainly transmit light energy to PSII and can also be coupled with PSI (Pagliano et al., 2013; Li et al., 2021). In addition, LHCI also exists in red algae to transmit light energy to PSI (Tian et al., 2017; Bai et al., 2021). In the present study, phycobilisomes and LHCI-related genes were highly expressed in Phases II and IV (Figure 6A), which suggests that G. lemaneiformis absorbed more light energy during these phases. Additionally, Phase IV had the highest expression of related genes, indicating that this phase had the greatest absorption of light energy. Similar results were also found in chlorophyll fluorescence parameters, where the Fv’/Fm’ was higher in Phases II and IV than that in Phase I (Figure 2).
The light energy captured by the antenna protein undergoes a series of reactions in PSII, PSI, the cytochrome b6/f complex and F-type ATP synthase to synthesize ATP (Bielczynski et al., 2020). Transcriptome analysis revealed that genes involved in encoding these complexes were significantly upregulated in Phases II to IV, suggesting increased photosynthetic electron transport in these phases and ultimately increased photosynthesis (Figure 6B). In Porphyra yezoensis, it provides energy for sperm formation and release by enhancing the photosynthetic efficiency of PSII at the four-cell phase (Yang et al., 2012). The increased photosynthesis in Phases II and III of this study may be used for the energy supply for the process of tetraspore formation and release. Similarly, the photosynthesis enhanced in the reproductive development of the green algae Ulva prolifera was found to provide the energy for sporogenesis (Jiang et al., 2022). Here, the highest expression of genes encoding proteins in Phase IV indicated that photosynthesis is further enhanced in this phase, which is consistent with the results of Wang et al. (2016). The enhanced photosynthesis in Phase IV may be related to the repair of wounds after tetraspore release.
4.2. Carbon metabolism changes during the spore formation
Carbon fixation is the primary source of carbon in plants, and carbon metabolism plays a crucial role in both the structural makeup and energy generation of plants (Duarte et al., 2013). It is possible that carbon assimilation increases during the formation and release of tetraspores (Phases II to IV), based on the facts that the genes involved in the calvin cycle were significantly upregulated in these phases. Rubisco, a key rate-limiting enzyme in the calvin cycle, was also upregulated, which is consistent with the findings of increased light energy uptake and photosynthesis in Phase II to IV. Interestingly, the expression of most genes in Phase IV was slightly lower than that in Phase II and III, suggesting that carbon assimilation may be less efficient in this phase than in Phase II and III, but light energy uptake and photosynthesis were higher in Phase IV than in Phase II and III, possibly due to increased energy consumption in this phase resulting in lower carbon assimilation efficiency (Figure 7). The increase in carbon fixation flux ultimately leads to an increase in starch and trehalose synthesis, which accumulates more energy for the formation and release of tetraspores. It is worth mentioning that trehalose-6-phosphate in the trehalose biosynthesis pathway has an important role in plant signaling and is associated with plant embryo development, seed germination and the timing of flowering (Gazzarrini and Tsai, 2014). For instance, delayed flowering was observed in plants with defective trehalose-6-phosphate synthesis (Ponnu et al., 2011), and mutations in TPS1 in Arabidopsis resulted in slow growth and stalled reproductive development, demonstrating that TPS1 plays an important role in the transition from nutritional to reproductive development in Arabidopsis (Dijken et al., 2004). The significant up-regulation of genes encoding trehalose-6-phosphate in Phases II to IV suggests that there may be a strong link between tetraspore formation and increased synthesis of trehalose-6-phosphate during tetrasporophyte development in G. lemaneiformis, but the exact function of trehalose-6-phosphate requires further investigation.
Carbon metabolism also provides the energy and carbon backbone for amino acid biosynthesis (Zhao et al., 2021). In the present study, the synthesis of amino acids including Asp, Asn, Gly, Ser, Glu, Gln, His, and Orn, was promoted from Phase II to IV; notably, these amino acids are required for reproductive development in G. lemaneiformis (Supplementary Table 6). In addition to serving as precursors for the synthesis of proteins and peptides, these amino acids are also used by plants to make a variety of other natural products (Joshi et al., 2007). Asp is involved in the synthesis of pyrimidine and purine nucleotides in plants, providing the carbon backbone for the de novo synthesis of purines and pyrimidines (Sullivan et al., 2015). Glutamate is not only a precursor for the synthesis of chlorophyll, γ-aminobutyric acid, etc., but also regulates plant development by participating in physiological processes such as seed germination and pollen germination (Qiu et al., 2020). In addition, the glycine-rich binding proteins GR-RBPs have important roles in seed germination and in promoting fruit ripening (Ma et al., 2021). Overall, G. lemaneiformis meets its material requirements during reproductive development by upregulating the synthesis of amino acids such as Asp, Gly and Glu.
4.3. Oxidative stress during spore formation
As byproducts of cellular metabolism, ROS can function as signaling molecules to control a variety of physiological and developmental processes in plants, such as stomatal opening, biotic stress responses, and reproductive development (Lodde et al., 2021; Shim et al., 2022). Increasing evidence suggests that ROS are involved in the reproductive and developmental processes of red algae. H2O2 can mediate fertilization and postfertilization development of the red alga Bostrychia moritziana, and can regulate sperm mitosis, gamete fusion, and zygotic development (Shim et al., 2022). Exogenous H2O2 in Pyropia yezoensis can promote the production and release of monospores, indicating that oxidative stress can regulate the life cycle of P. yezoensis by inducing the transition from vegetative cells to monospores (Takahashi and Mikami, 2017). In the present study, SOD and POD activities and MDA levels were increased during spore formation and release (Figure 3), and genes involved in encoding antioxidant enzymes (APX, TRX, GR, TR, PRX, and CAT) were significantly upregulated from Phase II to IV (Figure 8), suggesting that oxidative stress is associated with the tetraspore formation and release process in G. lemaneiformis, but its specific regulatory mechanism still requires further study.
4.4. Riboflavin biosynthesis during spore formation
Riboflavin and its derivatives flavin adenine dinucleotide (FAD) and flavin mononucleotide (FMN) are involved in important physiological processes such as energy metabolism and redox metabolism are essential for normal plant growth and development (Sa et al., 2016). Recent studies have shown that riboflavin can be involved in the regulation of maize seed germination and development through the integration of mitochondrial energy metabolism and the cell cycle (Tian et al., 2022). In the present study, the synthesis of riboflavin was induced in Phases II to IV, suggesting that riboflavin may have an important role in tetraspore formation and release (Figure 9). In land plants, riboflavin can regulate ROS concentrations to improve drought tolerance in tobacco plants and can also affect reactive oxygen balance and chloroplast development in rice (Deng et al., 2014; Hu et al., 2021). In the present study, the changes in riboflavin biosynthesis and photosynthesis as well as in antioxidant enzymes were consistent with these findings. Thus, riboflavin may be involved in the reproductive processes of G. lemaneiformis through its participation in oxidative stress and photosynthesis.
5. Conclusions
Reproductive development in the red algae G. lemaneiformis is a complex process that requires a range of complex physiological regulations to achieve the transition from nutritional growth to reproductive development. G. lemaneiformis accumulated more energy by enhancing photosynthesis for tetraspore formation and release, and met its material requirements during reproductive development by upregulating the synthesis of amino acids such as Asp, Gly and Glu. Antioxidant enzymes are also significantly activated during tetraspore formation and release, demonstrating that oxidative stress is essential for reproductive development in G. lemaneiformis. In addition, riboflavin and trehalose-6-phosphate may also be crucial in the development of tetrasporophytes. These findings contribute to our understanding of the molecular regulatory mechanism of tetrasporogenesis in G. lemaneiformis and offer new perspectives for reproductive research and new germplasm development in red algae.
Data availability statement
The datasets presented in this study can be found in online repositories. The names of the repository/repositories and accession number(s) can be found below: BioProject, PRJNA904666.
Author contributions
Conceptualization: DS and NX. Data curation: DS. Formal analysis: DS, XZ, and NX. Funding acquisition: NX and XS. Supervision: NX and XS. Visualization: XS and XZ. Writing-original draft: DS. Writing-review and editing: NX and XS. All authors contributed to the article and approved the submitted version.
Funding
This study was financially supported by the National Key Technologies Research and Development Program of China (2018YFD0901502), the National Natural Science Foundation of China (32002376), the Natural Science Foundation of Zhejiang Province (LY22C190005) and the Key Program of Science and Technology Innovation in Ningbo (2019B10009, 2021Z114, 2022Z172).
Conflict of interest
The authors declare that the research was conducted in the absence of any commercial or financial relationships that could be construed as a potential conflict of interest.
Publisher’s note
All claims expressed in this article are solely those of the authors and do not necessarily represent those of their affiliated organizations, or those of the publisher, the editors and the reviewers. Any product that may be evaluated in this article, or claim that may be made by its manufacturer, is not guaranteed or endorsed by the publisher.
Supplementary material
The Supplementary Material for this article can be found online at: https://www.frontiersin.org/articles/10.3389/fmars.2022.1080474/full#supplementary-material
References
Bai T., Guo L., Xu M., Tian L. (2021). Structural diversity of photosystem I and its light-harvesting system in eukaryotic algae and plants. Front. Plant Science. 12. doi: 10.3389/fpls.2021.781035
Bhattacharya D., Price D. C., Chan C. X., Qiu H., Rose N., Ball S., et al. (2013). Genome of the red alga Porphyridium purpureum. Nat. Commun. 4, 3451. doi: 10.1038/ncomms2931
Bielczynski L. W., Schansker G., Croce R. (2020). Consequences of the reduction of the photosystem II antenna size on the light acclimation capacity of Arabidopsis thaliana. Plant Cell Environment. 43, 4. doi: 10.1111/pce.13701
Cardona T., Sánchez-Baracaldo P., Rutherford A. W., Larkum A. W. (2018). Early archean origin of photosystem II. Geobiology 17, 127–150. doi: 10.1111/gbi.12322
Chen X., Tang Y., Sun X., Zhang X., Xu N. (2022). Comparative transcriptome analysis reveals the promoting effects of IAA on biomass production and branching of Gracilariopsis lemaneiformis. Aquaculture 548, 737678. doi: 10.1016/j.aquaculture.2021.737678
Cock P. J. A., Fields C. J., Goto N., Heuer M. L., Rice P. M. (2010). The Sanger FASTQ file format for sequences with quality scores, and the Solexa/Illumina FASTQ variants. Nucleic Acids Res. 38, 1767–1771. doi: 10.1093/nar/gkp1137
Croce R., van Amerongen H. (2013). Light-harvesting in photosystem I. Photosynthesis Res. 116, 153–166. doi: 10.1007/s11120-013-9838-x
Davis G. A., Kramer D. M. (2020). Optimization of ATP synthase c-rings for oxygenic photosynthesis. Front. Plant Science. 10. doi: 10.3389/fpls.2019.01778
Delivopoulos S. G. (2002). Ultrastructure of tetrasporogenesis in the red alga Osmundea spectabilis var. spectabilis (Rhodomelaceae: Ceramiales: Rhodophyta). Mar. Biol. 140, 921–934. doi: 10.1007/s00227-001-0767-4
Delivopoulos S. G. (2003). Ultrastructure of post-fertilization development in the red alga Nienburgia andersoniana (Delesseriaceae, ceramiales, rhodophyta). Botanical J. Linn. Society. 142, 289–299. doi: 10.1046/j.1095-8339.2003.00170.x
Deng B., Jin X., Yang Y., Lin Z., Zhang Y. (2014). The regulatory role of riboflavin in the drought tolerance of tobacco plants depends on ROS production. Plant Growth Regulation. 72, 269–277. doi: 10.1007/s10725-013-9858-8
Dewey C. N., Bo L. (2011). RSEM: accurate transcript quantification from RNA-seq data with or without a reference genome. BMC Bioinf. 12, 323–323. doi: 10.1186/1471-2105-12-323
Dijken A. J. H., Schluepmann H., Smeekens S. C. M. (2004). Arabidopsis trehalose-6-phosphate synthase 1 is essential for normal vegetative growth and transition to flowering. Plant Physiol. 135, 969–977. doi: 10.1104/pp.104.039743
Duarte G. T., Matiolli C. C., Pant B. D., Schlereth A., Scheible W.-R., Stitt M., et al. (2013). Involvement of microRNA-related regulatory pathways in the glucose-mediated control of Arabidopsis early seedling development. J. Exp. Botany. 64, 4301–4312. doi: 10.1093/jxb/ert239
Fang T., Zhang X. Q., Hu S. S., Yu Y. Y., Sun X., Xu N. J. (2021). Enzymatic degradation of Gracilariopsis lemaneiformis polysaccharide and the antioxidant activity of its degradation products. Mar. Drugs 19, 270. doi: 10.3390/md19050270
Fichtner F., Olas J. J., Feil R., Watanabe M., Krause U., Hoefgen R., et al. (2020). Functional features of trehalose-6-phosphate synthase1an essential enzyme in Arabidopsis thaliana. Plant Cell. 32, tpc.00837.02019. doi: 10.1105/tpc.19.00837
Gao G., Gao L., Jiang M., Jian A., He L. (2021). The potential of seaweed cultivation to achieve carbon neutrality and mitigate deoxygenation and eutrophication. Environ. Res. Letters. 17, 014018. doi: 10.1088/1748-9326/ac3fd9
Garcia-Jiménez P., Robaina R. R. (2015). On reproduction in red algae: further research needed at the molecular level. Front. Plant Science. 6. doi: 10.3389/fpls.2015.00093
Gazzarrini S., Tsai A. Y.-L. (2014). Trehalose-6-phosphate and SnRK1 kinases in plant development and signaling: the emerging picture. Front. Plant Science. 5. doi: 10.3389/fpls.2014.00119
He B. X., Gu W. H., Wang L. J., Zheng Z. B., Shao Z. Z., Huan L., et al. (2021). RNA-Seq between asexual archeospores and meiosis-related conchospores in Neopyropia yezoensis using smart-seq2. J. Phycology. 57, 1648–1658. doi: 10.1111/jpy.13197
Hu H. T., Ren D. Y., Hu J., Jiang H. Z., Chen P., Zeng D. L., et al. (2021). White and lesion-mimic leaf1, encoding a lumazine synthase, affects reactive oxygen species balance and chloroplast development in rice. Plant J. 108, 1690–1703. doi: 10.1111/tpj.15537
Ifuku K., Ido K., Sato F. (2011). Molecular functions of PsbP and PsbQ proteins in the photosystem II supercomplex. J. Photochem. Photobiol. B Biol. 104, 158–164. doi: 10.1016/j.jphotobiol.2011.02.006
Jiang W., Fu Y., Yang F., Yang Y., Liu T., Zheng W., et al. (2014). Gracilaria lemaneiformis polysaccharide as integrin-targeting surface decorator of selenium nanoparticles to achieve enhanced anticancer efficacy. ACS Appl. Mater Interfaces. 6, 13738–13748. doi: 10.1021/am5031962
Jiang J., Li Y., Hu C., Zhu W., Xu N. (2022). Transcriptomic analysis reveals the regulation mechanism of sporogenesis in Ulva prolifera. Front. Mar. Science. 9. doi: 10.3389/fmars.2022.802006
Joshi V., Laubengayer K. M., Schauer N., Fernie A. R., Jander G. (2007). Two Arabidopsis threonine aldolases are nonredundant and compete with threonine deaminase for a common substrate pool. Am. Soc. Plant Biologists. 12, 44958. doi: 10.1105/tpc.106.044958
Kang Y., Wang Z. J., Xie D., Sun X., Yang W., Zhao X., et al. (2017). Characterization and potential antitumor activity of polysaccharide from Gracilariopsis lemaneiformis. Mar. Drugs 15, 100. doi: 10.3390/md15040100
Kawakami K., Umena Y., Iwai M., Kawabata Y., Ikeuchi M., Kamiya N., et al. (2011). Roles of PsbI and PsbM in photosystem II dimer formation and stability studied by deletion mutagenesis and X-ray crystallography. Biochim. Biophys. Acta (BBA) - Bioenergetics. 1807, 319–325. doi: 10.1016/j.bbabio.2010.12.013
Kentaro I., Takumi N. (2016). Structural coupling of extrinsic proteins with the oxygen-evolving center in photosystem II. Front. Plant Science. 7, 9787. doi: 10.1021/bi4009787
Langmead B., Salzberg S. L. (2012). Fast gapped-read alignment with bowtie 2. Nat. Methods 9, 357–359. doi: 10.1038/NMETH.1923
Liao X. B., Yang L. W., Chen M. Z., Yu J., Zhang S. M., Ju Y. Y. (2015). The hypoglycemic effect of a polysaccharide (GLP) from Gracilaria lemaneiformis and its degradation products in diabetic mice. Food Funct. 6, 2542–2549. doi: 10.1039/c4fo01185f
Li L., Li F., Wang Y., Yang C., Lu C., Liu C., et al. (2020). An innovative artificial photosystem II constructed from PSII core of Thermosynechococcus vulcanus and LHCII of Pisum sativum-a new approach for studying the function of photosynthetic antenna. Plant Physiol. Biochem. 154, 160–170. doi: 10.1016/j.plaphy.2020.05.030
Li M., Ma J., Li X., Sui S. F. (2021). In situ cryo-ET structure of phycobilisome–photosystem II supercomplex from red alga. eLife 10, e69635. doi: 10.7554/eLife.69635
Liu X., Bogaert K., Engelen A. H., Leliaert F., Roleda M. Y., De Clerck O. (2017). Seaweed reproductive biology: environmental and genetic controls. Botanica Marina. 60, 89–108. doi: 10.1515/bot-2016-0091
Lodde V., Morandini P., Costa A., Murgia I., Ezquer I. (2021). cROStalk for life: Uncovering ROS signaling in plants and animal systems, from gametogenesis to early embryonic development. Genes 12, 525. doi: 10.3390/genes12040525
Lokstein H., Renger G., Gtze J. (2021). Photosynthetic light-harvesting (antenna) complexes–structures and functions. Molecules 26, 3378. doi: 10.1016/j.cbpa.2018.06.008
Lv Q., Ma W., Liu H., Li J., Wang H., Lu F., et al. (2015). Genome-wide protein-protein interactions and protein function exploration in cyanobacteria. Sci. Rep. 5, 15519. doi: 10.1038/srep15519
Ma L., Cheng K., Li J., Deng Z., Zhang C., Zhu H. (2021). Roles of plant glycine-rich RNA-binding proteins in development and stress responses. Int. J. Mol. Sci. 22, 5849. doi: 10.3390/ijms22115849
Mao X., Cai T., Olyarchuk J. G., Wei L. (2005). Automated genome annotation and pathway identification using the KEGG orthology (KO) as a controlled vocabulary. Bioinformatics 21, 3787–3793. doi: 10.1093/bioinformatics/bti430
Pagliano C., Saracco G., Barber J. (2013). Structural, functional and auxiliary proteins of photosystem II. Photosynthesis Res. 116, 167–188. doi: 10.1007/s11120-013-9803-8
Ponnu J., Wahl V., Schmid M. (2011). Trehalose-6-phosphate: Connecting plant metabolism and development. Front. Plant Science. 2. doi: 10.3389/fpls.2011.00070
Qiu X. M., Sun Y. Y., Ye X. Y., Li Z. G. (2020). Signaling role of glutamate in plants. Front. Plant Science. 10. doi: 10.3389/fpls.2019.01743
Rehman A. U., Kodru S., Vass I. (2016). Chloramphenicol mediates superoxide production in photosystem II and enhances its photodamage in isolated membrane particles. Front. Plant Sci. 7. doi: 10.3389/fpls.2016.00479
Sa N., Rawat R., Thornburg C., Walker K. D., Roje S. (2016). Identification and characterization of the missing phosphatase on the riboflavin biosynthesis pathway in Arabidopsis thaliana. Plant J. 88, 705–716. doi: 10.1111/tpj.13291
Shim E., Lee J. W., Park H., Zuccarello G. C., Kim G. H. (2022). Hydrogen peroxide signalling mediates fertilization and post-fertilization development in the red alga Bostrychia moritziana. J. Exp. Botany. 73, 727–741. doi: 10.1093/jxb/erab453
Suda M., Mikami K. (2020). Reproductive responses to wounding and heat stress in gametophytic thalli of the red alga Pyropia yezoensis. Front. Mar. Science. 7. doi: 10.3389/fmars.2020.00394
Sullivan L. B., Gui D. Y., Hosios A. M., Bush L. N., Freinkman E., Vander Heiden M. G, et al. (2015). Supporting aspartate biosynthesis is an essential function of respiration in proliferating cells. Cell 163, 552–563. doi: 10.1016/j.cell.2015.07.017
Takahashi M., Mikami K. (2017). Oxidative stress promotes asexual reproduction and apogamy in the red seaweed Pyropia yezoensis. Front. Plant Science. 8. doi: 10.3389/fpls.2017.00062
Tamminen M., Betz A., Pereira A. L., Thali M., Matthews B., Suter M. J., et al. (2018). Proteome evolution under non-substitutable resource limitation. Nat. Commun. 9, 4650. doi: 10.1038/s41467-018-07106-z
Tian L., Liu Z., Wang F., Shen L., Chen J., Chang L., et al. (2017). Isolation and characterization of PSI–LHCI super-complex and their sub-complexes from a red alga Cyanidioschyzon merolae. Photosynthesis Res. 133, 201–214. doi: 10.1007/s11120-017-0384-9
Tian Q. Z., Wang G., Ma X. X., Shen Q. W., Ding M. L., Yang X. Y., et al. (2022). Riboflavin integrates cellular energetics and cell cycle to regulate maize seed development. Plant Biotechnol. J. 20, 1487–1501. doi: 10.1111/pbi.13826
Wang J., Sui Z., Hu Y., Zhou W., Wei H., Du Q., et al. (2016). Assessment of photosynthetic performance, carboxylase activities, and ATP content during tetrasporic development in Gracilariopsis lemaneiformis (Gracilariaceae, rhodophyta). J. Appl. Phycology. 28, 2939–2952. doi: 10.1007/s10811-016-0834-3
Wang Z. Y., Wang G. C., Niu J. F., Wang W. J., Peng G. A. (2010). Optimization of conditions for tetraspore release and assessment of photosynthetic activities for different generation branches of Gracilaria lemaneiformis bory. Chin. J. Oceanology Limnology. 28, 738–748. doi: 10.1007/s00343-010-9908-2
Wang X., Xu X., Mao G., Guo Y., Wang G., Sun X., et al. (2022). Structural characterization of Gracilariopsis lemaneiformis plysaccharide and its property in delaying cellular senescence. Front. Nutr. 9. doi: 10.3389/fnut.2022.876992
Xu D., Zhu J. Y., Yang H., Cheng X. J., Zhang W. Y., Zhang X. C. (2008). Structure of reproductive apparatus of Gracilaria/Gracilariopsis lemaneiformis (Gracilariaceae, rhodophyta). Sci. China 12, 1137. doi: 10.1007/s11427-008-0147-0
Yang R. L., Zhou W., Shen S. D., Wang G. C., He L. W., Pan G. H. (2012). Morphological and photosynthetic variations in the process of spermatia formation from vegetative cells in Porphyra yezoensis ueda (Bangiales, rhodophyta) and their responses to desiccation. Planta 235, 885–893. doi: 10.1007/s00425-011-1549-y
Zhang L., Goswami N., Xie J., Zhang B., He Y. (2017). Unraveling the molecular mechanism of photosynthetic toxicity of highly fluorescent silver nanoclusters to Scenedesmus obliquus. Sci. Rep. 7, 16432. doi: 10.1038/s41598-017-16634-5
Zhang Q., Song S., Gao D., Ding H., Yan X. (2021). Time-series transcriptomic analysis reveals potential genes and pathways involved in the process of monospore formation in Phycocalida chauhanii. J. Appl. Phycology. 33, 1925–1937. doi: 10.1007/s10811-021-02418-y
Zhao C., Guo H., Wang J., Wang Y., Zhang R. (2021). Melatonin enhances drought tolerance by regulating leaf stomatal behavior, carbon and nitrogen metabolism, and related gene expression in maize plants. Front. Plant Science. 12. doi: 10.3389/fpls.2021.779382
Keywords: Gracilariopsis lemaneiformis, carbon metabolism, photosynthesis, transcriptome, tetrasporogenesis
Citation: Sun D, Zhou X, Sun X and Xu N (2023) Transcriptomic analysis reveals the regulatory mechanism of tetraspore formation in Gracilariopsis lemaneiformis. Front. Mar. Sci. 9:1080474. doi: 10.3389/fmars.2022.1080474
Received: 26 October 2022; Accepted: 28 December 2022;
Published: 13 January 2023.
Edited by:
Tifeng Shan, Institute of Oceanology (CAS), ChinaReviewed by:
Zhengquan Gao, Shandong University of Technology, ChinaZi-Min Hu, Yantai University, China
Copyright © 2023 Sun, Zhou, Sun and Xu. This is an open-access article distributed under the terms of the Creative Commons Attribution License (CC BY). The use, distribution or reproduction in other forums is permitted, provided the original author(s) and the copyright owner(s) are credited and that the original publication in this journal is cited, in accordance with accepted academic practice. No use, distribution or reproduction is permitted which does not comply with these terms.
*Correspondence: Nianjun Xu, eHVuaWFuanVuQG5idS5lZHUuY24=