 Taehee Na1
 Jeomshik Hwang
 So-Yun Kim
 TaeKeun Rho
 Tongsup Lee
- 1School of Earth and Environmental Sciences/Research Institute of Oceanography, Seoul National University, Seoul, South Korea
- 2Department of Oceanography, Pusan National University, Busan, South Korea
- 3Korea Institute of Ocean Science and Technology, Busan, South Korea
The East Sea (also known as the Japan Sea; hereafter, EJS) has its own deep overturning circulation, that operates over a centurial timescale compared with a millennial timescale in the ocean. This allows the EJS to be used as a natural laboratory for investigating potential future changes in the oceanic system. Dissolved inorganic carbon (DIC), total alkalinity (TA), and pH were measured in 2019 in a wide area of the EJS to investigate the characteristics and changes of the carbonate system since the last extensive survey in 1999. In the layer below ∼1,000 m, DIC and apparent oxygen utilization (AOU) was uniform implying rapid horizontal mixing within a few years. Since 1999, DIC concentration increased by ∼11 μmol kg–1 in the layer deeper than 500 m. This increase accompanied a commensurate increase in AOU with the canonical ratio of 1.3, indicating that the accumulation of DIC was supplied from organic matter decomposition. This observation is consistent with a previous study suggesting that the slowed deep water ventilation was the cause of the increase in AOU and fast acidification. In the EJS, increase in DIC from the surface water to deep waters is much higher than that in TA, which is caused by high primary productivity and export production together with low rates of CaCO3 export. Thus, the DIC/TA ratio of deep waters, an indicator of vulnerability to acidification, is high. A recently reported change in deep water ventilation, namely, re-initiation of deep water formation reaching deeper depths to the Deep Water and the Bottom Water, implies that unexpected changes in the carbonate system may be detected in the future, which needs to be further monitored.
Introduction
The East Sea (also known as the Japan Sea; hereafter, EJS) is a semi-enclosed marginal sea in the northwest Pacific, and is surrounded by the Korean Peninsula, Russia, and the Japanese islands (Figure 1). The EJS has an average depth of 1,350 m and is connected to the Pacific through three shallow straits (depth < 150 m). The EJS contains the Japan Basin (JB) in the north, the Ulleung Basin (UB) in the southwest, and the Yamato Basin in the southeast. The EJS has an ocean-like deep water formation and a meridional circulation, which is isolated from the Pacific (Senjyu and Sudo, 1993; Kawamura and Wu, 1998; Kim et al., 2002; Talley et al., 2003). Deep water ventilation in the EJS has a shorter timescale of hundreds of years than that seen in the oceans (Tsunogai et al., 1993; Kim and Kim, 1996; Kumamoto et al., 1998; Min and Warner, 2005). Consequently, the EJS has the potential to be used as a “natural laboratory” to examine more easily how changes occur in the open ocean (Kim et al., 2001).
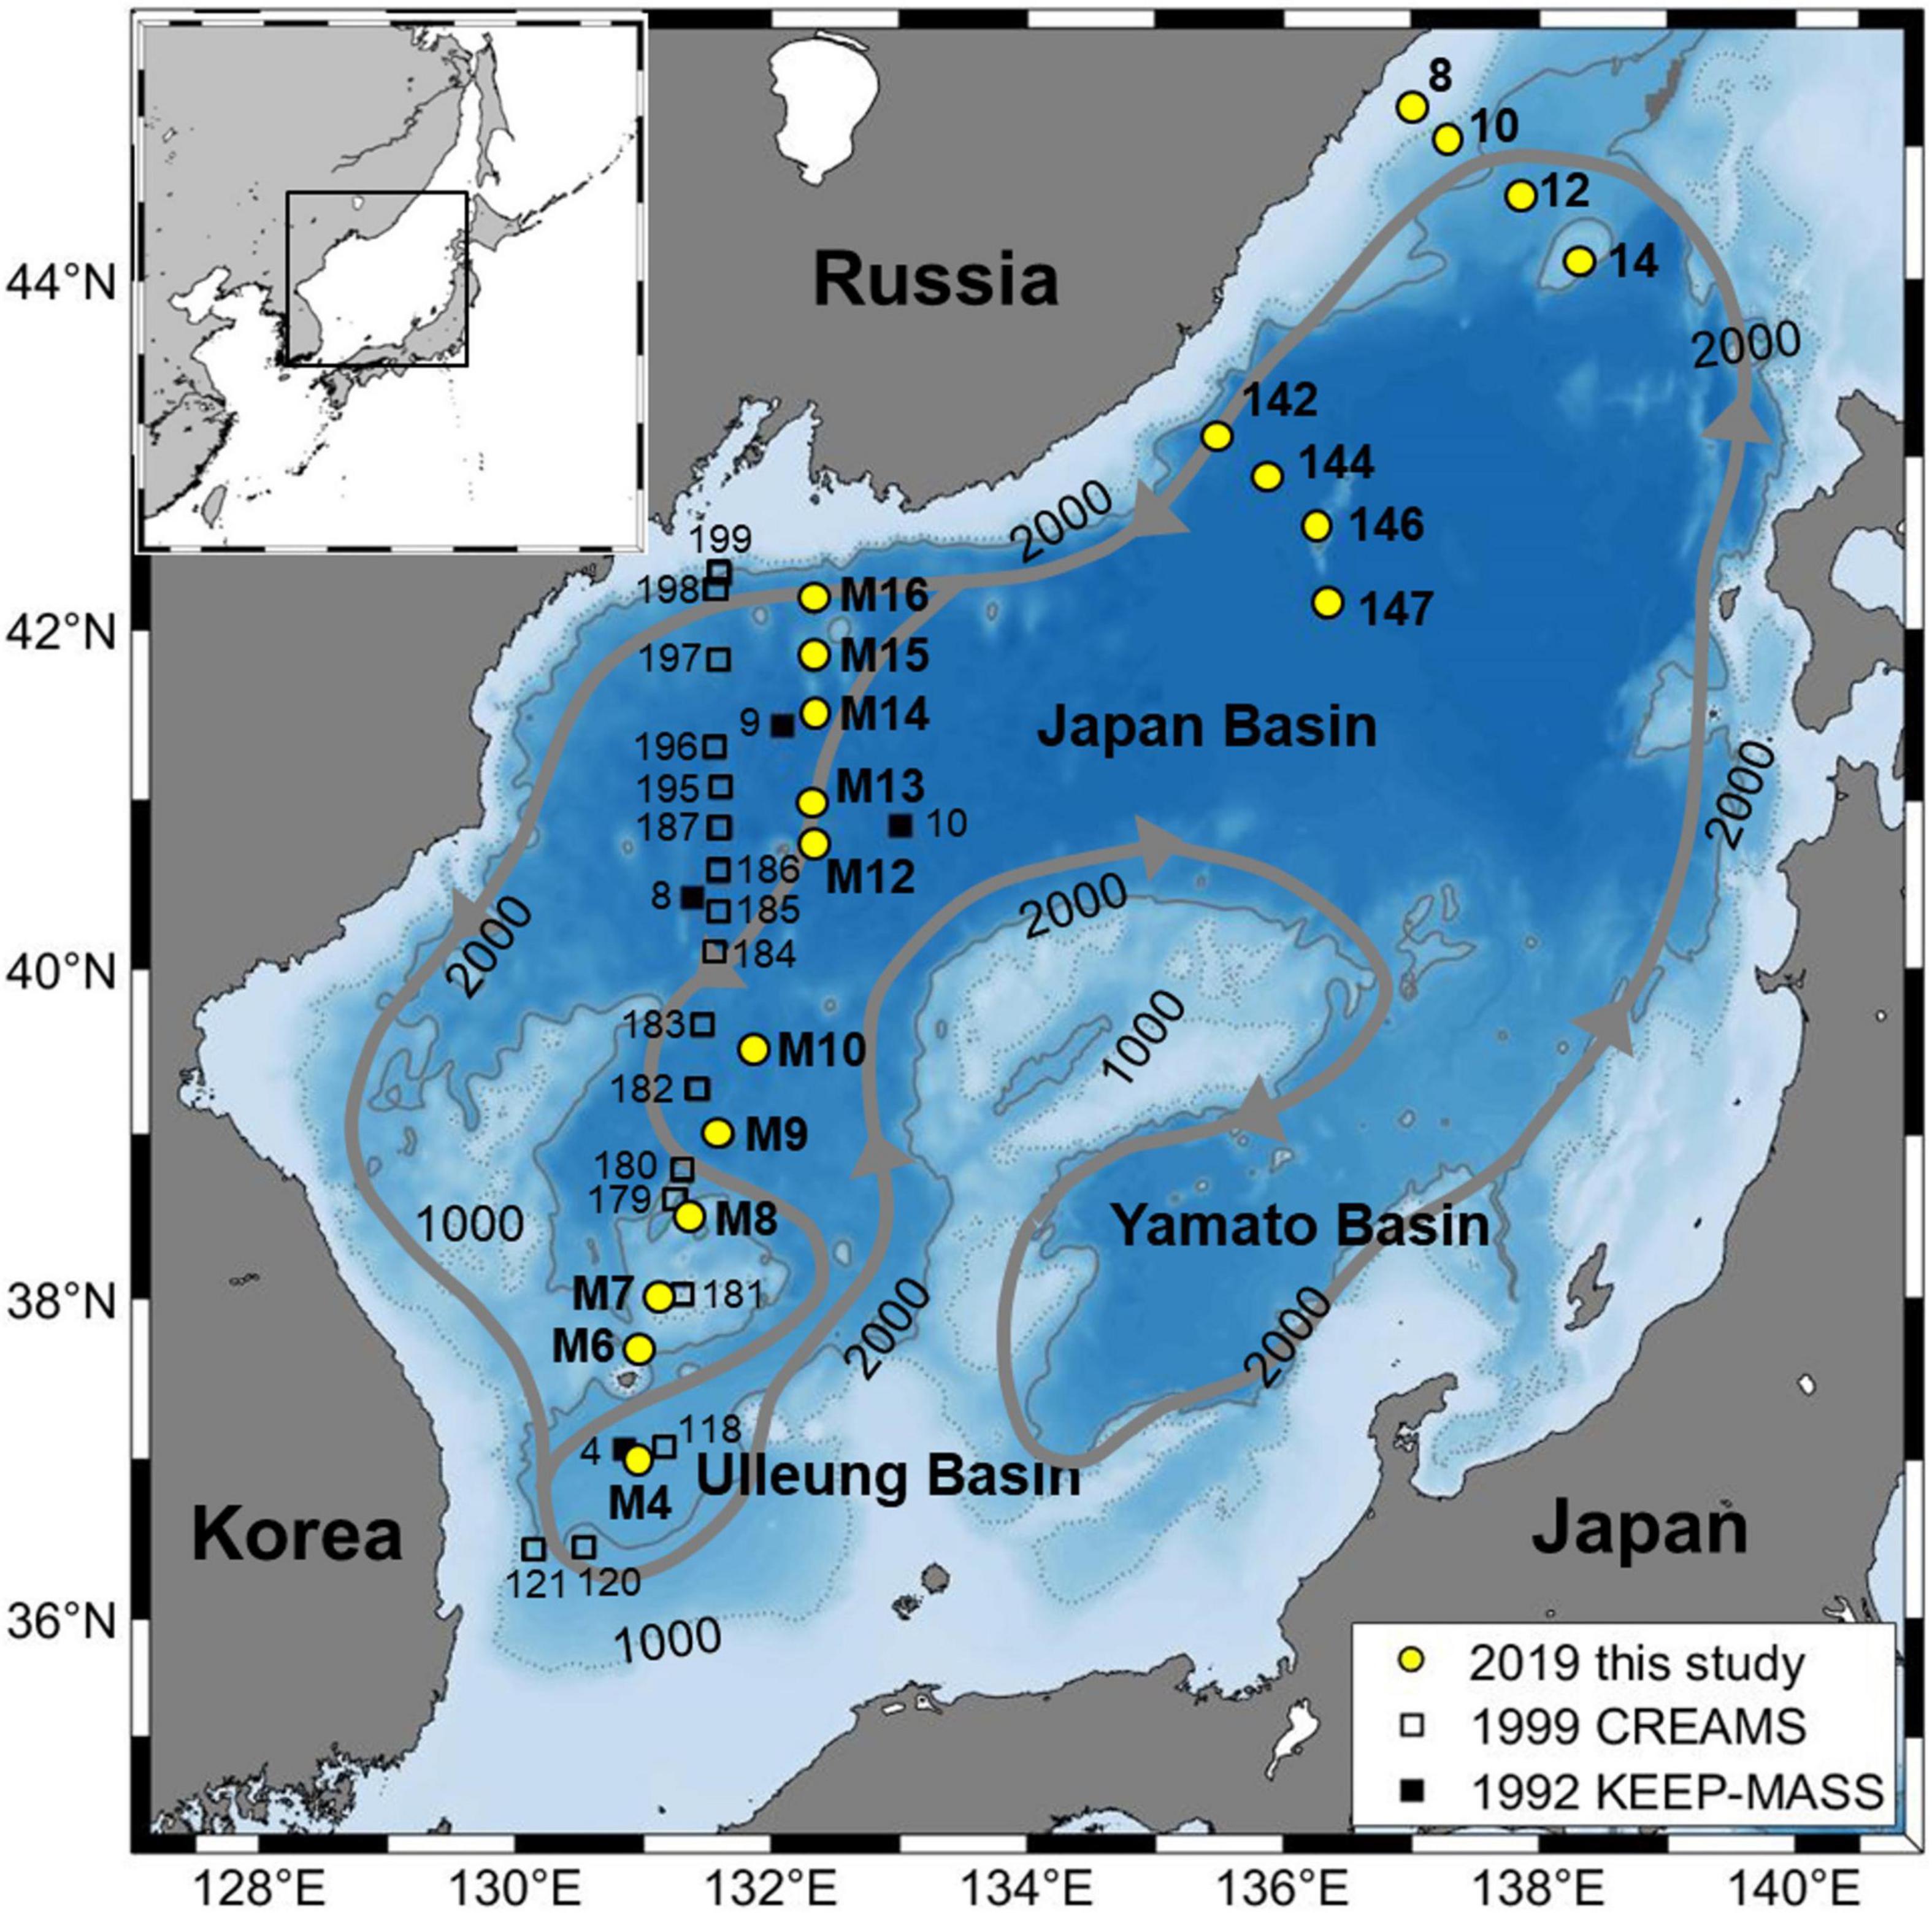
Figure 1. Bathymetric map of the East Sea (Japan Sea) showing study sites in 2019 (circles). Open squares and black squares respectively represent stations of the Circulation Research of East Asian Marginal Seas project in 1999 (Talley et al., 2004) and the Kuroshio Edge Exchange Processes-Marginal Seas Studies in 1992 (Chen et al., 1995). The conceptual abyssal circulation suggested by Senjyu et al. (2005) is also shown.
A few studies have investigated the carbonate system of the EJS. The first systematic survey of CO2 parameters in 1992 showed that the nTA (total alkalinity normalized to a salinity of 35) and nDIC (dissolved inorganic carbon normalized to a salinity of 35) values were lower than those of the Pacific (Chen et al., 1995). An extensive field experiment in the EJS was carried out in 1999, which included measurements of CO2 parameters among many biogeochemical properties (Talley et al., 2004). Park et al. (2006, 2008) proposed a large uptake of atmospheric CO2 by the EJS from 1992 to 1999 and a subsequent decrease in the CO2 absorption rate from 1999 to 2007 (from 0.6 ± 0.4 to 0.3 ± 0.4 mol C m–2year–1). The shoaling of the carbonate saturation horizons was reported by Park et al. (2006) and Kim et al. (2014) found rapid acidification since 1995 (i.e., a decrease in pH of 0.03 ± 0.02 pH units decade–1) in the surface waters of the UB. Recently, Chen et al. (2017) estimated pH from long-term measurements of the dissolved oxygen (DO) concentration and showed a rapid decrease in pH in the interior of the EJS.
In 2019, we measured DIC, TA, and pH over a wide area of the EJS. In this manuscript, we show that DIC concentration increased considerably since 1999 in conjunction with a decrease in DO concentration. We discuss the characteristics of the carbonate system of the EJS and the implications of our findings in the context of the variability of deep water ventilation.
Materials and Methods
Field measurements and sampling were carried out from 27 October to 22 November 2019, along a north–south transect through the western EJS and two transects in the eastern JB aboard the R/V Akademik Oparin (Figure 1). Temperature and salinity were measured using a CTD (SBE 9 plus). DO was measured using a sensor (SBE 43) with calibration by Winkler titration. Seawater samples for DIC, TA, and pH analysis were collected in 600-ml boro-silicate glass bottles and a 200-μl saturated HgCl2 solution was then added following the standard protocol of Dickson et al. (2007). DIC and TA were measured in a land-based laboratory using a VINDTA 3C (Marianda, Germany) by coulometric titration and potentiometric titration, respectively. The measurement precision was ±2 μmol kg–1 for both DIC and TA. Standard material (batch #173: salinity = 33.414, DIC = 2,042.41 ± 0.85 μmol kg–1, TA = 2,210.77 ± 0.64 μmol kg–1 and batch #185: salinity = 33.419, DIC = 2,029.88 ± 0.62 μmol kg–1, TA = 2,220.67 ± 0.58 μmol kg–1) provided by A. Dickson at the Scripps Institution of Oceanography, United States, was analyzed frequently, including each time a new titration cell was installed.
pH was measured on board spectrophotometrically by addition of m-cresol purple after temperature adjustment to 25°C (Clayton and Byrne, 1993). pH values measured at 25°C were converted to values at the in situ temperature and pressure. The measured pH values (n = 74) were compared with those calculated from the DIC and TA results using CO2SYS (Lewis and Wallace, 1998). The carbonic acid dissociation constants cited by Mehrbach et al. (1973), as refit by Dickson and Millero (1987), were used in the calculation. The difference between the two independent measurements was 0.015 ± 0.013, with the calculated values higher. Unpurified m-cresol purple (Dye content 90%, Aldrich, 8M) was used after dilution in 10% ethanol. Liu et al. (2011) reported that when unpurified Aldrich’s m-cresol purple is used, the measurement is about 0.005–0.01 lower in pH unit at the range of 7.4 < pH < 7.8. We did not attempt to correct our measurement data in order for comparison since 1999 data, which are mainly compared with our data, were also determined by the same method without purification of m-cresol purple (Talley et al., 2004).
The saturation states of calcite and aragonite, Ωcalc and Ωarag, respectively, were also calculated using CO2SYS (Mehrbach et al., 1973; Dickson and Millero, 1987). The saturation horizons were determined from the vertical distribution of Ω values by interpolation of the two data points near the Ω value of one. The uncertainties of the saturation states were determined to range 0.02–0.05 (higher values toward the shallower depths) for calcite, and 0.01–0.03 (higher values toward the shallower depths) for aragonite, which are comparable to those reported in previous studies (e.g., Kim et al., 2010; Orr et al., 2018). These uncertainties correspond to the uncertainties of 40–100 and 2–15 m for the saturation horizon estimates of calcite and aragonite, respectively.
We compared our data with those from previous studies completed in 1992 (Chen et al., 1995) and 1999 (Talley et al., 2004; in this case, TA and pH were measured and DIC was calculated). Oceanic data for comparison were obtained from the GLODAP version 2 (Global Ocean Data Analysis Project version 2; Key et al., 2015; Olsen et al., 2016).1
Results
Vertical and Spatial Distribution of CO2 Parameters
In the EJS, potential temperature and salinity typically vary within the upper 500 m, but are relatively constant below this upper layer, within ±0.1°C in temperature and ±0.002 in salinity (not shown). The deep interior is occupied by the Central Water, the Deep Water, and the Bottom Water (Kim et al., 2004). Currently, the boundary between the Central Water and the Deep Water, defined by the 0.13–0.15°C isotherm, lies at a depth between 1,600 and 1,900 m (Yoon et al., 2018). The boundary between the Deep Water and the Bottom Water lies at ∼2,500 m. However, the values of the CO2 parameters vary only slightly among these water masses. For convenience, we refer to these water masses as “deep waters” in this manuscript. In the UB, intermediate water (Japan/East Sea Intermediate Water, JESIW; Yoon and Kawamura, 2002) occupies the 200–400 m layer.
Below ∼1,000 m depth vertical distributions of DO, DIC, and TA at 19 stations in the EJS were not significantly different (Figures 2, 3). The DO concentration generally decreased with increasing depth and was within a narrow range below ∼1,000 m (<±2 μmol kg–1) with the exception near the seafloor in the UB, where an abrupt decrease was observed (Figure 2A). In the UB south of the subpolar front (Stations M4–M10), abnormally low DO concentrations were observed in the upper 100 m layer (Figure 2 and Supplementary Figure 1). These samples of low DO and high apparent oxygen utilization (AOU) belong to the water mass that was introduced through the Korea Strait. AOU below ∼300 m showed a monotonic increase with increasing depth up to 150 μmol kg–1 (Figure 2B). The concentration of DIC increased sharply with depth, from 1,960 to 2,240 μmol kg–1, in the upper ∼500 m (Figure 2C). Below 1,000 m, DIC ranged between 2,240 and 2,260 μmol kg–1. The high DIC near the seafloor in the UB accompanies high AOU, reflecting enhanced decomposition of organic matter (Supplementary Figure 1; Kang et al., 2010). TA ranged between 2,240 and 2,290 μmol kg–1 (Figure 2D), with a monotonic increase with depth. A positive correlation was observed between TA and salinity (TA = 27 × salinity + 1,367; R2 = 0.8, n = 165) in the upper 500 m.
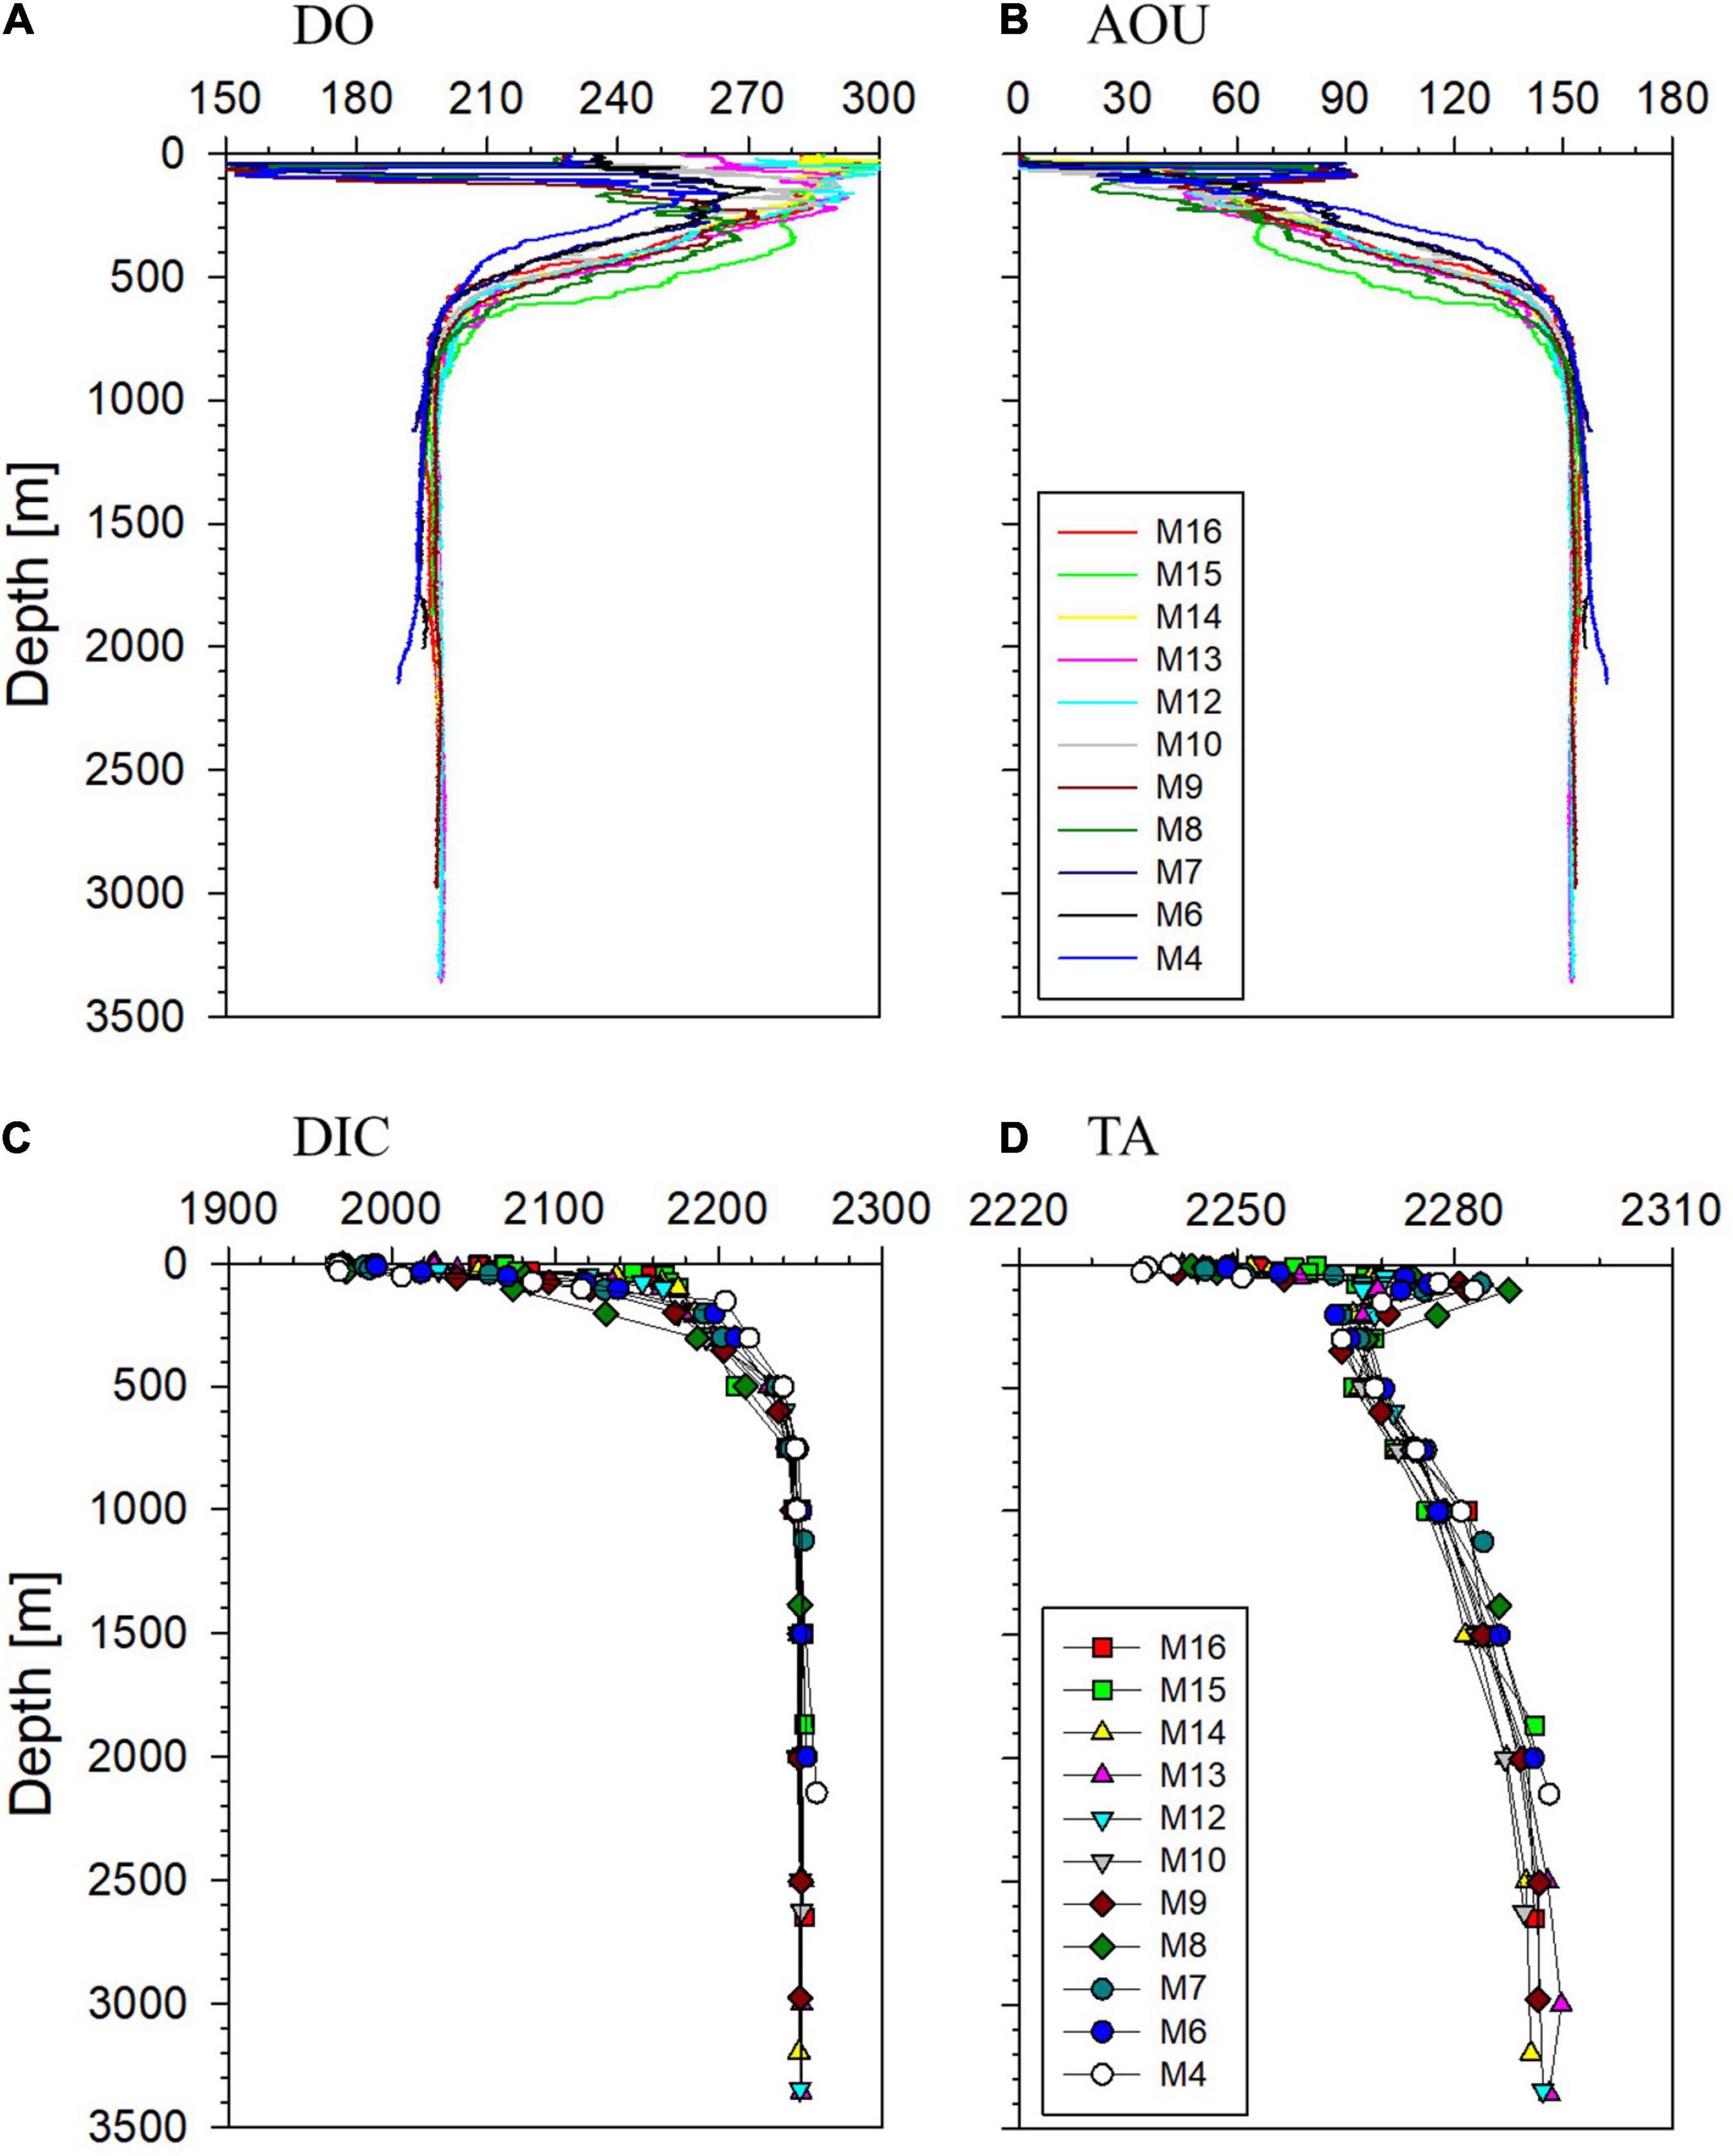
Figure 2. Vertical distributions of (A) dissolved oxygen (DO), (B) apparent oxygen utilization (AOU), (C) dissolved inorganic carbon (DIC), and (D) total alkalinity (TA) at the stations along the western most transect. All results are presented in μmol kg–1.
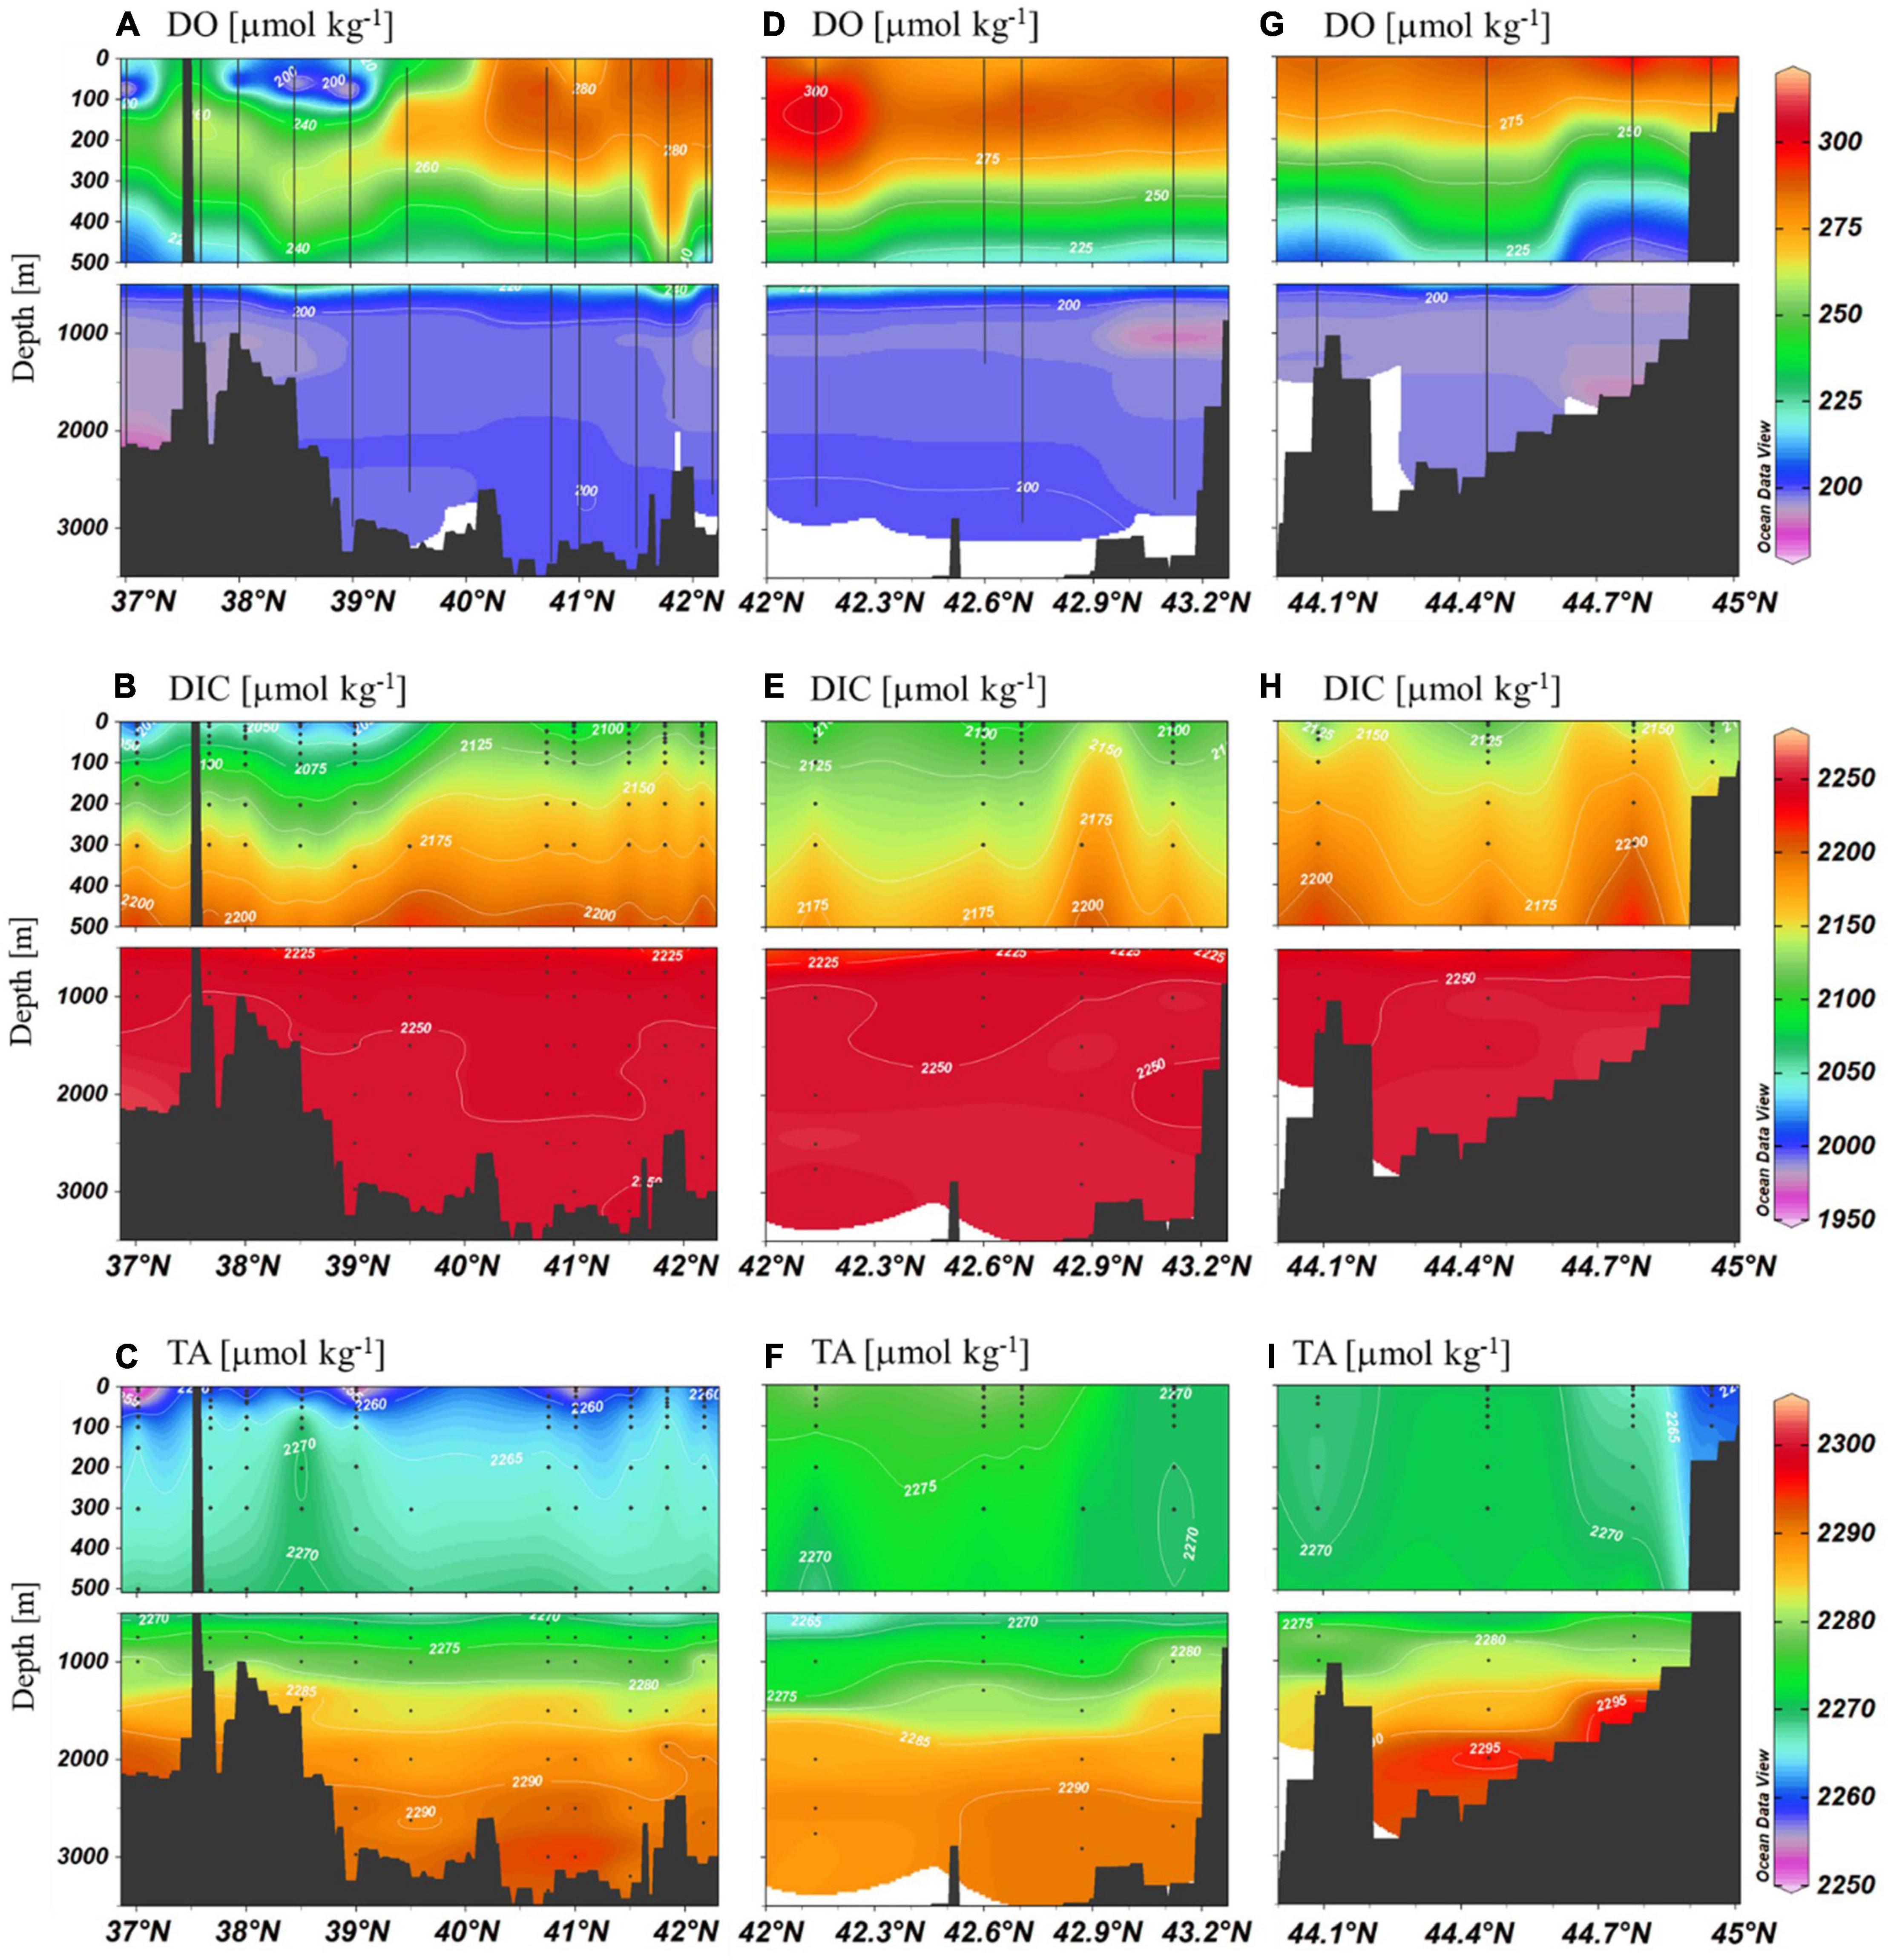
Figure 3. Meridional sections of DO, DIC, and TA along the three transects in Figure 1 observed in 2019.
Horizontally, both DO and DIC in the surface layer showed contrast between the north and south of the subpolar front with the lower values in the south. In the upper ∼500 m layer, stations in the middle transect (Stations 142–147) exhibited slightly lower DIC values (Figure 3). Slightly higher values of DIC and TA were observed near the seafloor in the eastern most transect.
We examined the data of the western most transect to examine any meridional difference along the deep water path. The data at depths below 500 m were binned into the JB (M12–M16) and the UB (M4, M6, and M7). No significant meridional difference was observed in deep waters (Figures 2, 3). The difference in AOU and DIC in the 1,000 m – bottom layer of the JB and the UB was 3.7 ± 2 and 3.4 ± 1 μmol kg–1, respectively (Figure 3).
Temporal Variation in Apparent Oxygen Utilization, Dissolved Inorganic Carbon, and pH in Deep Waters
When compared with the 1999 data, considerable changes were observed for AOU, DIC, and pH (Figure 4). Increase in AOU was apparent for the water column below the surface layer. DIC change in the upper 500 m layer was not apparent. However, below this upper layer, considerable increase in DIC was observed. Higher values near the seafloor in the UB were consistently observed both years. Decrease in pH was observed in the whole water column, with larger changes at shallower depths. In the upper 200 m layer, the decrease was ∼0.1 in pH unit. The decrease was smaller than 0.03 in the layer deeper than ∼2,000 m.
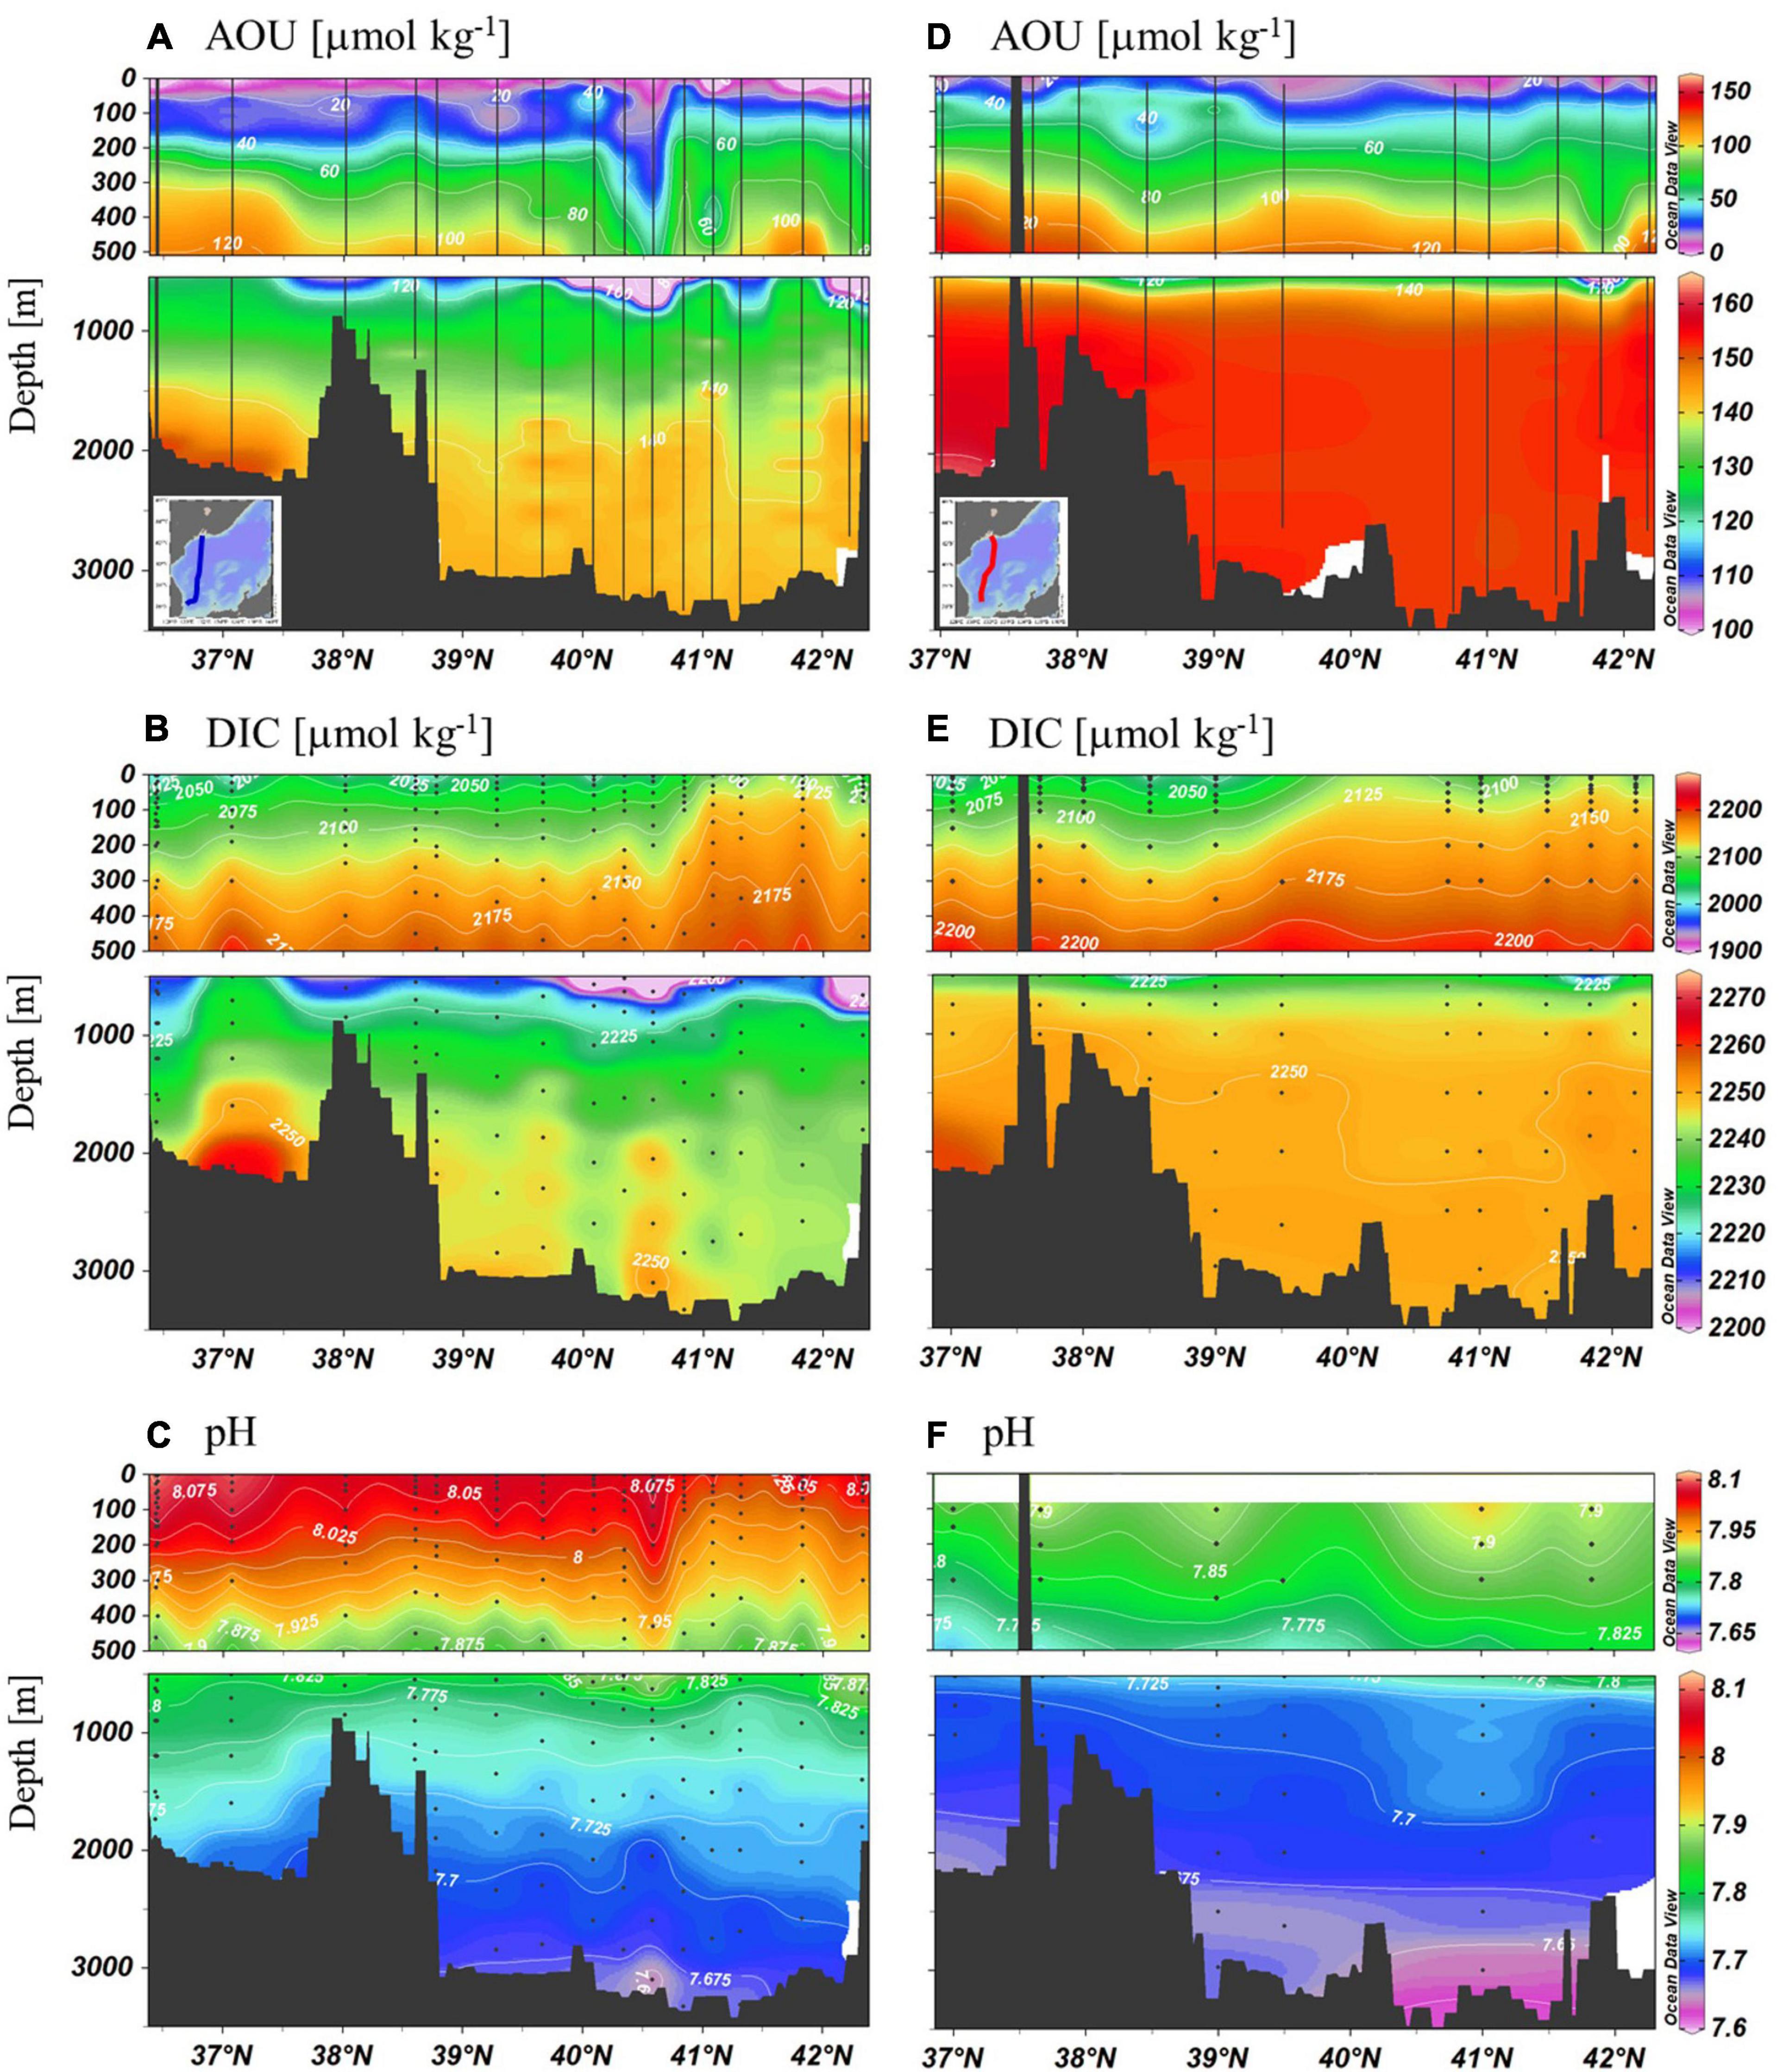
Figure 4. Meridional sections of AOU, DIC, and pH approximately along a north–south transect observed in 1999 (A–C) and in 2019 (D–F). Note the scale difference for the upper layer and the bottom layer. Blank area in panel (F) means no data.
We compared our data with the data obtained in 1992 (Chen et al., 1995) and 1999 (Talley et al., 2004) in the western part of the EJS (see stations in Figure 1). We binned the results to the layer between 500 and 1,000 m, and between 1,000 m and the bottom (Figure 5 and Supplementary Table 1). In the 500–1,000 m layer, AOU increased by 41 ± 6 and 38 ± 12 μmol kg–1 in the UB and JB, respectively, from 1992 to 2019 (here the uncertainties are standard deviation of the data within each depth bin). In comparison, in the deeper layer, AOU increased by 29 ± 7 and 19 ± 6 μmol kg–1 in the UB and JB, respectively, in the same period. DIC also increased by 31 ± 9 and 34 ± 11 μmol kg–1, in the UB and JB, respectively, in the 500–1,000 m layer. The increase in the deeper layer was 21 ± 8 and 21 ± 7 μmol kg–1 in UB and JB, respectively. In the JB the pH decreased by 0.10 ± 0.04 in the 500–1,000 m layer and 0.05 ± 0.04 in the deeper layer. The decreasing trend in the pH was generally in fair agreement with the trend reported by Chen et al. (2017). The observed values in 1999 were between the values observed in 1992 and 2019.
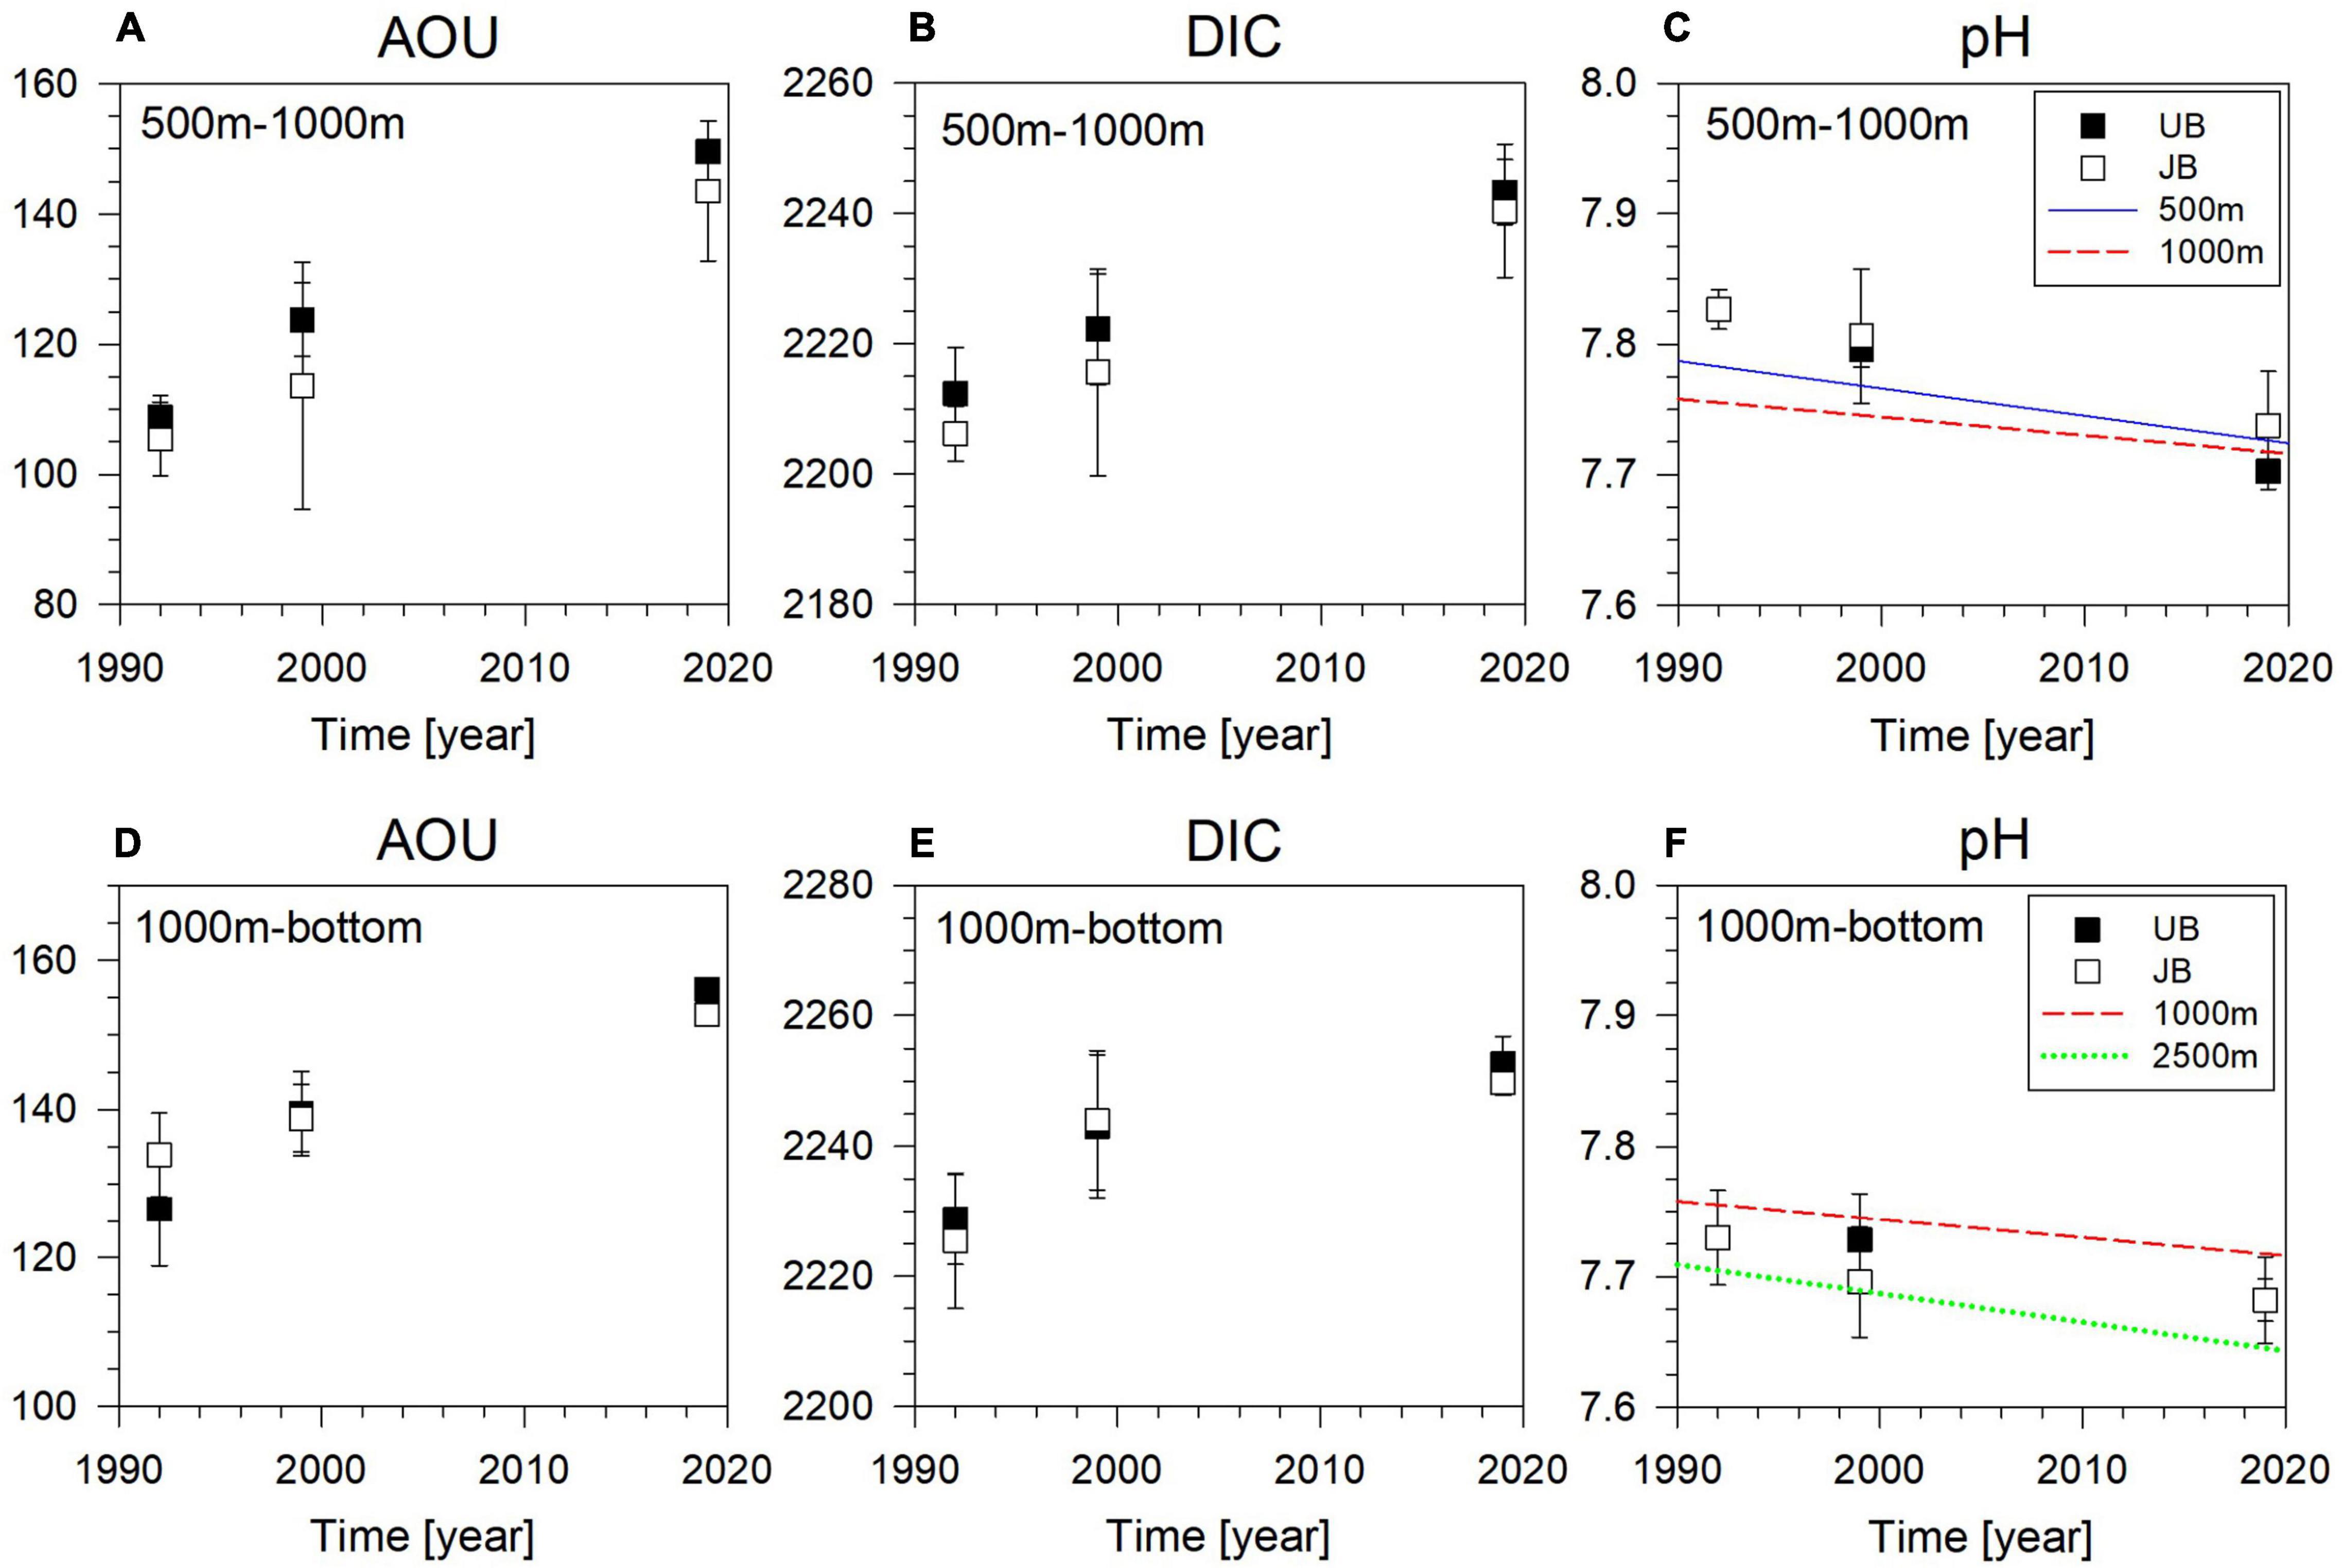
Figure 5. Temporal variations of AOU in μmol kg–1 (A,D), DIC (B,E) in μmol kg–1, and pH on the total hydrogen scale (C,F) in the 500–1,000 m layer (upper panels) and in the 1,000 m – bottom layer (lower panels) in the Ulleung Basin (UB, filled symbols) and the western Japan Basin (JB, open symbols). The error bars represent standard deviation of the data in each depth bin. The mean and standard deviations in the corresponding layer are plotted. Temporal trends for AOU and pH reported in Chen et al. (2017) are also shown for comparison (lines at each depth indicated in the figure legends).
From 1999 to 2019 the calcite saturation horizons shoaled from ∼1,260 to ∼720 m in the UB and from ∼1,190 to ∼740 m in the JB, respectively (Supplementary Table 2). In contrast, shoaling of the aragonite saturation horizon was small (∼130 m in the UB) or insignificant (in the JB).
Discussion
Characteristics of the Carbonate System in the East Japan Sea
Our current understanding of the deep water circulation in the EJS is that there is a rather fast horizontal circulation along isopycnal surfaces with a timescale of several years (this estimate was obtained from simple division of the approximate path length by the deep current velocities measured by moored instruments; Senjyu et al., 2005). Under the assumption that about 10% of the net primary production of 200 g C m–2year–1 (Yamada et al., 2005) is remineralized between depths of 1,000 and 2,000 m in the water column, organic matter decomposition would increase the DIC in this layer by ∼1 μmol kg–1 per year. Thus, our results, namely no significant difference in DIC and AOU between the JB and UB, also suggest the rapid transit of water mass from the JB to the UB.
In the ocean, DIC and AOU increase as the water mass ages from the North Atlantic to the North Pacific along the deep water circulation path. Because the EJS has a relatively short turnover time of a few hundred years, DIC and AOU are similar to those in the South Atlantic (Supplementary Figure 2). However, the DIC/TA ratio in the 1,000–3,000 m layer of the EJS (0.985 ± 0.002) is considerably higher than that in the South Atlantic (0.955 ± 0.002), and similar to that in the North Pacific (0.987 ± 0.010) (Supplementary Figure 2). The increase from the surface water to deep waters is much larger for DIC than TA in the EJS. The ΔDIC (i.e., DIC in deep waters minus that in the surface water) was ∼200 μmol kg–1 whereas the ΔTA was ∼30 μmol kg–1, resulting in ΔDIC/ΔTA values of ∼6.7, about twice those in the oceans (∼3.2) (Supplementary Figure 2). The net primary productivity at 200 g C m–2year–1 or greater in the EJS (Yamada et al., 2005; Kwak J. et al., 2013; Joo et al., 2014, 2016) is much higher than the global average (50–100 g C m–2 year–1, Eppley and Peterson, 1979), which drives the high rates of DIC supply. A high f-ratio (the ratio of export production to net primary productivity, an indicator of export efficiency of particulate organic carbon) has been reported for the UB (Kwak J.H. et al., 2013), implying that a large fraction of organic matter decomposition occurs below the euphotic layer. The small increase in TA can be qualitatively explained by the small contribution from calcifying plankton to the total plankton community (Kang et al., 2004; Kwak J.H. et al., 2013). The average annual CaCO3 flux at 1,000 m was 25 mg m–2day–1 (91 mmol C m–2year–1) in the eastern part of the EJS (Otosaka and Noriki, 2005) and 46 mg m–2day–1 (168 mmol C m–2year–1) in the UB (Kim et al., 2017). These values are comparable with the average values in the Atlantic and Pacific (ca. 121 mmol C m–2year–1; Honjo et al., 2008). However, because of the high flux of particulate organic carbon, the organic C to inorganic C molar ratio at 1,000 m of 4.3 in the UB (Kim et al., 2017) and 6.0 in the northeastern EJS (Otosaka and Noriki, 2005), are considerably higher than the average values of 1.1–1.3 recorded in the Atlantic and Pacific (Honjo et al., 2008). The carbonate chemistry of the EJS is similar to that in the eastern equatorial Pacific, where upwelling-enhanced high primary productivity supplies large amounts of organic matter to the subsurface, which is already vulnerable to acidification because of the high DIC/TA ratio (Bates, 2018).
Increase in Dissolved Inorganic Carbon and Acidification of Deep Waters
The DIC increased by 11 μmol kg–1 in the layer deeper than 500 m from 1999 to 2019. The DIC increase accompanied the commensurate increase in AOU with the ratio of ∼1.3, identical to the canonical ratio of 138:106 of the Redfield model. This observation indicates that the observed changes were mainly caused by organic matter decomposition for more extended time (i.e., slowed ventilation). Chen et al. (2017) examined the historical data of DO and estimated the pH in the EJS. They suggested that this rapid decrease in pH was caused mainly by the accumulation of CO2 supplied from organic matter decomposition, which was facilitated by the slowdown of deep water ventilation.
High values of DIC/TA correspond to low carbonate ion concentration and a small buffering capacity against acidification. This implies that acidification by CO2 supply from organic matter decomposition and anthropogenic CO2 invasion could be more serious in the interior of the EJS than in the Atlantic. Indeed, the decrease in pH of deep waters of the EJS is occurring more quickly than in the oceans (Chen et al., 2017). Shoaling of the calcite saturation horizon in the EJS has also been occurring at a faster rate than in the ocean (e.g., Feely et al., 2012). Further shoaling will affect calcifying organisms and may reduce CaCO3 production in the future. A reduced supply of alkalinity to deep waters causes the water to be more vulnerable to acidification and may form a positive feedback.
The progress of acidification should be monitored because other factors may also affect the acidification of the EJS. Luo and Boudreau (2016) projected that the EJS will become completely undersaturated with regard to calcite, with the saturation horizons reaching a depth of 200 m by the year 2050 and therefore, earlier than that with regard to aragonite. Our results show that the calcite saturation horizon has been shoaling very rapidly, which is consistent with the modeling result. However, a source of uncertainty in terms of the shoaling of the aragonite saturation horizon comes from the role of the intermediate water that forms in the western JB and flows south into the UB (Kim et al., 2004). Shoaling of the aragonite saturation horizon from 1992 to 2019 was rather small compared to that of calcite (Supplementary Table 2). The intermediate water lies in the 200–400 m layer (Yoon and Kawamura, 2002), where the current aragonite saturation horizon is positioned. The strength of the intermediate water formation probably affects the saturation state of aragonite (Feely et al., 1984). Nonetheless, absorption of anthropogenic CO2 will decrease the aragonite saturation state of the intermediate water.
Summary and Implications
Despite the similarity of the AOU and DIC levels in the deep EJS to those in the South Atlantic, the EJS carbonate chemistry resembles that of the North Pacific, where the DIC/TA ratio is high and the deep water is vulnerable to acidification. This emphasizes the importance of local biology in determining the carbonate chemistry of a marginal sea (Luo and Boudreau, 2016). Carbonate saturation horizons are much shallower in the EJS than in the South Atlantic despite the similar deep water ages. The large DIC supply caused by the high primary production and export in conjunction with low CaCO3 export to the interior of the EJS are responsible for the observed difference between the EJS and the South Atlantic. Acidification in the interior of the EJS is occurring at a fast rate. The observed acidification in the EJS has been caused mainly by accumulation of CO2 from organic matter decomposition, which was facilitated by the slowdown of ventilation (Chen et al., 2017). We observed a considerable increase in DIC from 1999 to 2019 in the whole water column below the upper 500 m layer with a commensurate increase in AOU. Chen et al. (2017) projected rapid acidification of the interior of the EJS for the near future based on the empirical temporal trend in pH. One recently reported element of uncertainty in the projection of deep water acidification is the reinitiation of Bottom Water formation and enhancement of deep water ventilation (Yoon et al., 2018). If deep water ventilation is enhanced, it may slowdown the rate of acidification or even reverse it. Thus, the carbonate system in the EJS warrants continued attention especially in conjunction with the variation in deep water ventilation.
Data Availability Statement
The original contributions presented in the study are included in the article/Supplementary Material, further inquiries can be directed to the corresponding author.
Author Contributions
TN prepared the manuscript for Frontiers in Marine Science with JH’s advise. S-YK and SJ helped sampling on board and analysis of samples. TR and TL gave comments for discussion on the manuscript. All authors contributed to the article and approved the submitted version.
Funding
This research forms part of the “Deep Water Circulation and Material Cycling in the East Sea (20160400)” project funded by the Ministry of Oceans and Fisheries, South Korea.
Conflict of Interest
The authors declare that the research was conducted in the absence of any commercial or financial relationships that could be construed as a potential conflict of interest.
Publisher’s Note
All claims expressed in this article are solely those of the authors and do not necessarily represent those of their affiliated organizations, or those of the publisher, the editors and the reviewers. Any product that may be evaluated in this article, or claim that may be made by its manufacturer, is not guaranteed or endorsed by the publisher.
Acknowledgments
We thank Guebuem Kim, SungHyun Nam, Doshik Hahm, and Yang-Ki Cho for discussion on the manuscript. Kyung-Ryul Kim and Kyung-Il Chang for their leadership in the earlier research of the East Sea. Vyacheslav Lobanov for coordination of the Korea–Russia joint research. We also thank the captains and crews of R/V Akademik Oparin for their help at sea.
Supplementary Material
The Supplementary Material for this article can be found online at: https://www.frontiersin.org/articles/10.3389/fmars.2022.825206/full#supplementary-material
Supplementary Figure 1 | A cross plot of AOU and DIC observed in 2019. The data in the upper 200 m layer in the Ulleung Basin (M4–M10) are plotted in blue circles. The red square indicates the data near the seafloor in the Ulleung Basin.
Supplementary Figure 2 | Vertical distribution of (A) AOU, (B) nDIC, (C) nTA, and (D) molar ratio of DIC/TA in the EJS and at each site representing the North Atlantic (St. 191; 31.95°N, 26.26°W), South Atlantic (St. 31; 47.00°S, 32.13°W), and North Pacific (St. 71; 37.98°N, 166.46°E).
Footnotes
References
Bates, N. R. (2018). Seawater carbonate chemistry distributions across the Eastern South Pacific Ocean sampled as part of the GEOTRACES project and changes in marine carbonate chemistry over the past 20 years. Front. Mar. Sci. 5:398. doi: 10.3389/fmars.2018.00398
Chen, C.-T. A., Lui, H.-K., Hsieh, C.-H., Yanagi, T., Kosugi, N., Ishii, M., et al. (2017). Deep oceans may acidify faster than anticipated due to global warming. Nat. Clim. Chang. 7, 890–894. doi: 10.1038/s41558-017-0003-y
Chen, C. T. A., Wang, S. L., and Bychkov, A. S. (1995). Carbonate chemistry of the Sea of Japan. J. Geophys. Res. Oceans 100, 13737–13745. doi: 10.1029/95JC00939
Clayton, T. D., and Byrne, R. H. (1993). Spectrophotometric seawater pH measurements: total hydrogen ion concentration scale calibration of m-cresol purple and at-sea results. Deep Sea Res. Part I Oceanogr. Res. Pap. 40, 2115–2129. doi: 10.1016/0967-0637(93)90048-8
Dickson, A., and Millero, F. J. (1987). A comparison of the equilibrium constants for the dissociation of carbonic acid in seawater media. Deep Sea Res. Part A Oceanogr. Res. Pap. 34, 1733–1743. doi: 10.1016/0198-0149(87)90021-5
Dickson, A. G., Sabine, C. L., and Christian, J. R. (2007). Guide to best practices for ocean CO2 measurements. Sidney, British Columbia: North Pacific Marine Science Organization.
Eppley, R. W., and Peterson, B. J. (1979). Particulate organic matter flux and planktonic new production in the deep ocean. Nature 282, 677–680. doi: 10.1038/282677a0
Feely, R. A., Byrne, R. H., Betzer, P. R., Gendron, J. F., and Acker, J. G. (1984). Factors influencing the degree of saturation of the surface and intermediate waters of the North Pacific Ocean with respect to aragonite. J. Geophys. Res. Oceans 89, 10631–10640. doi: 10.1029/JC089iC06p10631
Feely, R. A., Sabine, C. L., Byrne, R. H., Millero, F. J., Dickson, A. G., Wanninkhof, R., et al. (2012). Decadal changes in the aragonite and calcite saturation state of the Pacific Ocean. Glob. Biogeochem. Cycles 26:GB3001. doi: 10.1029/2011GB004157
Honjo, S., Manganini, S. J., Krishfield, R. A., and Francois, R. (2008). Particulate organic carbon fluxes to the ocean interior and factors controlling the biological pump: a synthesis of global sediment trap programs since 1983. Prog. Oceanogr. 76, 217–285. doi: 10.1016/j.pocean.2007.11.003
Joo, H., Park, J. W., Son, S., Noh, J. H., Jeong, J. Y., Kwak, J. H., et al. (2014). Long-term annual primary production in the Ulleung Basin as a biological hot spot in the East/Japan Sea. J. Geophys. Res. Oceans 119, 3002–3011. doi: 10.1002/2014jc009862
Joo, H., Son, S., Park, J.-W., Kang, J. J., Jeong, J.-Y., Lee, C. I., et al. (2016). Long-term pattern of primary productivity in the East/Japan Sea based on ocean color data derived from MODIS-aqua. Remote Sens. 8:25. doi: 10.3390/rs8010025
Kang, J.-H., Kim, W.-S., Chang, K.-I., and Noh, J.-H. (2004). Distribution of plankton related to the mesoscale physical structure within the surface mixed layer in the southwestern East Sea. Korea. J. Plankton Res. 26, 1515–1528. doi: 10.1093/plankt/fbh140
Kang, D. J., Kim, Y. B., and Kim, K. R. (2010). Dissolved oxygen at the bottom boundary layer of the Ulleung Basin. East Sea. Ocean Polar Res. 32, 439–448. doi: 10.4217/opr.2010.32.4.439
Kawamura, H., and Wu, P. (1998). Formation mechanism of Japan Sea Proper Water in the flux center off Vladivostok. J. Geophys. Res. Oceans 103, 21611–21622. doi: 10.1029/98jc01948
Key, R. M., Olsen, A., van Heuven, S., Lauvset, S. K., Velo, A., Lin, X., et al. (2015). Global ocean data analysis project, version 2 (GLODAPv2). Ornl/Cdiac 162, Nd–093. Oak Ridge, Tenesse: Carbon Dioxide Information Analysis Center, Oak Ridge National Laboratory, US Department of Energy.
Kim, J.-Y., Kang, D.-J., Lee, T., and Kim, K.-R. (2014). Long-term trend of CO2 and ocean acidification in the surface water of the Ulleung Basin, the East/Japan Sea inferred from the underway observational data. Biogeosciences 11, 2443–2454. doi: 10.5194/bg-11-2443-2014
Kim, K., Kim, K.-R., Kim, Y.-G., Cho, Y.-K., Kang, D.-J., Takematsu, M., et al. (2004). Water masses and decadal variability in the East Sea (Sea of Japan). Progr. Oceanogr. 61, 157–174. doi: 10.1016/j.pocean.2004.06.003
Kim, K., Kim, K. R., Min, D. H., Volkov, Y., Yoon, J. H., and Takematsu, M. (2001). Warming and structural changes in the East (Japan) Sea: a clue to future changes in global oceans? Geophys. Res. Lett. 28, 3293–3296. doi: 10.1029/2001gl013078
Kim, K. R., Kim, G., Kim, K., Lobanov, V., Ponomarev, V., and Salyuk, A. (2002). A sudden bottom-water formation during the severe winter 2000–2001: the case of the East/Japan Sea. Geophys. Res. Lett. 29, 75-1–75-4. doi: 10.1029/2001GL014498
Kim, K.-R., and Kim, K. (1996). What is happening in the East Sea (Japan Sea)?: recent chemical observations during CREAMS 93-96. J. Korean Soc. Oceanogr. 31, 164–172.
Kim, M., Hwang, J., Rho, T., Lee, T., Kang, D.-J., Chang, K.-I., et al. (2017). Biogeochemical properties of sinking particles in the southwestern part of the East Sea (Japan Sea). J. Mar. Syst. 167, 33–42. doi: 10.1016/j.jmarsys.2016.11.001
Kim, T. W., Lee, K., Feely, R. A., Sabine, C. L., Chen, C. T. A., Jeong, H. J., et al. (2010). Prediction of Sea of Japan (East Sea) acidification over the past 40 years using a multiparameter regression model. Glob. Biogeochem. Cycles 24:GB3005. doi: 10.1029/2009GB003637
Kumamoto, Y. I., Yoneda, M., Shibata, Y., Kume, H., Tanaka, A., Uehiro, T., et al. (1998). Direct observation of the rapid turnover of the Japan Sea bottom water by means of AMS radiocarbon measurement. Geophys. Res. Lett. 25, 651–654. doi: 10.1029/98GL00359
Kwak, J., Lee, S., Park, H., Choy, E., Jeong, H., Kim, K., et al. (2013). Monthly measured primary and new productivities in the Ulleung Basin as a biological” hot spot” in the East/Japan Sea. Biogeosciences 10, 4405–4417. doi: 10.5194/bg-10-4405-2013
Kwak, J. H., Hwang, J., Choy, E. J., Park, H. J., Kang, D.-J., Lee, T., et al. (2013). High primary productivity and f-ratio in summer in the Ulleung basin of the East/Japan Sea. Deep Sea Res. Part I Oceanogr. Res. Pap. 79, 74–85. doi: 10.1016/j.dsr.2013.05.011
Lewis, E. R., and Wallace, D. W. R. (1998). Program developed for CO2 system calculations (No. cdiac: CDIAC-105). Environmental System Science Data Infrastructure for a Virtual Ecosystem. Oak Ridge: U.S. Department of Energy Office of Scientific and Technical Information
Liu, X., Patsavas, M. C., and Byrne, R. H. (2011). Purification and characterization of meta-cresol purple for spectrophotometric seawater pH measurements. Environ. Sci. Technol. 45, 4862–4868. doi: 10.1021/es200665d
Luo, Y., and Boudreau, B. P. (2016). Future acidification of marginal seas: a comparative study of the Japan/East Sea and the South China Sea. Geophys. Res. Lett. 43, 6393–6401.
Mehrbach, C., Culberson, C., Hawley, J., and Pytkowicx, R. (1973). Measurement of the apparent dissociation constants of carbonic acid in seawater at atmospheric pressure 1. Limnol. Oceanogr. 18, 897–907. doi: 10.4319/lo.1973.18.6.0897
Min, D.-H., and Warner, M. J. (2005). Basin-wide circulation and ventilation study in the East Sea (Sea of Japan) using chlorofluorocarbon tracers. Deep Sea Res. Part II Top. Stud. Oceanogr. 52, 1580–1616. doi: 10.1016/j.dsr2.2003.11.003
Olsen, A., Key, R. M., Van Heuven, S., Lauvset, S. K., Velo, A., Lin, X., et al. (2016). The Global Ocean Data Analysis Project version 2 (GLODAPv2)–an internally consistent data product for the world ocean. Earth Syst. Sci. Data 8, 297–323. doi: 10.5194/essd-8-297-2016
Orr, J. C., Epitalon, J. M., and Cattuso, J. P. (2018). Routine uncertainty propagation for the marine carbon dioxide system. Mar. Chem. 207, 84–107. doi: 10.1016/j.marchem.2018.10.006
Otosaka, S., and Noriki, S. (2005). Relationship between composition of settling particles and organic carbon flux in the western North Pacific and the Japan Sea. J. Oceanogr. 61, 25–40. doi: 10.1007/s10872-005-0017-3
Park, G. H., Lee, K., and Tishchenko, P. (2008). Sudden, considerable reduction in recent uptake of anthropogenic CO2 by the East/Japan Sea. Geophys. Res. Lett. 35:L23611. doi: 10.1029/2008GL036118
Park, G. H., Lee, K., Tishchenko, P., Min, D. H., Warner, M. J., Talley, L. D., et al. (2006). Large accumulation of anthropogenic CO2 in the East (Japan) Sea and its significant impact on carbonate chemistry. Glob. Biogeochem. Cycles 20:GB4013. doi: 10.1029/2005GB002676
Senjyu, T., Shin, H.-R., Yoon, J.-H., Nagano, Z., An, H.-S., Byun, S.-K., et al. (2005). Deep flow field in the Japan/East Sea as deduced from direct current measurements. Deep Sea Res. Part II Top. Stud. Oceanogr. 52, 1726–1741.
Senjyu, T., and Sudo, H. (1993). Water characteristics and circulation of the upper portion of the Japan Sea Proper Water. J. Mar. Syst. 4, 349–362. doi: 10.1016/0924-7963(93)90029-L
Talley, L. D., Lobanov, V., Ponomarev, V., Salyuk, A., Tishchenko, P., Zhabin, I., et al. (2003). Deep convection and brine rejection in the Japan Sea. Geophys. Res. Lett. 30:1159. doi: 10.1029/2002GL016451
Talley, L. D., Tishchenko, P., Luchin, V., Nedashkovskiy, A., Sagalaev, S., Kang, D.-J., et al. (2004). Atlas of Japan (East) Sea hydrographic properties in summer, 1999. Prog. Oceanogr. 61, 277–348. doi: 10.1016/j.pocean.2004.06.011
Tsunogai, S., Watanabe, Y. W., Harada, K., Watanabe, S., Saito, S., and Nakajima, M. (1993). Dynamics of the Japan Sea deep water studied with chemical and radiochemical tracers. Elsevier Oceanogr. Ser. 59, 105–119. doi: 10.1016/S0422-9894(08)71321-7
Yamada, K., Ishizaka, J., and Nagata, H. (2005). Spatial and temporal variability of satellite primary production in the Japan Sea from 1998 to 2002. J. Oceanogr. 61, 857–869. doi: 10.1007/s10872-006-0005-2
Yoon, J.-H., and Kawamura, H. (2002). The formation and circulation of the intermediate water in the Japan Sea. J. Oceanogr. 58, 197–211. doi: 10.1073/pnas.2000658117
Keywords: dissolved inorganic carbon, acidification, carbonate saturation horizon, deep-water ventilation, apparent oxygen utilization (AOU)
Citation: Na T, Hwang J, Kim S-Y, Jeong S, Rho TK and Lee T (2022) Large Increase in Dissolved Inorganic Carbon in the East Sea (Japan Sea) From 1999 to 2019. Front. Mar. Sci. 9:825206. doi: 10.3389/fmars.2022.825206
Received: 30 November 2021; Accepted: 20 January 2022;
Published: 14 February 2022.
Edited by:
Selvaraj Kandasamy, Xiamen University, ChinaReviewed by:
Chen-tung Arthur Chen, National Sun Yat-sen University, TaiwanToste Tanhua, GEOMAR Helmholtz Center for Ocean Research Kiel, Helmholtz Association of German Research Centres (HZ), Germany
Copyright © 2022 Na, Hwang, Kim, Jeong, Rho and Lee. This is an open-access article distributed under the terms of the Creative Commons Attribution License (CC BY). The use, distribution or reproduction in other forums is permitted, provided the original author(s) and the copyright owner(s) are credited and that the original publication in this journal is cited, in accordance with accepted academic practice. No use, distribution or reproduction is permitted which does not comply with these terms.
*Correspondence: Jeomshik Hwang, amVvbXNoaWtAc251LmFjLmty