 Fredrik Ryderheim
 Per Juel Hansen
 Thomas Kiørboe
- 1Centre for Ocean Life, DTU Aqua, Technical University of Denmark, Kgs. Lyngby, Denmark
- 2Marine Biological Section, University of Copenhagen, Helsingør, Denmark
Colony formation in marine phytoplankton can be modified by the presence of grazers, but the effect of colony size and shape on the feeding behavior of grazers is still relatively unknown. To explore the defensive role of colony formation, we examined the feeding response of three differently sized grazers (copepodites, copepod nauplii, and two heterotrophic dinoflagellates) feeding on colony-forming phytoplankton, using both direct video observations and bottle incubations. We found a dramatic increase in capture clearance rate with colony size for copepodites, up to 140% higher in the largest diatom chains relative to their solitary cells. This was in part facilitated by a mechanism – described here for the first time – by which copepods efficiently detect and capture colonies using the antennules, thereby increasing their capture radius. Prey handling time by copepodites increased with colony size, but did not limit prey ingestion. Larger chains of diatoms were efficiently handled and consumed by the copepodites, whereas larger spherical colonies of Phaeocystis globosa were rejected subsequent to capture. In contrast, colonial phytoplankton were better protected against the microzooplankton and copepod nauplii examined, since these only managed to consume smaller colonies equivalent of a few cells. We find that the defensive value of colony formation depends on the size and foraging behavior of the grazer and the size and shape of the colony. Thus, the defensive benefit is therefore a function of the composition of the grazer community. We argue that bloom formation in chain-forming diatoms is facilitated by the efficient protection against rapidly responding micro-grazers and the lagged numerical response of efficient copepod grazers.
Introduction
Many phytoplankton species form colonies of different shapes and sizes that allow individual species to cover a wide size spectrum (Finkel et al., 2010; Sommer et al., 2016). Single cells of Phaeocystis globosa are just a few micrometers in size but may form spherical colonies up to a centimeter in diameter, while diatoms can form chains consisting of micron-sized cells that have been observed in situ to reach centimeters in length (Ohman, 2019). Chain- and colony formation has potential implications to a range of important life-functions, including nutrient acquisition (Pahlow et al., 1997; Musielak et al., 2009), swimming and vertical migration capability (Selander et al., 2011; Lovecchio et al., 2019), and predation risk (Pančić and Kiørboe, 2018). However, colony formation often comes with costs, most notably reduced phytoplankton growth rate (e.g. Wang et al., 2015; Albini et al., 2019; Kapsetaki and West, 2019). Thus, the production and fate of phytoplankton may be partly governed by their ability to form colonies.
Several abiotic factors may influence phytoplankton size and colony formation (Kenitz et al., 2020), but the main driver seems to be related to predation risk (Selander et al., 2019). Phytoplankton size and colony formation may change in response to grazers, and thus the plasticity in size has often been interpreted as a defense mechanism since it may bring the phytoplankton outside the prey size spectrum of a dominating predator (Pančić and Kiørboe, 2018). Single-celled dinoflagellates and diatoms may reduce their cell volume by up to 25% after exposure to chemical exudates from copepods (Grønning and Kiørboe, 2020; Ryderheim et al., 2021). Similarly, colonies can split up in response to both direct presence and chemical cues released by copepods, as seen in some chain-forming diatoms (Bergkvist et al., 2012; Selander et al., 2019; Rigby and Selander, 2021), dinoflagellates (Selander et al., 2011), and P. globosa (Long et al., 2007; Lundgren and Granéli, 2010).
Conversely, colony formation may be promoted by the presence of grazers (or their cues) that feed on smaller prey. In P. globosa, for example, the fraction of cells found in colonies increase when cells are exposed to ciliates or heterotrophic dinoflagellates (Jakobsen and Tang, 2002; Long et al., 2007). Similar results have been found for freshwater green algae exposed to Daphnia (Hessen and Van Donk, 1993; Lürling and Van Donk, 2000). In several cases, reduced grazing on phytoplankton that respond to grazer cues have been reported (reviewed by Pančić and Kiørboe, 2018; Lürling, 2021), and the optimal response of the phytoplankton therefore depends on the predator field (Long et al., 2007; Bjærke et al., 2015; Kenitz et al., 2020). Indeed, the relative abundances of solitary vs chain-forming diatom cells have been demonstrated to vary seasonally and in ways that may be consistent with the seasonally variable predator field (Bjærke et al., 2015; Kenitz et al., 2020).
While the plastic response to grazer cues in colony-forming phytoplankton is well documented, the expected reduction in grazing mortality has not been thoroughly examined, and only in ‘black box’ bottle-incubation experiments (e.g. Long et al., 2007; Bergkvist et al., 2012). Thus, the mechanism of reduced grazing mortality of responding cells is unknown. Are changes due to changes in encounter or capture rate, prey-handling time, and/or due to size-dependent prey selection? Prey size spectra have been recorded for multiple phytoplankton grazers, ranging from flagellates to copepods, and these spectra are typically dome-shaped and with optima that may vary between species and zooplankton group. Thus, optimum predator:prey size ratios range between 1:1 in heterotrophic dinoflagellates, 8:1 in oligotrich ciliates, and 30:1 in copepods (Hansen et al., 1994; Kiørboe, 2016). However, such prey size spectra are typically recorded using near-spherical prey and therefore may not predict grazing, for example, on elongated diatom chains.
Here, we explore the effect of phytoplankton colony size and shape on the feeding behavior of a feeding-current feeding copepod (Temora longicornis) and two direct-engulfing heterotrophic dinoflagellates (Oxyrrhis marina and Gyrodinium dominans) using high-speed video recordings. We supplement the direct observations with bottle incubation experiments with copepod nauplii and microzooplankton. We describe, for the first time, a novel mechanism by which Temora copepodites efficiently detect and capture large colonies and how captured colonies are handled, consumed, or rejected dependent on colony size and shape. We further describe how the different microzooplankton capture and handle prey and demonstrate their inability to consume larger colonies.
Materials and Methods
Experimental Organisms
The phytoplankton prey used in the experiments varied in cell size and colony shape (Table 1). The diatoms Chaetoceros affinis, Chaetoceros sp., Thalassiosira nordenskioeldii, and Skeletonema marinoi were grown in B1 medium (Hansen, 1989) with added silica at salinity 30 psu, 16°C, and an irradiance of ~100 µmol photons m−2 s−1 on a 12:12 light:dark cycle. Phaeocystis globosa was grown in TL30 medium (salinity 30 psu), at 20°C and the same light intensity.
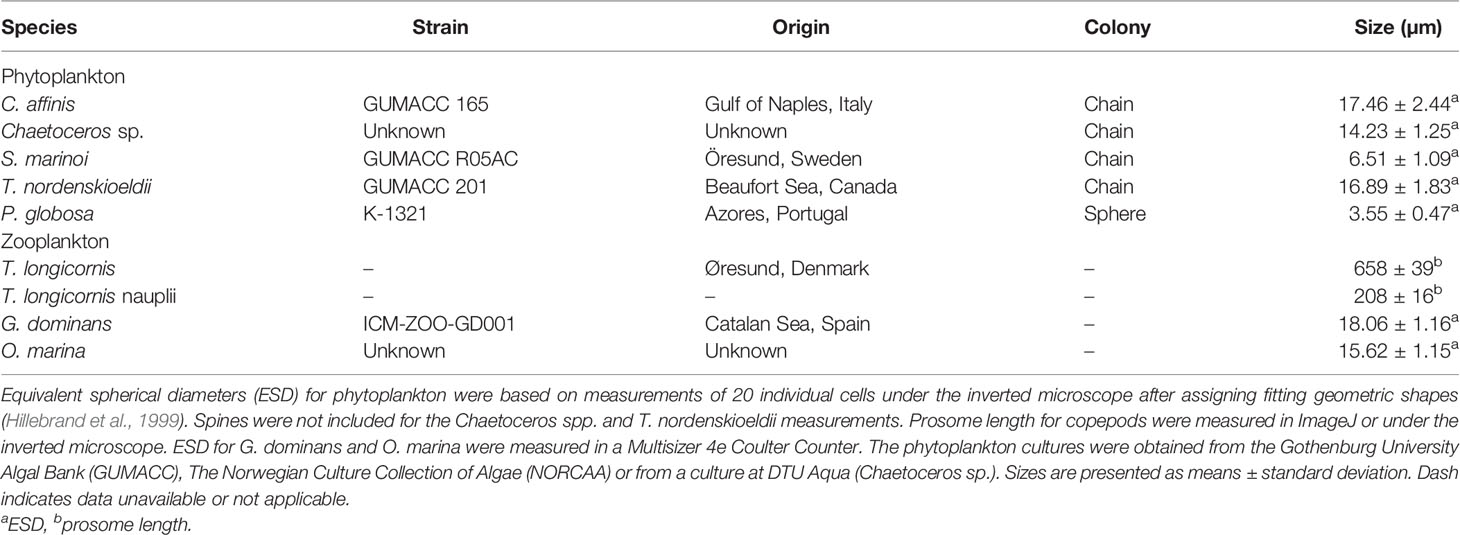
Table 1 Phytoplankton prey and zooplankton grazers used in the experiments.
The heterotrophic dinoflagellates Oxyrrhis marina and Gyrodinium dominans were kept at 16°C in dim light on a diet of Rhodomonas salina prior to experiments. The copepod Temora longicornis was obtained from a continuous culture kept on a phytoplankton mixture of R. salina, Thalassioria weissflogii, Heterocapsa triquetra, and O. marina at salinity 30 and temperature 16°C. Temora nauplii were acquired by adding adults to a new tank. After 48 h, the adults were removed and eggs/hatched nauplii were moved to a new tank with food (R. salina) in excess. We let nauplii grow until the desired length (~200 µm) was reached.
Filming Foraging Copepods and Dinoflagellates
Individual female copepodites were glued to a human hair by their dorsal surface (Xu et al., 2017), and starved overnight in darkness at the same temperature and salinity as the cultures. The untethered end of the hair was glued to a micromanipulator and the copepod was submerged in a 10×10×10 cm3 aquarium with filtered seawater. A known volume of phytoplankton culture was added and a magnetic stirrer was used to gently mix the water and keep cells and colonies in suspension. Copepodites were recorded using a Phantom V210 high-speed camera (Vision Research, New Jersey, USA) equipped with optics to provide a field of view of approximately 1.9 × 1.5 mm2. Collimated infrared light was the only source of illumination and was shined through the aquarium towards the camera. All filming took place in a temperature-controlled room (16°C) in the dark.
The chain length and colony size distribution and abundance of added phytoplankton cells were determined by fixing a volume of the added phytoplankton culture in Lugol’s solution (final concentration 1% for diatoms, 4% for P. globosa). Diatom abundance and chain length distribution (cells chain−1) was determined in an inverted microscope after letting cells settle in a Sedgewick Rafter chamber. We measured chain lengths as cells chain−1 to allow for grouping of different size classes. These were then converted into actual sizes (µm) using length-cells relationships (Figure S1) in order to compare the different species. P. globosa colonies were photographed in the inverted microscope and the equivalent spherical diameter (ESD) distribution was analyzed with ImageJ version 1.47t (National Institutes of Health, USA).
To estimate the capture rate of different phytoplankton colony sizes, 71 s video sequences were recorded at 100 frames per second (fps), and the number of prey captures recorded. Between three and five copepods feeding on the same suspension were used for the recordings of each phytoplankton prey species but the results were pooled to improve the resolution. The copepods were recorded sequentially. The P. globosa experiment was repeated with a different prey size distribution due to an inadequate amount of prey captures in the first one. Sphere size or chain lengths (cells chain−1, later converted to µm as above) of captured prey were measured on the video images using ImageJ. Following a capture response by the copepod, we distinguished between ‘ingestion’ (prey was successfully ingested), ‘rejection’ (prey was rejected after handling), and ‘lost’ (prey lost while handling). The volumetric prey capture rate (mL copepod−1 h−1) on each colony size was then calculated by dividing the capture rate by the abundance of each colony size. We will refer to this rate as “capture clearance rate”. This volumetric capture rate is identical to the clearance rate estimated in incubation experiments only if all captured prey are consumed. Thus, the “ingestion clearance rate” is calculated by multiplying the capture clearance rate with the fraction of caught cells that were ingested. The capture clearance rate on single cells of P. globosa was not quantified as they are generally too small for T. longicornis (Gonçalves et al., 2014). Roughly 40 minutes of video was recorded for each species, which resulted in between 260 and 840 prey captures.
To determine the relationship between colony size and handling time, observations of prey capture events with varying colony sizes were recorded at 600 (P. globosa) or 1000 (diatoms) fps. In these observations, each prey particle was individually measured (both length [µm] and cells chain−1) on the video image. Handling time was defined as the time from first reaction until the copepod returned to normal feeding behavior following ingestion or rejection of the prey (Tiselius et al., 2013; Gonçalves et al., 2014).
Additional filming were made of free-swimming copepod nauplii and dinoflagellates to observe their behavioral response to colonies of various sizes and shapes. For nauplii, we used the same camera set-up as above but with lenses that yielded a field of view of 2.1 × 1.3 mm2. Nauplii and prey were added to a small cuvette that was placed in front of the camera. Occasionally the cuvette was gently turned to re-suspend prey particles. Short sequences of G. dominans were recorded at 100 fps using a high-speed camera (Phantom Miro 320) attached to an Olympus IX71 inverted microscope. These video recordings were insufficient to estimate clearance rates that was instead estimated in bottle incubation experiments.
Bottle Incubations With Copepod Nauplii and Dinoflagellates
We performed bottle incubations with T. longicornis nauplii, O. marina or G. dominans to measure clearance rates on different colony sizes of C. affinis, T. nordenskioldii (only copepod nauplii), and S. marinoi. Prey cells were added to glass bottles (50 mL for nauplii, 25 mL for dinoflagellates) at low, non-saturating densities (ca. 1.5×10⁶, 0.7×10⁶, and 1.0×106 µm3 mL−1 for nauplii, O. marina, and G. dominans experiments, respectively). Nauplii (15 per bottle) were individually picked and added to bottles while dinoflagellates (100 mL−1) were washed in FSW and added via pipette to the suspension. Subsamples withdrawn for determination of initial phytoplankton- and grazer abundances and phytoplankton size spectra were immediately fixed in Lugol’s solution (1%), where after the bottles were incubated at 16°C for 24 h in darkness on a slowly rotating (~1 rpm) plankton wheel. Three bottles had grazers and three were used as grazer-free controls. At the end of the incubations the contents of the bottles were fixed with Lugol’s solution. The grazers were enumerated in the entire volume (nauplii), or in subsamples of at least 200 cells (dinoflagellates), and the density and size spectra of prey were determined in Sedgewick Rafter chambers or Utermöhl settling chambers under the microscope as above. Clearance and ingestion rates on different colony sizes were calculated according to Frost (1972) and Heinbokel (1978).
Results
Both nauplii and copepodites of Temora longicornis produce a feeding current from which prey is harvested. Prey cells and colonies are perceived individually by the setae on the feeding appendages and captured by the feeding appendages as described earlier for both feeding-current feeding copepodites and nauplii (e.g. Bruno et al., 2012; Tiselius et al., 2013) and demonstrated in online Videos S1, S2. In addition to this well-known prey capture behavior, we discovered a novel mechanism. When offered chains or colonies, copepodites of T. longicornis may use the antennules to perceive and capture prey. With chain-forming diatoms, the copepod respond to prey that is near or touching the setae on the antennules and then use its antennule to “swing” the prey into the feeding current where it is handled by the feeding appendages (Figure 1; Video S1). With colonies of P. globosa, the antennae-capture process was slightly different. When a Phaeocystis colony on occasion encountered the copepod antennule close to its base, the copepod use one or two antennules to “beat” the colony down into the feeding current where it subsequently is handled by the feeding appendages (Video S1).
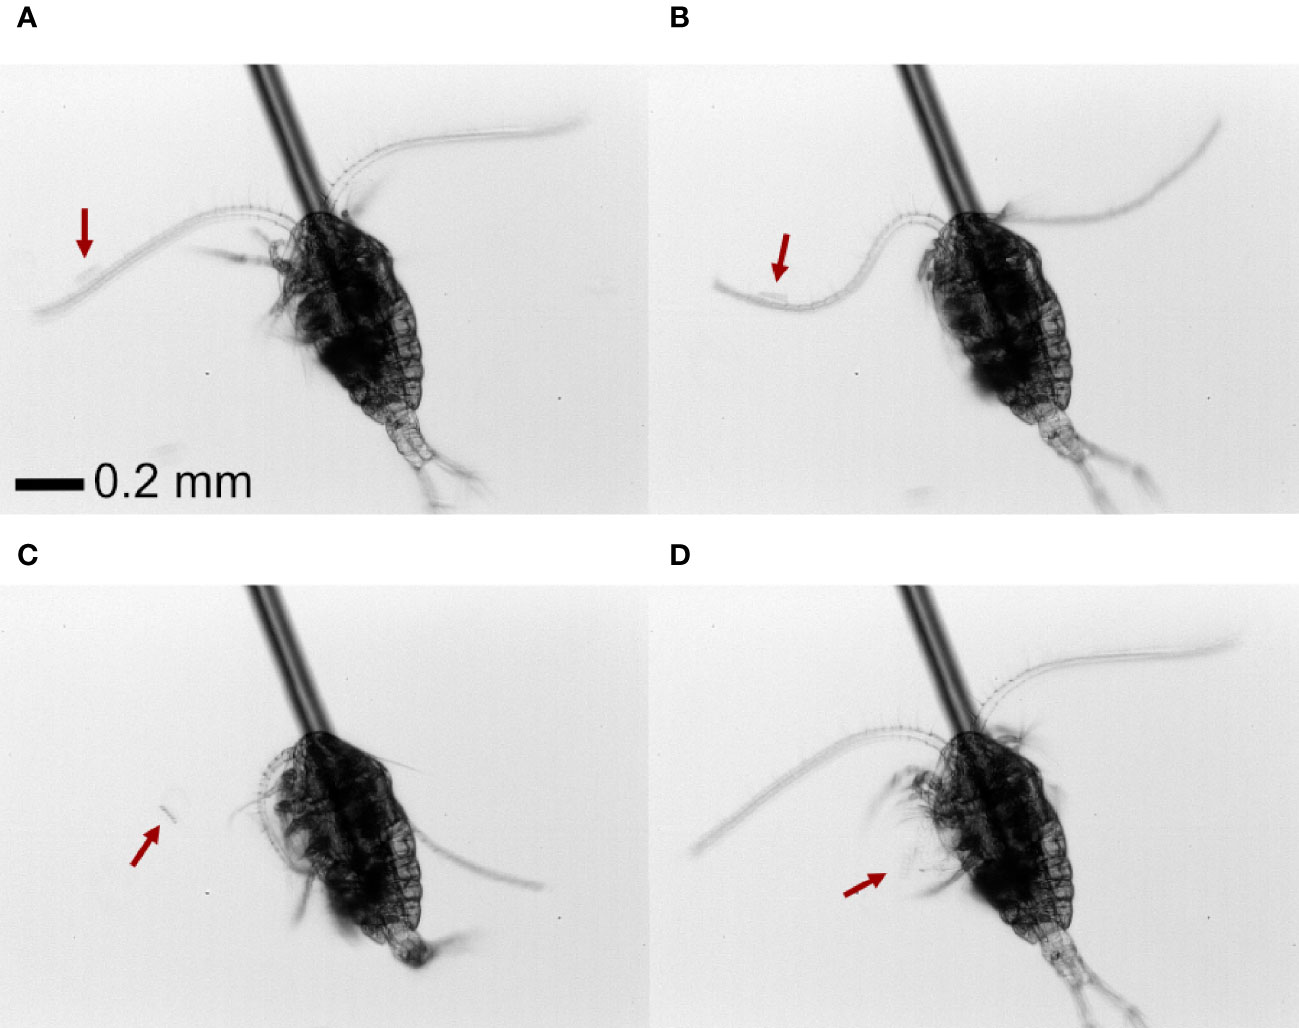
Figure 1 Front view of (A) a T. nordenskioldii diatom chain (~60 µm length) coming into contact with the antennae of a T. longicornis copepod. (B) The copepod swings the antennae, (C, D) moving the chain towards the feeding current and feeding appendages. The position of the chain is indicated by the red arrow.
Copepodite Grazing on Colonies
The capture clearance rate increased dramatically with colony size but with distinct differences between prey species (Figures 2A–E). The two Chaetoceros spp. were cleared at the highest rate among the four diatoms (Figures 2A, B), followed by T. nordenskioeldii (Figure 2C) and S. marinoi (Figure 2D). The capture clearance rate on P. globosa was near constant for colonies up to 100 µm ESD, but then tripled for the largest colonies (Figure 2E). The size-distributions of colonies are shown in Figure S2.
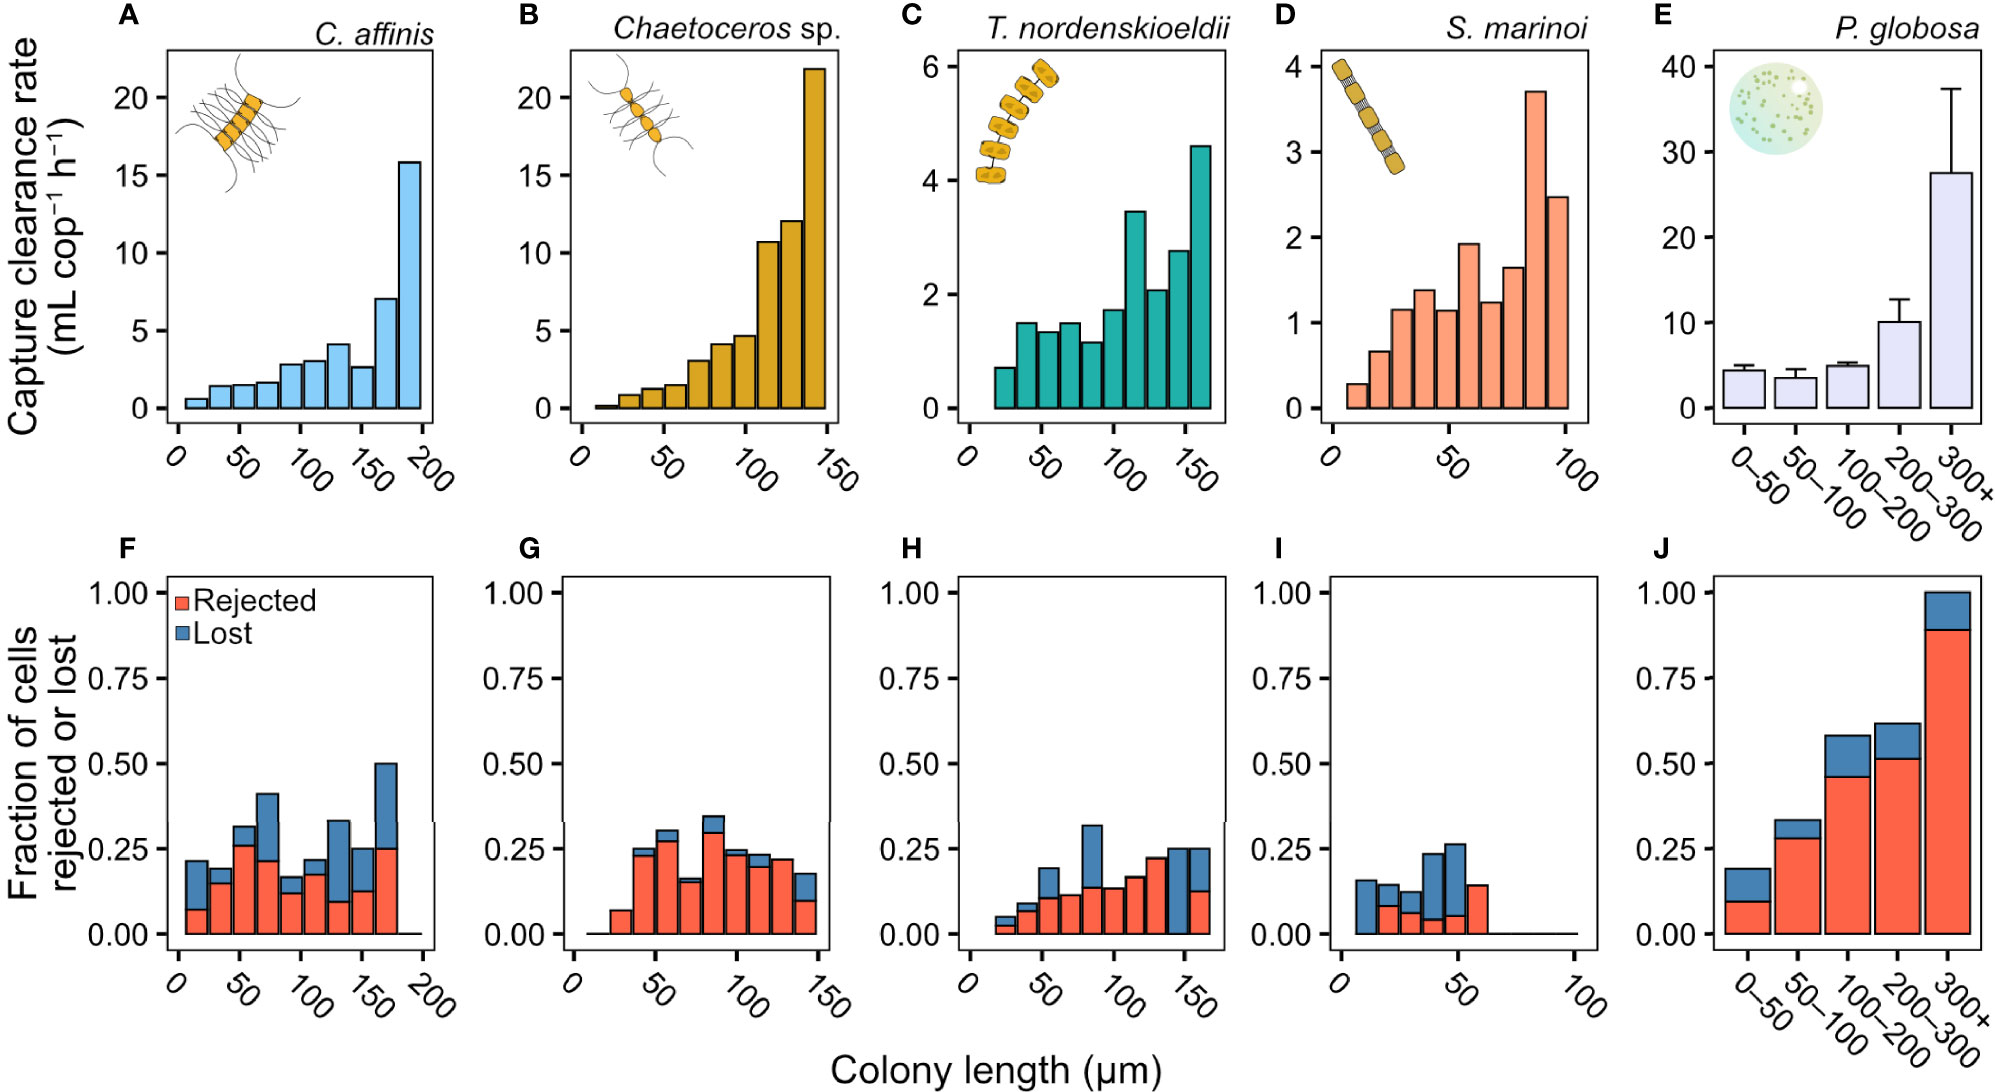
Figure 2 Copepodite feeding rate (from video observations). (A–E) Capture clearance rate (mL copepod−1 h−1), and (F–J) the fraction of different capture outcomes (lostor rejected cells). If prey was not rejected or lost means it was ingested. Clearance rates on diatoms are pooled results from the 3–5 copepods used. Clearance rates for P. globosa (E) are means ± SD from the two experiments and outcomes (J) were pooled for each size range from both experiments. The fraction of colonies rejected or lost during handling was independent of colony size in the diatoms (mixed effects logistic regression, z = 1.47, p = 0.14). In P. globosa the fraction of colonies rejected or lost increased with colony size (logistic regression, z = 6.50, p = <0.001). Length refers to chain length in the diatoms and diameter in P. globosa. Please not differences in axis scales.
Colony size did not affect the ability of the copepod to handle and ingest diatom chains (Figures 2F–J), but the fraction of rejected colonies increased with size in P. globosa, with all the largest colonies lost or rejected (Figure 2J). When ingesting P. globosa colonies >100 µm ESD, we observed that part of the colony was spilled due to ‘sloppy’ feeding (Video S3), but these were still counted as ‘ingestion’.
The clearance rate based on ingested particles (i.e., clearance rate equivalent to the one measured in bottle incubations) largely followed the same patterns as the capture clearance rate in the diatoms (Figure S2) albeit slightly lower as some captured particles were rejected. For P. globosa, ingestion clearance rate was near independent of colony size at ∼3 mL h−1 due to the opposing effects of size on capture and loss rates (Figure S2).
The time spent handling ingested prey increased with colony size in all prey species (Figure 3; Table S1). Handling time of rejected prey was relatively short and independent of colony size in P. globosa (Figure 3G), but there were too few observations of rejected diatoms to deduce a pattern. The handling time per ingested cell decreased with increasing colony size and the pattern was the same for all species (Figure 3; Table S1).
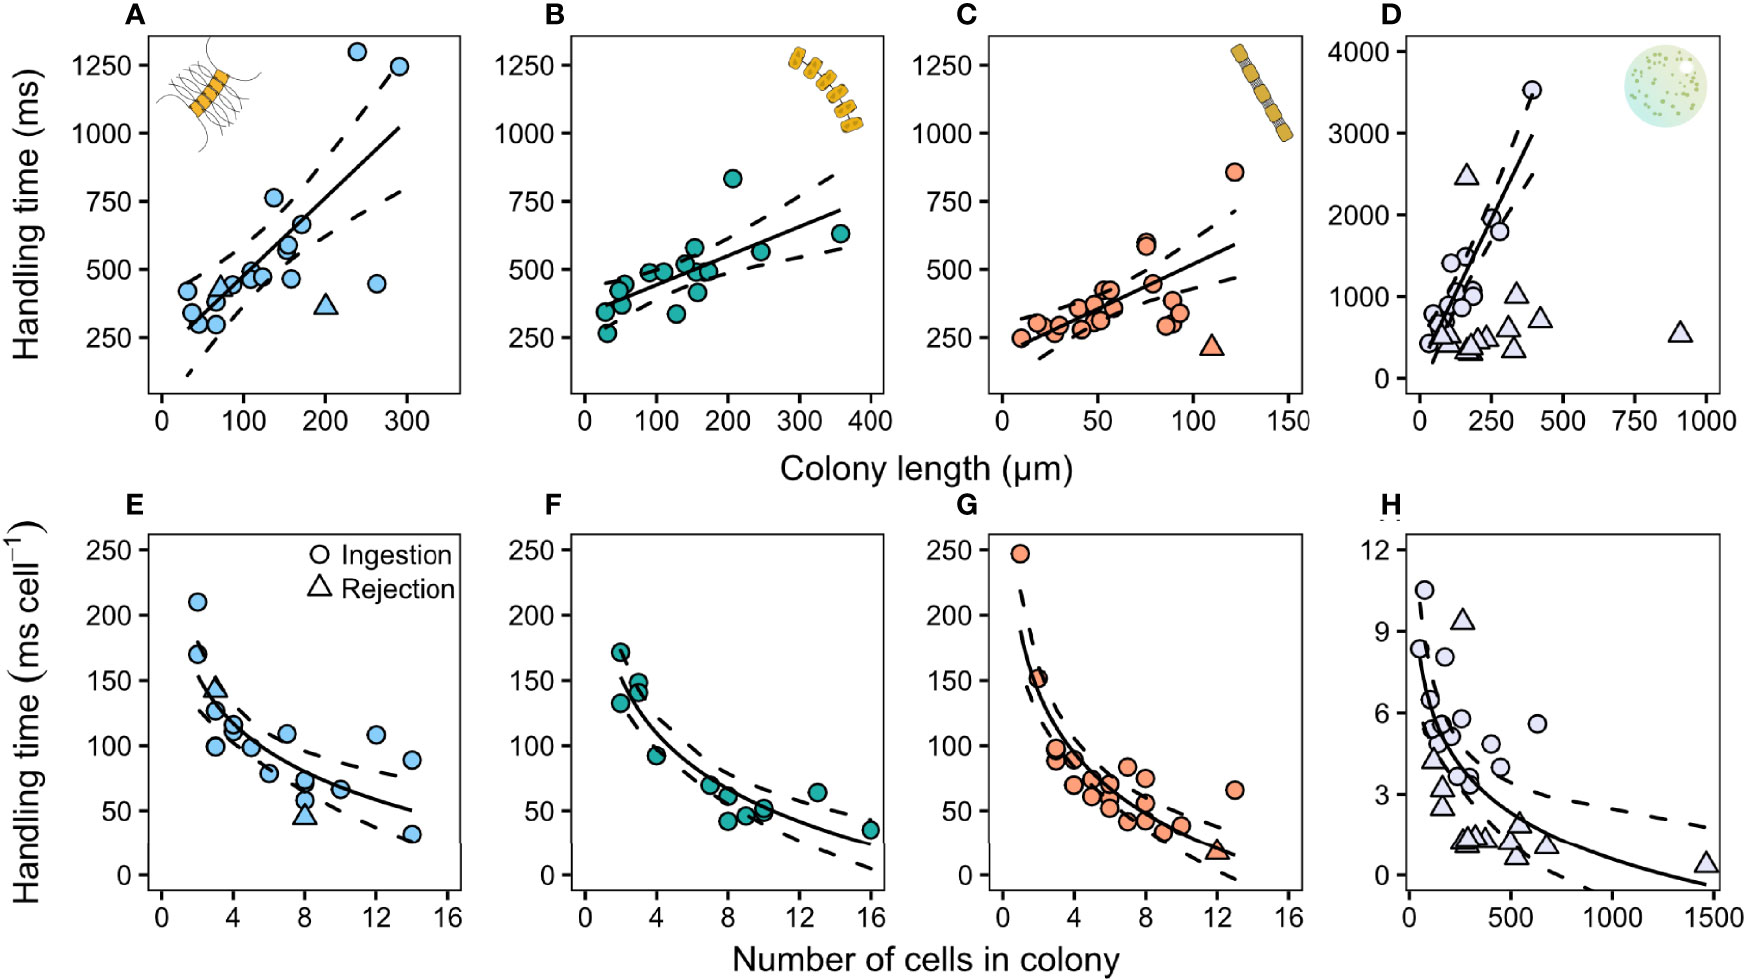
Figure 3 Relation between copepodite handling time (ms) and colony size (top row) and handling time cell−1 (ms cell−1) and the amount of cells in the colony (bottom row) in (A, E) C. affinis, (B, F) T. nordenskioeldii, (C, G) S. marinoi, and (D, H) P. globosa. Each individual point represents one capture event. The number of cells per colony in P. globosa was estimated based on Jakobsen and Tang (2002). Regression lines are summarized in Appendix 1: Table S1. Dashed lines are 95% confidence intervals.
Copepod Nauplii Grazing on Diatom and Haptophyte Colonies
The nauplii of T. longicornis also produce a feeding current that draw in prey. While the nauplii responded to arriving colonies, they were unable to handle diatom chains that are more than a few cells long, and were unable to process even small P. globosa colonies (Video S4). As a result, nauplii clearance rate decreased with increasing colony size in C. affinis and T. nordenskioeldii (Figures 4D–F), and initially increased but then decreased in the smaller S. marinoi (Figure 4F). The size distributions in these experiments were also dominated by shorter chains (Figures 4A–C).
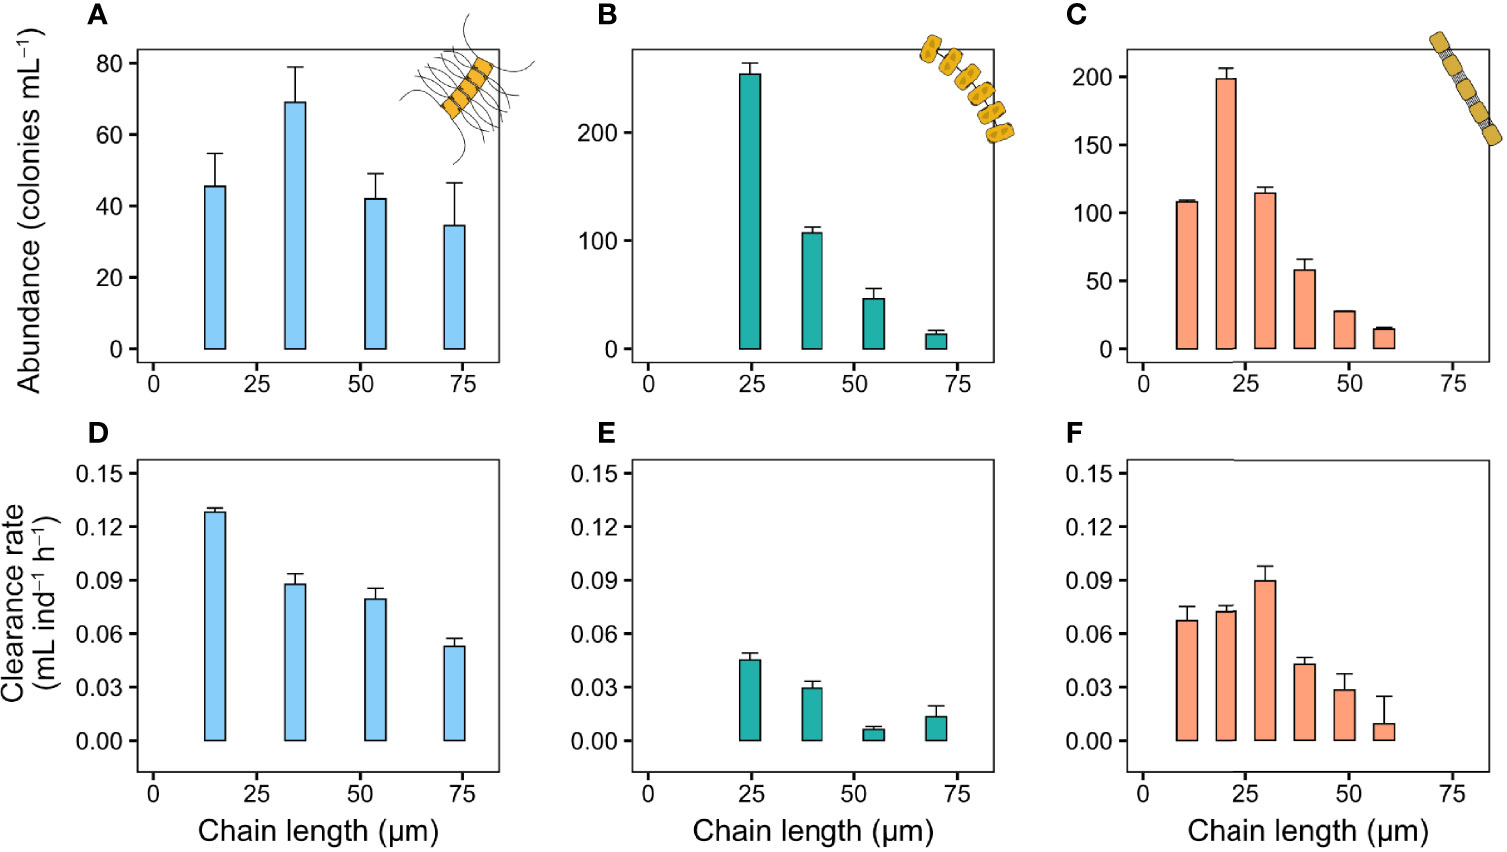
Figure 4 Copepod nauplii clearance rate (mL nauplii−1 h−1) and colony size distribution of chains in the bottle incubations. (A, D) C. affinis, (B, E) T. nordenskioeldii, and (C, F) S. marinoi. Sizes larger than the largest chains shown here (equivalent to four cells chain−1 in C. affinis and T. nordenskioeldii, and six in S. marinoi) were pooled into one group due to low abundance of these sizes. Values are means and error bars show standard error (n = 3).
Dinoflagellate Grazing on Colonies
The prey-capture processes of O. marina and G. dominans are similar and they both ingest their prey by engulfing it (Video S5). G. dominans may swim away with the prey post-capture (Video S5), while O. marina immediately ingests encountered prey after a brief handling period (Nielsen and Kiørboe, 2015). The clearance rate of O. marina feeding on S. marinoi initially increased with chain length, but abruptly ceased on chains longer than ~30 µm (Figure 5A). A similar pattern was observed for G. dominans feeding on the same prey, but with a peak at ~50 µm, and a less steep decline (Figure 5B). G. dominans clearance rate on C. affinis also increased with chain length (Figure 5C), with five times higher rates on the larger chains compared to single cells. As in the previous experiments, the colony size distribution was dominated by shorter chains (Figures 5D–F).
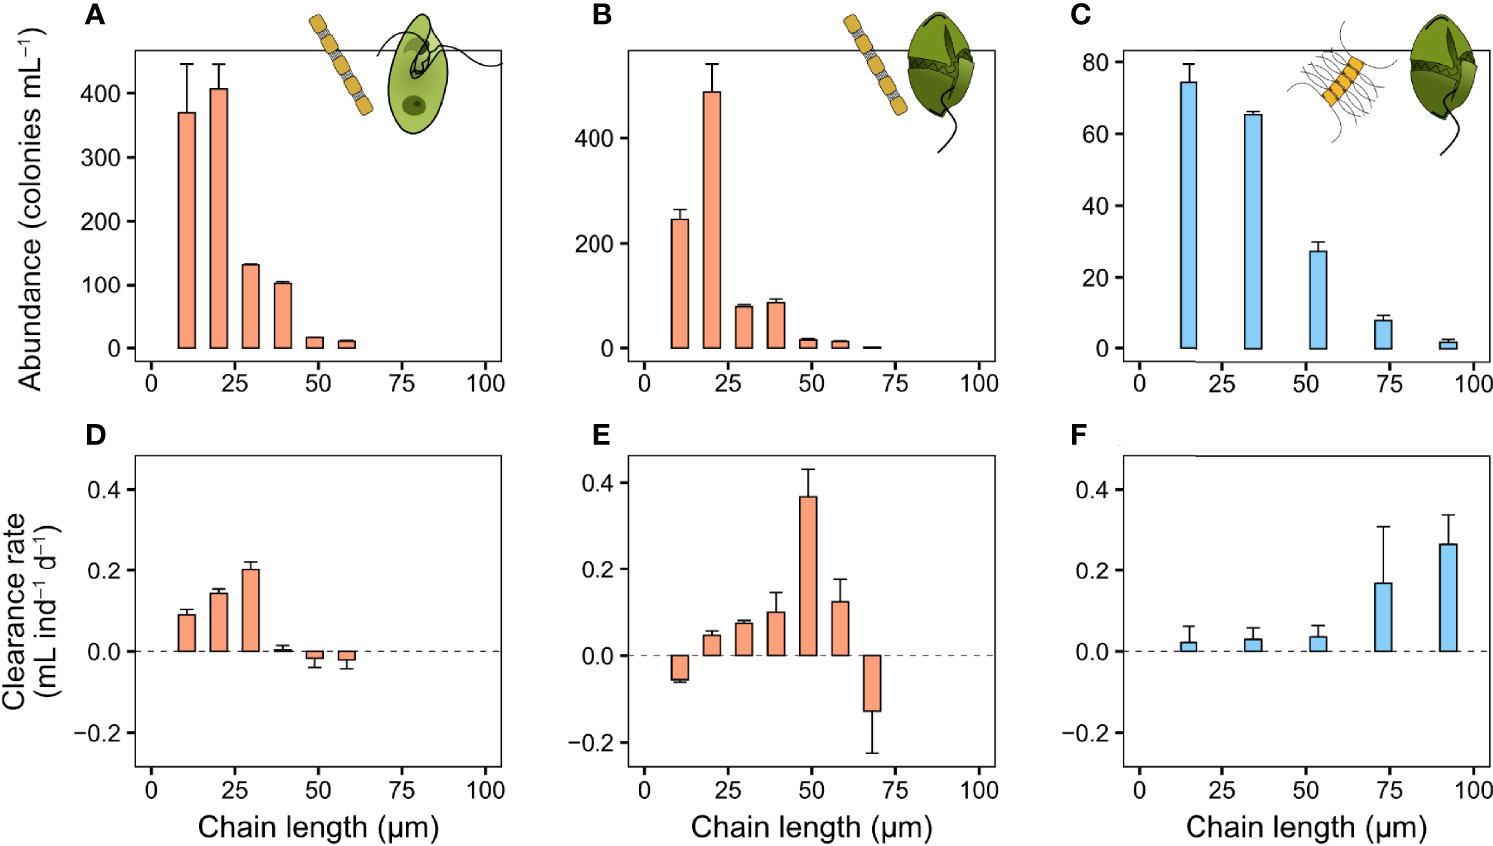
Figure 5 Heterotrophic dinoflagellate clearance rate (mL ind−1 d−1) and colony size distribution of diatom chains in the bottle incubations. (A, D) O. marina feeding on S. marinoi and G. dominans feeding on (B, E) S. marinoi and (C, F) C. affinis. Sizes larger than the largest shown here (equivalent to six, seven, and five cells chain in the three columns from left to right, respectively) were pooled into one group due to low abundance of these sizes. Values are means and error bars show standard error (n = 3).
Discussion
Colony Formation and Predation Risk
The clearance rate of adult T. longicornis increases with prey size to a maximum of about 5 mL h−1 for optimally sized (~30–40 um) near-spherical prey (Gonçalves et al., 2014). This estimate is similar between bottle incubation experiments and from direct measurements of the fluid volume flow through the ‘capture area’ as defined by the sensory reach of the feeding appendages (Gonçalves et al., 2014). We find the same increasing trend with prey size in the present experiments, but the capture clearance rate significantly exceeds (by up to 500% in P. globosa) the above maximum estimates for the largest colonies. This is because the antennules become involved in both perception and capture of prey for the largest colonies, thus extending the sensory reach and the capture area. Single celled non-motile prey is perceived by sensors on the feeding appendages in feeding-current feeding copepods, not the antennules (Gonçalves and Kiørboe, 2015). Thus, colonies are perceived differently. The long setae on the cells of the two Chaetoceros species may further extend the sensory reach of the antennules and likely explains the much higher clearance rate on these species compared to similar-sized T. nordenskioeldii with shorter and thinner spines. Our results are in line with those of previous incubation experiments, i.e., increased feeding rates with increased colony size (Long et al., 2007; Bergkvist et al., 2012; Bjærke et al., 2015).
Long diatom chains are efficiently handled by the copepod, and indeed the longer the chain, the less the handling time per ingested prey cell. The long spines on Chaetoceros spp. cells appear to present no major obstacle to efficient handling, since handling times are similar between small and intermediately sized Chaetoceros spp. and T. nordenskioeldii, and rejection and loss rates are low and independent of chain length in diatoms up to the max length examined here (200 µm).
In contrast to copepodites, the nauplii of T. longicornis are unable to handle diatoms chains exceeding a few cells in length. However, the biomass of copepods is typically by far dominated by late copepodite stages (Peterson, 1998; Ashjian et al., 2003; Irigoien and Harris, 2006), simply because the specific juvenile growth rate of copepods (up to 0.5 d−1) typically exceeds the specific mortality rate (~0.1 d−1) (Kiørboe and Sabatini, 1995; Hirst and Kiørboe, 2002). Therefore, chain formation in diatoms dramatically increases the predation risk to copepods as does likely the presence of long spines. Ohman (2019) reported some cases of cm-long chains that may be unavailable to copepods, but long chains start short, and other data suggests that dominating chain lengths are much shorter (Tiselius and Kuylenstierna, 1996; Bjærke et al., 2015; Selander et al., 2019). Thus, the reduction in chain formation in response to copepod cues (Bergkvist et al., 2012; Selander et al., 2019; Rigby and Selander, 2021) is therefore an efficient defense, and the underlying mechanism, as demonstrated here, seems to be mainly related to reduced grazer-encounter rates.
While copepods are important grazers of phytoplankton, most of the phytoplankton grazing mortality in the oceans is due to smaller (<200 µm) zooplankton (Calbet and Landry, 2004) that in ecosystems where diatoms commonly bloom is dominated by ciliates and hetero- and mixotrophic dinoflagellates (Sherr and Sherr, 2007; Calbet, 2008). Several feeding mechanisms exist among dinoflagellates, all allowing the ingestion of particles exceeding the size of the dinoflagellates themselves (Hansen and Calado, 1999). The use of a pallium in the Protoperidinum and Diplosalis groups allow them to ingest even large colony-forming diatoms, like Chaetoceros spp. (Hansen and Calado, 1999). Other dinoflagellates use a feeding tube to suck out the contents of the prey, which allow them to feed on even very large prey (Hansen and Calado, 1999). The two dinoflagellates used in our experiments, O. marina and G. dominans, feed by direct engulfment, where the entire prey is engulfed (Nielsen and Kiørboe, 2015). It has previously been shown that heterotrophic dinoflagellates with direct engulfment are most efficient on particles of their own size (Hansen, 1992). However, all previous studies were done using non-colony forming species. The two dinoflagellates studied here were unable to handle the largest S. marinoi chains (>60 µm length, online Video S5), while G. dominans feed on C. affinis chains up to at least 90 µm (roughly equivalent to five cells chain−1). This suggests that there are differences other than chain length that may play a part in restricting prey ingestion in G. dominans. Due to the lack of larger chains (>90 µm) in the C. affinis incubations, we were unable to determine at which size the clearance rate for this prey species peaked.
As opposed to heterotrophic dinoflagellates, ciliates are restricted to prey far smaller than their own size (Heinbokel, 1978; Fenchel, 1980; Jonsson, 1986; Maselli et al., 2020). Since most diatoms are morphologically small cells (ESD 4–10 µm), colony-formation or the presence of spines may prevent efficient feeding by these grazers. Thus, Bjærke et al. (2015) found that the ciliate Strombidium spiralis was unable to ingest chains of S. marinoi and the growth of Euplotes sp. was dramatically reduced when fed colonies of P. globosa as opposed to single cells (Long et al., 2007). Since the benefit of colony formation is largely dependent on the predator composition, appropriately responding to particular grazers by either increasing or decreasing colony formation is highly advantageous.
The Role of Colony Shape
Increased colony size may work as a defense against copepods in P. globosa, but not in the elongated diatom chains. The capture clearance rates increases with size in P. globosa, but the large size prevents them from being ingested. Thus, the defensive benefit of colony-formation against copepods is dependent on the width of the colony. If P. globosa colonies exceed this size threshold, increasing in size may appear to be the best strategy, since the larger size also protects from smaller sized grazers (Jakobsen and Tang, 2002; Long et al., 2007). However, the defensive value of colony formations is partly countered by copepods efficiently capturing and splitting up larger colonies into single cells or smaller clusters, subsequently making these available to both copepods and microzooplankton. If not consumed, these cells appear not to be harmed by the interaction and can form new colonies.
Diatom Life History, Bloom Formation, and the Role of Colony Formation
Colony formation has several negative implications to life-history functions in phytoplankton, in terms of reduced growth rate (Wang et al., 2015; Albini et al., 2019; Kapsetaki and West, 2019), enhanced sinking losses, enhanced competition for light (self-shading) and nutrients among colony members (Pahlow et al., 1997; Ploug et al., 1999) and – as shown here – dramatically enhanced predation risk to copepod and some dinoflagellate grazers. While the severity of nutrient competition may be relaxed in a turbulent environment, it seems that colony formation mainly has negative implications to resource acquisition (but see Musielak et al., 2009). Indeed, laboratory experiments have shown that cells located in the middle of a diatom chain experience reduced nutrient uptake (Bergkvist et al., 2018), and solitary diatom cells dominate in conditions with low nutrient supply (Kenitz et al., 2020). Why, then, do diatoms and Phaeocystis spp. form colonies?
Diatoms and P. globosa often form ephemeral blooms, typically in the spring, and bloom formation and subsequent sinking is an integral part of the life-history in at least diatoms (Smetacek, 1985). The deposition of a dense bloom in deep water or in the sediments with low grazing mortality secures a good seeding populations when conditions again become favorable for growth. Such blooms may be possible because the colonies are well protected from grazers with smaller prey-size spectra – such as ciliates – that can outgrow slowly growing but efficient copepods grazers. Ciliates can match the fast growth of diatoms (Hansen et al., 1997) and often make up for half of the microzooplankton biomass in Arctic, temperate, and tropical waters (Nielsen and Kiørboe, 1994; Levinsen et al., 2000; Nielsen et al., 2004; Stoecker and Lavrentyev, 2018). Yet, ciliates are unable to suppress the formation of diatom blooms in temperate systems despite the fast numerical response of these grazers to increased food availability (Tiselius and Kuylenstierna, 1996; Sherr and Sherr, 2009). Colony- and spine formation in diatoms is therefore an efficient defense against these species, thus allowing bloom formation.
In contrast, copepod life history implies a significantly lagged numerical response to elevated food availability, and the biomass of copepods typically peak a long time after the spring bloom of diatoms in temperate waters (Kiørboe and Nielsen, 1994). Similarly, dinoflagellates with the ability to ingest large colonies of diatoms generally grow quite slowly, especially at the temperatures where the diatoms typically bloom; i.e., 4–5°C in temperate areas and often <0°C in Arctic waters (Hansen et al., 1997; Levinsen et al., 2000; Naustvoll, 2000).
Conclusions
The abilities of copepods and protists to capture and handle colonial phytoplankton depend on the size and foraging behavior of the grazer, and the size and shape of the colony. Hence, the defensive value of forming or not forming a colony is a function of these factors and the composition of the predator community. We argue that the efficient defense of colony formation against small grazers allows bloom formation in diatoms, and that the fitness benefit of bloom formation outweighs all the negative consequences of colony formation.
Data Availability Statement
The datasets presented in this study can be found in online repositories. The names of the repository/repositories and accession number(s) can be found below: https://zenodo.org/record/6337617.
Author Contributions
FR, PH, and TK conceived and designed the study. FR performed the experiments. FR, PH, and TK analyzed the data. FR wrote the paper with substantial input from PH and TK. All authors contributed to the article and approved the submitted version.
Funding
The Centre for Ocean Life is supported by the Villum Foundation. PH was funded by the European Union’s Horizon 2020 research and innovation programme under the Marie Skłodowska-Curie, grant agreement No 766327.
Conflict of Interest
The authors declare that the research was conducted in the absence of any commercial or financial relationships that could be construed as a potential conflict of interest.
Publisher’s Note
All claims expressed in this article are solely those of the authors and do not necessarily represent those of their affiliated organizations, or those of the publisher, the editors and the reviewers. Any product that may be evaluated in this article, or claim that may be made by its manufacturer, is not guaranteed or endorsed by the publisher.
Acknowledgments
We are grateful to Enric Saiz and Albert Calbet for providing a culture of G. dominans, Erik Selander for providing diatoms, and Jack Melbye for maintaining copepod cultures.
Supplementary Material
The Supplementary Material for this article can be found online at: https://www.frontiersin.org/articles/10.3389/fmars.2022.829419/full#supplementary-material
References
Albini D., Fowler M. S., Llewellyn C., Tang K. W. (2019). Reversible Colony Formation and the Associated Costs in Scenedesmus obliquus. J. Plankton Res. 41, 419–429. doi: 10.1093/plankt/fbz032
Ashjian C. J., Campbell R. G., Welch H. E., Butler M., Van Keuren D. (2003). Annual Cycle in Abundance, Distribution, and Size in Relation to Hydrography of Important Copepod Species in the Western Arctic Ocean. Deep Sea Res. Part I Oceanogr. Res. Pap. 50, 1235–1261. doi: 10.1016/S0967-0637(03)00129-8
Bergkvist J., Klawonn I., Whitehouse M. J., Lavik G., Brüchert V., Ploug H. (2018). Turbulence Simultaneously Stimulates Small- and Large-Scale CO2 Sequestration by Chain-Forming Diatoms in the Sea. Nat. Commun. 9, 3046. doi: 10.1038/s41467-018-05149-w
Bergkvist J., Thor P., Jakobsen H. H., Wängberg S.-Å., Selander E. (2012). Grazer-Induced Chain Length Plasticity Reduces Grazing Risk in a Marine Diatom. Limnol. Oceanogr. 57, 318–324. doi: 10.4319/lo.2012.57.1.0318
Bjærke O., Jonsson P. R., Alam A., Selander E. (2015). Is Chain Length in Phytoplankton Regulated to Evade Predation? J. Plankton Res. 37, 1110–1119. doi: 10.1093/plankt/fbv076
Bruno E., Andersen Borg C. M., Kiørboe T. (2012). Prey Detection and Prey Capture in Copepod Nauplii. PloS One 7, e47906. doi: 10.1371/journal.pone.0047906
Calbet A. (2008). The Trophic Roles of Microzooplankton in Marine Systems. ICES J. Marine Sci. 65, 325–331. doi: 10.1093/icesjms/fsn013
Calbet A., Landry M. R. (2004). Phytoplankton Growth, Microzooplankton Grazing, and Carbon Cycling in Marine Systems. Limnol. Oceanogr. 49, 51–57. doi: 10.4319/lo.2004.49.1.0051
Fenchel T. (1980). Relation Between Particle Size Selection and Clearance in Suspension Feeding Ciliates. Limnol. Oceanogr. 25, 733–738. doi: 10.4319/lo.1980.25.4.0733
Finkel Z. V., Beardall J., Flynn K. J., Quigg A., Rees T. A. V., Raven J. A. (2010). Phytoplankton in a Changing World: Cell Size and Elemental Stoichiometry. J. Plankton Res. 32, 119–137. doi: 10.1093/plankt/fbp098
Frost B. W. (1972). Effects and Size and Concentration of Food Particles on the Feeding Behavior of the Marine Planktonic Copepod Calanus pacificus. Limnol. Oceanogr. 17, 805–815. doi: 10.4319/lo.1972.17.6.0805
Gonçalves R. J., Kiørboe T. (2015). Perceiving the Algae: How Feeding-Current Feeding Copepods Detect Their Nonmotile Prey: Prey Detection in Copepods. Limnol. Oceanogr. 60, 1286–1297. doi: 10.1002/lno.10102
Gonçalves R., van Someren Gréve H., Couespel D., Kiørboe T. (2014). Mechanisms of Prey Size Selection in a Suspension-Feeding Copepod, Temora longicornis. Mar. Ecol. Prog. Ser. 517, 61–74. doi: 10.3354/meps11039
Grønning J., Kiørboe T. (2020). Diatom Defence: Grazer Induction and Cost of Shell-Thickening. Funct. Ecol. 34, 1790–1801. doi: 10.1111/1365-2435.13635
Hansen P. J. (1989). The Red Tide Dinoflagellate Alexandrium Tamarense: Effects on Behaviour and Growth of a Tintinnid Ciliate. Mar. Ecol. Prog. Ser. 53, 105–116. doi: 10.3354/meps053105
Hansen P. J. (1992). Prey Size Selection, Feeding Rates and Growth Dynamics of Heterotrophic Dinoflagellates With Special Emphasis on Gyrodinium spirale. Mar. Biol. 114, 327–334. doi: 10.1007/BF00349535
Hansen P. J., Bjørnsen P. K., Hansen B. W. (1997). Zooplankton Grazing and Growth: Scaling Within the 2-2000-μm Body Size Range. Limnol. Oceanogr. 42, 687–704. doi: 10.4319/lo.1997.42.4.0687
Hansen B., Bjornsen P. K., Hansen P. J. (1994). The Size Ratio Between Planktonic Predators and Their Prey. Limnol. Oceanogr. 39, 395–403. doi: 10.4319/lo.1994.39.2.0395
Hansen P. J., Calado A. J. (1999). Phagotrophic Mechanisms and Prey Selection in Free-Living Dinoflagellates. J. Eukaryot. Microbiol. 46, 382–389. doi: 10.1111/j.1550-7408.1999.tb04617.x
Heinbokel J. F. (1978). Studies on the Functional Role of Tintinnids in the Southern California Bight. I. Grazing and Growth Rates in Laboratory Cultures. Mar. Biol. 47, 177–189. doi: 10.1007/BF00395638
Hessen D. O., Van Donk E. (1993). Morphological Changes in Scenedesmus Induced by Substances Released From Daphnia. Arch. Hydrobiol. 127, 129–140. doi: 10.1127/archiv-hydrobiol/127/1993/129
Hillebrand H., Dürselen C.-D., Kirschtel D., Pollingher U., Zohary T. (1999). Biovolume Calculation for Pelagic and Benthic Microalgae. J. Phycol. 35, 403–424. doi: 10.1046/j.1529-8817.1999.3520403.x
Hirst A., Kiørboe T. (2002). Mortality of Marine Planktonic Copepods: Global Rates and Patterns. Mar. Ecol. Prog. Ser. 230, 195–209. doi: 10.3354/meps230195
Irigoien X., Harris R. P. (2006). Comparative Population Structure, Abundance and Vertical Distribution of Six Copepod Species in the North Atlantic: Evidence for Intraguild Predation? Mar. Biol. Res. 2, 276–290. doi: 10.1080/17451000600865321
Jakobsen H., Tang K. (2002). Effects of Protozoan Grazing on Colony Formation in Phaeocystis globosa (Prymnesiophyceae) and the Potential Costs and Benefits. Aquat. Microb. Ecol. 27, 261–273. doi: 10.3354/ame027261
Jonsson P. (1986). Particle Size Selection, Feeding Rates and Growth Dynamics of Marine Planktonic Oligotrichous Ciliates (Ciliophora: Oligotrichina). Mar. Ecol. Prog. Ser. 33, 265–277. doi: 10.3354/meps033265
Kapsetaki S. E., West S. A. (2019). The Costs and Benefits of Multicellular Group Formation in Algae*. Evolution 73, 1296–1308. doi: 10.1111/evo.13712
Kenitz K. M., Orenstein E. C., Roberts P. L. D., Franks P. J. S., Jaffe J. S., Carter M. L., et al. (2020). Environmental Drivers of Population Variability in Colony-Forming Marine Diatoms. Limnol. Oceanogr. 65, 2515–2528. doi: 10.1002/lno.11468
Kiørboe T. (2016). Foraging Mode and Prey Size Spectra of Suspension−Feeding Copepods and Other Zooplankton. Mar. Ecol. Prog. Ser. 558, 15–20. doi: 10.3354/meps11877
Kiørboe T., Nielsen T. G. (1994). Regulation of Zooplankton Biomass and Production in a Temperate, Coastal Ecosystem. 1. Copepods. Limnol. Oceanogr. 39, 493–507. doi: 10.4319/lo.1994.39.3.0493
Kiørboe T., Sabatini M. (1995). Scaling of Fecundity, Growth and Development in Marine Planktonic Copepods. Mar. Ecol. Prog. Ser. 120, 285–298. doi: 10.3354/meps120285
Levinsen H., Nielsen T., Hansen B. (2000). Annual Succession of Marine Pelagic Protozoans in Disko Bay, West Greenland, With Emphasis on Winter Dynamics. Mar. Ecol. Prog. Ser. 206, 119–134. doi: 10.3354/meps206119
Long J. D., Smalley G. W., Barsby T., Anderson J. T., Hay M. E. (2007). Chemical Cues Induce Consumer-Specific Defenses in a Bloom-Forming Marine Phytoplankton. Proc. Natl. Acad. Sci. U.S.A. 104, 10512–10517. doi: 10.1073/pnas.0611600104
Lovecchio S., Climent E., Stocker R., Durham W. M. (2019). Chain Formation can Enhance the Vertical Migration of Phytoplankton Through Turbulence. Sci. Adv. 5, eaaw7879. doi: 10.1126/sciadv.aaw7879
Lundgren V., Granéli E. (2010). Grazer-Induced Defence in Phaeocystis globosa (Prymnesiophyceae): Influence of Different Nutrient Conditions. Limnol. Oceanogr. 55, 1965–1976. doi: 10.4319/lo.2010.55.5.1965
Lürling M. (2021). Grazing Resistance in Phytoplankton. Hydrobiologia 848, 237–249. doi: 10.1007/s10750-020-04370-3
Lürling M., Van Donk E. (2000). Grazer-Induced Colony Formation in Scenedesmus: Are There Costs to Being Colonial? Oikos 88, 111–118. doi: 10.1034/j.1600-0706.2000.880113.x
Maselli M., Altenburger A., Stoecker D. K., Hansen P. J. (2020). Ecophysiological Traits of Mixotrophic Strombidium spp. J. Plankton Res. 42, 485–496. doi: 10.1093/plankt/fbaa041
Musielak M. M., Karp-Boss L., Jumars P. A., Fauci L. J. (2009). Nutrient Transport and Acquisition by Diatom Chains in a Moving Fluid. J. Fluid Mech. 638, 401–421. doi: 10.1017/S0022112009991108
Naustvoll L.-J. (2000). Prey Size Spectra and Food Preferences in Thecate Heterotrophic Dinoflagellates. Phycologia 39, 187–198. doi: 10.2216/i0031-8884-39-3-187.1
Nielsen T., Bjørnsen P., Boonruang P., Fryd M., Hansen P., Janekarn V., et al. (2004). Hydrography, Bacteria and Protist Communities Across the Continental Shelf and Shelf Slope of the Andaman Sea (NE Indian Ocean). Mar. Ecol. Prog. Ser. 274, 69–86. doi: 10.3354/meps274069
Nielsen T. G., Kiørboe T. (1994). Regulation of Zooplankton Biomass and Production in a Temperate, Coastal Ecosystem. 2. Ciliates. Limnol. Oceanogr. 39, 508–519. doi: 10.4319/lo.1994.39.3.0508
Nielsen L. T., Kiørboe T. (2015). Feeding Currents Facilitate a Mixotrophic Way of Life. ISME J. 9, 2117–2127. doi: 10.1038/ismej.2015.27
Ohman M. D. (2019). A Sea of Tentacles: Optically Discernible Traits Resolved From Planktonic Organisms in Situ. ICES J. Mar. Sci. 76, 1959–1972. doi: 10.1093/icesjms/fsz184
Pahlow M., Riebesell U., Wolf-Gladrow D. A. (1997). Impact of Cell Shape and Chain Formation on Nutrient Acquisition by Marine Diatoms. Limnol. Oceanogr. 42, 1660–1672. doi: 10.4319/lo.1997.42.8.1660
Pančić M., Kiørboe T. (2018). Phytoplankton Defence Mechanisms: Traits and Trade-Offs: Defensive Traits and Trade-Offs. Biol. Rev. 93, 1269–1303. doi: 10.1111/brv.12395
Peterson W. (1998). Life Cycle Strategies of Copepods in Coastal Upwelling Zones. J. Mar. Syst. 15, 313–326. doi: 10.1016/S0924-7963(97)00082-1
Ploug H., Stolte W., Jørgensen B. B. (1999). Diffusive Boundary Layers of the Colony-Forming Plankton Alga Phaeocystis Sp.- Implications for Nutrient Uptake and Cellular Growth. Limnol. Oceanogr. 44, 1959–1967. doi: 10.4319/lo.1999.44.8.1959
Rigby K., Selander E. (2021). Predatory Cues Drive Colony Size Reduction in Marine Diatoms. Ecol. Evol. 11, 11020–11027. doi: 10.1002/ece3.7890
Ryderheim F., Selander E., Kiørboe T. (2021). Predator-Induced Defence in a Dinoflagellate Generates Benefits Without Direct Costs. ISME J. 15, 2107–2116. doi: 10.1038/s41396-021-00908-y
Selander E., Berglund E. C., Engström P., Berggren F., Eklund J., Harðardóttir S., et al. (2019). Copepods Drive Large-Scale Trait-Mediated Effects in Marine Plankton. Sci. Adv. 5, eaat5096. doi: 10.1126/sciadv.aat5096
Selander E., Jakobsen H. H., Lombard F., Kiørboe T. (2011). Grazer Cues Induce Stealth Behavior in Marine Dinoflagellates. Proc. Natl. Acad. Sci. U.S.A. 108, 4030–4034. doi: 10.1073/pnas.1011870108
Sherr E. B., Sherr B. F. (2007). Heterotrophic Dinoflagellates: A Significant Component of Microzooplankton Biomass and Major Grazers of Diatoms in the Sea. Mar. Ecol. Prog. Ser. 352, 187–197. doi: 10.3354/meps07161
Sherr E., Sherr B. (2009). Capacity of Herbivorous Protists to Control Initiation and Development of Mass Phytoplankton Blooms. Aquat. Microb. Ecol. 57, 253–262. doi: 10.3354/ame01358
Smetacek V. S. (1985). Role of Sinking in Diatom Life-History Cycles: Ecological, Evolutionary and Geological Significance. Mar. Biol. 84, 239–251. doi: 10.1007/BF00392493
Sommer U., Charalampous E., Genitsaris S., Moustaka-Gouni M. (2016). Benefits, Costs and Taxonomic Distribution of Marine Phytoplankton Body Size. J. Plankton Res. 39, 494–508. doi: 10.1093/plankt/fbw071
Stoecker D. K., Lavrentyev P. J. (2018). Mixotrophic Plankton in the Polar Seas: A Pan-Arctic Review. Front. Mar. Sci. 5. doi: 10.3389/fmars.2018.00292
Tiselius P., Kuylenstierna M. (1996). Growth and Decline of a Diatom Spring Bloom: Phytoplankton Species Composition, Formation of Marine Snow and the Role of Heterotrophic Dinoflagellates. J. Plankton Res. 18, 133–155. doi: 10.1093/plankt/18.2.133
Tiselius P., Saiz E., Kiørboe T. (2013). Sensory Capabilities and Food Capture of Two Small Copepods, Paracalanus parvus and Pseudocalanus sp. Limnol. Oceanogr. 58, 1657–1666. doi: 10.4319/lo.2013.58.5.1657
Wang X., Wang Y., Ou L., He X., Chen D. (2015). Allocation Costs Associated With Induced Defense in Phaeocystis globosa (Prymnesiophyceae): The Effects of Nutrient Availability. Sci. Rep. 5, 10850. doi: 10.1038/srep10850
Keywords: defense mechanisms, phytoplankton, colony formation, chain formation, diatom life history, Phaeocystis globosa
Citation: Ryderheim F, Hansen PJ and Kiørboe T (2022) Predator Field and Colony Morphology Determine the Defensive Benefit of Colony Formation in Marine Phytoplankton. Front. Mar. Sci. 9:829419. doi: 10.3389/fmars.2022.829419
Received: 05 December 2021; Accepted: 21 March 2022;
Published: 08 April 2022.
Edited by:
Alberto Basset, University of Salento, ItalyReviewed by:
Andrew J. Irwin, Dalhousie University, CanadaSean Anderson, Mississippi State University, United States
Xuexia Zhu, Hohai University, China
Margaret Anne Mars Brisbin, Okinawa Institute of Science and Technology Graduate University, Japan
Copyright © 2022 Ryderheim, Hansen and Kiørboe. This is an open-access article distributed under the terms of the Creative Commons Attribution License (CC BY). The use, distribution or reproduction in other forums is permitted, provided the original author(s) and the copyright owner(s) are credited and that the original publication in this journal is cited, in accordance with accepted academic practice. No use, distribution or reproduction is permitted which does not comply with these terms.
*Correspondence: Fredrik Ryderheim, ZnJyeUBhcXVhLmR0dS5kaw==