 Virginia Biede1,2
 Andrew R. Gates3
 Simone Pfeifer1,3
 Jane E. Collins1
 Carmen Santos4,5
 Daniel O. B. Jones3*
- 1University of Southampton, National Oceanography Centre, Southampton, United Kingdom
- 2Florida State University, Tallahassee, FL, United States
- 3National Oceanography Centre, European Way, Southampton, United Kingdom
- 4University Agostinho Neto, Luanda, Angola
- 5Academia de Pesca e Ciências do Mar do Namibe, Namibe, Angola
Large structures are introduced into deep-water marine environments by several industrial activities, including hydrocarbon exploitation. Anthropogenic structures can alter ecosystem structure and functioning in many marine ecosystems but the responses on continental margins are poorly known. Here, we investigate the short-term response of benthic megafauna to the installation of a 56 km-long 30 cm diameter pipeline on the Angolan Margin (Block 31) from 700 to 1800 m water depth using remotely operated vehicle imagery. Clear depth-related patterns exist in the density, diversity and community structure of megafauna observed in 2013 prior to pipeline installation. These patterns are altered in a subsequent survey in 2014, three-months after pipeline installation. Significant increases in density, particularly in mid-slope regions are observed. Diversity is generally, but not consistently, enhanced, particularly in the shallower areas in 2014. Clear changes are noted in community structure between years. These changes are primarily caused by increases in the abundance of echinoderms, particularly the echinoid Phormosoma sp. indet. There was no evidence of colonisation of the pipeline in three months by visible fauna. The few large anemones observed attached to the pipe may be able to move as adults. The pipeline appeared to trap organic material and anthropogenic litter, and may enhance available food resources locally as well as providing hard substratum. These results indicate complex and ecosystem-dependent responses to structure installation and caution against simplistic approaches to environmental management.
Introduction
Artificial structures in the marine environment alter ecological structure and functioning (Gates et al., 2019). They provide habitat for threatened species (Bell and Smith, 1999), contribute reef habitat (Fowler et al., 2018), enhance recruitment of overfished species (Love et al., 2006), increase connectivity (Henry et al., 2018), often produce considerable fish biomass (Claisse et al., 2014) and provide foraging areas for large predators (Todd et al., 2016). Structures can also have negative effects, such as disturbing seabed habitats and causing increased levels of pollution (Cordes et al., 2016). These effects may vary over time, relating to environmental conditions and stage of ecological succession (Fujii, 2015; Gates et al., 2019; Todd et al., 2019). Consequently, artificial structures have a potential role in restoring degraded marine ecosystems such as coral reefs (Rinkevich, 2014), mollusc reefs (Walles et al., 2016), algal forests (Gianni et al., 2013) and historically trawled or degraded habitats (Bond et al., 2018a), and have been proposed for restoration of disturbed deep-sea habitats (Cuvelier et al., 2018).
Oil and gas industry infrastructure is an important source of artificial hard substratum on continental shelf and slope habitats globally (Fowler et al., 2018). Pipelines may provide long stretches of continuous hard substratum habitat that extend from the shore into the deep ocean (Cordes et al., 2016). There is an initial impact on the seafloor from pipeline construction but pipelines appear to be quickly colonised in shallow water (de Groot, 1982; Lewis et al., 2002; Todd et al., 2019). Colonisation follows clear ecological succession (Gates et al., 2019). The provision of hard substratum by pipelines contributes to elevated biomass and appears to enhance diversity, but these effects vary with depth (Love and York, 2005; McLean et al., 2017; Bond et al., 2018b). The presence of pipelines may act as a barrier to dispersal or as a trap for organic matter (Lebrato and Jones, 2009). These effects have been poorly studied in water deeper than 300 m, although other similar hard substrata are colonised in deeper water (Vinogradov, 2000; Mugge et al., 2019). Knowledge of the nature and duration of succession on artificial structures is valuable for our understanding of deep-sea communities in general but also for assessing the impact of anthropogenic activities in deep-sea environments. The information needed to make these assessments is routinely collected by the oil and gas industry, but is not always accessible to scientists (Macreadie et al., 2018).
The benthic megafauna and fishes of the Angolan margin appear abundant and diverse on a range of substrata (Vardaro et al., 2013; Jones et al., 2014; Jamieson et al., 2017). These organisms are important for the structure and functioning of ecosystems, for example rapidly processing sinking carbon, reworking sediments and increasing structural complexity. Megafaunal responses to changes in the environment vary, mobile species may respond rapidly but energy-limitation typically means colonisation and growth rates are slow (McClain et al., 2012). Quantifiable observations of growth and succession are rare in the deep-ocean (Mullineaux, 1988; Snelgrove et al., 1992) and few if any exist for the south Atlantic.
In this study, we investigate the short-term responses of benthic communities to the introduction of hard substratum in the deep sea. We use an extensive archive of seabed imagery obtained before and 3-months after the installation of a pipeline to determine if the introduction of a structure changes the density (e.g. through attraction), distribution, diversity or community structure of the benthic megafaunal assemblages characteristic of a range of continental slope depths. This will allow more effective assessment of the environmental impacts of structure installation as well as providing insight on the potential effects of introducing hard substratum for marine ecosystem restoration.
Methods
Study Site
Angolan licence block 31 covers a 5,349 km2 area of seafloor and became operational in 2012. To the north of the block is the Congo submarine canyon, which directly connects with the Congo River (Droz et al., 2003; Savoye et al., 2009). An estimated average of 55 x106 tonnes of suspended sediment, typically laden with particulate and dissolved organic matter, is released annually from the Congo River (Wetzel, 1993; Vangriesheim et al., 2009) and deposited on the seabed from surface-derived flux or diverted through the Congo canyon in episodic turbidity flows (Vangriesheim et al., 2009), with sedimentation rates within the canyon of around 36 cm ka-1 near Block 31 (Savoye et al., 2009). In the area of Block 31 the sediments are mostly hemi-pelagic in origin and sedimentation rates are lower at 20 cm ka-1 (Hill et al., 2010). The surface waters of Block 31 are characterised by high primary productivity, estimated to be over 200 gCm-2 yr-1 (Behrenfeld and Falkowski, 1997), driven by river-induced and coastal upwelling (van Bennekom and Berger, 1984; Schneider et al., 1994). The near-seabed water in the area of Block 31 appears to have typical temperatures (~5°C) and salinities (34.9 PSU), as well as high dissolved oxygen concentrations (230 µmol kg-1) (Vangriesheim et al., 2009). Current speeds in Block 31 are low (0.02 to 0.12 m/s) (Hill et al., 2010; Jamieson et al., 2017). Regular and large turbidity currents in the nearby Congo canyon may suspend sediment and organic material into the water column, where they may be transported along the slope (Azpiroz-Zabala et al., 2017).
The benthic biology of the deep waters off Angola has received increasing attention (Sibuet et al., 1989; Vinogradova et al., 1990; Bianchi, 1992; Kröncke and Turkay, 2003; Arbizu and Schminke, 2005; Van Gaever et al., 2009; Jones et al., 2014) and has been the focus for a number of large international programmes with biological components including Latitudinal Gradients of Deep-Sea BioDIVersity in the Atlantic Ocean [DIVA] (Arbizu and Schminke, 2005), ZaiAngo (Savoye et al., 2009), BioZaire (Galéron et al., 2009; Vangriesheim et al., 2009), and Congolobe (Rabouille et al., 2017). These studies have mostly focussed on chemosynthetic systems in the deep bathyal (Sibuet and Olu-LeRoy, 2002; Sibuet and Vangriesheim, 2009) and abyssal (Sen et al., 2017) or deep-water coral reefs on the upper slope (Le Guilloux et al., 2009). Less scientific attention has been directed towards the bathyal (200 – 2000 m) depths of the margin, although this area has been the subject of many environmental assessments by the oil industry (Cazes et al., 2012). Access to the region through oil company activities has permitted some scientific investigations on the scavenging fishes in Block 18 and 31 (Jamieson et al., 2017) and on communities associated with asphalt mounds in Block 31 (Jones et al., 2014). Two permanent scientific observatory platforms were installed at Block 18 to the South East of Block 31 (Vardaro et al., 2013), which are bringing further insights into the deep-water biology of the region (Milligan et al., 2020).
Pipeline Installation and Survey
In February 2014 BP Angola installed a gas export pipeline off the coast of Angola, which extends a total of 56 km from a deep-water manifold in BPs Concession Block 31 (approximately 1800 m water depth, 6°15’S, 10°49’E) to a tie-in manifold in Block 15 (700 m water depth, 6°14’S, 11°17’E). Remotely operated vehicle (ROV) video surveys were carried out prior to installation in December 2013 and after installation in May 2014 (Figure 1).
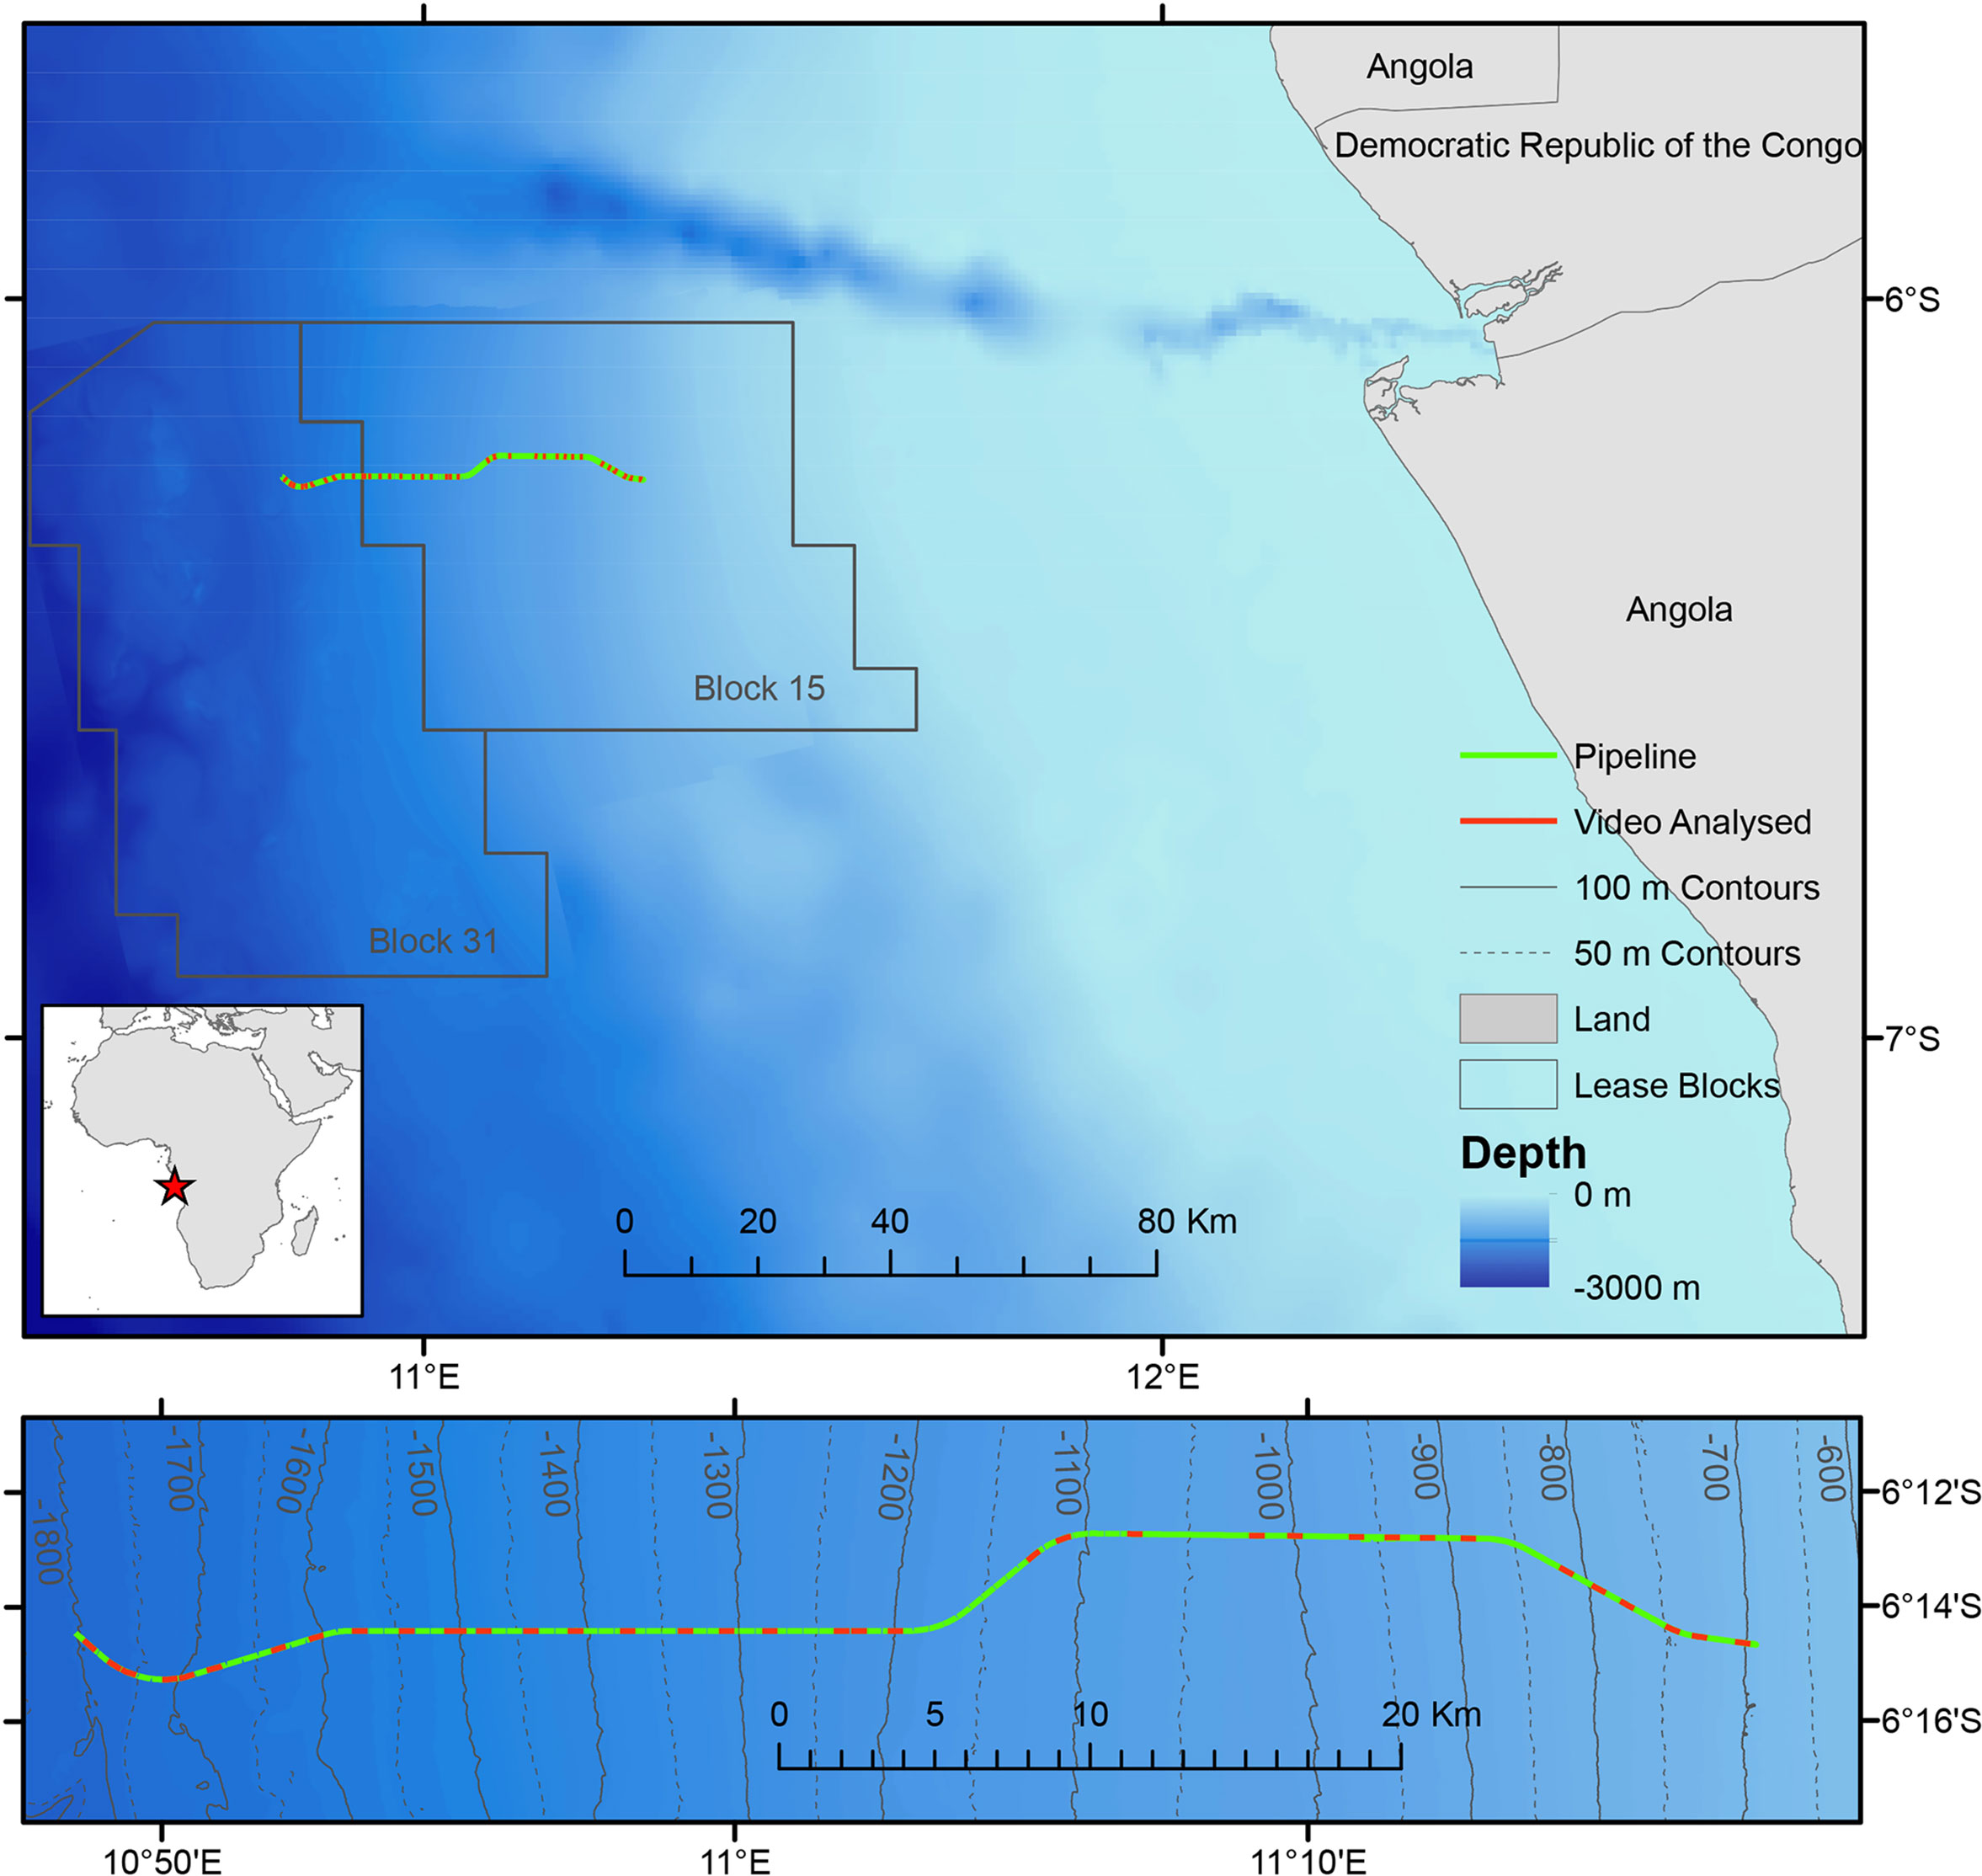
Figure 1 Map showing the location of the survey area in Angola. Contours marked on lower detailed map. Red star on inset map indicates position of survey in west Africa.
A routine pre-lay inspection of the 56 km long swath of seafloor was recorded by ROV Hercules 18 operated from the pipelay support vessel (PLSV) Seven Pacific in December 2013. The ROV was outfitted with a single colour camera and a single black and white camera on a pan and tilt mounting enabling oblique angle viewing. Pre-pipeline installation video survey commenced on December 9th 2013; the last video collected on December 12th 2013. Transect videos were recorded in 30 minute files including position in Easting and Northing (coordinate system Camacupa_TM_11_30_SE), depth (meters), altitude (meters), heading, date, and time. All video was standard definition (720 x 576 pixels). The altitude varied as the ROV recorded above the seafloor and images were scaled using known acceptance angles of the camera (32°) following Jones et al. (2006). The average image width for the pre-pipeline survey was calculated at 2.90 m. Image width was also verified by travelling over objects of known size, such as a drink can, on the seafloor. The video was divided into sections representing 100 m depth intervals. Video from each depth band was segmented at random into three sample units each with 500 m transect length. The sample area was calculated from the average image width and transect length, averaging 1429.21 m2 in the pre-pipeline survey.
After the installation of the pipeline (pipeline installation was completed on 23 February 2014), an initial inspection survey was done three months after completion in May of 2014 from the same vessel. The ROV travelled along the 304.8 mm (12 inch) diameter pipeline. The ROV remained at a consistent height from the seafloor as it moved on wheels in direct contact with the pipeline. The ROV had three cameras viewing obliquely: one was mounted on the front of the ROV viewing the pipeline ahead, while two were on either side of the ROV recording the sides of the pipeline. The video commenced on May 12th and was completed on May 26th. Transect videos were recorded in the same video format as the 2013 pre-pipeline survey. Images were scaled with reference to the known width of the pipeline. The average image width for the post-pipeline survey was calculated at 2.02 m. The same 500 m samples were selected where possible to the pre-pipeline survey. The area imaged was smaller (reduced altitude survey) averaging 939.76 m2.
Pipelines were surveyed in a predominantly westerly direction (except in the 700 m depth zone, which were surveyed in an easterly direction) during the pre-installation surveys. The post-installation surveys were surveyed in the opposite direction (Table 1).
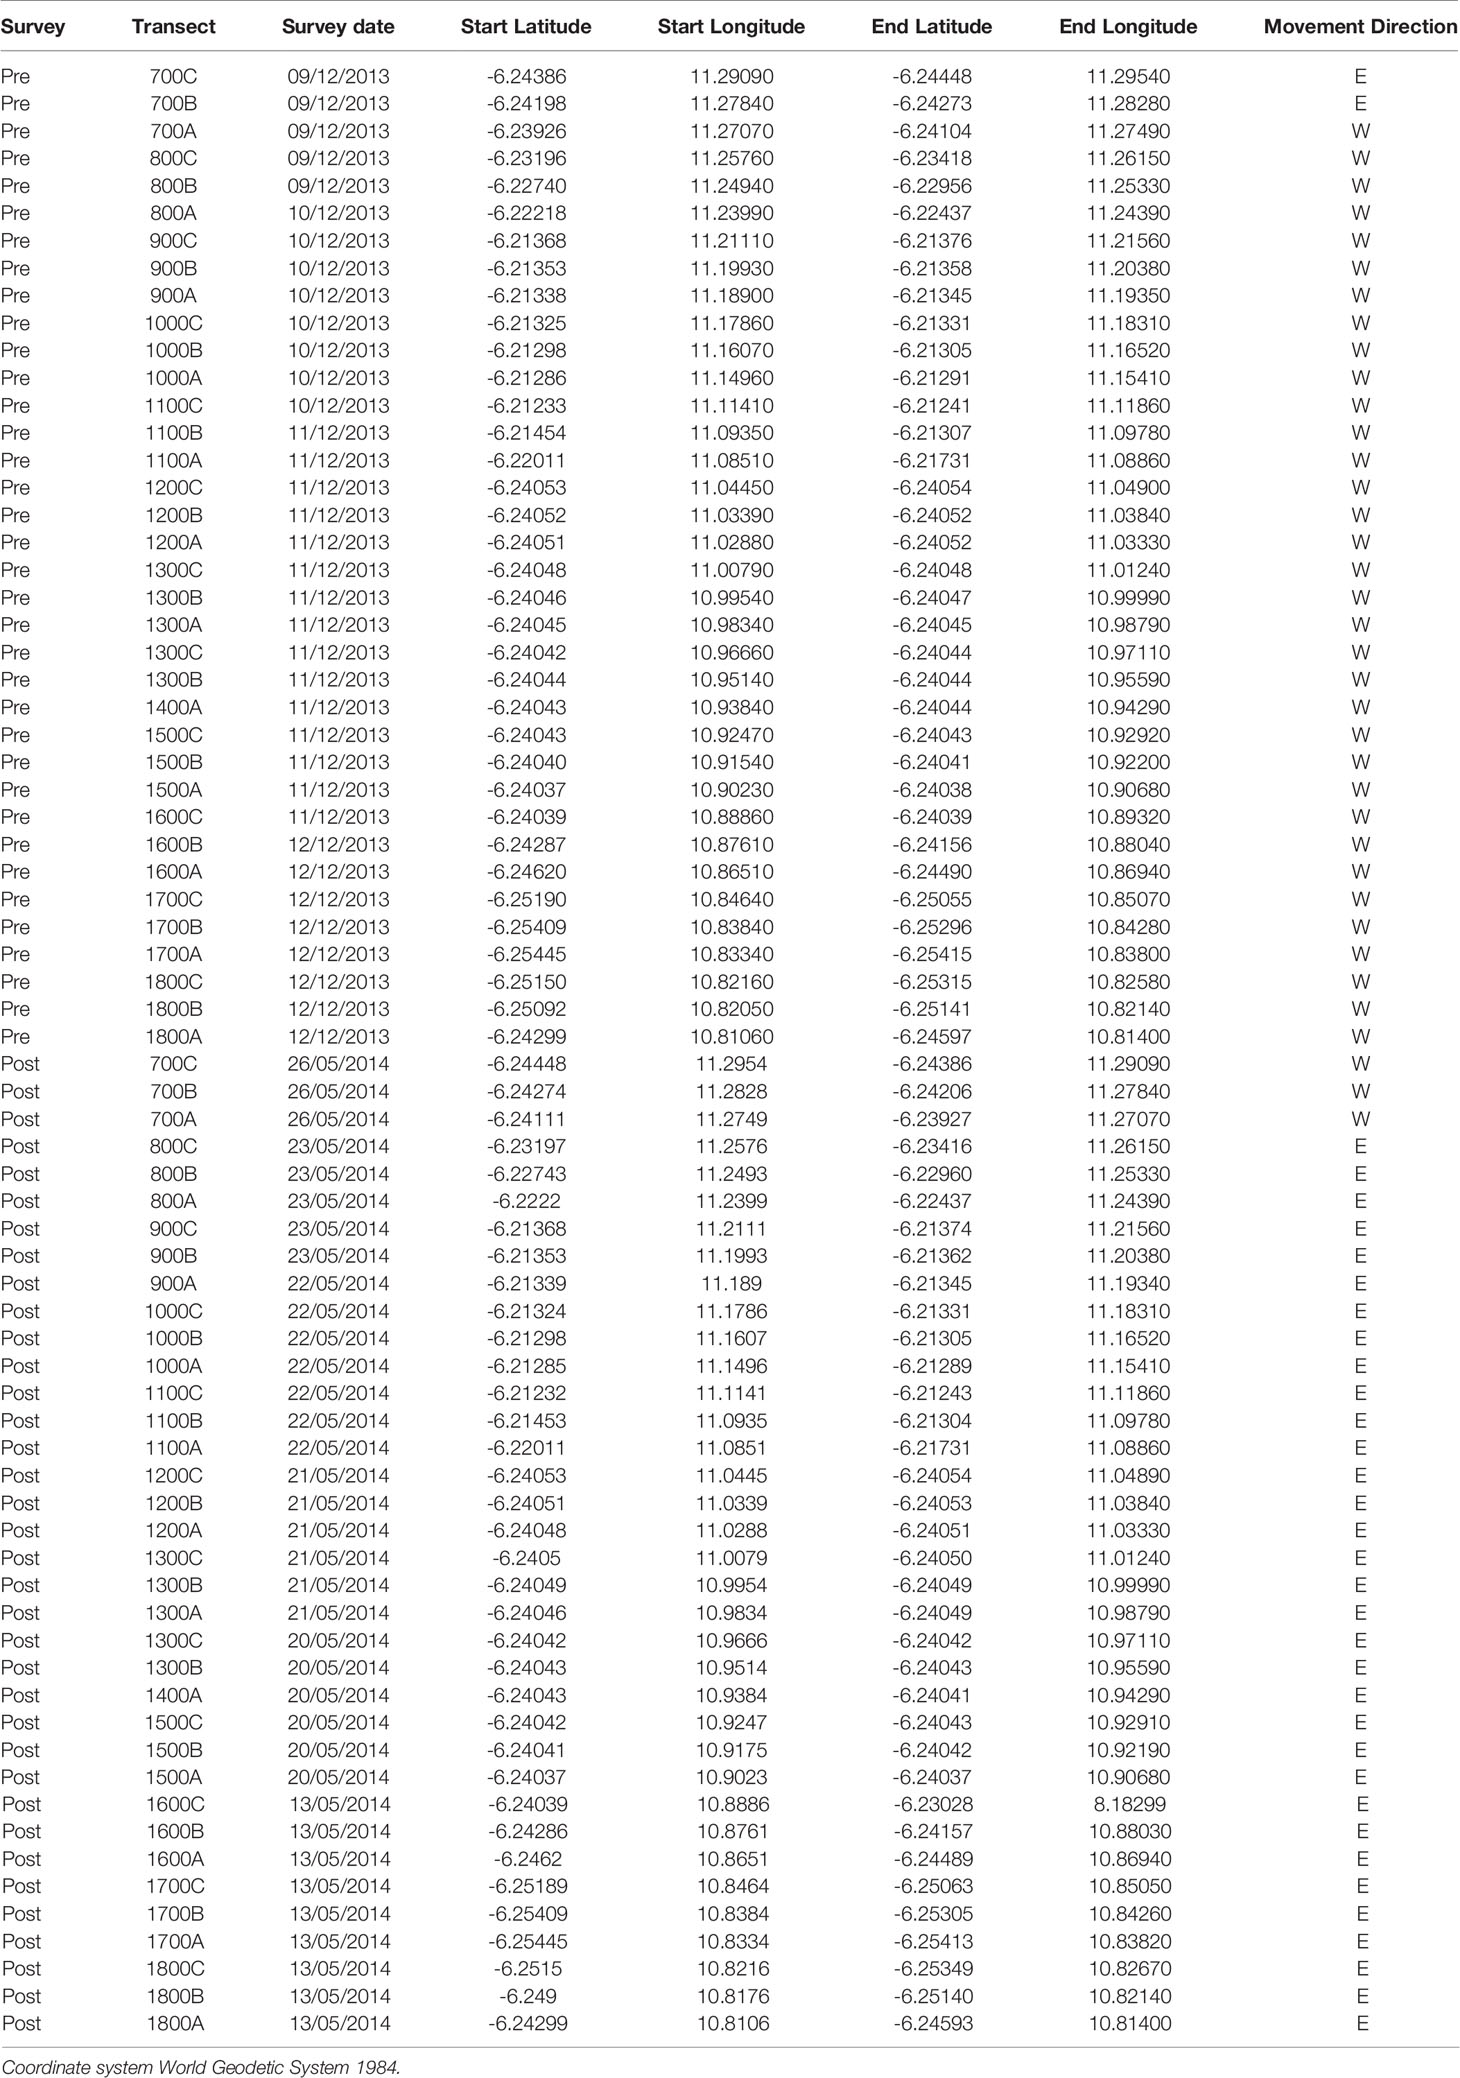
Table 1 Positions of remotely operated vehicle transects and approximate movement direction.
Image Annotation
Image annotation was standardized between the two surveys. The order of assessment of individual 500 m transects was randomized to reduce the impact of sequence bias (Durden et al., 2016).
Video files were viewed using VLC Media Player (version 2.2.6, VideoLan Community). For the post-pipeline survey only video from the central camera was used for annotation, ensuring a similar approach to the pre-pipeline survey. The video from the side cameras were used on occasion to confirm identification of organisms. All organisms that were entirely within the field of view were counted and identified within each sample (Durden et al., 2016). Organisms were counted at a constant position near the base of the screen (at a line 150 pixels above the bottom of the frame in 2013 and at the level of laser line in 2014) to ensure observations were made with the highest resolution and best lighting.
An organism only partly within the frame was excluded. Every observation was noted with the time, position, depth, identification, and necessary measurements for area, as well as relative position of the organism from the centre of the field of view or pipeline. Measurements were made from the centre of the pipeline, or screen, to the centre of the organism using ImageJ software (version 1.51s 64-bit, National Institutes of Health). In 2014, when the pipeline was installed and visible in video, it was noted whether the pipeline was buried or exposed. It was also noted if organisms counted were directly on or under the pipeline.
Faunal identifications (morphotypes) were made following a standardised catalogue developed for the region (Pfeifer, 2021) that aligns with existing image-based literature from the area (Vardaro et al., 2013; Jones et al., 2014; Jamieson et al., 2017). Organisms were classified to lowest taxonomic level and named according to WoRMS (Horton et al., 2019). Open nomenclature identifiers (Horton et al., 2021) were used to indicate identifier confidence following the protocol set out for physical specimens (Sigovini et al., 2016).
Video resolution varied along transects (particularly prior to pipeline installation) because of suspended sediment, debris, or altitude variation. Poor quality sections of video were identified, removed from analysis and additional video was analysed at the end of each transect to bring the total length to 500 m. In all cases, any changes in transect location did not bring the data outside of the identified depth zone. A single annotator was used for all video analysis to minimize annotator bias (Durden et al., 2016). Only megafauna greater than 80 mm in maximum diameter were included in analysis to ensure consistent identifications could be made between surveys. Smaller fauna, including amphipods, squat lobsters and other small decapods were very abundant but were not included in analysis. Wholly benthopelagic organisms, such as scyphozoans and ctenophores were commonly observed, but were not included in analysis.
Data Analysis
A range of ecological parameters were calculated for each replicate transect (used as the sampling unit for all analysis). Numerical density (individuals m−2) was calculated for the whole area examined as well as split between the area on the pipe and on the adjacent sediment. To assess the range of diversity characteristics, Hill’s diversity numbers of order 0, 1, and 2 (Jost, 2006) standardised by individuals were calculated as morphospecies richness (S), the exponential form of the Shannon index (exp H´), and the inverse form of Simpson’s index (1/D), using the ‘vegan’ package implemented in R (Oksanen et al., 2019). Hill numbers are a mathematically unified family of diversity indices that incorporate species richness and species relative abundances (Chao et al., 2014).
Generalized linear models (GLM) (Dobson and Barnett, 2008) were built to test whether statistically significant variation in biological parameters was apparent between years and 100 m depth bands, using the ‘car’ package (Fox and Weisberg, 2011) implemented in R (R Core Team, 2020). Models were fitted with quasi-Poisson errors in non-negative integer metrics (i.e. density, S) with over-dispersion (Gardner et al., 1995), and with normal errors applied to non-integer variables (i.e. exp Hí, 1/D) (Freund and Littell, 1981). Homogeneity of variance and normality assumptions were verified by visual inspection of model histograms and QQ plots. Statistical significance was reported for p < 0.05.
Differences in community composition between years and depth bands were tested using permutational multivariate analysis of variance (PERMANOVA) based on Bray-Curtis dissimilarity matrix of fourth-root transformed faunal densities, using the ‘vegan’ package implemented in R. Similarities were visualised using non-metric multi-dimensional scaling (nMDS).
Results
Seabed Environment
The seabed observed prior to pipeline installation comprised soft sediments with abundant bioturbation (<100 mm width pits, tracks and mounds). No hard substratum was observed, apart from the pipeline and anthropogenic litter. Most litter (Figure 2) was observed after pipeline installation and over 1500 items were recorded in the 2014 survey (16 items total in the 2013 survey) comprising plastic bags, bottles, buckets and aluminium cans. Litter was relatively abundant (>0.1 litter items m-2) in 2014 between 700 and 1400 m depth (max 0.24 litter items m-2 at 1300 -1400 m depth) and the amounts reduced below 1500 m depth (< 0.07 litter items m-2; < 0.03 litter items m-2 at >1700 m). Terrigenous vascular plant and algal material was observed very occasionally (3 occurrences) prior to pipeline installation, but regularly observed near the pipeline after installation (>500 occurrences). Drifting particles in the water column showed that currents were predominantly from the north to the south. Most (79%) of the litter accumulated on the downstream (southern) side of the pipeline. However, organic material was approximately evenly distributed (56% on southern side) either side of the pipe.
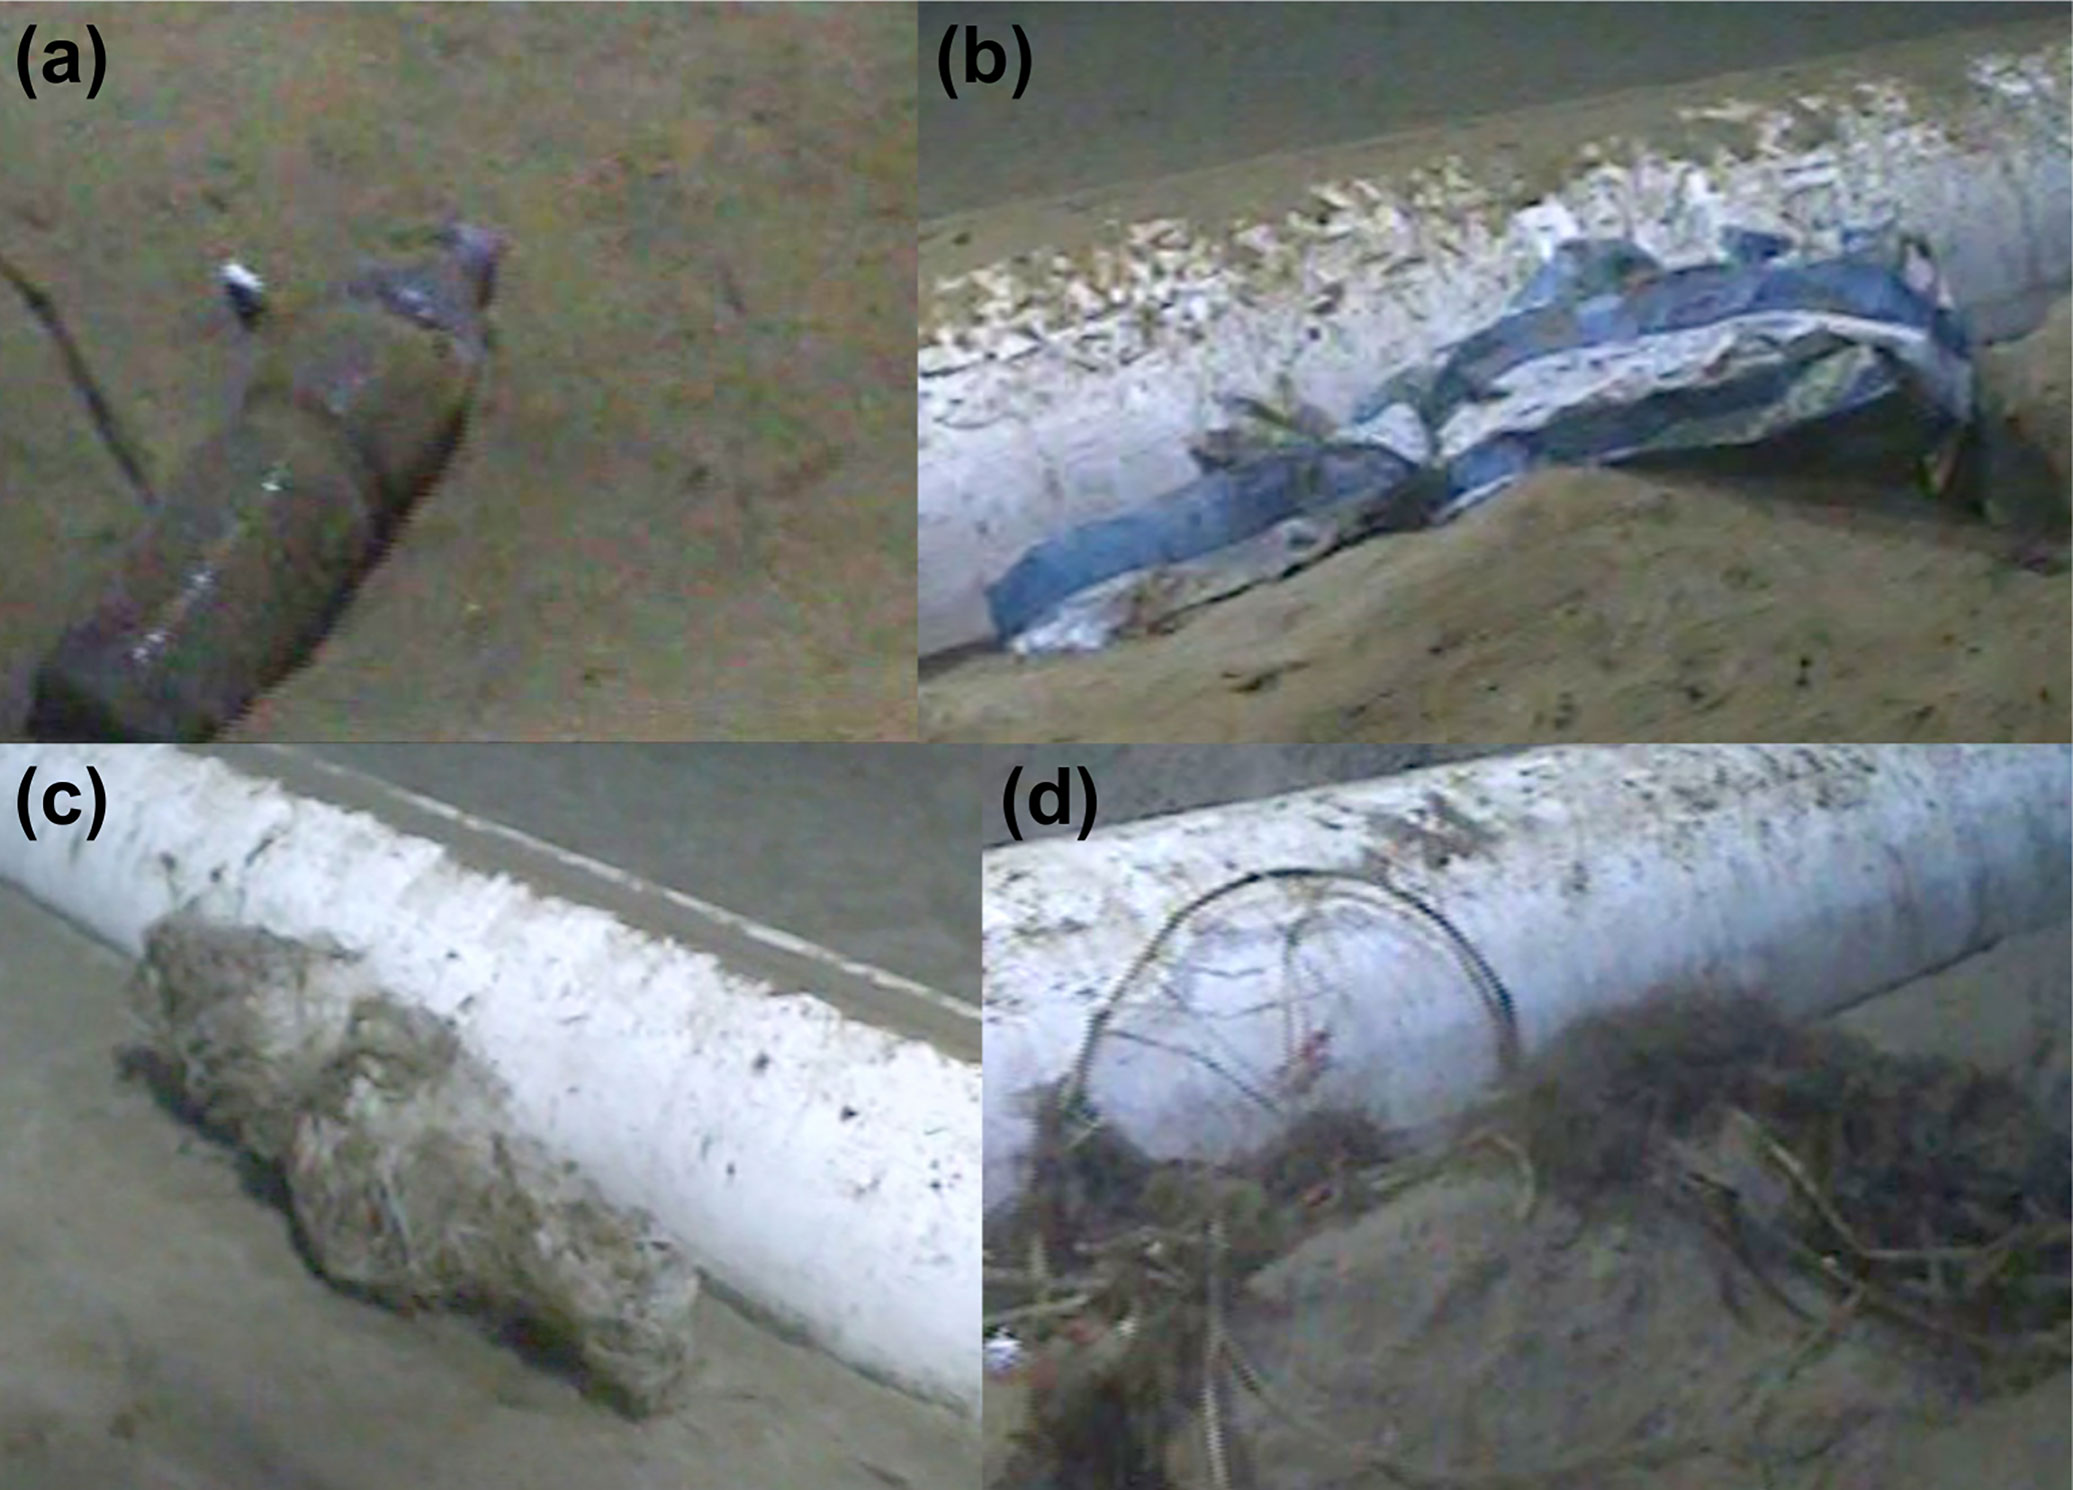
Figure 2 Selected pipeline associations. (A) Plastic bottle c. 730 m; (B) Plastic bag c. 1333 m; (C) Fishing net c. 1696 m; (D) Plant debris c. 1768 m.
Density of Megafauna
In both 2013 and 2014 megafaunal density varied significantly with depth (Table 2). Before the pipeline was installed megafaunal density was lowest at 1800 m (0.023 ind m-2) and highest at 800 m (0.215 ind m-2) with an additional peak in density at 1400-1500 m (Figure 3). There were significant differences between years (GLM: L-ratio = 12.03, d.f. = 1, p < 0.001), depths (L-ratio = 56.74, d.f. = 11, p < 0.001) and a significant interaction (L-ratio = 60.62, d.f. = 11, p < 0.05) – indicating that the pattern with depth changed between years. In 2014, when the pipeline was present, megafaunal density was significantly higher overall than the 2013 survey particularly at 900 – 1200 m and 1800 m depth.
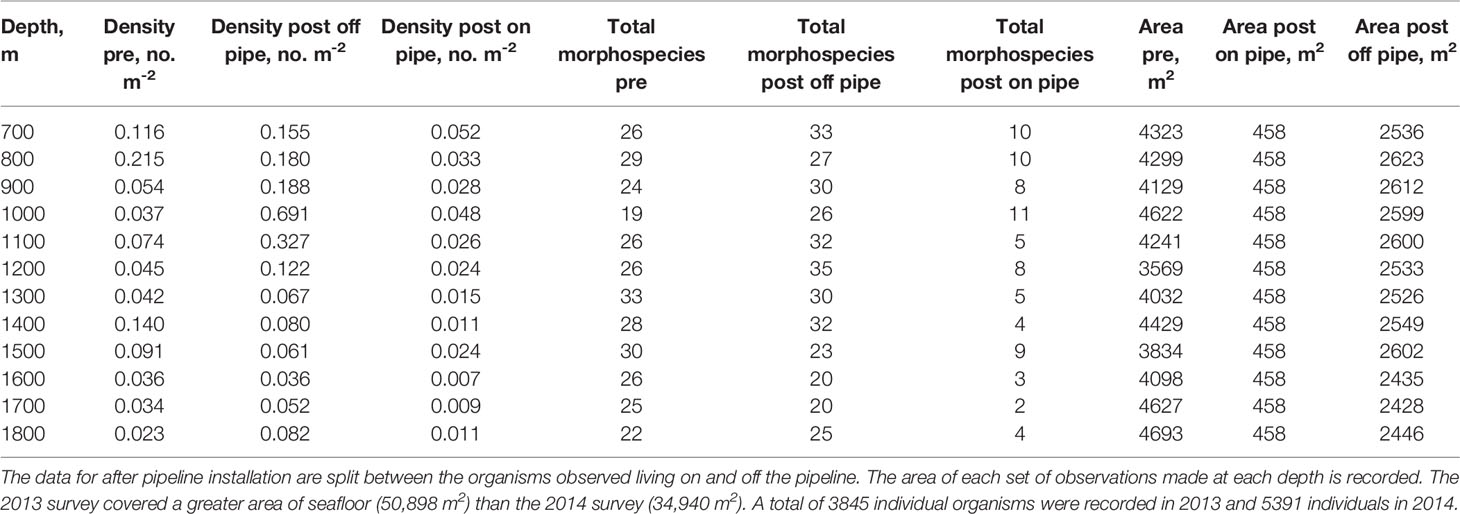
Table 2 Depth-related patterns in density and morphospecies richness (number of morphospecies observed) both before (pre) and after (post) pipeline installation.
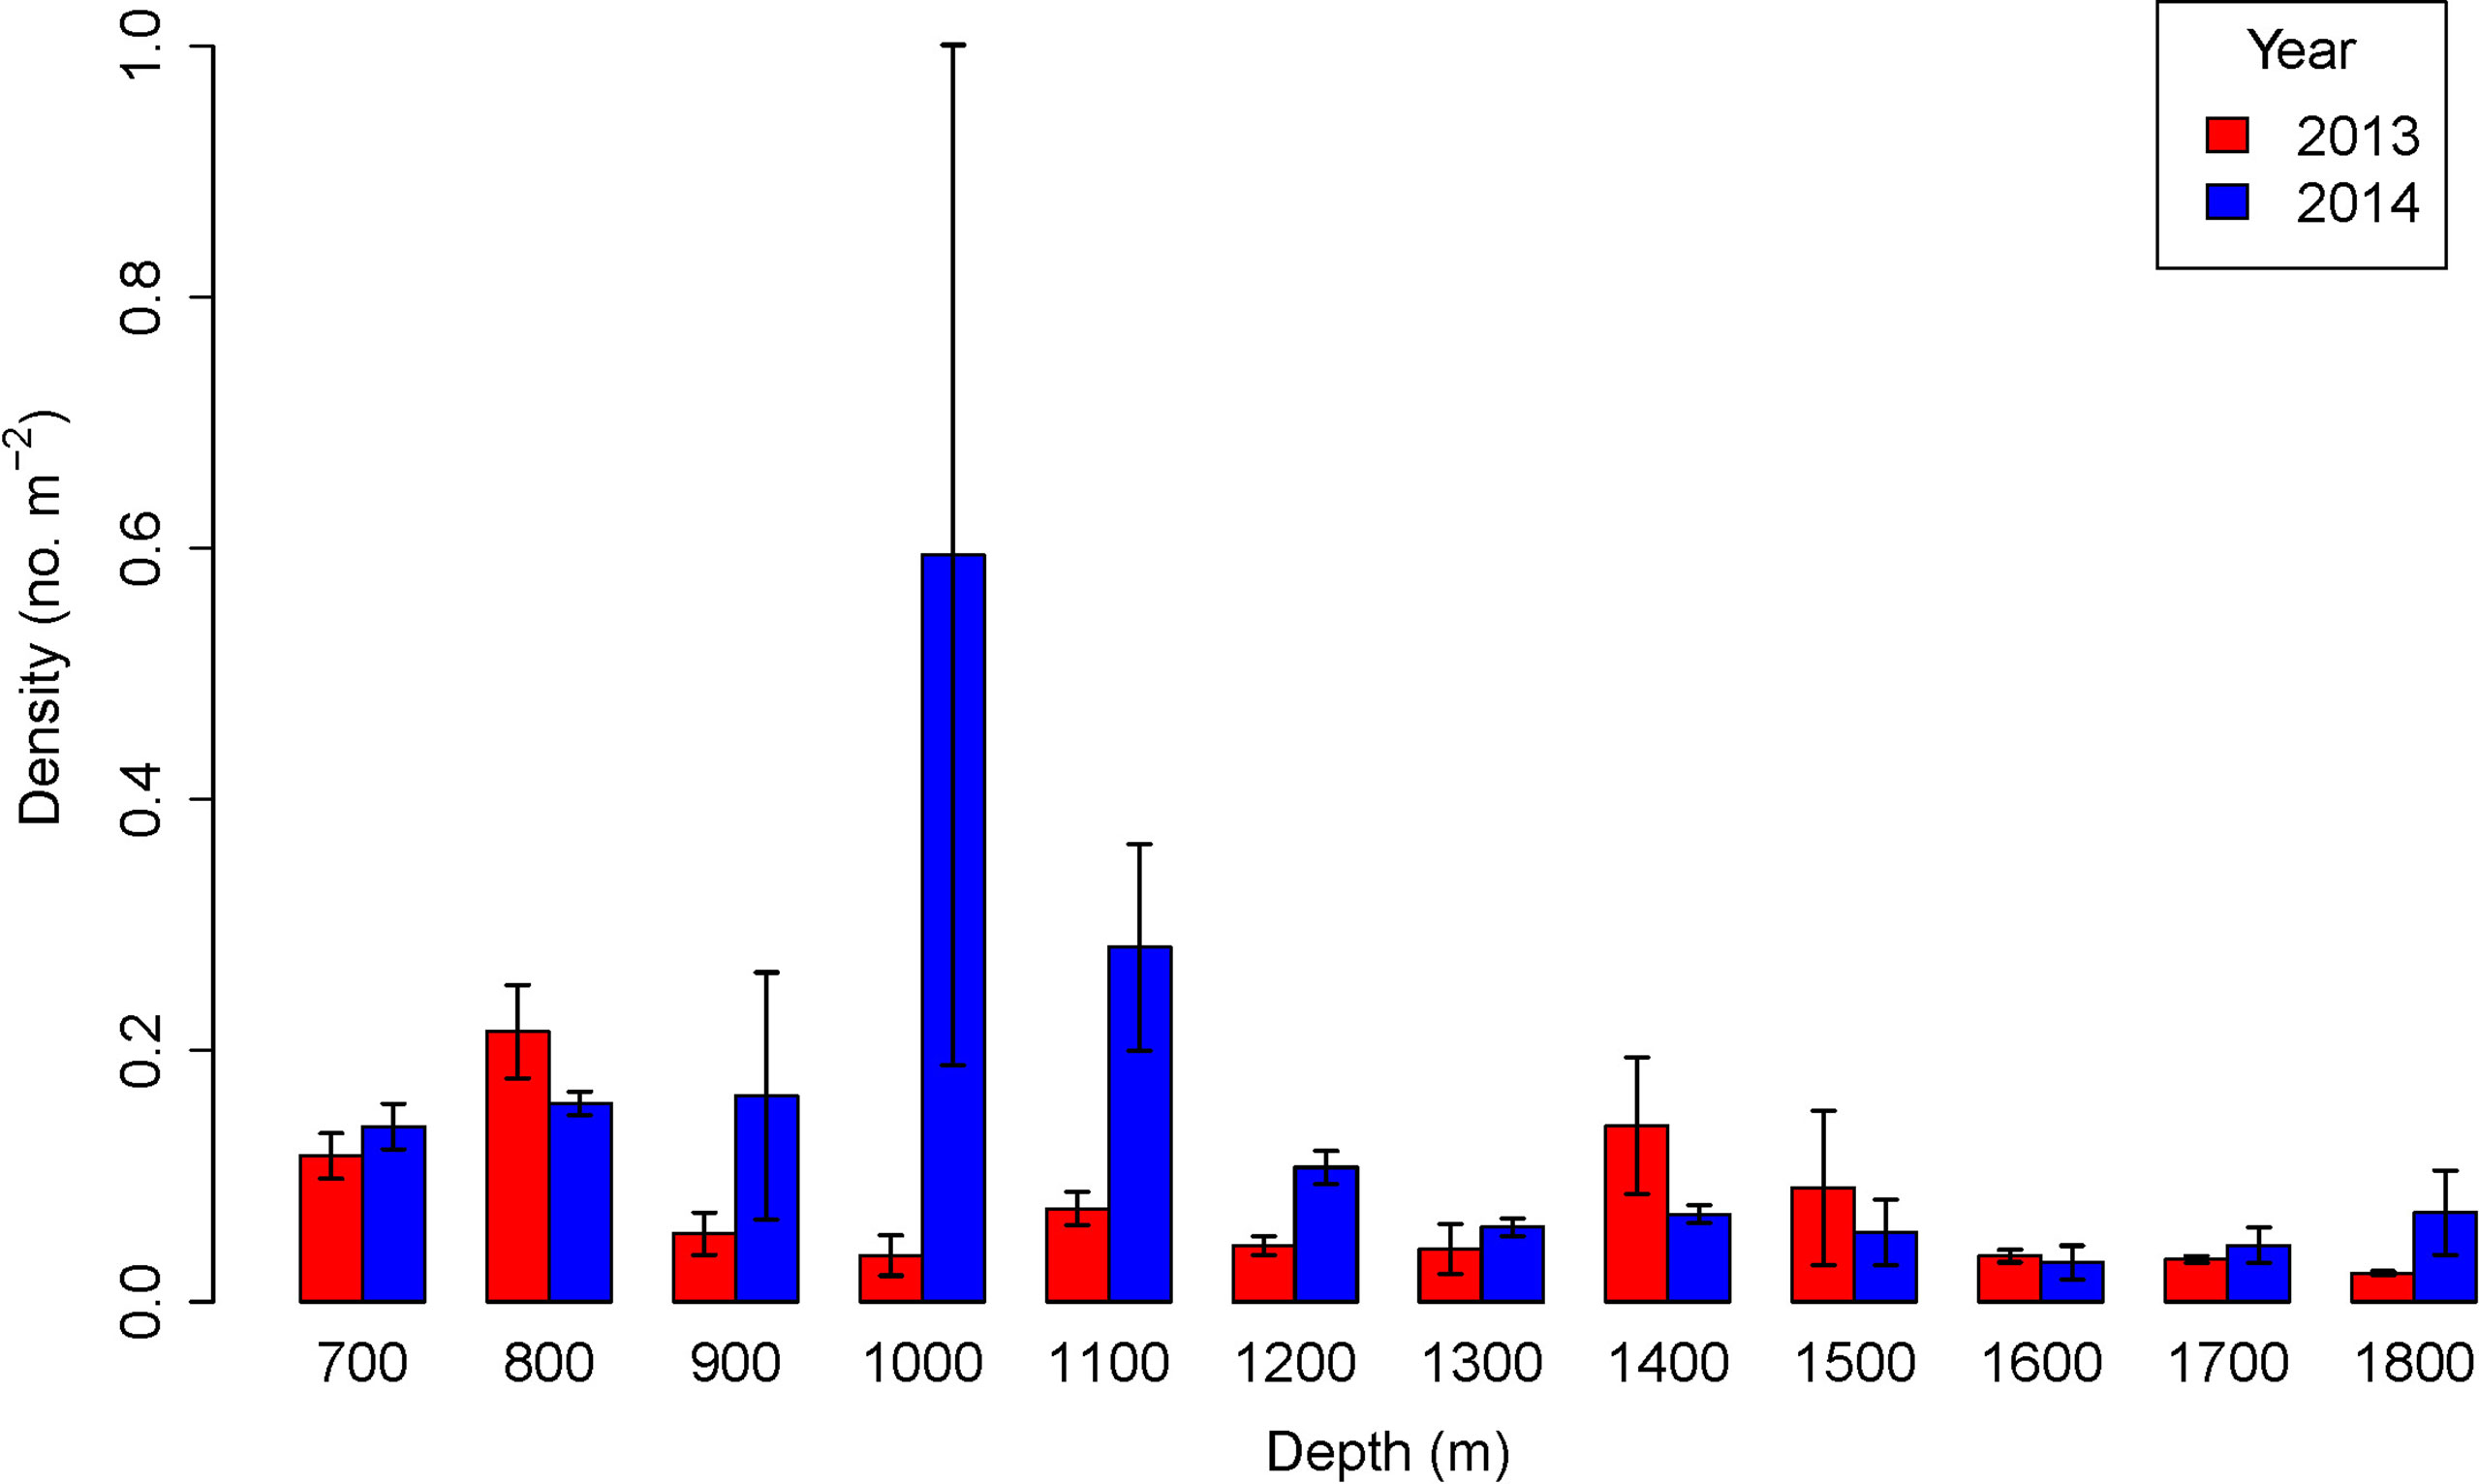
Figure 3 Density variation with depth before (2013) and after (2014) pipeline installation. Error bars represent standard deviations.
In 2013, the benthic megafauna (Figure 4) were evenly distributed across the width of the transect (Figure 5). After the installation of the pipeline, the distribution of animals changed. In 2014 a total of 132 individuals were observed on the pipeline itself (overall density = 0.02 ind m-2) but there were not sufficient individuals to address patterns with depth. On the adjacent sediment a total of 5496 individuals were observed (overall density = 0.17 ind m-2). The density was significantly higher than on the pipeline itself and the 2013 seabed once the depth variation had been accounted for (GLM: L-ratio = 87.95, d.f. = 2, p<0.001) but organisms were distributed close to the margin of the pipe (Figures 4, 5).
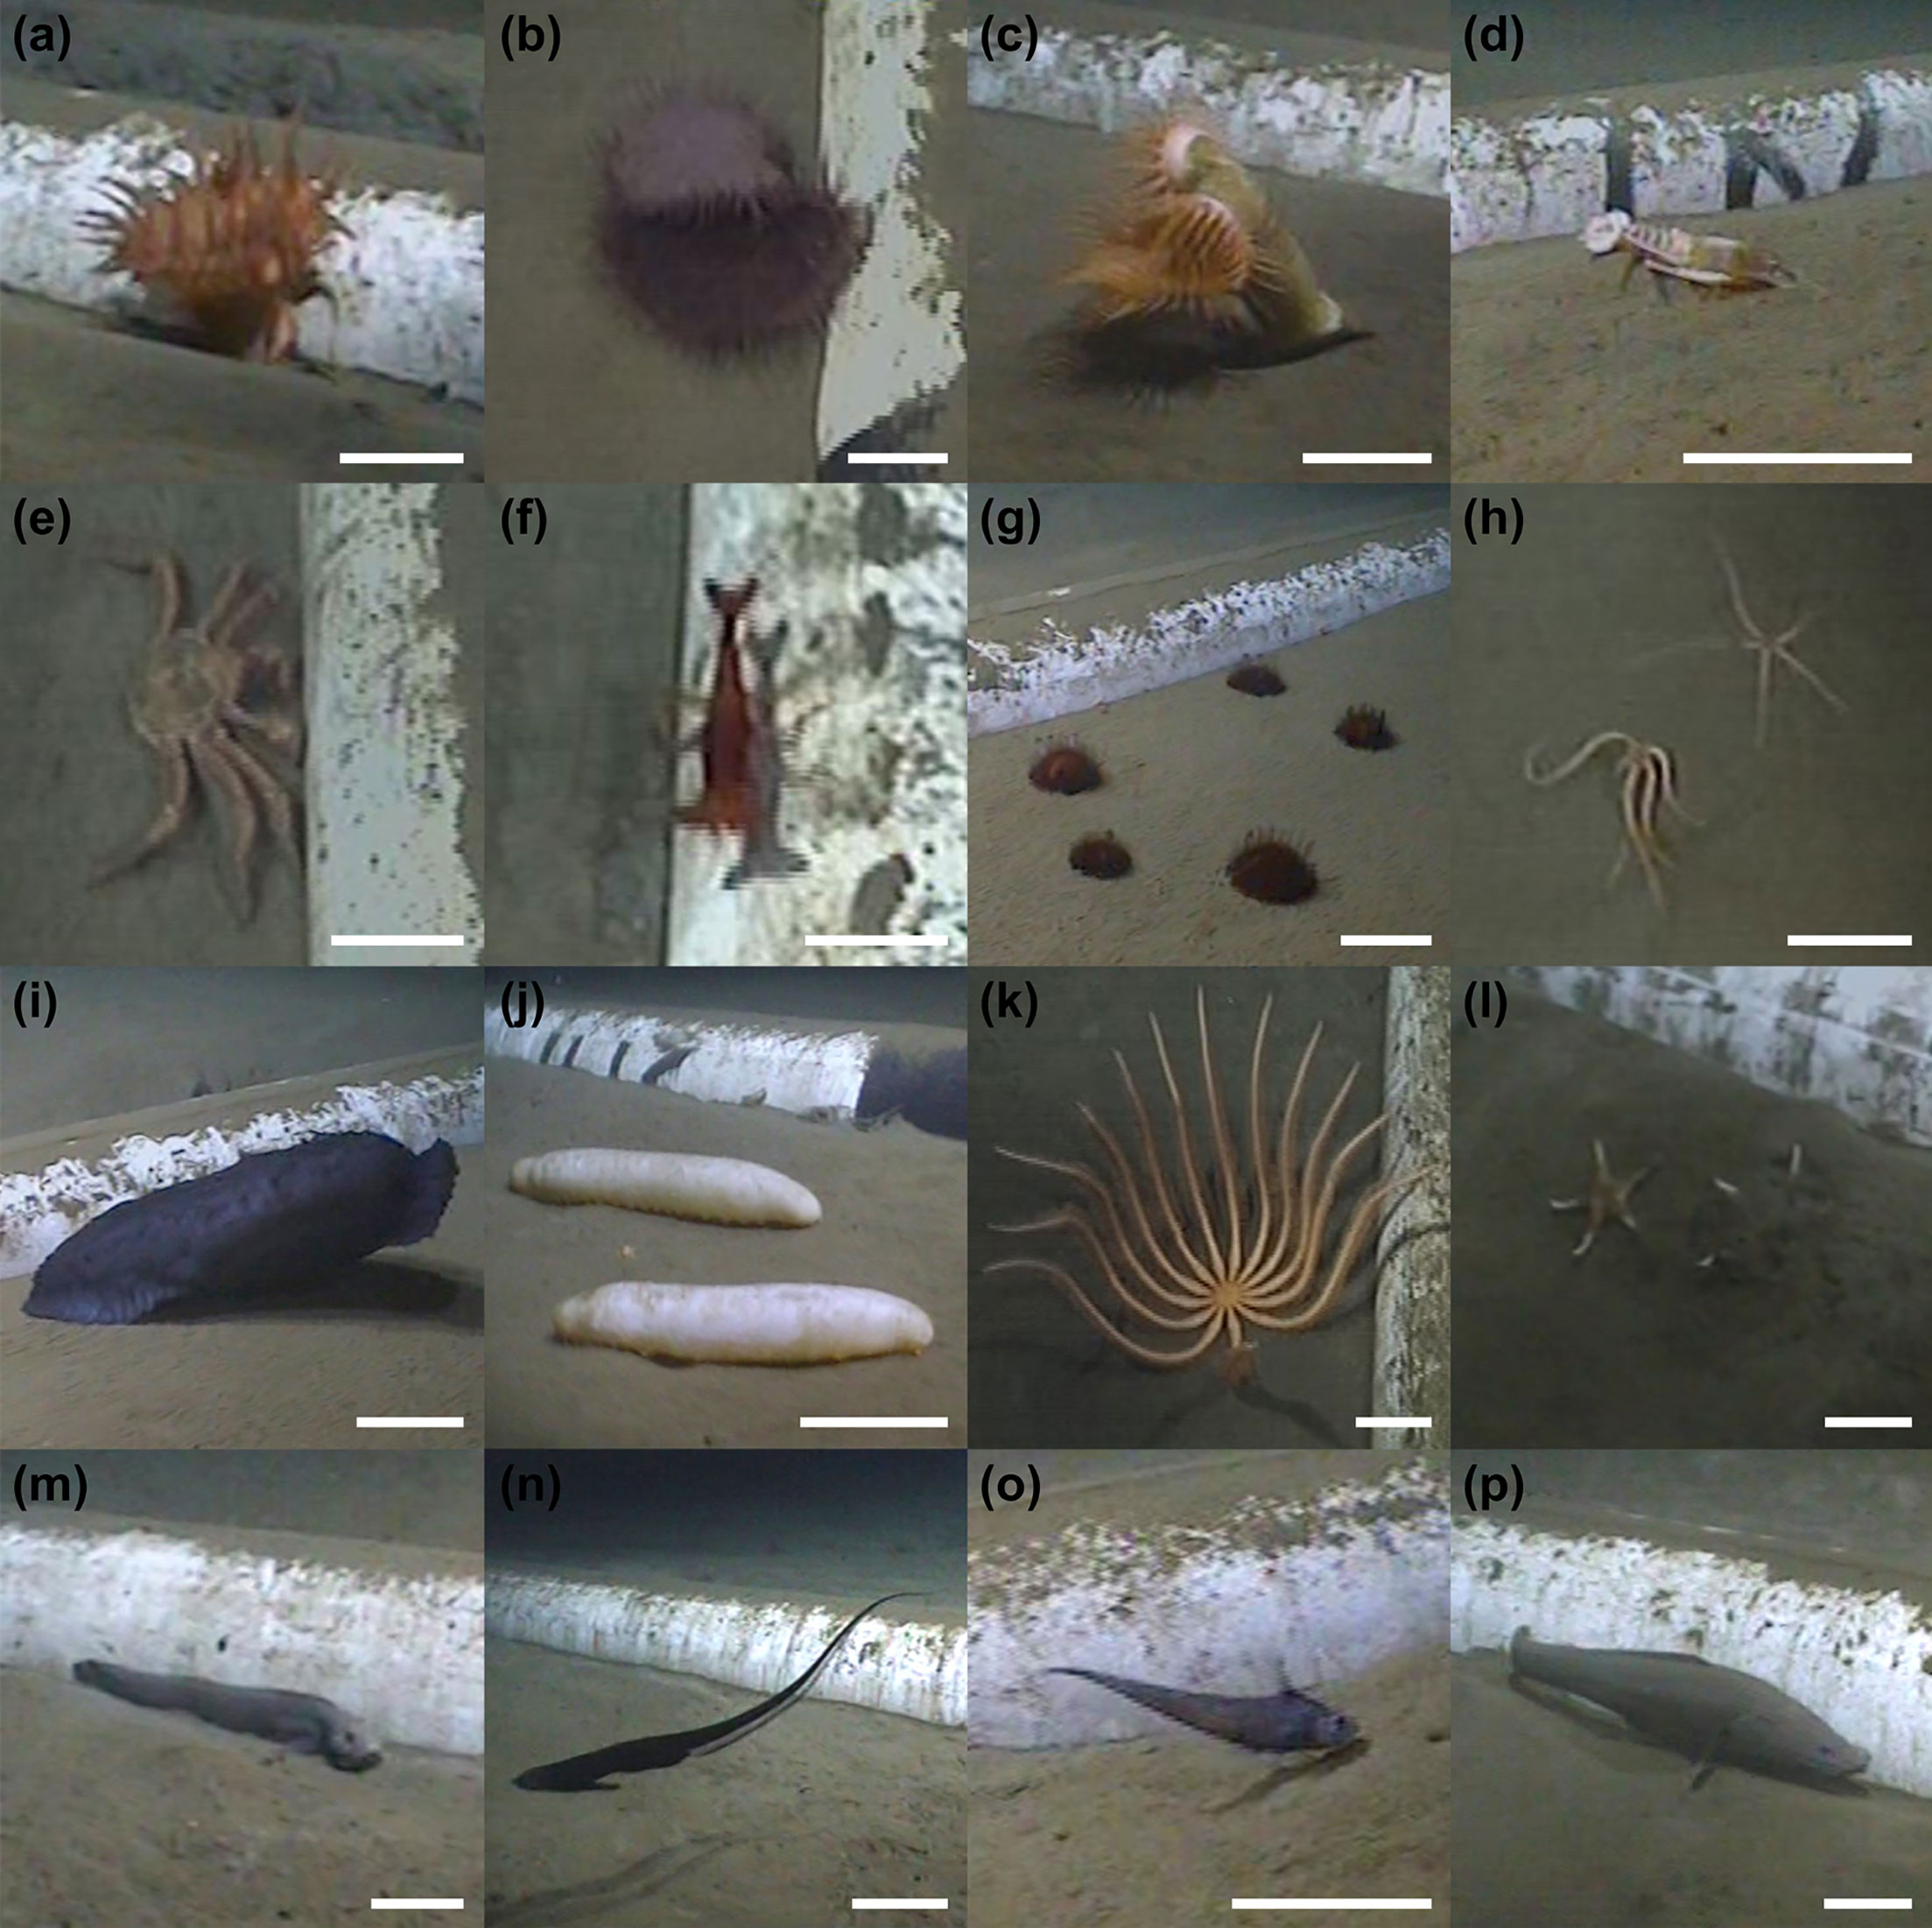
Figure 4 Selected morphotypes visible in survey. (A) Actinostolidae gen. indet.; (B) Actinoscyphia sp. indet. 1; (C) Actinoscyphia sp. indet. 2; (D) Polycheles sp. indet. 1; (E) Lithodidae stet.; (F) Decapoda natant fam. indet. 2; (G) Phormosoma sp. indet.; (H) Ophiuroidea ord. indet.; (I) Benthothuria sp. indet. 1; (J) Holothuroidea ord. indet. 4; (K) Brisingida stet.; (L) Asteroidea ord. indet. 2; (M) Pachycara sp. indet.; (N) Eurypharynx sp. indet. 1; (O) Macrouridae gen. indet. 3; (P) Bythitidae stet.
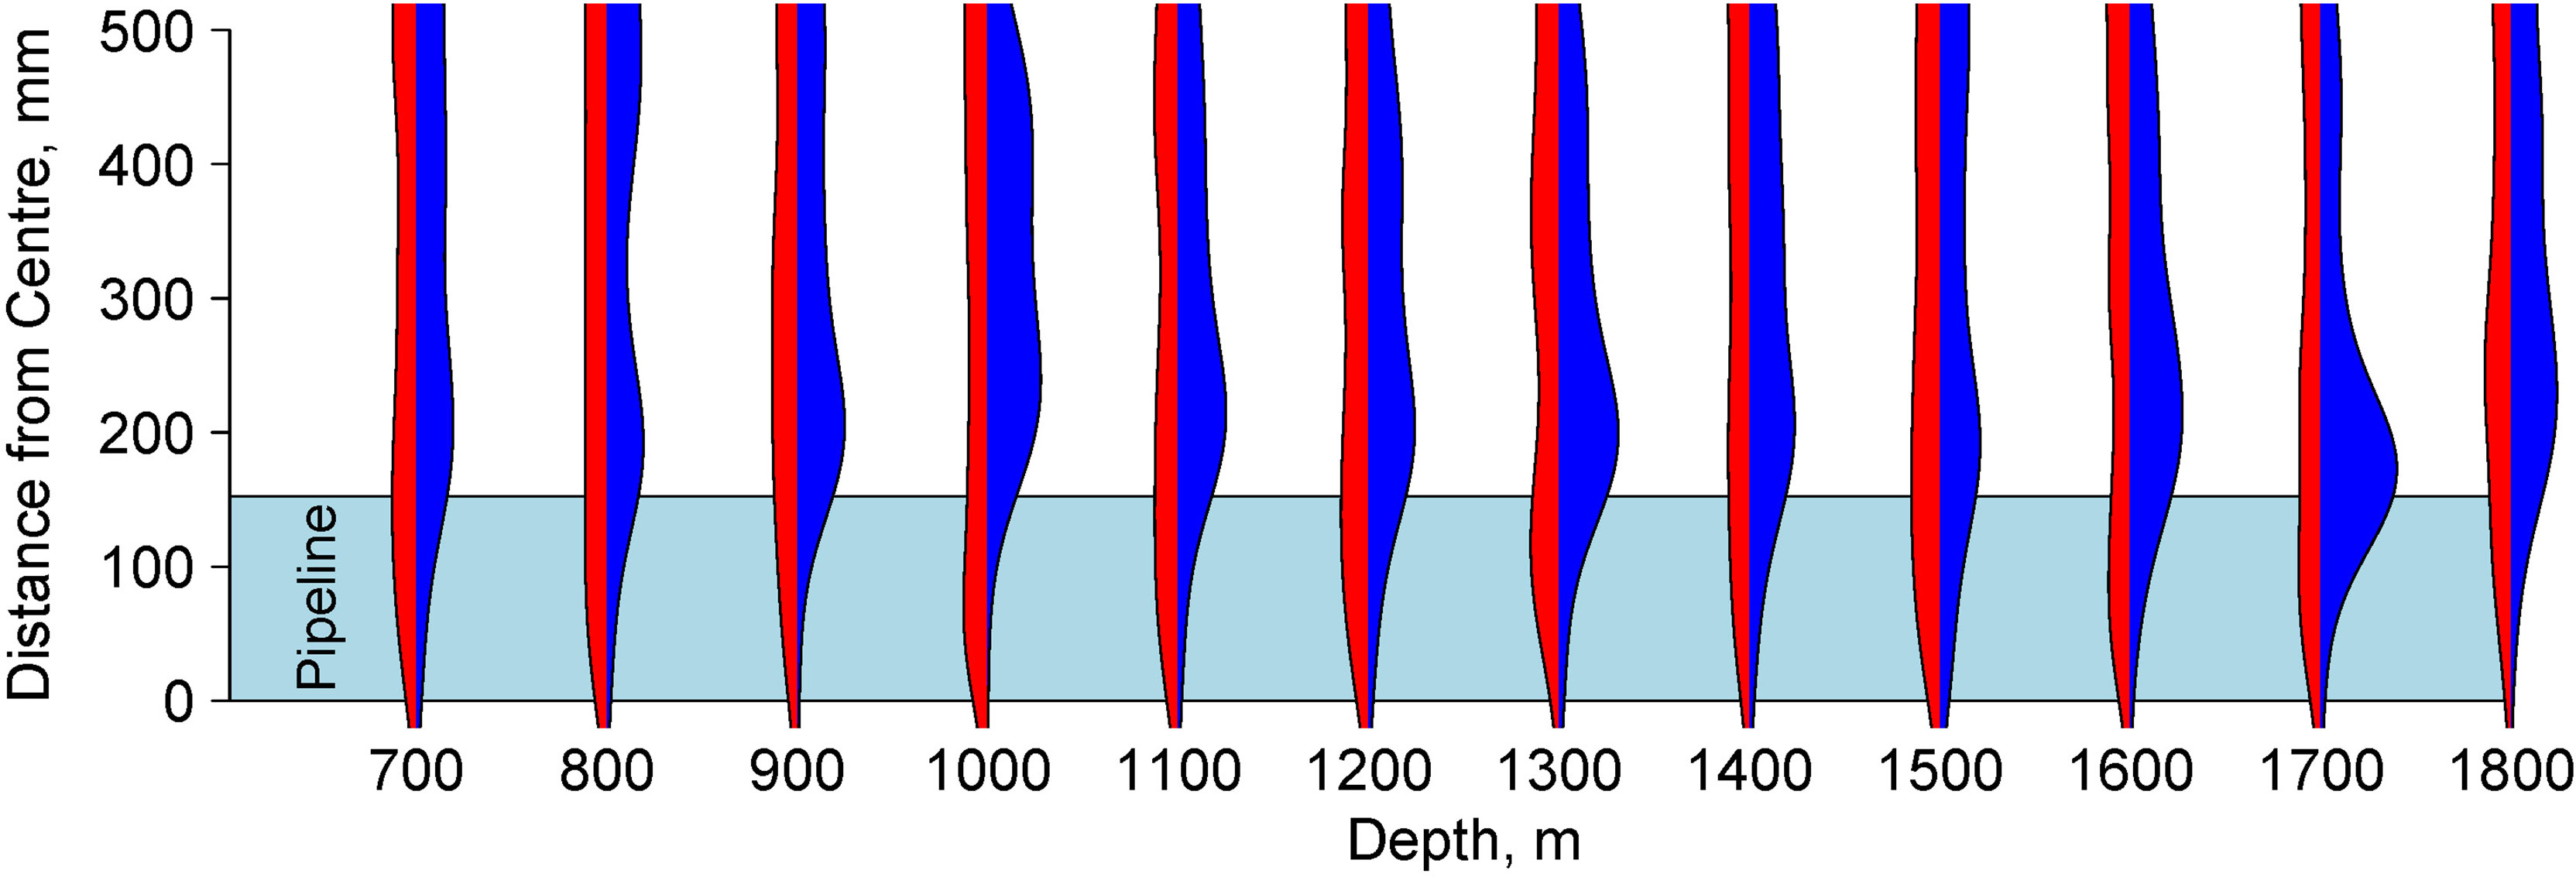
Figure 5 Beanplot of density of megafauna prior to pipeline installation (red; left hand side of each plot) and after pipeline installation (blue; right hand side of each plot) relative to centre of the transect for each depth zone. In 2014 this was aligned with the pipeline axis. The extent of the pipeline (at 153 mm from the centre) is shown as a light blue polygon. The density trace is smoothed using a Gaussian smoother. The increased densities of megafauna close to the edge of the pipeline are visible at all depths after pipeline installation but not before.
Patterns in Individual Species
The most abundant organism was the echinoid Phormosoma sp. indet., almost all the individuals of this morphotype occurred between 800 and 1100 m depth and it was around an order of magnitude more abundant in 2014 than in 2013. Phormosoma sp. indet. (example image in Figure 4D) was particularly abundant at the edge of the pipeline. In 2014, densities tended to be several times higher on the north side of the pipeline, except at 1000 - 1100 m where abundances were nearly an order of magnitude higher on the south side. Although it was harder to detect an elevation in abundances close to the pipe in less abundant taxa, there is some evidence of increased abundances (approximately double the average frequency) of two large holothurians Paelopatides sp. indet. (most abundant >1200 m) and Benthothuria sp. indet. 1 (most abundant <1000 m, Figure 4I) adjacent to the pipe. Other echinoderms, such as ophiuroids and asteroids, were more evenly distributed with distance from the pipeline. Many taxa showed increased abundances at particular depth ranges, for example ophiuroids (second most abundant taxon - comprising several species) were almost exclusively found at 700 – 800 m and 1700 – 1800 m depth (see Supplementary Table). Many, but not all, taxa, for example asteroids, Bythitidae stet. and Zoarcids (Pachycara sp. indet.), had higher densities in 2014 than 2013 (Figures 4M, P). Notable exceptions, with higher densities in 2013, include ophiuroids, Psychropotidae indet. and Peniagone sp. indet.
Only 30 individual sessile animals were observed on the pipeline, these comprised Actinoscyphia sp. indet. 1 (12 individuals; 36% total observations; Figure 4B), Actinaria indet. 5 (9 individuals; 41% total observations), Anthozoa indet. 2 (4 individuals; 44% total observations), Actinoscyphia sp. indet. 2 (4 individuals; 21% total observations; Figure 4C) and Actinaria indet. 1 (1 individual; from a total of 53 individuals). These animals were large (Actinaria indet. 1, the largest, was up to 200 mm diameter) and were visibly attached to the pipe. When the anemones came into contact with the wheels that directed the ROV along the pipeline they were detached easily at the base of the column.
Diversity Patterns
There were significant differences in species richness between years (GLM: L-ratio = 10.64, d.f. = 1, p<0.01), depths (GLM: L-ratio = 61.33, d.f. = 11, p<0.001) and the interaction (GLM: L-ratio = 28.87, d.f. = 11, p<0.001). Species richness was generally higher in 2014, after the pipeline was installed (Figure 6), particularly at depths between 700 and 1100-1200 m. Deeper than 1200 m species richness was similar between the years. In 2013, species richness varied with depth with peaks at around 800 m and 1300 m depth. In 2014 species richness was approximately constant between 700 and 1200 m depth, decreasing at deeper depths.
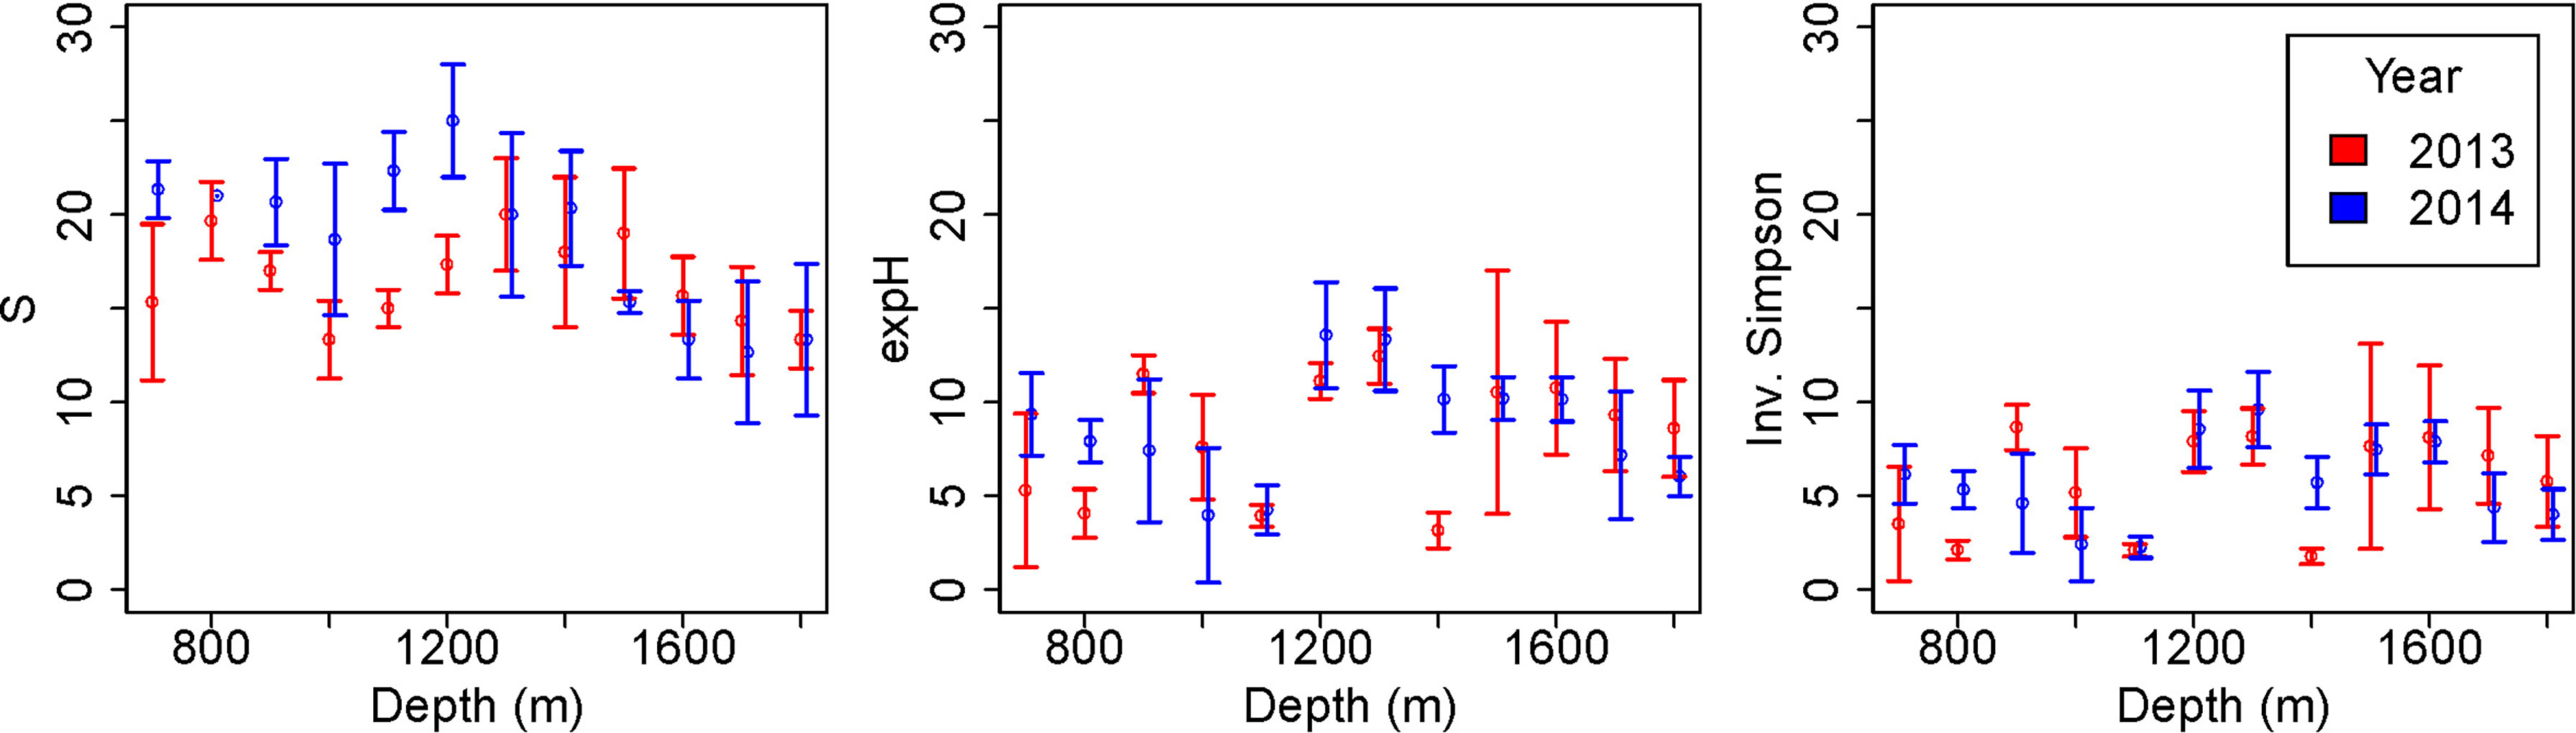
Figure 6 Diversity variation with depth before (2013) and after (2014) pipeline installation. Error bars represent standard deviations. Diversity measured as species richness (S), exponential Shannon index (expH) and inverse Simpson index (Inv. Simpson) following Hill (Hill, 1973).
Exponential Shannon diversity was not significantly different between years (GLM: L-ratio = 0.47, d.f. = 1, p = 0.5) but was different between depths (GLM: L-ratio: 68.73, d.f. = 11, p < 0.001). There was broadly higher diversity, as measured by exponential Shannon, at 1200 – 1800 m depth than shallower, although there was an exception at 1400 m in 2013 (Figure 6). Inverse Simpson diversity shows a very similar pattern to exponential Shannon diversity.
Community Structure
Overall, the community composition varied significantly between years (PERMANOVA: Pseudo-F=21.41, df = 1, p < 0.001), depths (Pseudo-F=8.12, df = 11, p < 0.001) and the interaction between year and depth (Pseudo-F = 2.40, df = 11, p < 0.001). The difference between the years is particularly striking, with clear dissimilarity between years (Figure 7). In both years, the multivariate community similarity shows a gradient of change with depth (Figure 7). Although the gradient is similar before and after pipeline installation the significant interaction indicates differences between the depth patterns in 2013 and 2014. The most distinct communities (by Bray-Curtis dissimilarity) were in the shallowest sites in 2013 (700-900 m) and the deepest in 2014 (1600-1800 m), although there was a gradual increase in dissimilarity with increasing depth difference between sites.
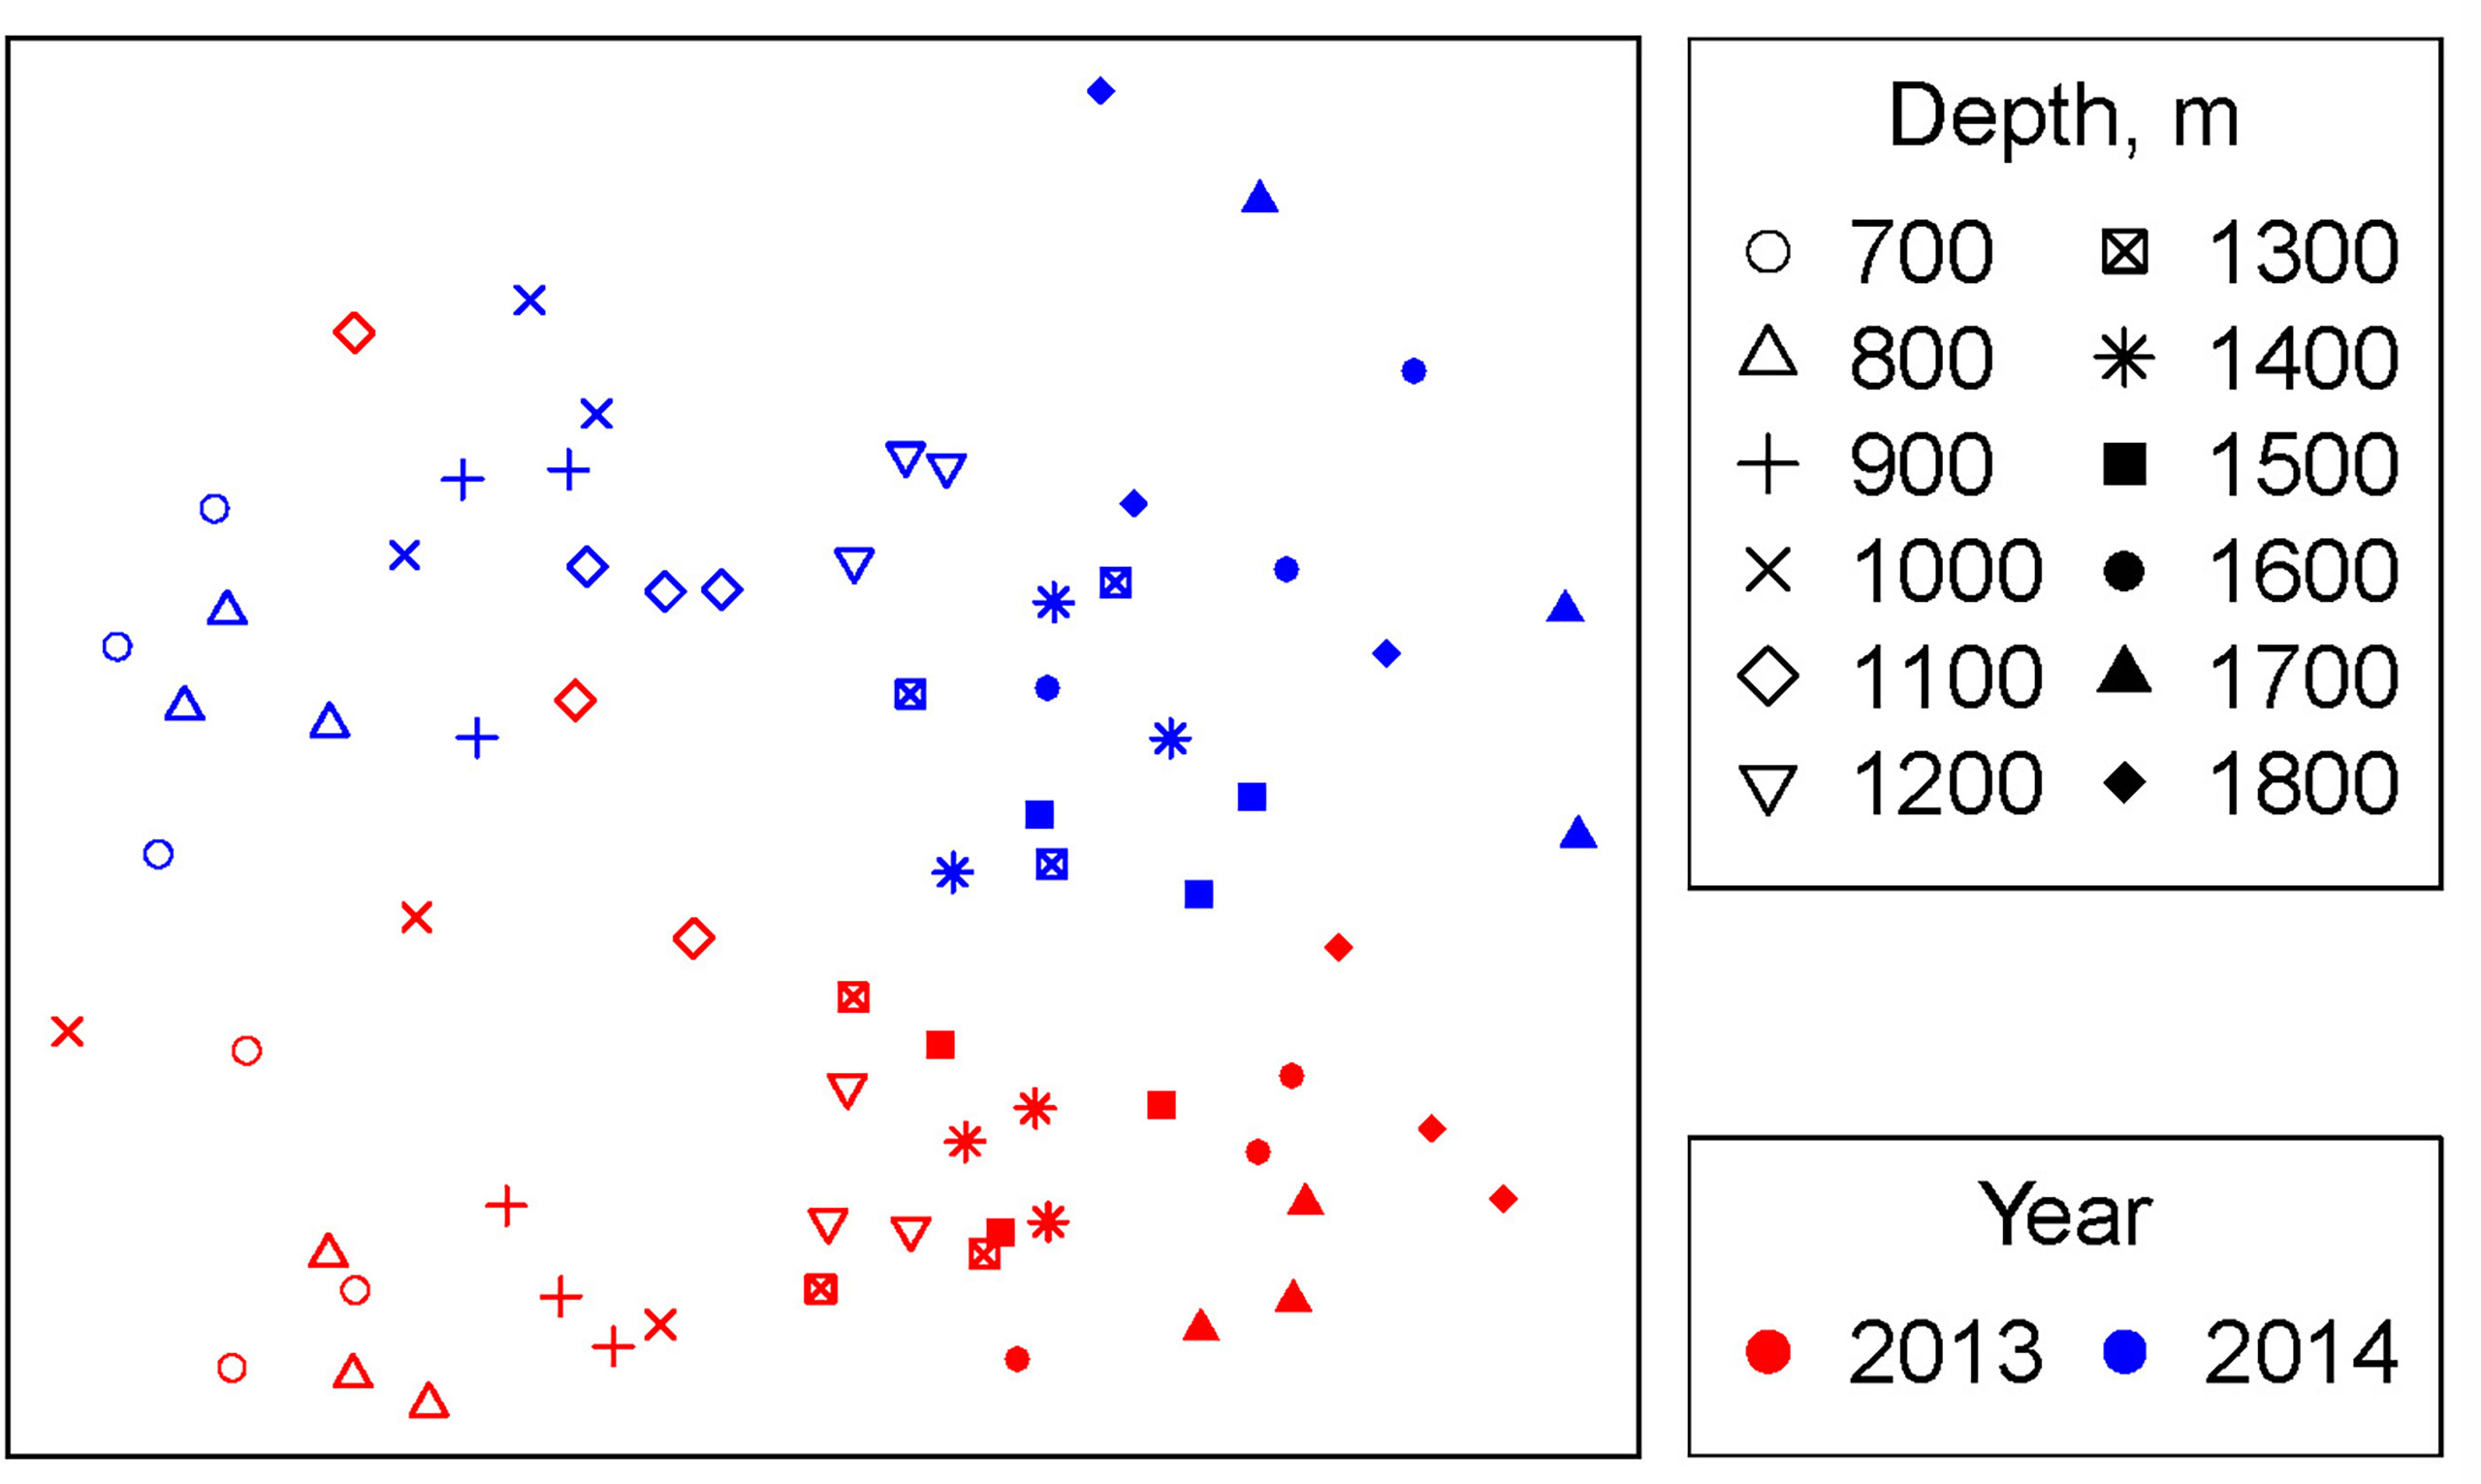
Figure 7 Non-metric multidimensional scaling ordination. MDS stress = 0.23.
Discussion
The introduction of a large pipeline structure into the deep-sea environment off Angola has likely resulted in changes in megabenthic communities, particularly at mid-slope depths. This is perhaps surprising as the pipeline had only been in place for three months. The effects of natural seasonal variability in benthic communities, as occur in fishes off Angola (Milligan et al., 2020), cannot be excluded. The pipeline appeared to cause elevated densities of many fauna, both at the broader scale (between surveys) and at a fine scale (more organisms were found nearer the pipe), which was a result of aggregations of motile fauna, potentially in response to the shelter provided or elevated organic material trapped by expected hydrodynamic changes induced by the pipeline. These hydrodynamic processes may have helped aggregate the fauna themselves, as likely occurred with the increased quantity of litter in 2014, although wide ranging movements are possible in many of the taxa observed (Miller and Pawson, 1990). Organic enrichment and faunal aggregation was also found associated with a pipeline on the margin of Ivory Coast (Lebrato and Jones, 2009), to the north of Angola. Despite the large geographic separation of > 2000 km between Ivory Coast and Angola, several similar morphospecies aggregated at the pipeline in both studies, notably the abundant Phormosoma sp. indet. echinoids (Lebrato and Jones, 2009). Benthic megafauna in the deep sea can respond rapidly to spatio-temporally variable food resources (Billett et al., 2001). There are also possible seasonal migrations of organisms in response to varying organic matter, as suggested for fishes very close to this site in Angola (Milligan et al., 2020). Some natural temporal variation in the fauna may be unrelated to the pipeline installation, but the only faunal time-series observations in this region show higher abundances of fishes in the austral summer (i.e. around the time of the pre-installation survey in December) than in the austral winter (at around the same time as the post-installation survey in May). This is the opposite trend to that observed in this study, possibly indicating that the elevations in density are happening in spite of natural variation rather than because of it.
There was little evidence of megafaunal colonisation on the pipeline. The few taxa found apparently attached to the pipeline are principally actiniarians, primarily of the genus Actinoscyphia. Some deep-sea actiniarians, including Actinoscyphia, are unattached and likely capable of movement to find optimal food resources (Aldred et al., 1979). Little recruitment would be expected in a three-month period. At a similar depth in the Pacific, introduced structures attracted new recruits of mostly meiofaunal taxa within weeks (Mullineaux, 1988). Even if new recruits were present, growth rates at comparable depths are typically too slow (Mercier et al., 2017; Girard et al., 2019) for individuals to reach a size that could be resolved in the ROV images in three months. It is also possible that recruitment would be higher on the hidden underside of the pipeline (where this was not covered in sediment) than the exposed top (Mullineaux, 1988), but that was not possible to detect in this study. The little available information on hard substrata on the Angolan margin shows a broad range of attached fauna and associated mobile fauna, with several species of mobile fauna common to this study (Le Guilloux et al., 2009; Jones et al., 2014).
The depth-related changes in megafaunal abundance, diversity and community composition observed here do not show any clear monotonic patterns, rather a mid-bathyal peak in abundance and possibly diversity, particularly in the 2014 survey. Depth-related patterns in the fauna of the Angolan margin appear to be typical, as in other areas (Carney, 2005), potentially related to transition zones between overlapping faunal components. The sediment-dwelling macrofauna in Angola show a similar mid-bathyal peak in abundance and species diversity (Cazes et al., 2012) to that found here. There was also high turnover with depth reported in the Angolan fishes, for example in Rajidae (Compagno and Ebert, 2009) and virtually no overlap (only the hagfish Myxine ios) in fishes collected at shallower below 800 m (277 species) (Tweddle and Anderson, 2008) compared to deeper (1297-2453 m) areas (Jamieson et al., 2017). Many of the fishes observed here, including the common Halosauridae, Macrouridae and Synaphobranchidae, appear to correspond to those found in these studies, but lack of species-level identification here prevents full comparison. Unlike for the other groups investigated, scavenging amphipods showed no clear difference with depth on the Angolan Margin (Duffy et al., 2016).
In conclusion, this study demonstrates that the installation of a pipeline may cause considerable changes in the fauna in some areas of the continental slope. These changes are very depth dependent and likely depend on both the nature of the community and the potential for trapping of organic matter by the pipeline. It is likely that the results presented here are only an early stage in a succession of ecological change resulting from installation of a pipeline in deep water, with later stages largely unknown. The sediment underlying the pipeline here was soft sediment and it is unknown if there were any disturbance related effects. In many areas, including deep-water areas, the damage of the seafloor created by pipeline installation may lead to more complex and more negative effects than observed here. The results presented here may provide some useful information for environmental managers assessing the potential impacts of pipeline installation and for those assessing the potential mitigation or restoration value of introducing structures into the deep sea. The complex ecological responses and dependency on the community and environmental conditions present suggest careful ecological assessment is needed to inform environmental management decisions.
Data Availability Statement
The original contributions presented in the study are included in the article/Supplementary Material. Further inquiries can be directed to the corresponding author.
Author Contributions
DJ and AG conceived the study and developed the approach. VB analysed video with the help of AG, SP, CS, JC and DJ. SP, DJ and CS helped identify megafauna. DJ and VB carried out data analysis. DJ wrote the original draft of this paper based on thesis written by VB and JC. All authors contributed to the article and approved the submitted version.
Funding
This project was supported through the European Union’s Horizon 2020 Research and Innovation Program under the MERCES (Marine Ecosystem Restoration in Changing European Seas) project, grant agreement no. 689518. This work was also supported by the United Kingdom Natural Environment Research Council (NERC) grant “Advanced monitoring of marine infrastructure for decommissioning” reference NE/P016561/1, “Sustained Autonomous Monitoring of Offshore Oil and Gas” reference NE/S009426/1 and the NERC National Capability funding to the National Oceanography Centre, as part of the Climate Linked Atlantic Section Science (CLASS) program (Grant Number NE/R015953/1). SP was supported by the United Kingdom Natural Environmental Research Council (grant number NE/L002531/1), and a CASE studentship ‘Collaborative Awards in Science and Engineering’ with BP.
Conflict of Interest
The authors declare that the research was conducted in the absence of any commercial or financial relationships that could be construed as a potential conflict of interest.
Publisher’s Note
All claims expressed in this article are solely those of the authors and do not necessarily represent those of their affiliated organizations, or those of the publisher, the editors and the reviewers. Any product that may be evaluated in this article, or claim that may be made by its manufacturer, is not guaranteed or endorsed by the publisher.
Acknowledgments
We thank BP Angola for providing access to these data. We also thank Subsea 7 for facilitating access to data. The authors would like to thank Dr Mike Clare at the National Oceanography Centre for valuable discussions on the environment of the region.
Supplementary Material
The Supplementary Material for this article can be found online at: https://www.frontiersin.org/articles/10.3389/fmars.2022.880453/full#supplementary-material
References
Aldred R. G., Riemann-Zurneck K., Thiel H., Rice A. L. (1979). Ecological Observations on the Deep Sea Anemone Actinoscyphia Aurelia. Oceanolog. Acta. 2, 389–395.
Arbizu P. M., Schminke H. K. (2005). DIVA-1 Expedition to the Deep Sea of the Angola Basin in 2000 and DIVA-1 Workshop in 2003. Org. Divers. Evol. 5 (Supplement 1), 1–2. doi: 10.1016/j.ode.2004.11.009
Azpiroz-Zabala M., Cartigny M. J. B., Talling P. J., Parsons D. R., Sumner E. J., Clare M. A., et al. (2017). Newly Recognized Turbidity Current Structure can Explain Prolonged Flushing of Submarine Canyons. Sci. Adv. 3 (10), e1700200. doi: 10.1126/sciadv.1700200
Behrenfeld M. J., Falkowski P. G. (1997). Photosynthetic Rates Derived From Satellite-Based Chlorophyll Concentration. Limnol. Oceanogr. 42 (1), 1–20. doi: 10.4319/lo.1997.42.1.0001
Bell N., Smith J. (1999). Coral Growing on North Sea Oil Rigs. Nature 402 (6762), 601–601. doi: 10.1038/45127
Bianchi G. (1992). Demersal Assemblages of the Continental-Shelf and Upper Slope of Angola. Marine Ecol-Progress Ser. 81 (2), 101–120. doi: 10.3354/meps081101
Billett D. S. M., Bett B. J., Rice A. L., Thurston M. H., Galeron J., Sibuet M., et al. (2001). Long-Term Change in the Megabenthos of the Porcupine Abyssal Plain (NE Atlantic). Prog. Oceanogr. 50, 325–348. doi: 10.1016/S0079-6611(01)00060-X
Bond T., Langlois T. J., Partridge J. C., Birt M. J., Malseed B. E., Smith L., et al. (2018a). Diel Shifts and Habitat Associations of Fish Assemblages on a Subsea Pipeline. Fish Res. 206, 220–234. doi: 10.1016/j.fishres.2018.05.011
Bond T., Partridge J. C., Taylor M. D., Cooper T. F., McLean D. L. (2018b). The Influence of Depth and a Subsea Pipeline on Fish Assemblages and Commercially Fished Species. PLos One 13 (11), e0207703. doi: 10.1371/journal.pone.0207703
Carney R. S. (2005). Zonation of Deep Biota on Continental Margins. Oceanogr. Marine Biol. Annu. Rev. 43, 211–278. doi: 10.1201/9781420037449.ch6
Cazes L., Plisson-Saune S., Canovas S., Bamber R., Robbins R. (2012). “Angola Biodiversity of Bathyal Sea Bottoms,” in International Conference on Health, Safety and Environment in Oil and Gas Exploration and Production, September 2012. (Perth, Australia: Society of Petroleum Engineers), 11–13.
Chao A., Chiu C.-H., Jost L. (2014). Unifying Species Diversity, Phylogenetic Diversity, Functional Diversity, and Related Similarity and Differentiation Measures Through Hill Numbers. Annu. Rev. Ecol. Evol. Syst. 45 (1), 297–324. doi: 10.1146/annurev-ecolsys-120213-091540
Claisse J. T., Pondella D. J., Love M., Zahn L. A., Williams C. M., Williams J. P., et al. (2014). Oil Platforms Off California are Among the Most Productive Marine Fish Habitats Globally. Proc. Natl. Acad. Sci. 111 (43), 15462–15467. doi: 10.1073/pnas.1411477111
Compagno L. J. V., Ebert D. A. (2009). “Southern African Skate Biodiversity and Distribution,” in Biology of Skates. Eds. Ebert D. A., Sulikowski J. A. (Dordrecht: Springer Netherlands), 19–39.
Cordes E., Jones D., Schlacher T., Amon D., Bernardino A., Brooke S., et al. (2016). Environmental Impacts of the Deep-Water Oil and Gas Industry: A Review to Guide Management Strategies. Front. Environ. Sci. 4(58). doi: 10.3389/fenvs.2016.00058
Cuvelier D., Gollner S., Jones D. O. B., Kaiser S., Arbizu P. M., Menzel L., et al. (2018). Potential Mitigation and Restoration Actions in Ecosystems Impacted by Seabed Mining. Front. Marine Sci. 5, 467. doi: 10.3389/fmars.2018.00467
de Groot S. J. (1982). The Impact of Laying and Maintenance of Offshore Pipelines on the Marine Environment and the North Sea Fisheries. Ocean Manage. 8 (1), 1. doi: 10.1016/0302-184X(82)90011-7
Dobson A. J., Barnett A. G. (2008). An Introduction to Generalized Linear Models. London: Chapman & Hall.
Droz L., Marsset T., Ondréas H., Lopez M., Savoye B., Spy-Anderson F.-L. (2003). Architecture of an Active Mud-Rich Turbidite System: The Zaire Fan (Congo–Angola Margin Southeast Atlantic). Aapg Bull. 87 (7), 1145–1168. doi: 10.1306/03070300013
Duffy G. A., Lawler S. F., Horton T. (2016). Scavenging Amphipods of the Angolan Deep-Sea Habitat, With a Focus on (Birstein and Vinogradov 1960) (Amphipoda: Lysianassoidea). J. Crustacean Biol. 36 (4), 417–426. doi: 10.1163/1937240X-00002448
Durden J. M., Schoening T., Althaus F., Friedman A., Garcia R., Glover A., et al. (2016). Perspectives in Visual Imaging for Marine Biology and Ecology: From Acquisition to Understanding. Oceanogr Marine Biol: Annu. Rev. 54, 1–72. doi: 10.1201/9781315368597-2
Fowler A. M., Jørgensen A.-M., Svendsen J. C., Macreadie P. I., Jones D. O. B., Boon A. R., et al. (2018). Environmental Benefits of Leaving Offshore Infrastructure in the Ocean. Front. Ecol. Environ. 16 (10), 571–578. doi: 10.1002/fee.1827
Fox J., Weisberg S. (2011). An {R} Companion to Applied Regression. Second Edition. Thousand Oaks CA: Sage.
Freund R. J., Littell R. C. (1981). SAS for Linear Models: A Guide to the ANOVA and GLM Procedures. Cary, North Carolina: Sas Institute.
Fujii T. (2015). Temporal Variation in Environmental Conditions and the Structure of Fish Assemblages Around an Offshore Oil Platform in the North Sea. Marine Environ. Res. 108, 69–82. doi: 10.1016/j.marenvres.2015.03.013
Galéron J., Menot L., Renaud N., Crassous P., Khripounoff A., Treignier C., et al. (2009). Spatial and Temporal Patterns of Benthic Macrofaunal Communities on the Deep Continental Margin in the Gulf of Guinea. Deep Sea Res. Part II: Topical Stud. Oceanogr 56 (23), 2299–2312. doi: 10.1016/j.dsr2.2009.04.011
Gardner W., Mulvey E. P., Shaw E. C. (1995). Regression Analyses of Counts and Rates: Poisson, Overdispersed Poisson, and Negative Binomial Models. psychol. Bull. 118 (3), 392–404. doi: 10.1037/0033-2909.118.3.392
Gates A. R., Horton T., Serpell-Stevens A., Chandler C., Grange L. J., Robert K., et al. (2019). Ecological Role of an Offshore Industry Artificial Structure. Front. Marine Sci. 6. doi: 10.3389/fmars.2019.00675
Gianni F., Bartolini F., Airoldi L., Ballesteros E., Francour P., Guidetti P., et al. (2013). Conservation and Restoration of Marine Forests in the Mediterranean Sea and the Potential Role of Marine Protected Areas. Adv. Oceanogr Limnol 4 (2), 83–101. doi: 10.4081/aiol.2013.5338
Girard F., Cruz R., Glickman O., Harpster T., Fisher C. R. (2019). In Situ Growth of Deep-Sea Octocorals After the Deepwater Horizon Oil Spill. Elementa: Sci. Anthropocene 7, 12. doi: 10.1525/elementa.349
Henry L. A., Mayorga-Adame C. G., Fox A. D., Polton J. A., Ferris J. S., McLellan F., et al. (2018). Ocean Sprawl Facilitates Dispersal and Connectivity of Protected Species. Sci. Rep 8, 11346. doi: 10.1038/s41598-018-29575-4
Hill M. O. (1973). Diversity and Evenness: A Unifying Notation and Its Consequences. Ecology 54 (2), 427–432. doi: 10.2307/1934352
Hill A. J., Southgate J. G., Fish P. R., Thomas S. (2010). “Deepwater Angola Part I,” in Frontiers in Offshore Geotechnics II. Eds. Gourvenec S., White D. (London: CRC Press), 209–214.
Horton T., Kroh A., Ahyong S., Bailly N., Boyko C. B., Brandão S. N., et al. (2019). World Register of Marine Species (WoRMS). WoRMS Editorial Board. Accessed 2022-05-23. doi: 10.14284/170
Horton T., Kroh A., Ahyong S., Bailly N., Boyko C. B., Brandão S. N., et al. World Register of Marine Species. Available at: https://www.marinespecies.org at VLIZ. (Accessed 2022-05-23).
Jamieson A. J., Linley T. D., Craig J. (2017). Baited Camera Survey of Deep-Sea Demersal Fishes of the West African Oil Provinces Off Angola: 1200-2500m Depth, East Atlantic Ocean. Mar Environ. Res. 129, 347–364. doi: 10.1016/j.marenvres.2017.05.009
Jones D. O. B., Hudson I. R., Bett B. J. (2006). Effects of Physical Disturbance on the Cold-Water Megafaunal Communities of the Faroe-Shetland Channel. Marine Ecol. Prog. Ser. 319, 43–54. doi: 10.3354/meps319043
Jones D. O. B., Walls A., Clare M., Fiske M. S., Weiland R. J., O’Brien R., et al. (2014). Asphalt Mounds and Associated Biota on the Angolan Margin. Deep Sea Res. Part I: Oceanographic Res. Papers 94, 124–136. doi: 10.1016/j.dsr.2014.08.010
Jost L. (2006). Entropy and Diversity. Oikos 113 (2), 363–375. doi: 10.1111/j.2006.0030-1299.14714.x
Kröncke I., Turkay M. (2003). Structural and Functional Aspects of the Benthic Communities in the Deep Angola Basin. Marine Ecol. Prog. Ser. 260, 43–53. doi: 10.3354/meps260043
Lebrato M., Jones D. O. B. (2009). Mass Deposition Event of Pyrosoma Atlanticum Carcasses Off Ivory Coast (West Africa). Limnol. Oceanogr. 54 (4), 1197–1209. doi: 10.4319/lo.2009.54.4.1197
Le Guilloux E., Olu K., Bourillet J. F., Savoye B., Iglésias S. P., Sibuet M. (2009). First Observations of Deep-Sea Coral Reefs Along the Angola Margin. Deep Sea Res. Part II: Topical Stud. Oceanogr. 56 (23), 2394–2403. doi: 10.1016/j.dsr2.2009.04.014
Lewis L. J., Davenport J., Kelly T. C. (2002). A Study of the Impact of a Pipeline Construction on Estuarine Benthic Invertebrate Communities. Estuar Coastal Shelf Sci. 55 (2), 213–221. doi: 10.1006/ecss.2001.0898
Love M. S., Schroeder D. M., Lenarz W., MacCall A., Bull A. S., Thorsteinson L. (2006). Potential Use of Offshore Marine Structures in Rebuilding an Overfished Rockfish Species, Bocaccio (Sebastes Paucispinis). Fish Bull. 104 (3), 383–390.
Love M. S., York A. (2005). A Comparison of the Fish Assemblages Associated With an Oil/Gas Pipeline and Adjacent Seafloor in the Santa Barbara Channel, Southern California Bight. Bull. Marine Sci. 77 (1), 101–117.
Macreadie P. I., McLean D. L., Thomson P. G., Partridge J. C., Jones D. O. B., Gates A. R., et al. (2018). Eyes in the Sea: Unlocking the Mysteries of the Ocean Using Industrial, Remotely Operated Vehicles (ROVs). Sci. Total Environ. 634, 1077–1091. doi: 10.1016/j.scitotenv.2018.04.049
McClain C. R., Allen A. P., Tittensor D. P., Rex M. A. (2012). Energetics of Life on the Deep Seafloor. Proc. Natl. Acad. Sci. 109 (38), 15366–15371. doi: 10.1073/pnas.1208976109
McLean D. L., Partridge J. C., Bond T., Birt M. J., Bornt K. R., Langlois T. J. (2017). Using Industry ROV Videos to Assess Fish Associations With Subsea Pipelines. Continental Shelf Res. 141 (Supplement C), 76–97. doi: 10.1016/j.csr.2017.05.006
Mercier A., Baillon S., Daly M., Macrander J., Hamel J.-F. (2017). Biology of a Deep-Water Sea Anemone (Anthozoa: Actiniidae) From Eastern Canada: Spawning, Development, and Growth. Deep Sea Res. Part II: Topical Stud. Oceanogr. 137, 359–367. doi: 10.1016/j.dsr2.2016.01.006
Miller J. E., Pawson D. L. (1990). Swimming Sea Cucumbers (Echinodermata: Holothuroidea): A Survey, With Analysis of Swimming Behavior in Four Bathyal Species. Smithsonian Contributions to Marine Sci. 35, 1–18. doi: 10.5479/si.01960768.35.1
Milligan R. J., Scott E. M., Jones D. O. B., Bett B. J., Jamieson A. J., O’Brien R., et al. (2020). Evidence for Seasonal Cycles in Deep-Sea Fish Abundances: A Great Migration in the Deep SE Atlantic? J. Anim. Ecol. 89 (7), 1593–1603. doi: 10.1111/1365-2656.13215
Mugge R. L., Brock M. L., Salerno J. L., Damour M., Church R. A., Lee J. S., et al. (2019). Deep-Sea Biofilms, Historic Shipwreck Preservation and the Deepwater Horizon Spill. Front. Marine Sci. 6 (48). doi: 10.3389/fmars.2019.00048
Mullineaux L. S. (1988). The Role of Settlement in Structuring a Hard-Substratum Community in the Deep Sea. J. Exp. Marine Biol. Ecol. 120 (3), 247–261. doi: 10.1016/0022-0981(88)90005-6
Oksanen J., Blanchet F. G., Kindt R., Legendre P., O'Hara R. B., Simpson G. L., et al. (2019). “Vegan: Community Ecology Package,” in R Package Version 2.5-6. Available at: http://CRAN.R-project.org/package=vegan.
Pfeifer S. (2021). Megabenthic Ecology of the Angolan Continental Slope. PhD Thesis. Southampton: University of Southampton.
Rabouille C., Olu K., Baudin F., Khripounoff A., Dennielou B., Arnaud-Haond S., et al. (2017). The Congolobe Project, a Multidisciplinary Study of Congo Deep-Sea Fan Lobe Complex: Overview of Methods, Strategies, Observations and Sampling. Deep Sea Res. Part II: Topical Stud. Oceanogr 142, 7–24. doi: 10.1016/j.dsr2.2016.05.006
R Core Team (2020). R: A Language and Environment for Statistical Computing (Vienna, Austria: R Foundation for Statistical Computing).
Rinkevich B. (2014). Rebuilding Coral Reefs: Does Active Reef Restoration Lead to Sustainable Reefs? Curr. Opin. Environ. Sustainability 7, 28–36. doi: 10.1016/j.cosust.2013.11.018
Savoye B., Babonneau N., Dennielou B., Bez M. (2009). Geological Overview of the Angola–Congo Margin, the Congo Deep-Sea Fan and its Submarine Valleys. Deep Sea Res. Part II: Topical Stud. Oceanogr 56 (23), 2169–2182. doi: 10.1016/j.dsr2.2009.04.001
Schneider R. R., Müller P. J., Wefer G. (1994). Late Quaternary Paleoproductivity Changes Off the Congo Deduced From Stable Carbon Isotopes of Planktonic Foraminifera. Palaeogeogr Palaeoclimatol Palaeoecol. 110 (3), 255–274. doi: 10.1016/0031-0182(94)90087-6
Sen A., Dennielou B., Tourolle J., Arnaubec A., Rabouille C., Olu K. (2017). Fauna and Habitat Types Driven by Turbidity Currents in the Lobe Complex of the Congo Deep-Sea Fan. Deep Sea Res. Part II: Topical Stud. Oceanogr. 142, 167–179. doi: 10.1016/j.dsr2.2017.05.009
Sibuet M., Lambert C. E., Chesselet R., Laubier L. (1989). Density of the Major Size Groups of Benthic Fauna and Trophic Input in Deep Basins of the Atlantic Ocean. J. Marine Res. 47 (4), 851–867. doi: 10.1357/002224089785076064
Sibuet M., Olu-LeRoy K. (2002). “Cold Seep Communities on Continental Margins: Structure and Quantitative Distribution Relative to Geological and Fluid Venting Patterns,” in Ocean Margin Systems. Eds. Wefer G., Hebbeln D., Jorgensen B. B., Van Weering T. (Berlin: Springer), 235–251.
Sibuet M., Vangriesheim A. (2009). Deep-Sea Environment and Biodiversity of the West African Equatorial Margin. Deep Sea Res. Part II: Topical Stud. Oceanogr. 56 (23), 2156–2168. doi: 10.1016/j.dsr2.2009.04.015
Sigovini M., Keppel E., Tagliapietra D. (2016). Open Nomenclature in the Biodiversity Era. Methods Ecol. Evol. 7 (10), 1217–1225. doi: 10.1111/2041-210X.12594
Snelgrove P. V. R., Grassle J. F., Petrecca R. F. (1992). The Role of Food Patches in Maintaining High Deep-Sea Diversity - Field Experiments With Hydrodynamically Unbiased Colonization Trays. Limnol Oceanogr. 37 (7), 1543–1550. doi: 10.4319/lo.1992.37.7.1543
Todd V. L. G., Warley J. C., Todd I. B. (2016). Meals on Wheels? A Decade of Megafaunal Visual and Acoustic Observations From Offshore Oil & Gas Rigs and Platforms in the North and Irish Seas. PLos One 11 (4), e0153320. doi: 10.1371/journal.pone.0153320
Todd V. L. G., Williamson L. D., Cox S. E., Todd I. B., Macreadie P. I. (2019). Characterizing the First Wave of Fish and Invertebrate Colonization on a New Offshore Petroleum Platform. ICES J. Marine Sci. 77 (3), 1127–1136. doi: 10.1093/icesjms/fsz077
Tweddle D., Anderson M. E. (2008). A Collection of Marine Fishes From Angola, With Notes on New Distribution Records. Smithiana Bull. 8, 3–24.
van Bennekom A. J., Berger G. W. (1984). Hydrography and Silica Budget of the Angola Basin. Netherlands J. Sea Res. 17, 149–200. doi: 10.1016/0077-7579(84)90047-4
Van Gaever S., Galéron J., Sibuet M., Vanreusel A. (2009). Deep-Sea Habitat Heterogeneity Influence on Meiofaunal Communities in the Gulf of Guinea. Deep Sea Res. Part II: Topical Stud. Oceanogr 56 (23), 2259–2269. doi: 10.1016/j.dsr2.2009.04.008
Vangriesheim A., Pierre C., Aminot A., Metzl N., Baurand F., Caprais J.-C. (2009). The Influence of Congo River Discharges in the Surface and Deep Layers of the Gulf of Guinea. Deep Sea Res. Part II: Topical Stud. Oceanogr. 56 (23), 2183–2196. doi: 10.1016/j.dsr2.2009.04.002
Vardaro M. F., Bagley P. M., Bailey D. M., Bett B. J., Jones D. O. B., Milligan R. J., et al. (2013). A Southeast Atlantic Deep-Ocean Observatory: First Experiences and Results. Limnol. Oceanogr-Methods 11, 304–315. doi: 10.4319/lom.2013.11.304
Vinogradov G. M. (2000). Growth Rate of the Colony of a Deep-Water Gorgonarian Chrysogorgia Agassizi: In Situ Observations. Ophelia 53 (2), 101–103. doi: 10.1080/00785236.2000.10409439
Vinogradova N. G., Galkin S. W., Kamenskaja O. E., Levenstein R. Y., Romanov V. N. (1990). The Distribution of the Deep Sea Bottom Fauna in the Transoceanic Section in the South Atlantic Ocean Along 31° 30’. Trans. P. P. Shirshov. Inst. Oceanol. 126, 7–19.
Walles B., Troost K., van den Ende D., Nieuwhof S., Smaal A. C., Ysebaert T. (2016). From Artificial Structures to Self-Sustaining Oyster Reefs. J. Sea Res. 108, 1–9. doi: 10.1016/j.seares.2015.11.007
Walls A. H., Clarke J., Bagley P. M., Bazika Sangolay B. (2010). Deepwater Environmental Long-Term Observatory System (DELOS). Soc. Petroleum Engineers J., 126642. doi: 10.2118/126642-MS
Keywords: deep-sea, benthic, succession, colonisation, oil and gas, West Africa, artificial structures, marine litter
Citation: Biede V, Gates AR, Pfeifer S, Collins JE, Santos C and Jones DOB (2022) Short-Term Response of Deep-Water Benthic Megafauna to Installation of a Pipeline Over a Depth Gradient on the Angolan Slope. Front. Mar. Sci. 9:880453. doi: 10.3389/fmars.2022.880453
Received: 21 February 2022; Accepted: 11 May 2022;
Published: 14 June 2022.
Edited by:
Toyonobu Fujii, Tohoku University, JapanReviewed by:
Sarah Henkel, Oregon State University, United StatesDianne McLean, Australian Institute of Marine Science (AIMS), Australia
Lene Buhl-Mortensen, Norwegian Institute of Marine Research (IMR), Norway
Copyright © 2022 Biede, Gates, Pfeifer, Collins, Santos and Jones. This is an open-access article distributed under the terms of the Creative Commons Attribution License (CC BY). The use, distribution or reproduction in other forums is permitted, provided the original author(s) and the copyright owner(s) are credited and that the original publication in this journal is cited, in accordance with accepted academic practice. No use, distribution or reproduction is permitted which does not comply with these terms.
*Correspondence: Daniel O. B. Jones, ZGoxQG5vYy5hYy51aw==